
A Self-Supervised Detail-Sensitive ViT-Based Model for COVID-19 X-ray Image Diagnosis: SDViT


1
Qianjinag College, Hangzhou Normal University, Hangzhou 311121, China
2
Department of Computer Science, Gonzaga University, 502 E Boone Ave, Spokane, WA 99258, USA
*
Author to whom correspondence should be addressed.
Appl. Sci. 2023, 13(1), 454; https://0-doi-org.brum.beds.ac.uk/10.3390/app13010454
Submission received: 4 November 2022
/
Revised: 23 December 2022
/
Accepted: 24 December 2022
/
Published: 29 December 2022
(This article belongs to the Special Issue Applications of Artificial Intelligence in Medical Imaging)
Abstract
:COVID-19 has led to a severe impact on the society and healthcare system, with early diagnosis and effective treatment becoming critical. The Chest X-ray (CXR) is the most time-saving and cost-effective tool for diagnosing COVID-19. However, manual diagnosis through human eyes is time-consuming and tends to introduce errors. With the challenge of a large number of infections and a shortage of medical resources, a fast and accurate diagnosis technique is required. Manual detection is time-consuming, depends on individual experience, and tends to easily introduce errors. Deep learning methods can be used to develop automated detection and computer-aided diagnosis. However, they require a large amount of data, which is not practical due to the limited annotated CXR images. In this research, SDViT, an approach based on transformers, is proposed for COVID-19 diagnosis through image classification. We propose three innovations, namely, self-supervised learning, detail correction path (DCP), and domain transfer, then add them to the ViT Transformer architecture. Based on experimental results, our proposed method achieves an accuracy of 95.2381%, which is better performance compared to well-established methods on the X-ray Image dataset, along with the highest precision (0.952310), recall (0.963964), and F1-score (0.958102). Extensive experiments show that our model achieves the best performance on the synthetic-covid-cxr dataset as well. The experimental results demonstrate the advantages of our design for the classification task of COVID-19 X-ray images.
1. Introduction
During the past several years, COVID-19 has led to severe infections all over the world and brought tremendous challenges to medical and healthcare services. Vaccines can effectively prevent the spread of the coronavirus. Meanwhile, early diagnosis and effective treatment are critical for recovery from COVID-19. The Chest X-ray (CXR) is a reliable and cost-effective method for diagnosing COVID-19. CXRs of patients with COVID-19 symptoms show a combination of different multifocal lung clouding patterns. In addition, these patterns tend to spread to other parts of the lung parenchyma during the course of the disease, though the initial distribution is usually peripheral to the lung. Early and accurate diagnosis of mild and moderate COVID-19 from CXR can be challenging even for experienced radiologists. With the challenge of a large number of infections and a shortage of medical personnel, the need for a fast and accurate diagnosis technique is urgent.
Image classification tasks face many challenges, including human mistake error. A typical case is the popular ImageNet [1] dataset classification task, where existing models have outperformed human classification results. COVID-19 threatens people’s physical health and brings mental illnesses. People’s activity on social media could help to understand their psychology and mental health status during COVID-19. Mental health complications related to COVID-19 were studied in [2], with people’s sentiments analyzed based on classification of tweets collected from Twitter in Nepal. Three different feature extraction methods (fastText-based (ft), domain-specific (ds), and domain-agnostic (da)) were used to the represent these tweets. Three different convolution neural networks (CNNs) were proposed to implement the proposed features. Then, the ensemble CNN was used to combine the three CNNs for the end results. In the designed experiments in [2], these CNN models demonstrated stable and robust performance. The feature extraction methods proved effective for sentiment classification based on the discriminating characteristics. The diversity of the dataset, along with greyscale X-ray images with only one informational difference, presents huge challenges to human classification. Therefore, automated detection methods such as computer-aided diagnosis techniques have attracted increasing attention. In particular, deep learning-based detection methods have been used for image classification in an effort to achieve fast and accurate classification. However, public access to annotated CXR images is limited, which presents challenges to detection based on deep learning methods.
Our research proposes a Transformer-based model, SDViT, for COVID-19 diagnosis through X-ray image classification. Our design has demonstrated its advantage in experiments.
Our SDViT design outperforms the current state-of-the-art models for COVID-19 CXR image classification. The following are our main contributions:
- 1.
- In our model, we propose a self-supervised strategy that allows the model to repair ambiguous and defective parts using information from other parts. We add this design to address the issue of the COVID-19 dataset being relatively small, as well as to drive full learning of intrinsic features instead of focusing only on the final classification results. This approach can improve understanding of the intrinsic logic and enhance the robustness of the model.
- 2.
- We use the MagNet model to migrate the data distribution, allowing the practice and training data to be compared more closely.
- 3.
- We propose a new structure, the Detail Correction Path, to repair the possible loss of original key features caused by MagNet. The DCP passes the original details to the location after MagNet transformation, preserving relevant information for the classification task.
- 4.
- We modify the original ViT structure for data features and combine different strategies to obtain our SDViT model. We have open-sourced our code at https://github.com/ankang1115/SDVIT (accessed on 21 December 2022) for public access.
2. Related Work
The Transformer [3] method was originally designed for natural language processing (NLP). With the efforts of scientists and researchers from different fields, the Transformer model has been widely applied to various tasks and produced outstanding results. Multiple variations have been designed to improve performance on different tasks, including Bert [4], ALBERT [5], and RoBERTa [6].
Transformer-based models have also been applied to computer vision tasks, which require unique designs for specific tasks. By making adjustments to the way in which data are handled, the Transformer model can be applied to extended fields, for example, DETR [7] for object identification and SETR [8] for semantic segmentation. The success of the Transformer model in these tasks demonstrates that it is applicable to image classification tasks. It can efficiently capture the crucial semantic information in the image and combine it to classify the target.
With the growing demand for medical care, efforts are being made to effectively diagnose issues from medical images by fusing computer vision technologies with medical services. ViT [9] and DeiT [10] can be used for medical diagnosis to solve the most fundamental and pertinent image classification problems in computer vision. In order to further improve the accuracy of diagnosis in the medical field, deep learning technologies can be used for technological innovation in areas such as tumor detection [11], medical image semantic segmentation [12], and other model tasks [13].
In 2021, MSRA proposed the Swin Transformer [14] model. It significantly improves the outcomes of the ViT family for classification, segmentation, and detection tasks. However, due to its arithmetical power limitations, window-based self-attention is used to reduce computational consumption. This reflects an issue with ViT, which consumes a lot of computational resources even though the Transformer structure is very efficient. Additional model optimization is necessary in order to lower the computational consumption.
With the wide spread of COVID-19, it is essential to create an appropriate recognition model. In [15], a novel attention-based deep learning model was proposed using an attention module with VGG-16. This approach was able to capture the spatial relationship between the regions of interest (ROI) in CXR images. A novel deep-learning model was defined for the classification process to specifically perform fine-tuning. The experimental results indicated that this method is efficient in both classification accuracy and training parameters. In [16], CovidDetNet, a novel deep learning-based approach, was proposed for the automatic and reliable diagnosis of COVID-19 using chest radiographs. It has ten learnable layers, nine of which are convolutional layers, along with a fully-connected layer. The novelty of this model is that it uses two activation functions (the ReLu activation function and the Leaky Relu activation function) and two normalization operations (batch normalization and cross channel normalization). Through experiments on a standard COVID-19 radiography database, the model was shown to be superior to existing models, and outperformed the baseline models. However, in the field of medical imaging there is no pneumonia classification model specifically created for X-ray images. Because COVID-19 is a very recent disease, the research on it has not been not systematic. In addition, the related datasets are limited, which necessitates exploring the intrinsic linkages of the data as much as possible in order to obtain an accurate diagnosis. Table 1 highlights the contributions along with the pros and cons of prior studies.
3. Methods
In this paper, we propose a COVID-19 detection model called SDViT: Self-supervised Detail-sensitive ViT. As shown in Figure 1, our model is achieved by adding three innovations to ViT: a detail correction path, domain transfer, and a self-supervised learning method. Our model substantially improves the classification performance.
We adopt the strategy of domain transfer to eliminate the gap between the training and test data. This helps the model to learn more general features and discriminative models. Through the Detail Correction Path (DCP) structure, we transfer the critical details to the later position of the model in order to recover any damage of the original semantic information caused by domain transfer. To further drive the model towards adapting to the practical scenario, SVD and salt-and-pepper noise are used to simulate the noise encountered in practice, which makes the model more robust and helps it to learn how features are correlated.
The blocks with the same color are the same structure in the actual network, only appearing several times for the visualization effect.
3.1. Transformer
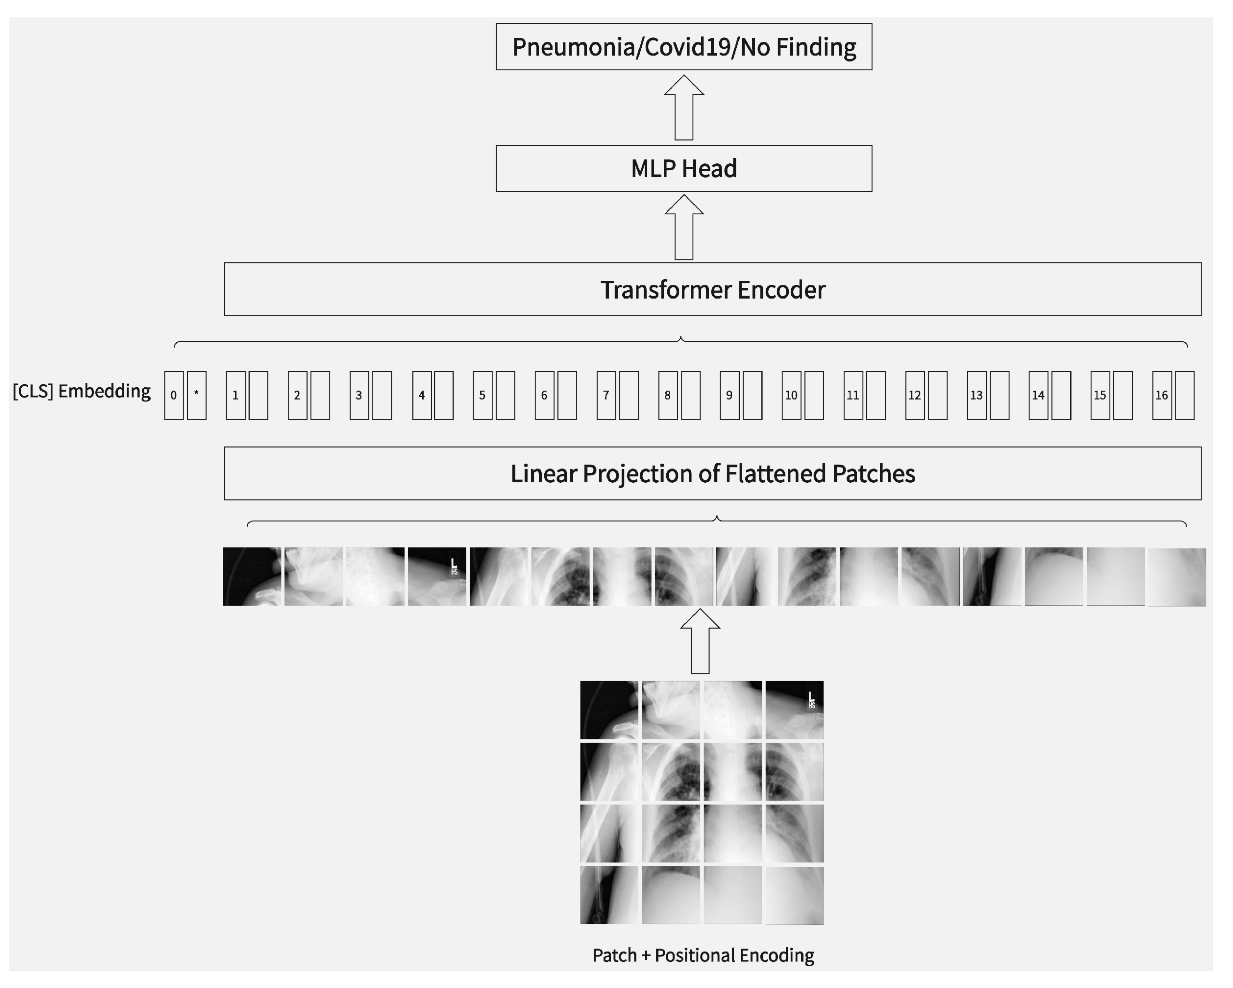
The Transformer architecture was proposed by the Google team in 2017. Originally applied to natural language processing (NLP) tasks, the Transformer has demonstrated its effectiveness and significantly improved the metrics of several NLP tasks. Figure 2 shows the ViT architecture with datasets.
There are two main components of the Transformer architecture, the Encoder and Decoder, each of which contains six blocks.
3.1.1. Encoder Module
There are two main steps in the encoder module. Step 1: For each word in the input sentence, obtain its representation vector x. The vector is obtained by adding the word’s embedding (an original data feature) and the word’s embedding position. Step 2: Obtain the encoding information matrix C for all the words in the sentence by passing the word representation vector matrix through the encoder for six encoder blocks.
3.1.2. Decoder Module
Residual Connectivity: ResNet frequently makes use of a residual connection, which enables the network to concentrate only on the current aspect of the difference; multi-layer networks are commonly trained using ResNet.
Feed Forward: Relu serves as the activation function in the first layer of the feed-forward layer, which is a straightforward two-layer fully-connected layer. In the second layer, there is no activation function.
3.1.3. Transformer’s Input
In the Transformer model, a word’s input representation x is obtained by adding both the positional embedding (Positional Encoding) and the word embedding. The input representation x of a word in the Transformer is obtained by adding the word embedding and the positional embedding (Positional Encoding).
Word Embedding: Word embedding can be obtained in various ways, e.g., pre-training by Word2Vec or GloVe. This is a common approach in NLP tasks.
Position Embedding: Positional embedding is required to display a word’s relative position within the sentence. Compared with RNN [17], Transformer uses all global information in a different way; it values the word-by-word sequential information, which is crucial for NLP. Position embedding is used to maintain the relative or absolute position information of each word in the sequence. The representation vector x of the word is obtained by adding its word embedding and position embedding together; x is then used as the Transformer’s input.
3.1.4. Attention Mechanism
The attention mechanism is widely considered as a key contribution to the success of Transformer, enhancing the system’s feature extraction capability. RNN [14] (LSTM or GRU)-based Encoder + Decoder models can be made more effective using an attention mechanism. The attention mechanism can enhance the model’s ability to extract features, resulting in a more comprehensive understanding of the input data.
The cosine similarity, referred to as the dot product, is adopted to calculate the attention weights of different features. Input features are ranked according to their relative importance.
At all time steps, there is a similar operation. As shown in Formula (1), we have an input key, denoted as , and the corresponding values , then we search for a query, denoted as q:
The longer the length of the vector, the wider the scale range of its dot product. After the softmax operation, the saturation zone is reached, which reduces the gradient during backpropagation. This makes optimization of the model more difficult. As a solution to this problem, the inner product is divided by the square root of its length, denoted as d, before executing softmax, resulting in Formula (2).
The special attention structure known as self-attention occurs when all keys, values, and queries have the same vector value.
Multi-Head Attention
In the attention module, the output can be multiplexed in order to combine the information in a variety of ways. In this way, the existing features can be described from various aspects, which helps to fully explore the information required for the model. This structure is known as Multi-Head Attention.
3.2. ViT
ViT is obtained by applying the Transformer structure to vision tasks.
ViT is composed of the following main components:
- 1.
- Image chunking
- 2.
- Transformer encoder
- 3.
- Classifier
In this section, we explain ViT in terms of these three components.
3.2.1. Image Chunking (Making Patches)
This step can be considered the pre-processing of an image. In a CNN, the images are convolved in two dimensions, height and width, and no further pre-processing is required. However, the Transformer structure requires the images to be chunked. Assuming that an input image of size is divided into patches of size , the total number of patches is . Each patch can be described as with an additional dimension. Here, N stands for the sequence’s length from the input to the Transformer, C stands for the image’s channel count, and P stands for the image patches’ size.
Image chunking is only a pre-processing step. A block embedding operation on an image is required to convert the vector dimension of into a two-dimensional input of size . This works in a similar way to how word2vec transforms a high-dimensional vector into a low-dimensional one in NLP. A unique code, similar to ‘CLS’ in BERT, is added to the embedding as the outcome of the category prediction.
In the image block embedding, a vector for position encoding must be included; spatial location information is then maintained between input image patches. ViT’s position encoding utilizes a direct 1D learnable position embedding variable rather than the updated 2D position embedding method, as the experimental results of using 2D and 1D embedding methods are comparable.
3.2.2. Transformer
To obtain the desired classification outcomes, the Transformer module is used for feature extraction, which is then input to the final classifier. The Transformer architecture significantly enhances the fusion of higher-order information and combined features. However, various experiments have demonstrated that it disrupts many tasks due to its structure.
3.2.3. Classifier
A shallow network such as MLP can achieve extremely high performance when sufficient features have been extracted. It requires only a simple network structure to produce accurate classification results. The images can be converted into sequence information, which is more conducive to extracting their relationships. By chunking the images and separating the features, the classification effect can be further improved.
3.3. Self-Supervised Learning
When using a Chest X-ray (CXR) to scan a patient’s chest cavity, imaging noise is inevitable, and may impact the recognition capability of the model to an extent. The noise includes blurring in images due to unconscious movement or change of body posture of the patient. In practice this is extremely evident, especially when there is a certain degree of difference in the distribution of the testing data and training data. Moreover, our experiments have demonstrated that using fixed datasets can lead to a model learning the discriminative pattern along with the dataset itself, which is caused by the distribution characteristics of the dataset. The model may mistakenly believe that the key feature for discriminating patterns is a piece of the necessary information. This is referred to as overfitting in the field of artificial intelligence and data science. It often happens when there is a large effect gap between the training set and the real dataset.
The dropout strategy is used to address this issue. This is an essential way of using all the data, which randomly selects features and then trains a series of models. The final output is the combined effect of all the models, and the learning capability is not very strong. Furthermore, it has the same processing mode for different datasets, and is not adaptive in terms of correspondingly adjusting the learning focus.
As a solution, we propose a new supervised learning strategy that simulates the noise and blur in the images. This forces the model to learn the correlations between different regions and extract more globally consistent features. Classification is essentially a high-level task that requires a holistic understanding of an image rather than focusing on the details. In this strategy, we use salt-and-pepper noise and singular value decomposition to simulate noise in the generation of CXR images. The model is trained to learn the capability to accurately restore its original features in the presence of noise and generate an output similar to the noise-free image. The signal-to-noise ratio(SNR) of salt-and-pepper noise is set to be 0.99, which means that only 99% of all the pixel points remain at their origin value.
To further improve the raw turnover, we add a singular value decomposition version of the image by keeping the same 90% singular value component. We add more randomness to the image, and the content changes in a way with a statistically stronger correlation compared to adding salt-and-pepper noise.
Figure 3 and Figure 4 demonstrate the effect of the transformation architecture, showing a comparison of a sample image before and after using the Transformer.
To measure the difference between output feature maps, we use MMD loss instead of L2 loss. The L2 loss only calculates the cumulative difference between points instead of using the idea of distribution to see the whole output. This introduces bias and loses key information during numerical calculation.
MMD is a typical loss function in transfer learning, and is frequently used to calculate the separation between two distributions. The core idea of MMD is that two distributions are identical if and only if two random variables of any order are identical. The instant that produces the largest difference between the two distributions should be utilized as the standard deviation of the two distributions in cases for which the two distributions are not equal.
With two distributions, and , their MMD loss is calculated using Formula (3).
We treat the output of the fourth and fifth encoder blocks in the ViT structure as a data distribution. We denote the original input as image and its enhanced version as .
In Formula (3), sup is used to find the upper bound that is the maximum value, indicates the expectation, and f indicates the mapping function, for which the parametric number in the regenerated Hilbert space should be less than or equal to 1.
We use the reconstruction loss as provided in Fomula (4) for self-supervised training.
3.4. Detail Correction Path (DCP)
In the ViT structure, we use a serially connected Encoder Block to process the input raw image and gradually obtain features with higher semantic levels. One problem with this process is that we tend to lose part of the critical details. Even though classification is more of a global examination of the input, it is difficult to obtain robustness against minor perturbations and attain sufficient generalization without a deeper understanding of the details.
In order to address this issue, a new structure is proposed that can better transfer the features of the original data to deeper locations of the network. With the above inputs concatenated, the features are further extracted by the SE Fusion Block to fully explore the detailed information, as shown in Figure 5. We call this path the Detail Correction Path, as shown in Figure 6.
By performing the pixel-by-pixel subtraction of adjacent positions, an approximation of the gradient information in both the x-axis and y-axis directions can be obtained, which describes the trend of the image to an extent. In addition, we add mean and maximum pooling as inputs to obtain pixel features at different angles.
The above inputs being concatenated, the features are further extracted by the SE Fusion Block, while the original input is further restored using a shortcut. In the SE Fusion Block, squeeze and excitation is used to extract the most important information between channels and suppress irrelevant content. We call this path the Detail Correction Path; the final location of the connection is explained further below. This design is used in conjunction with the other innovations in this paper.
3.5. Domain Transfer Methods
MagNet [18] is commonly utilized in the realm of adversarial sample defense. An AutoEncoder [19] is first taught to reconstruct the input data, and after training, this model learns the properties of the normal model’s data distribution.
Here, we aim to minimize the reconstruction loss, which is defined in Formula (5):
where x is the input of our model, e.g., images or audio information. With the AutoEncoder (AE) model, we obtain the output . The difference between the input and output is used to measure the AutoEncoder’s performance.
In practice, all data first pass through a trained AE. If the reconstruction loss is above a predetermined level, the training data and current input can be considered as adversarial created samples. We employ metrics, such as Kullback–Leibler divergence and the Euclidean distance, to identify these anomalous samples.
Because this indicator is asymmetric, as described by the fact that , it indicates certain optimization challenges. As a result, the Jensen–Shannon divergence is defined as Formula (7).
As a symmetric indicator, the Jensen–Shannon divergence more accurately gauges the gap between the two distributions. In our study, we train an AutoEncoder that reconstructs the data from the test set and prevents degrading of metrics due to the disparity in the distribution of the training and test sets.
The MagNet workflow is illustrated in Figure 7 below.
There are inevitable differences between the distribution of test sets and training sets. Models trained on the distribution characteristics of the training dataset are bound to produce a degree of metric degradation when migrated to the test set for testing.
In order to eliminate the impact of distribution differences, we reform the data distribution using the Reformer part of the MagNet structure. Although it does not match the features exactly, it can reduce the gap between the two.
The data distributions of the test set and training set are represented by the green and red distribution curves in Figure 8, respectively. While these curves are similar in form, they have a minor difference in scale. The blue curve results from a reformation to the test set, which transfers the distribution to the training set. There could be information loss, leading to more discrepancies in the distribution, in turn causing the metrics to decline.
To address the above issue, we connect the output of the Detail Correction Path to the result of the Reform operation. This corrects the reform output using the original detailed information, and adds missing content. Furthermore, it enables the system to learn model features from different perspectives to achieve more robustness and learning ability. This reformer structure is added between the third and fourth encoder blocks, providing it with supervision over the intermediate positions.
4. Experiment
4.1. Dataset
There have been prior research efforts dedicated to classification based on chest X-ray images. The outbreak of COVID-19 has pushed forward the progress of research in this field, and many studies have been developed. However, the lack of publicly available chest X-ray datasets of COVID-19-positive patients is a significant challenge.
In this research, we use the COVID-19 CXR scan dataset, called the X-ray Image [20], which is used for machine learning (ML) and deep learning studies. In particular, the X-ray Image dataset consists of 125 confirmed COVID-19-positive cases collected from 23 February 2020 to 21 April 2020, 500 normal cases collected from 21 January 2019 to 29 May 2020, and 500 community-acquired pneumonia (CAP) cases collected from 3 April 2018 to 24 November 2019.
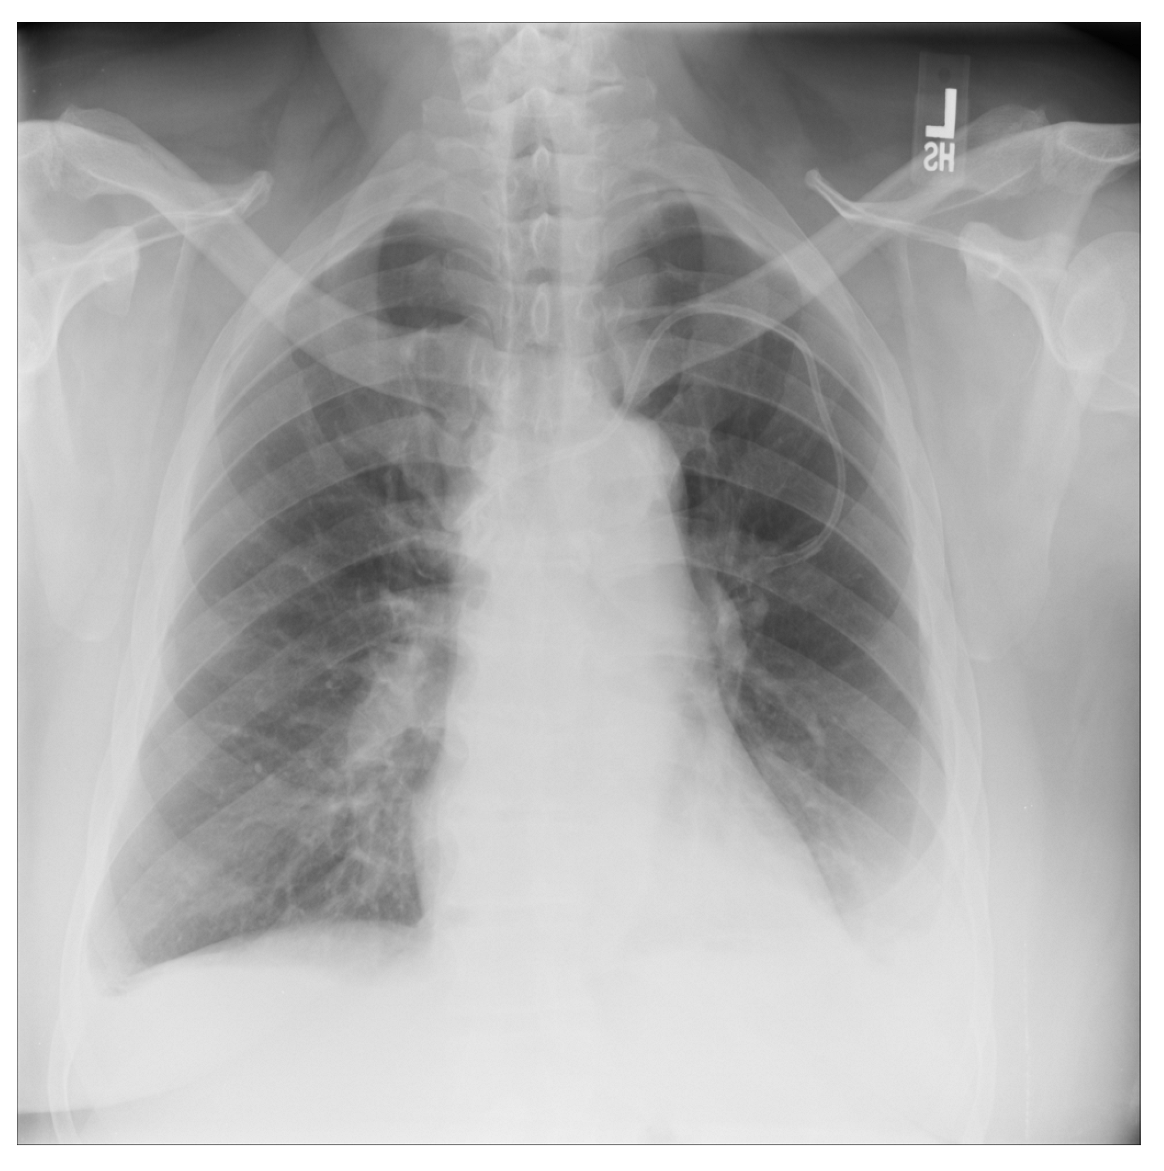
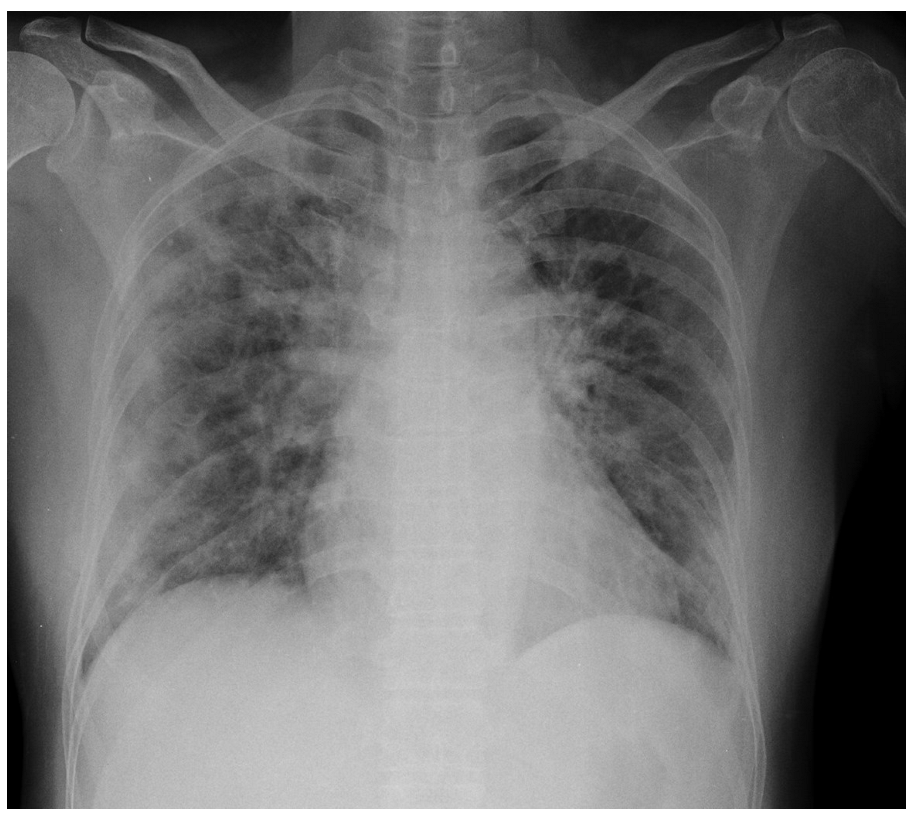
For a more intuitive understanding, we visualize a sample of each category in Figure 9, Figure 10 and Figure 11.
For balance purposes, the X-ray Image dataset is divided into a training set and a validation (or testing) set at a ratio of 957:168. As shown in Table 2, the training set contains 105 CXR images of COVID-19 positive patients, 426 healthy CXR images, and 426 non-COVID-19 CXR pneumonia images, while the testing set contains 20 CXR images of COVID-19-positive patients, 74 healthy CXR images, and 74 CXR images of non-COVID-19 pneumonia patients.
In addition, we use another dataset, the synthetic_covid_cxr dataset (https://github.com/hasibzunair/synthetic-covid-cxr-dataset, accessed on 9 August 2022), to ensure a more comprehensive study. This dataset is a similar binary medical dataset consisting of many more samples (21,295 samples in total): 16,537 normal and 4758 pneumonia. We divide the dataset into a training set and a validation (testing) set at a ratio of 6:1. As shown in Table 3, The training set consists of 4158 CXR images of positive COVID-19 patients and 14,137 healthy CXR images. The testing set consists of 600 CXR images of positive COVID-19 patients and 2400 health CXR images.
Figure 12 and Figure 13 demonstrate a pneumonia sample and a normal sample from the synthetic-covid-cxr dataset.
Figure 14 shows an example of typical chest X-ray images used for diagnosis. It can be observed that there are ground-glass opacities in the lungs of certain patients, which are identified using green rectangles. Pulmonary lobes and patchy consolidations are identified using blue ovals, indicating the presence of fibrosis or nodules. Doctors often use these features to determine whether patients are in a state of pneumonia, as well as its severity. Our model is designed to learn these features in order to achieve correct classification.
We select the classical network ResNet101 [21] as the baseline for our experiments. This network structure is widely used in a variety of computer vision tasks, including object detection, semantic segmentation, tracking, and classification, demonstrating excellent performance. It has a distinct structure that can successfully extract features from images to carry out the corresponding tasks. Comparative experiments are conducted to verify the effectiveness of our proposed method.
In addition, we introduce the current best model in the domain, Attention-Based VGG16 [15], for comparative study. The Attention-based VGG-16 model adds an additional branch to the convolutional neural network and adds a Spatial Attention module to better obtain different spatial region associations and interactions, obtaining the best results in the current field. However, it does not deal with information such as edges and other details, and does not consider the difference in distribution between the training and test sets, which can lead to a certain degree of degradation in generalization performance. Furthermore, it does not consider the use of self-supervision to further improve accuracy.
4.2. Training Details
4.2.1. Software and Hardware Configurations
4.2.2. Training Configurations
Adam [22] is chosen as our optimizer. The beta1 and beta2 parameters for the optimizer are set to 0.9 and 0.999, respectively, and the learning rate is set to 0.0001. With eps = 1 × 10, we try to avoid having a zero denominator. The batch size is 8 and the weight decay is 0. The cross-entropy is selected as the loss function. The total number of training epochs is 2500.
4.3. Data Augmentation
We randomly crop the input images for the training set and flip them horizontally with a probability of 0.5, then resize them to a fixed size of . We do not perform data augmentation on the test dataset.
4.4. Metrics
4.4.1. Accuracy
We choose accuracy as the metric for evaluation, as it is the most popular metric used in classification tasks and reflects the effectiveness of the suggested model.
The accuracy is calculated as in Formula (8). We denote the total number of samples as N and the number of correct classifications as .
4.4.2. Other Statistical Metrics
We use several additional statistical metrics for evaluation, including precision, recall, and the harmonic average of these two, that is, the F1-score. These metrics allow for a more thorough and holistic analysis of our model. Formulas (9)–(11) define the calculation of precision, recall, and the F1-score. We note the number of positive samples classified by the model as and the number of correctly classified ones as .
4.5. Results
The performance of different model configurations is shown in Table 6, Table 7, Table 8 and Table 9. The best performance in each column is marked in bold. To further compare the model effects and reduce bias for the data, we use k-Fold cross validation, with k = 7.
Table 6 provides the accuracy of different model configurations on the X-ray Image dataset. The current SOTA, Attention-VGG-16, is assessed as well. We start with the ViT structure alone, which is used as a comparative classifier in our study. Compared to ResNet101, ViT obtains a similar, though slightly better, performance in accuracy of 88.0952% (ResNet101) and 88.6905% (ViT). When we add our proposed self-supervised learning strategy and Detail Correction Path (DCP) to the ViT structure, the classification effect of the model is substantially improved. The improvement is further extended when adding both, which fully demonstrates the effectiveness of our proposed method. The best performance is achieved after the domain transfer strategy is added, with an accuracy of 95.2381%. We call this model SDViT. The current SOTA model, Attention-VGG16, achieves higher accuracy than native ViT. With our proposed innovations added to native ViT one by one, however, the new models outperform the Attention-VGG16 model. SDViT achieves the best performance among all the models. When examining the sevenfold K-Fold accuracy, we observe similar patterns of improvement among the models.
Table 7 provide the same set of the accuracy of different model configurations on the synthetic-covid-cxr dataset. We continue to conduct sevenfold cross-validation. ViT has better performance in terms of accuracy (test set accuracy: 81.2667% and K-Fold accuracy: 81.3333%) compared to ResNet101 (test set accuracy: 80.4333% and K-Fold accuracy: 80.4733%). With either one of our proposed self-supervised learning strategy and Detail Correction Path (DCP) additions to the ViT structure, the classification effect of the model is substantially improved. The improvement is further extended when adding both, which fully demonstrates the effectiveness of our proposed method. The best performance is achieved with all three innovations added, that is, the proposed SDViT model. It achieves a test set accuracy of 86.9% and K-Fold accuracy of 86.93333%. The current SOTA model, Attention-VGG16, is outperformed by the models with our innovations added.
Table 8 and Table 9 list the statistical metrics (precision, recall, and F1-score) for the models. Table 8 shows the results on the X-ray Image dataset, while Table 9 shows the results on the synthetic-covid-cxr dataset. On both datasets, the SOTA model is outperformed by the models with our innovations added, and our proposed model, SDViT, achieves the best performance for all metrics.
Comparing the number of parameters, the inference speed, and the required computation, we find that SDViT is able to improve the classification effect while greatly reducing both the computation and time complexity, as shown in Table 10.
In addition, we build up confusion matrices for ViT, VGG-16, and SDViT on both the X-ray Image and synthetic-covid-cxr datasets. Table 11, Table 12 and Table 13 list the confusion matrices for the X-ray Image dataset. It can be observed that SDViT greatly improves the effect of native ViT. After adding the three innovations proposed in this research, the classification results are significantly improved, with only one associated correlation error. SDViT again outperforms VGG-16.
Table 14, Table 15 and Table 16 provide the confusion matrices for the synthetic-covid-cxr dataset. SDViT again greatly improves the prediction effect of native ViT, increasing the correct prediction of normal cases from 1920 to 2030 and increasing the number of correct predictions of pneumonia from 518 to 577. Again, SDViT outperforms VGG-16 on the synthetic-covid-cxr dataset.
From the above confusion matrices, it can be seen that SDViT greatly improves the effect of native ViT after adding our three proposed innovations. It is important to note that the classification results for the category of COVID-19 are most significantly improved here, with only one correlation error ultimtely associated with it, which shows that our proposed model can better extract the features of COVID-19 and fit its corresponding data distribution, which is extremely promising for future medical applications.
5. Discussion
In general, prediction accuracy is used to determine the performance of different algorithms. The recent SOTA model for medical image classification, ViT, was proposed by A. Dosovitskiy et al. in 2020. It is based on the Transformer architecture. The Transformer architecture consists of attention, cross-links, and block processing. ViT focuses on image feature extraction. Even though it achieves much better performance than traditional convolutional neural networks such as ResNet (Table 6, Table 7, Table 8 and Table 9), ViT is not perfect. The patch process leads to a loss of semantic information during feature extraction, which makes it challenging to perform feature extraction on fine or small subjects. SDViT has finer feature extraction capabilities than ViT. It has the advantages of both ViT and traditional convolutional neural networks. It eliminates the gap between training data and test data by domain transfer. It adopts the Detail Correction Path (DCP) structure to migrate critical details to the model’s theater location in order to restore the damage to the original semantic information caused by domain transfer. Finally, to make the model more robust, it uses singular value decomposition and salt-and-pepper noise to simulate actual noise. Overall, SDViT can better extract the features of COVID-19 from CXR images, which is extremely promising for future medical applications.
6. Conclusions
Manual diagnosis using CXR images inevitably involves human errors that impact accuracy and reliability over time. With the outbreak of COVID-19, automatic diagnosis through CXR images has become necessary for improving accuracy and efficiency. In this paper, we propose a Transformer-based architecture called SDViT to conduct automatic diagnosis of COVID-19 based on patient CXR images. Based on three proposed innovations added to the ViT Transformer structure, SDViT can significantly improve the classification performance, as well as the training efficiency and training process oscillation.
Because the X-ray Image dataset is limited and small, we propose a self-supervised strategy to drive full learning of its intrinsic features instead of focusing only on the final classification results. This allows the model to repair ambiguous and defective parts using information from other parts, improves understanding of the intrinsic logic, and enhances the robustness of the model. To eliminate the differences between the training data and the data found in practice, we use the MagNet model to migrate the data distribution in order to reduce the gap. To repair possible loss of the original key information which may be caused by MagNet, we propose a Detail Correction Path structure. The DCP passes the original details to the location immediately after the MagNet transformation, which preserves original information that may be relevant for classification. Our experimental results demonstrate that the proposed method achieves the best classification performance.
However, there are a number of aspects that need to be further investigated in future research. The data augmentation approach in the current design mainly relies on the observation of images and knowledge in the field. In the future, this could be extended to use parametric methods for domain-specific expression. Furthermore, specific architectures could be used to extract other high-frequency information that is crucial for classification. Finally, the datasets we use in our research have relatively balanced numbers of of positive and negative samples. This is somewhat different from the real data. Thus, it is necessary to further test our model as more COVID-19 data become available.
Author Contributions
Conceptualization Methodology, K.A. and Y.Z.; Software, K.A.; Validation, Y.Z.; Formal analysis, Y.Z.; Investigation, K.A.; Writing—original draft, Y.Z.; Writing—review, editing, and supervision, K.A. and Y.Z.; Funding acquisition, K.A. All authors have read and agreed to the published version of the manuscript.
Funding
This research was funded by Zhejiang Provincial Laboratory Work Research Project No. ZD202102.
Institutional Review Board Statement
Not applicable.
Informed Consent Statement
Not applicable.
Data Availability Statement
The synthetic-covid-cxr dataset supporting the conclusions of this article is available at https://github.com/hasibzunair/synthetic-covid-cxr-dataset (accessed on 9 August 2022). The X-ray Image dataset supporting the conclusions of this article is available at https://github.com/muhammedtalo/COVID-19/ (accessed on 29 September 2022).
Acknowledgments
We thank the associate editor and the reviewers for their useful feedback that improved this paper.
Conflicts of Interest
The authors declare no conflict of interest.
References
- Deng, J.; Wei, D.; Richard, S.; Li, L.; Li, K.; Li, F. ImageNet: A large-scale hierarchical image database. In Proceedings of the 2009 IEEE Conference on Computer Vision and Pattern Recognition, Miami, FL, USA, 20–25 June 2009; pp. 248–255. [Google Scholar] [CrossRef] [Green Version]
- Sitaula, C.; Basnet, A.; Mainali, A.; Shahi, T.B. Deep Learning-Based Methods for Sentiment Analysis on Nepali COVID-19-Related Tweets. Comput. Intell. Neurosci. 2021, 2021, 2158184. [Google Scholar] [CrossRef] [PubMed]
- Vaswani, A.; Shazeer, N.; Parmar, N.; Uszkoreit, J.; Jones, L.; Gomez, A.N.; Kaiser, Ł.; Polosukhin, I. Attention is All you Need. In Proceedings of the Advances in Neural Information Processing Systems 30 (NIPS 2017), Long Beach, CA, USA, 4–9 December 2017; pp. 1–12. [Google Scholar]
- Devlin, J.; Chang, M.W.; Lee, K.; Toutanova, K. BERT: Pre-training of Deep Bidirectional Transformers for Language Understanding. arXiv 2018, arXiv:1810.04805. [Google Scholar]
- Lan, Z.; Chen, M.; Goodman, S.; Gimpel, K.; Sharma, P.; Soricut, R. ALBERT: A Lite BERT for Self-supervised Learning of Language Representations. arXiv 2019, arXiv:1909.11942. [Google Scholar]
- Liu, Y.; Ott, M.; Goyal, N.; Du, J.; Joshi, M.; Chen, D.; Levy, O.; Lewis, M.; Zettlemoyer, L.; Stoyanov, V. RoBERTa: A Robustly Optimized BERT Pretraining Approach. arXiv 2019, arXiv:1907.11692. [Google Scholar]
- Carion, N.; Massa, F.; Synnaeve, G.; Usunier, N.; Kirillov, A.; Zagoruyko, S. End-to-end object detection with transformers. In European Conference on Computer Vision; Springer: Cham, Switzerland, 2020; pp. 213–229. [Google Scholar]
- Zheng, S.; Lu, J.; Zhao, H.; Zhu, X.; Luo, Z.; Wang, Y.; Fu, Y.; Feng, J.; Xiang, T.; Torr, P.H.; et al. Rethinking Semantic Segmentation from a Sequence- to-Sequence Perspective with Transformers. In Proceedings of the IEEE/CVF Conference on Computer Vision and Pattern Recognition (CVPR), Nashville, TN, USA, 20–25 June 2021. [Google Scholar]
- Dosovitskiy, A.; Beyer, L.; Kolesnikov, A.; Weissenborn, D.; Zhai, X.; Unterthiner, T.; Dehghani, M.; Minderer, M.; Heigold, G.; Gelly, S.; et al. An Image is Worth 16x16 Words: Transformers for Image Recognition at Scale. arXiv 2020, arXiv:2010.11929. [Google Scholar]
- Touvron, H.; Cord, M.; Douze, M.; Massa, F.; Sablayrolles, A.; Jégou, H. Training data-efficient image transformers and distillation through attention. In Proceedings of the 38th International Conference on Machine Learning, Virtual Event, 18–24 July 2021. [Google Scholar]
- Joe, V.Q.; Westesson, P.L. Tumors of the parotid gland: MR imaging characteristics of various histologic types. Am. J. Roentgenol. 1994, 163, 433–438. [Google Scholar] [CrossRef] [PubMed] [Green Version]
- Zhou, T.; Ruan, S.; Canu, S. A review: Deep learning for medical image segmentation using multi-modality fusion. Array 2019, 3, 100004. [Google Scholar] [CrossRef]
- Shachor, Y.; Greenspan, H.; Goldberger, J. A mixture of views network with applications to multi-view medical imaging. Neurocomputing 2020, 374, 1–9. [Google Scholar] [CrossRef]
- Liu, Z.; Lin, Y.; Cao, Y.; Hu, H.; Wei, Y.; Zhang, Z.; Lin, S.; Guo, B. Swin Transformer: Hierarchical Vision Transformer using Shifted Windows. In Proceedings of the IEEE/CVF International Conference on Computer Vision (ICCV), Montreal, QC, Canada, 11–17 October 2021. [Google Scholar]
- Sitaula, C.; Hossain, M.B. Attention-based VGG-16 model for COVID-19 chest X-ray image classification. Appl. Intell. 2021, 51, 2850–2863. [Google Scholar] [CrossRef] [PubMed]
- Ullah, N.; Khan, J.A.; Almakdi, S.; Khan, M.S.; Alshehri, M.; Alboaneen, D.; Raza, A. A Novel CovidDetNet Deep Learning Model for Effective COVID-19 Infection Detection Using Chest Radiograph Images. Appl. Sci. 2022, 12, 6269. [Google Scholar] [CrossRef]
- Cho, K.; Van Merriënboer, B.; Gulcehre, C.; Bahdanau, D.; Bougares, F.; Schwenk, H.; Bengio, Y. Learning Phrase Representations using RNN Encoder-Decoder for Statistical Machine Translation. arXiv 2014, arXiv:1406.1078. [Google Scholar]
- Meng, D.; Chen, H. MagNet: A Two-Pronged Defense against Adversarial Examples. In Proceedings of the 2017 ACM SIGSAC Conference on Computer and Communications Security, Dallas, TX, USA, 30 October–3 November 2017. [Google Scholar]
- Vincent, P.; Larochelle, H.; Bengio, Y.; Manzagol, P.A. Extracting and Composing Robust Features with Denoising Autoencoders. In Proceedings of the Twenty-Fifth International Conference on Machine Learning (ICML 2008), Helsinki, Finland, 5–9 June 2008. [Google Scholar]
- Available online: https://github.com/muhammedtalo/COVID-19/ (accessed on 29 September 2022).
- He, K.; Zhang, X.; Ren, S.; Sun, J. Deep Residual Learning for Image Recognition. In Proceedings of the IEEE Conference on Computer Vision and Pattern Recognition IEEE, Las Vegas, NV, USA, 27–30 June 2016. [Google Scholar]
- Kingma, D.; Ba, J. Adam: A Method for Stochastic Optimization. arXiv 2014, arXiv:1412.6980. [Google Scholar]
Figure 1.
SDViT: the architecture.

Figure 2.
ViT architecture with datasets.

Figure 3.
Original sample.

Figure 4.
Enhanced sample.

Figure 5.
SE Fusion Block.

Figure 6.
Detail Correction Path.

Figure 7.
MagNet workflow.

Figure 8.
Domain transfer via Reform.

Figure 9.
Covid sample: X-ray Image dataset.

Figure 10.
Pneumonia sample: X-ray Image dataset.

Figure 11.
Normal sample: X-ray Image dataset.

Figure 12.
Pneumonia sample: synthetic-covid-cxr.

Figure 13.
Normal sample: synthetic-covid-cxr.

Figure 14.
Analysis and diagnosis using patient CXR images.


Table 1.
Comparison of our proposed model with previous models.
| Model | Architecture | Contribution | Advantages | Disadvantages |
|---|---|---|---|---|
| SETR | Semantic segmentation with transformers | Using semantic segmentation as a sequence-to-sequence prediction task; using a pure transformer as an encoder; modeling the global context at each layer and designing three different decoders for pixel-level segmentation. | Can learn superior feature representations compared to different FCNs; removes the reliance on FCNs and addresses the challenge of a limited receptive field. | Requires huge (300M+) parameters and computation; does not work well for small objects; increasing the input image reduces the patch size, increasing computation quadratically. |
| DETR | Object detection with transformers | Proposes a Deformable Attention Module to replace the self-attention module in the encoder, greatly reducing computations. | Can be extended to complex tasks easily; better than Fast R-CNN on large objects, and no need for NMS post-processing. No need for anchor. | Same as SETR |
| ViT | Transformers for image recognition | The first vision model to use Transformer. | The MSA (Multihead Self-Attention) block complements the generalized spatial smoothing of convolutional networks. MSA integrates feature maps and smoothing loss planes, which helps neural networks learn more robust feature representations. | Due to the patch size, an image is cut into many small images, which disrupts the internal structure information and may overlook features of the image. |
| DeiT | A ViT model with a teacher–student strategy and distillation token | Better performance than Transformer was achieved by using Transformer to build a competitive convolution-free model to solve image understanding tasks, using Token-based distillation to outperform traditional distillation, and using convent as a Teacher. | To achieve the same effect as ViT, DeiT requires a smaller training dataset and a shorter training period. | Consistent with ViT’s issues. |
| Attention VGG-16 | An attention-based deep learning model for image classification | A branch is added to the convolutional neural network with a spatial attention module to better obtain the associations and interactions of different spatial regions and to achieve the best model for the current domain. | It captures the spatial relationship between ROIs in CXR images, and is efficient in both classification accuracy and training parameter. | It does not deal with information such as edges and other details, and does not consider the difference in distribution between the training and test sets, which can lead to a certain degree of degradation in generalization performance. It does not consider the use of self-supervision to further improve accuracy. |
| CovidDetNet | A deep learning-based approach for automatic diagnosis of COVID-19 using chest radiographs | Chest radiographs are used for early and accurate diagnosis of COVID-19 through a model with ten learnable layers (nine convolutional layers and one fully-connected layer), obtaining better performance than baseline models. | Automatic detection and early diagnosis of COVID-19 while reducing diagnosis workload, reducing the workload of radiologists, and avoiding misdiagnosis | Advantages over other models are unclear, though these can be obtained through comparative study. |
| SDViT | A Self-supervised Detail-sensitive ViT-Based Model for Medical Diagnosis | A self-supervised strategy that allows the model to repair ambiguous and defective parts using information from other parts; a new structure, the Detail Correction Path, to repair the possible loss of original key features caused by MagNet | A shorter training period, stronger resistance to noise, and missing interference on a small number of sample datasets | Same as ViT |
Table 2.
Arrangement of the X-ray Image dataset.
| Class | COVID-19 | Health | Pneumonia | Total |
|---|---|---|---|---|
| Train | 105 | 426 | 426 | 957 |
| Validation | 20 | 74 | 74 | 168 |
| Total | 125 | 500 | 500 | 1125 |
Table 3.
Arrangements of the synthetic-covid-cxr dataset.
| Class | COVID-19 | Health | Total |
|---|---|---|---|
| Train | 4158 | 14,137 | 18,295 |
| Validation | 600 | 2400 | 3000 |
| Total | 4758 | 16,537 | 21,295 |
Table 4.
Hardware Configuration.
| Hardware | Configuration |
|---|---|
| CPU | i7-10875h |
| GPU | GTX2080TI 16 GB |
| RAM | DDR5 32 GB |
| Storage | Micorn M2 256 GB |
Table 5.
Software configuration.
| Software | Version |
|---|---|
| Operating System | Ubuntu 20.04 |
| Python | 3.8.3 |
| Pytorch-GPU | 1.8.0 |
| OpenCV | 2.1.3 |
Table 6.
Accuracy of different model configurations on X-ray Image dataset.
| Model | Attention | Self-Supervised Learning | DCP | Domain Transfer | Test Set Accuracy | K-Fold Accuracy |
|---|---|---|---|---|---|---|
| ResNet101(Baseline) | × | × | × | × | 88.0952% | 87.0833% |
| Attention-VGG (SOTA) | × | × | × | × | 90.4761% | 89.9404% |
| ViT | ✓ | × | × | × | 88.6905% | 89.4048% |
| ViT + Self-supervised learning | ✓ | ✓ | × | × | 93.4524% | 93.9286% |
| ViT + DCP | ✓ | ✓ | ✓ | × | 94.0476% | 95.3571% |
| DCP + Self-supervised learning + ViT | ✓ | ✓ | ✓ | × | 94.6428% | 95.7143% |
| SDViT(Our Model) | ✓ | ✓ | ✓ | ✓ | 95.2381% | 96.13095% |
Table 7.
Accuracy of different model configurations on synthetic-covid-cxr dataset.
| Model | Attention | Self-Supervised Learning | DCP | Domain Transfer | Test Set Accuracy | K-Fold Accuracy |
|---|---|---|---|---|---|---|
| ResNet101(Baseline) | × | × | × | × | 80.4333% | 80.4733% |
| Attention-VGG (SOTA) | × | × | × | × | 82.5% | 82.5733% |
| ViT | ✓ | × | × | × | 81.2667% | 81.3333% |
| ViT + Self-supervised learning | ✓ | ✓ | × | × | 82.9667% | 82.9333% |
| ViT + DCP | ✓ | ✓ | ✓ | × | 83.0333% | 83% |
| DCP + Self-supervised learning + ViT | ✓ | ✓ | ✓ | × | 85.5333% | 85.4933% |
| SDViT(Our Model) | ✓ | ✓ | ✓ | ✓ | 86.9% | 86.93333% |
Table 8.
Statistical metrics of different model configurations on X-ray Image dataset.
| Model | Precision | Recall | F1-Score |
|---|---|---|---|
| ResNet101(Baseline) | 0.856295 | 0.873423 | 0.870293 |
| Attention-VGG(SOTA) | 0.882063 | 0.891441 | 0.886727 |
| ViT | 0.869061 | 0.877928 | 0.873472 |
| ViT + Self-supervised learning | 0.916367 | 0.926126 | 0.921220 |
| ViT + DCP | 0.920714 | 0.930631 | 0.925645 |
| ViT + Self-supervised learning + DCP | 0.935190 | 0.935135 | 0.935162 |
| SDViT(Our Model) | 0.952310 | 0.963964 | 0.958102 |
Table 9.
Statistical metrics of different model configurations on synthetic-covid-cxr dataset.
| Model | Precision | Recall | F1-Score |
|---|---|---|---|
| ResNet101(Baseline) | 0.726307 | 0.808958 | 0.765408 |
| Attention-VGG(SOTA) | 0.750712 | 0.84375 | 0.794517 |
| ViT | 0.739040 | 0.831667 | 0.782621 |
| ViT + Self-supervised learning | 0.758279 | 0.858542 | 0.805302 |
| ViT + DCP | 0.758839 | 0.858958 | 0.805801 |
| ViT + Self-supervised learning + DCP | 0.784603 | 0.888333 | 0.833252 |
| SDViT(Our Model) | 0.799044 | 0.90375 | 0.848178 |
Table 10.
Computational and time complexity of different models.
| Model | Model Size (MB) | Infer Speed (FPS) | Infer Computation (GFLOP) |
|---|---|---|---|
| ResNet101(Baseline) | 170 | 192 | 7.6 |
| Attention-VGG(SOTA) | 528 | 94 | 15.5 |
| SDViT(Our Model) | 88 | 684 | 2.4 |
Table 11.
Confusion matrix of native ViT on the X-ray Image dataset.
| Real COVID-19 | Real Normal | Real CAP | |
|---|---|---|---|
| Predict COVID-19 | 69 | 8 | 1 |
| Predict Normal | 4 | 63 | 2 |
| Predict CAP | 1 | 3 | 17 |
Table 12.
Confusion matrix of Attention VGG16 on the X-ray Image dataset.
| Real COVID-19 | Real Normal | Real CAP | |
|---|---|---|---|
| Predict COVID-19 | 69 | 5 | 1 |
| Predict Normal | 4 | 66 | 2 |
| Predict CAP | 1 | 3 | 17 |
Table 13.
Confusion matrix of SDViT on the X-ray Image dataset.
| Real COVID-19 | Real Normal | Real CAP | |
|---|---|---|---|
| Predict COVID-19 | 70 | 3 | 0 |
| Predict Normal | 4 | 70 | 0 |
| Predict CAP | 0 | 1 | 20 |
Table 14.
Confusion matrix of native ViT on the synthetic-covid-cxr dataset.
| Real Normal | Real Pneumonia | |
|---|---|---|
| Predict Normal | 1920 | 82 |
| Predict Pneumonia | 480 | 518 |
Table 15.
Confusion matrix of Attention VGG16 on the synthetic-covid-cxr dataset.
| Real Normal | Real Pneumonia | |
|---|---|---|
| Predict Normal | 1950 | 75 |
| Predict Pneumonia | 450 | 525 |
Table 16.
Confusion matrix of SDViT on the synthetic-covid-cxr dataset.
| Real Normal | Real Pneumonia | |
|---|---|---|
| Predict Normal | 2030 | 23 |
| Predict Pneumonia | 370 | 577 |
Disclaimer/Publisher’s Note: The statements, opinions and data contained in all publications are solely those of the individual author(s) and contributor(s) and not of MDPI and/or the editor(s). MDPI and/or the editor(s) disclaim responsibility for any injury to people or property resulting from any ideas, methods, instructions or products referred to in the content. |
© 2022 by the authors. Licensee MDPI, Basel, Switzerland. This article is an open access article distributed under the terms and conditions of the Creative Commons Attribution (CC BY) license (https://creativecommons.org/licenses/by/4.0/).
Share and Cite
MDPI and ACS Style
An, K.; Zhang, Y. A Self-Supervised Detail-Sensitive ViT-Based Model for COVID-19 X-ray Image Diagnosis: SDViT. Appl. Sci. 2023, 13, 454. https://0-doi-org.brum.beds.ac.uk/10.3390/app13010454
AMA Style
An K, Zhang Y. A Self-Supervised Detail-Sensitive ViT-Based Model for COVID-19 X-ray Image Diagnosis: SDViT. Applied Sciences. 2023; 13(1):454. https://0-doi-org.brum.beds.ac.uk/10.3390/app13010454
Chicago/Turabian StyleAn, Kang, and Yanping Zhang. 2023. "A Self-Supervised Detail-Sensitive ViT-Based Model for COVID-19 X-ray Image Diagnosis: SDViT" Applied Sciences 13, no. 1: 454. https://0-doi-org.brum.beds.ac.uk/10.3390/app13010454
Note that from the first issue of 2016, this journal uses article numbers instead of page numbers. See further details here.