
A Disposable Soft Magnetic Ribbon Impedance-Based Sensor for Corrosion Monitoring
1
The Laboratory for Advanced Materials and Sensors, Department of Physics, University of South Florida, Tampa, FL 33620, USA
2
Department of Physics, Beloit College, Beloit, WI 53511, USA
*
Author to whom correspondence should be addressed.
†
Current Address: National Energy Technology Laboratory, Pittsburgh, PA 15236, USA.
Appl. Sci. 2023, 13(10), 6011; https://0-doi-org.brum.beds.ac.uk/10.3390/app13106011
Submission received: 20 March 2023
/
Revised: 4 May 2023
/
Accepted: 11 May 2023
/
Published: 13 May 2023
(This article belongs to the Special Issue Novel Nanomaterials and Sensing Platforms for Detection and Diagnosis of Coronaviruses)
Abstract
:Featured Application
A disposal soft magnetic ribbon impedance-based sensor could potentially be employed to monitor chemical corrosion in real time.
Abstract
We present a new approach for the real-time monitoring of chemical corrosion based on radio-frequency (RF) impedance technology and soft ferromagnetic ribbons. The impedance (Z) of a commercial METGLAS® 2714A ribbon was measured in real time for 5 μL of drop-casted HNO3 of various concentrations. Variations in the concentration of the drop-casted acid were assessed by considering the difference in Z () with and without the acid treatment. We found a large and linear increase in (from ~5 to ~35 mΩ) and a large linear decrease in measurement time (from ~240 to 70 s) with increases in acid concentration (from 0.9 to 7.4 Molar), which is promising for the development of disposable chemical sensors for the strength estimation of corrosive chemicals and for the monitoring of time-dependent chemical corrosion processes. Since the ribbon used is commercially available at a low cost and as the measurement system is quick and low power-consuming, the proposed sensor can be used as an easy, quick, and low-cost chemical probe in industry and for environmental hazard management purposes.
1. Introduction
The development of a quick, cost-effective, and reliable technique to estimate the concentration of corrosive chemicals has been of technological interest for safety in industry and for the environment for many years [1,2,3,4,5,6,7,8,9,10,11]. Numerous different sensors have been established to achieve this goal, such as a carbon electrode-based sensor for the detection of perfluorooctanoic acid [4], titanium oxide-based semiconductor sensors used to detect formaldehyde in the air [6], and enzymatic conductometric sensors commonly used to detect the amount of pollution in water samples [3,7]. Each different type of sensor carries with it advantages and disadvantages that are useful for different situations. Capacitive sensors are praised for their easy fabrication and cost-effective construction, yet can cause issues as their sensitivity depends on obtaining the proper thickness for the original sensing layer [7]. Metal oxide semiconductor gas sensors are highly sensitive, simple, and have the possibility to be portable and low-cost, yet are only applicable for chemicals in the gas phase [1,6,11]. Among the variety of chemical sensors available today, there is an evident lack of chemical sensors for distinguishing between different concentrations and types of corrosive chemicals in liquid form, which are often used in industries such as the steel industry on a daily basis. Here, a novel sensor is proposed for this issue which utilizes the impedimetric sensing benefits of electrochemical sensors [2,8,9,10,12], while also taking advantage of the inductive impedance benefits of the recently popular giant magneto-impedance (GMI)-based chemical sensors [13,14,15,16,17].
Electrochemical impedimetric sensors exhibit many advantages that have contributed to their importance in today’s society [2,8,9,10,12]. The main asset of these sensors is their ability to provide information on different aspects of electrochemical cells such as the ohmic resistance, capacitive information at the electrode/solution interface, and the rate constant of the reactions involved [2,8,11]. Through this information it is possible to determine many characteristics about a specific analyte in question, such as the presence of bacteria in water samples [12], the concentration of humidity in the air [2], and the presence of certain proteins within the body [10,11,12]. Unfortunately, many impedimetric electrochemical sensors require external chemicals aside from those being detected in order to function, such as enzymatic conductometric sensors, which utilize enzymatic reactions that produce conductivity-modifying ionic species from the reaction solution [3]. These extra chemicals can increase the complexity of use and the cost of the sensors. Recently, another form of impedance-based sensor referred to as GMI sensors has come into importance for their utilization of inductive impedance using soft ferromagnetic ribbons and external magnetic fields [13,14,15,16,17]. GMI sensors are praised for their low power consumption, high sensitivity, and thermal stability—yielding accurate detections for different concentrations of corrosive chemicals such as HNO3 [16]. However—similar to electrochemical impedimetric sensors—GMI sensors require an external magnetic field, which adds to the complexity of their development and use. The novel sensor created here utilizes the advantages of both impedimetric electrochemical sensors and GMI sensors by exploring the benefits of GMI sensors without an added external magnetic field. Such a sensor that utilizes the ac impedance Z of a magnetic ribbon of half thickness t, resistivity , and magnetic permeability at a frequency f and skin depth has the potential to improve safety in chemical-using industries. The impedance of the previously mentioned class of sensors is given by [18]:
where and is given by . R is the resistance of the ribbon, A is the cross-sectional area, and l is the length.
Z = Rdcjktcoth(jkt)
For inductive materials, as the frequency is increased the skin depth decreases, which leads to an increase in the impedance of the system. When treated with different concentrations of corrosive chemicals, parts of the ribbon are etched away and holes accompanied by metal oxide form on the surface of the ribbon [16,17]. This change in the surface topography of the ribbon decreases the magnetic permeability, as magnetic moments are removed from the surface as the ribbon is etched. According to the above equations, if it is assumed that the frequency of oscillation remains constant after acid treatment, this would lead to an increase in the skin depth. Plugging the skin depth into Equation (1), it can be noted that the coth(jkt) section will increase along with the Rdc section; this leads to an overall increase in the impedance, which allows the change in impedance to be analyzed to give the concentration of the corrosive chemical.
In this study, the sensitivity—defined by the change in impedance of the soft ferromagnetic ribbons—is studied using frequencies ranging from 0.2 MHz to 7 MHz and concentrations of HNO3 ranging from 0.9 M to 7.4 M. In addition, changes in the morphology and magnetic properties of the ribbon are studied using Scanning Electron Microscopy (SEM) imaging, X-ray Diffraction (XRD) data, and Physical Property Measurement System (PPMS) data. The proposed sensor would have low power consumption, be cost effective, disposable after use, and would not require the complexities of external magnetic fields or additional chemicals. By the creation of a simple-to-use corrosive chemical sensor, emergencies such as chemical spills in industry have the possibility to be dealt with in safer manners, and the safety of workers in chemical-using industries can be greatly increased.
2. Materials and Methods
2.1. Sensor Design and Fabrication
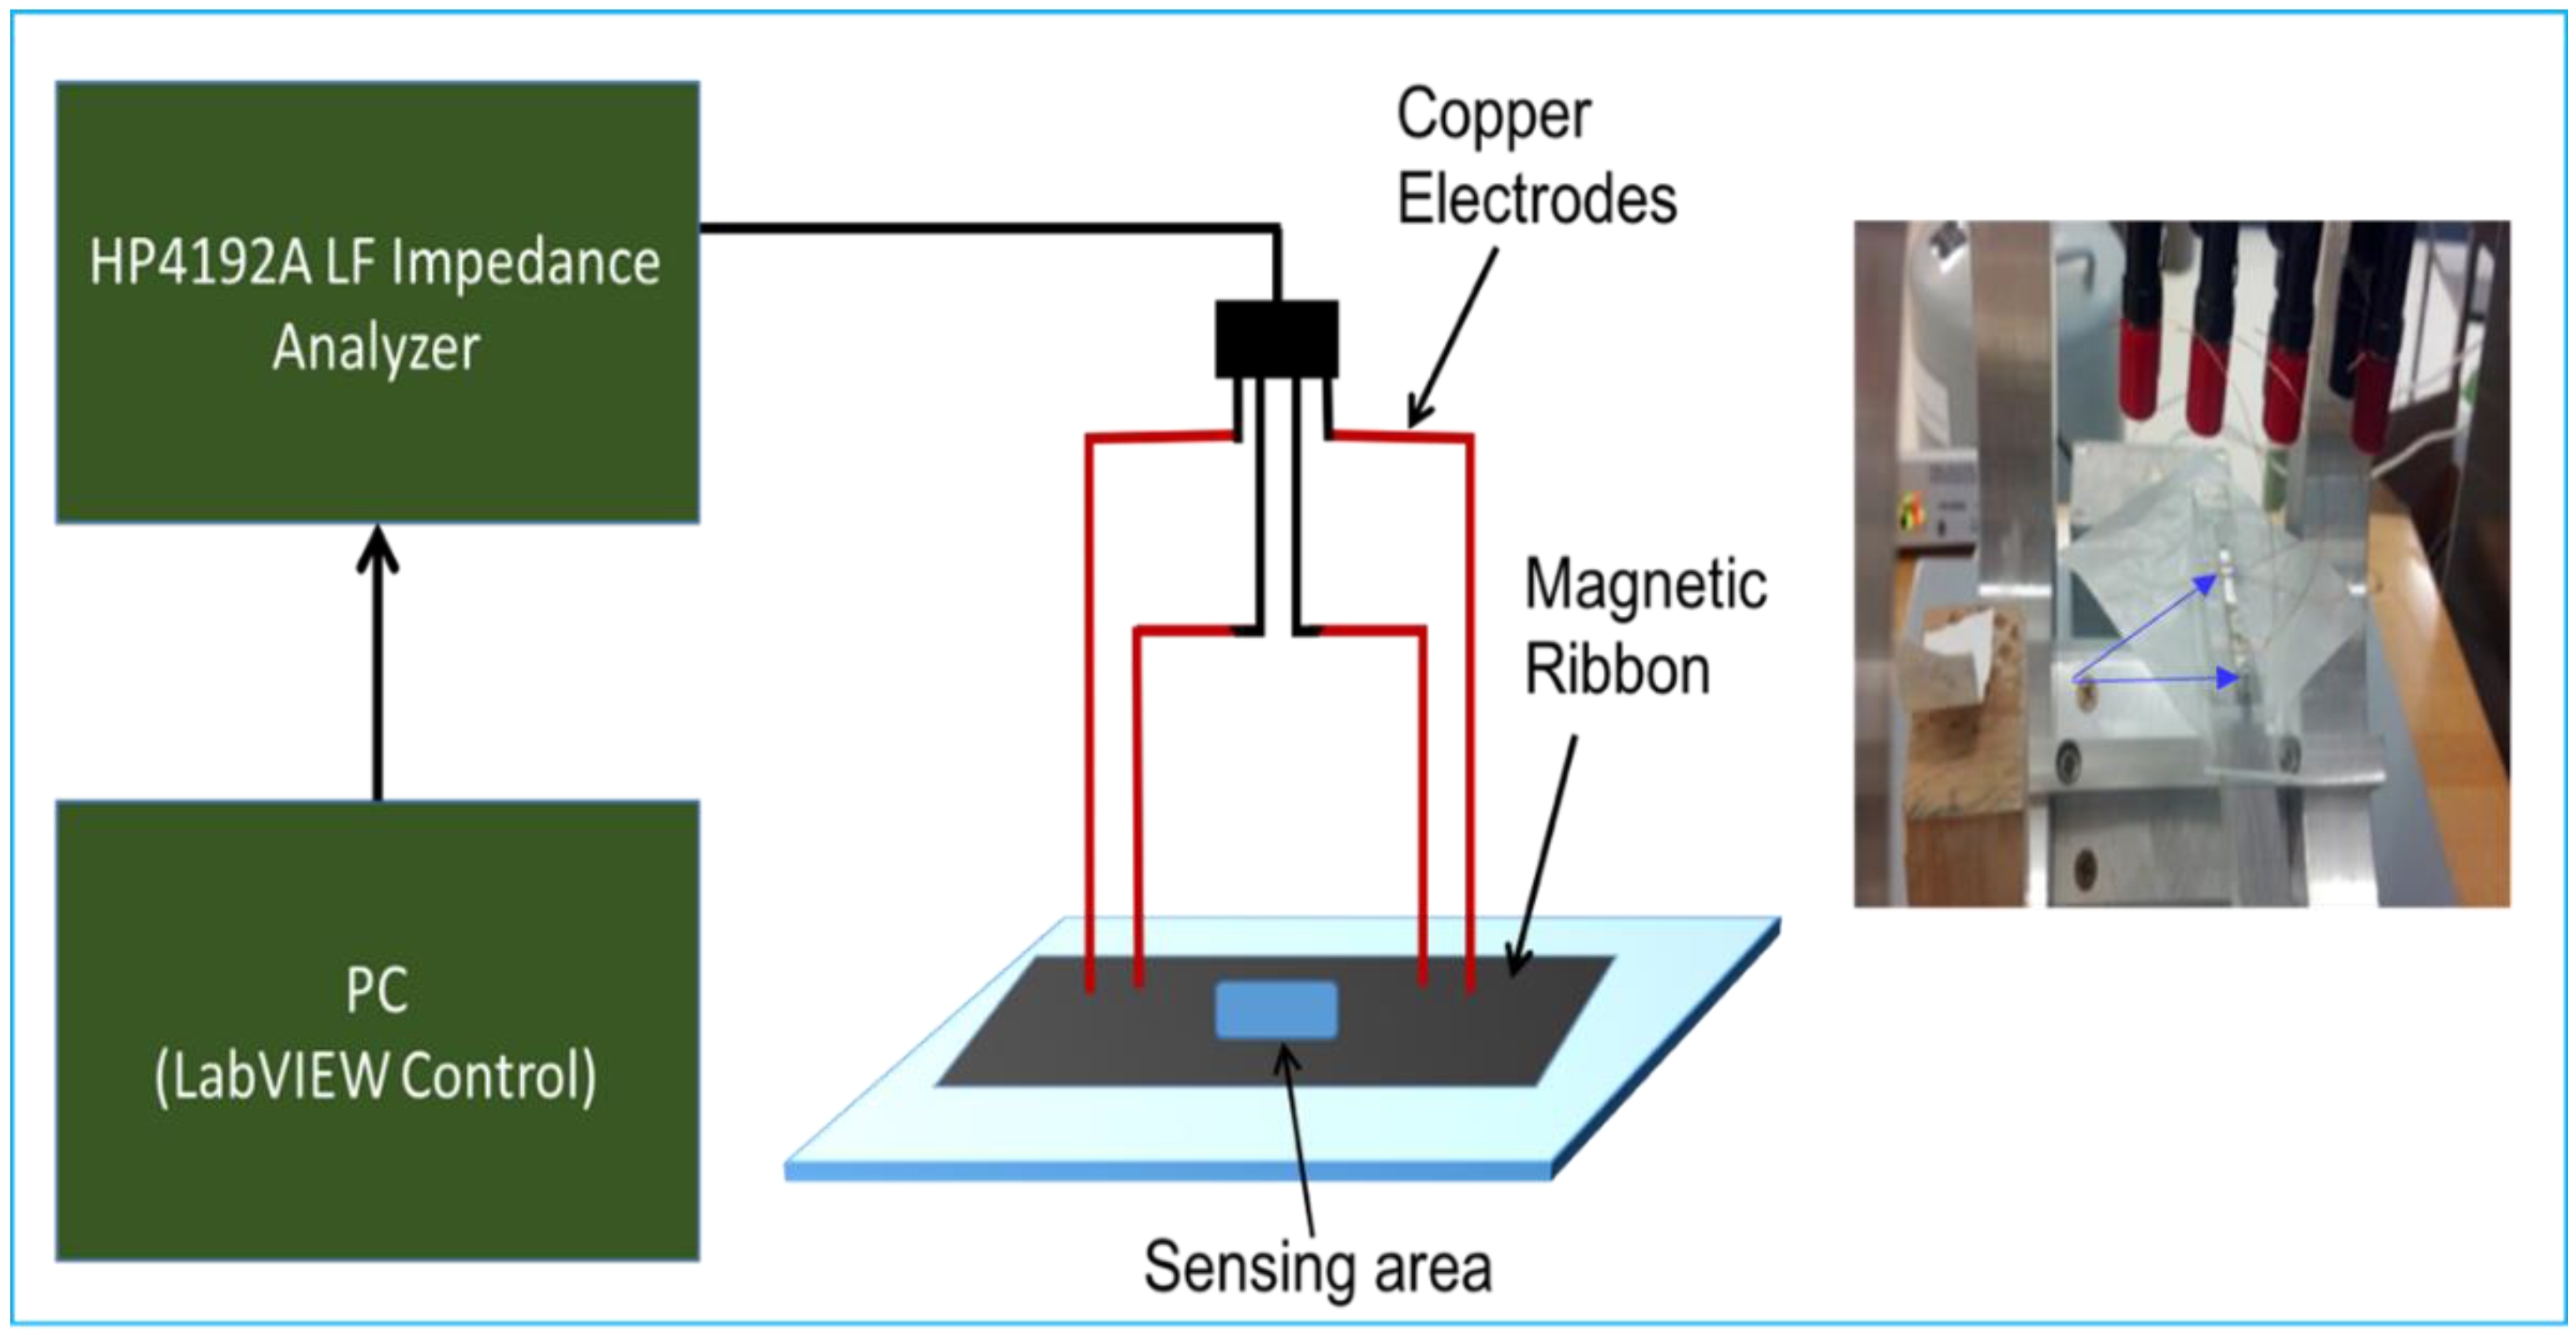
Soft ferromagnetic amorphous ribbons of the composition Co65Fe4Ni2Si15B14 (METGLAS 2714A) were cut into 3 mm-wide strips so that the magnetic domains were transverse to their length. The impedance of the strips was measured by a four-point measurement technique over a length of 15 or 20 mm using an HP4192 impedance analyzer at a test current of 1.36 mA. The electric contacts were made using copper wires and silver paint and the whole measurement system was monitored by the LabVIEW program. A diagram of the experimental setup is shown in Figure 1. We note that this measurement set-up is to demonstrate the proof-of-concept of the sensor for chemical sensing. For the practical implementation of the sensor, the sample needs to be changed at each test; therefore, the use of copper wires glued with silver paste directly onto the amorphous strip is not desirable, and a mechanical system for connecting the amorphous strip should be used instead.
2.2. Tests and Analysis of Chemical Corrosion
The effect of the HNO3’s strength on the impedance was accessed by its real-time measurement via the drop-casting of a certain volume (~5 μL) of HNO3 at different concentrations (0.9, 1.8, 3.8, 5.5, and 7.4 Molar). The acid concentrations were selected considering the thickness of the amorphous strip used (~25 µm). In order to determine the optimal operating frequency range for the chemical sensor, we performed impedance measurements at different frequencies (0.2, 2, 5, and 7 MHz). Ten trials were conducted for each frequency and acid concentration, using different identical ribbons each time, and the average of the data was then used for analysis. From the data stated, graphs containing the change in impedance as a function of the acid concentration and change in impedance as a function of time could be obtained and analyzed.
2.3. Topological, Structural, and Magnetic Characterization
The ribbons were then subjected to the acid concentrations previously listed for ten minutes each and studied using Scanning Electron Microscopy (SEM) imaging to better understand the topological effect the acid would have on the ribbons. Imaging of the ribbons was done both when wiping the acid off of the ribbons after the designated ten minutes, and when keeping the acid on after the ten minutes. Along with the SEM imaging, the ribbons were also studied using X-ray diffraction methods (XRD) after the acid treatment to ensure that the change in the conductivity observed in the ribbons as a function of acid concentration was not due to structural changes in the ribbons.
Aside from the structural, topological, and electronic changes measured in the ribbons, magnetic changes in the ribbons as a function of acid concentration were also measured using a vibrating sample magnetometer (VSM) probe equipped within the physical property measurement system (PPMS) from Quantum Design. Ribbons were subjected to the previously stated concentrations of HNO3, cleaned using acetone, weighed before and after acid treatment, and then subjected to a magnetic field of varying strength from −300 Oe to 300 Oe. From this data, the hysteresis loops of the ribbons along with the change in saturation magnetization were obtained before and after acid treatment.
3. Results and Discussion
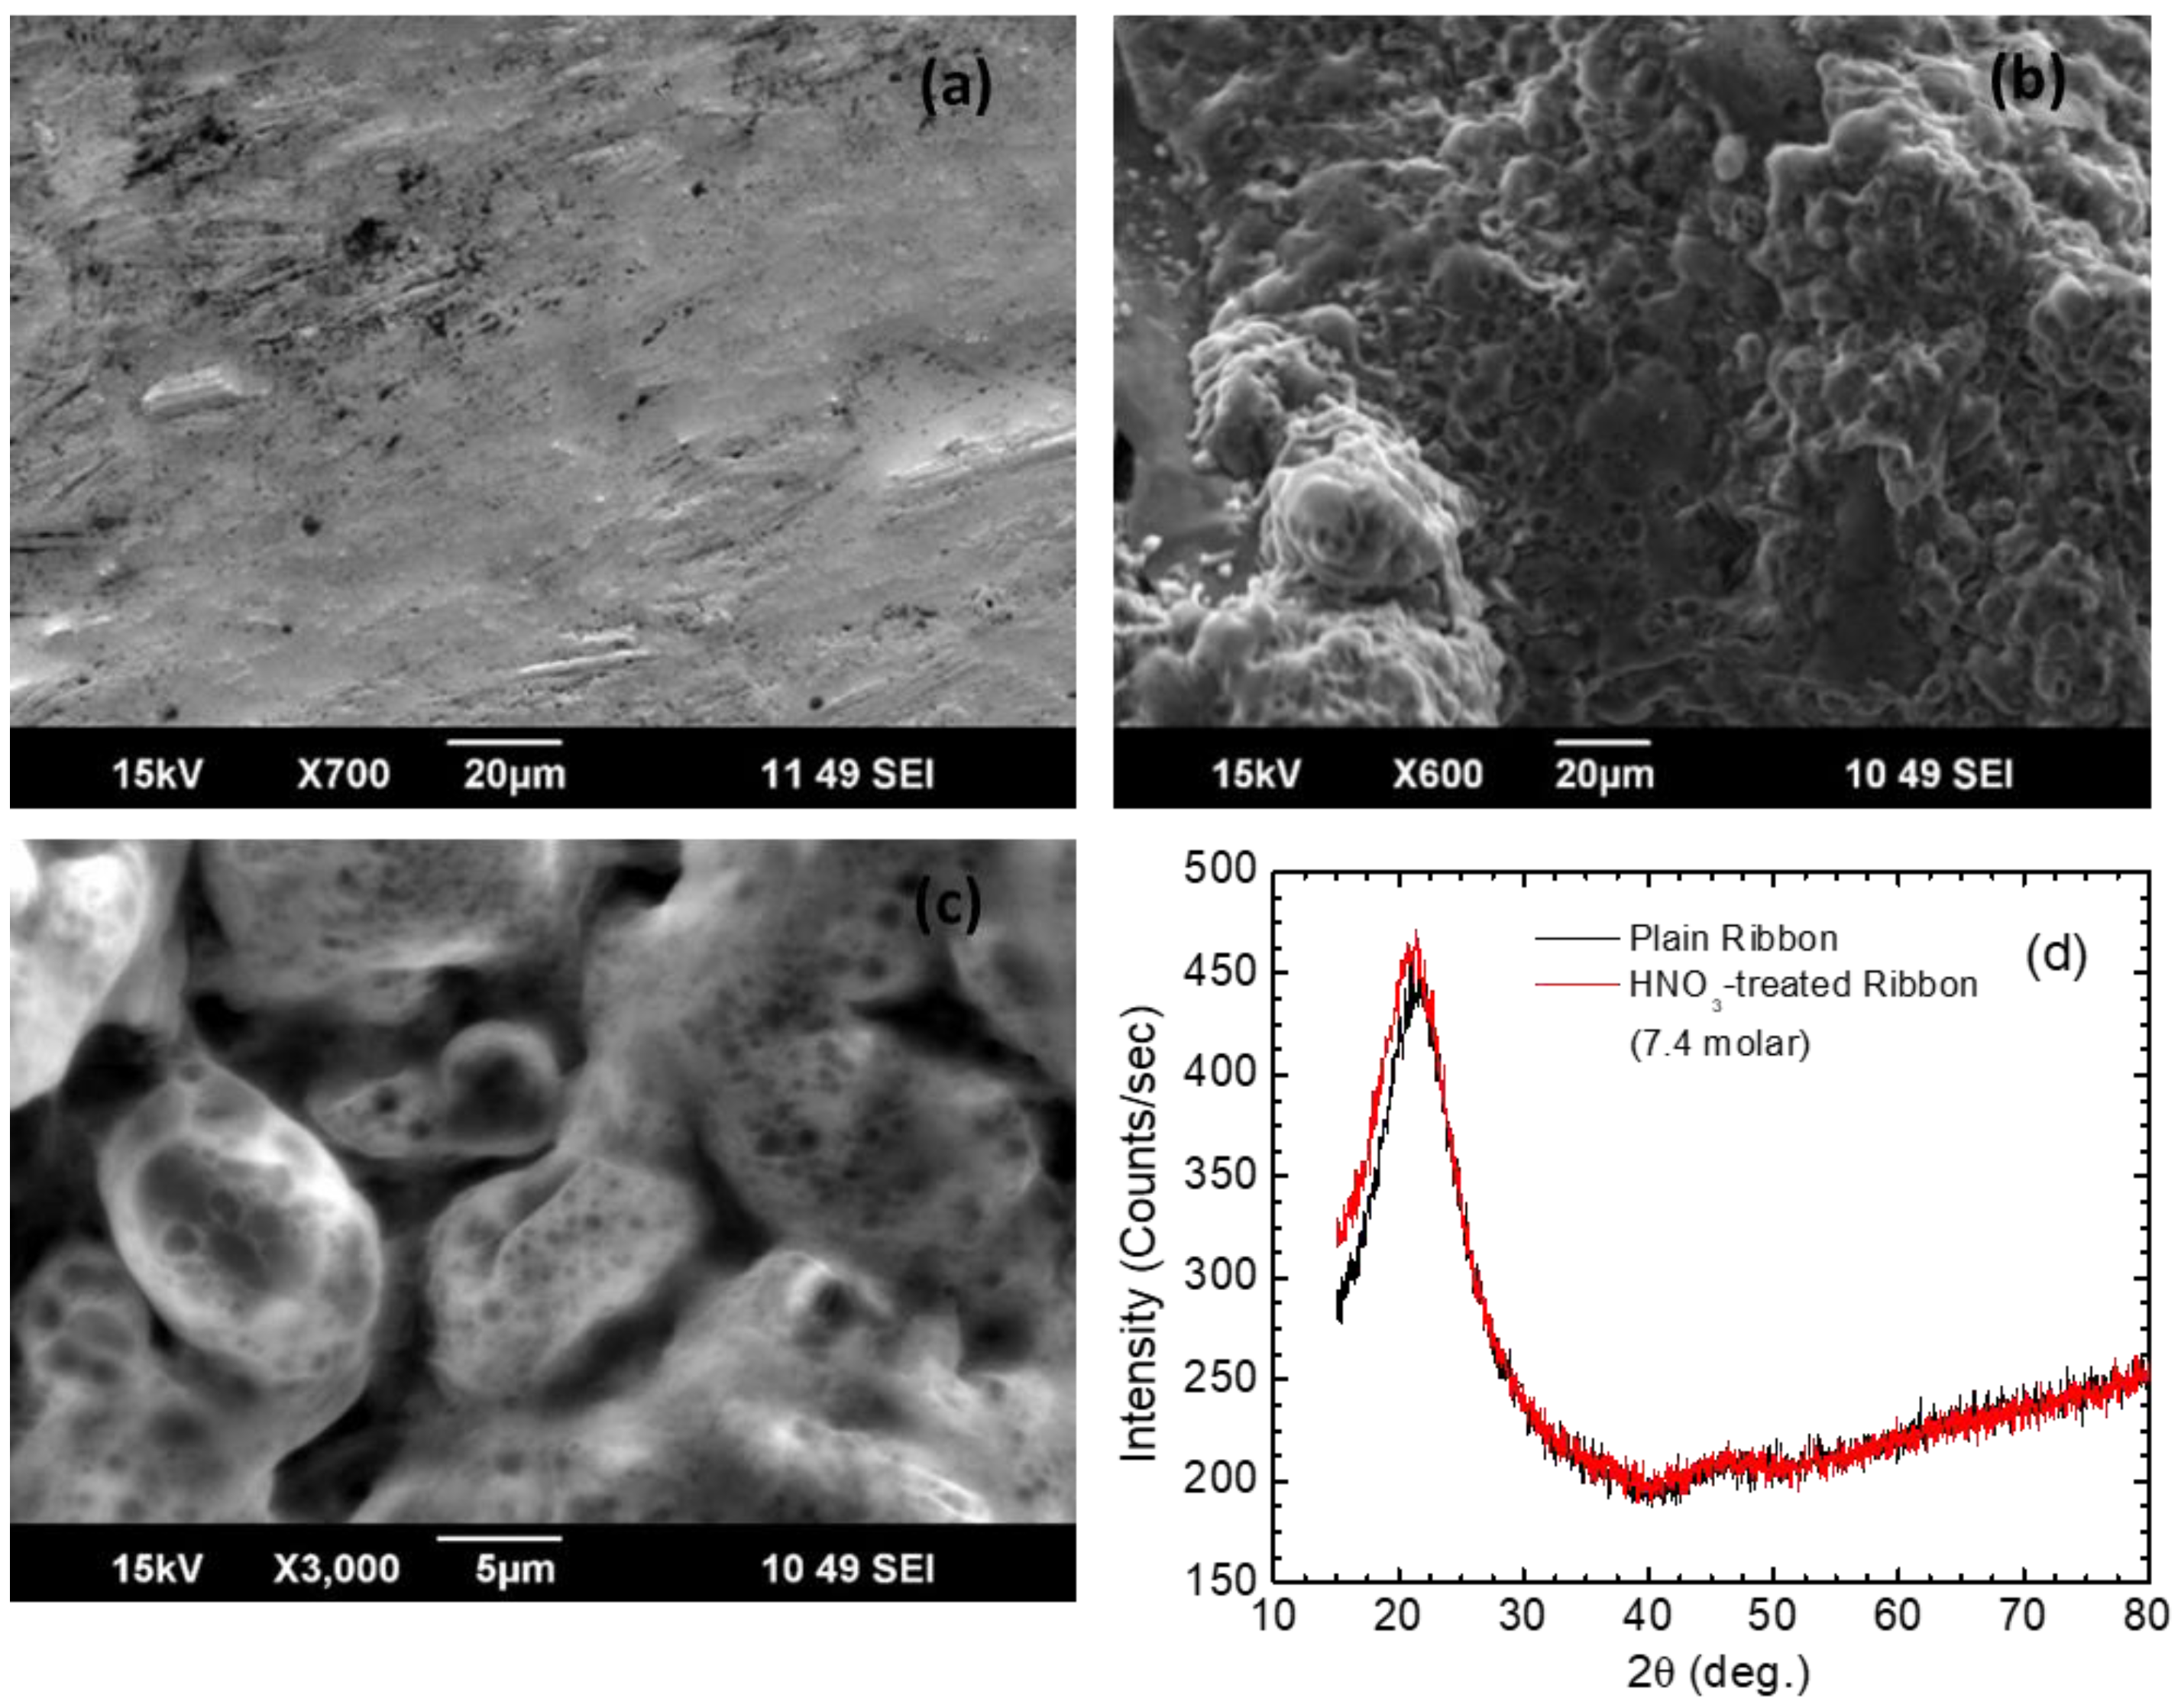
Figure 2a–d shows the images obtained from the SEM and XRD studies. Since in real time the nitric acid is not wiped off of the ribbon, the results shown are only of the images where the acid was also not wiped off. It can be seen that the surface of the ribbon experienced significant corrosion from the acid, as well as produced a significant amount of metal oxide in response to the acid treatment (Figure 2b,c). This in turn can change the geometry and magnetic properties of the ribbon, leading to a change in impedance. No structural change in the ribbons was observed by the XRD study (Figure 2d). These results suggested that the change in impedance of the ribbons was most likely a product of a change to the magnetic permeability brought about by the nitric acid’s corrosion of the surface, along with a change in the topography of the ribbon, which effects the resistivity. According to the above equations, the frequency range chosen for the ac signal would also affect the sensitivity of the sensor as well. SEM images showed changes to the morphology of the ribbon, which decreases the area A—thus, assuming the change in R is small compared to the area, decreasing the resistivity. It would seem a reasonable assumption for the change in impedance to be dependent on the frequency, geometry, and magnetic permeability.
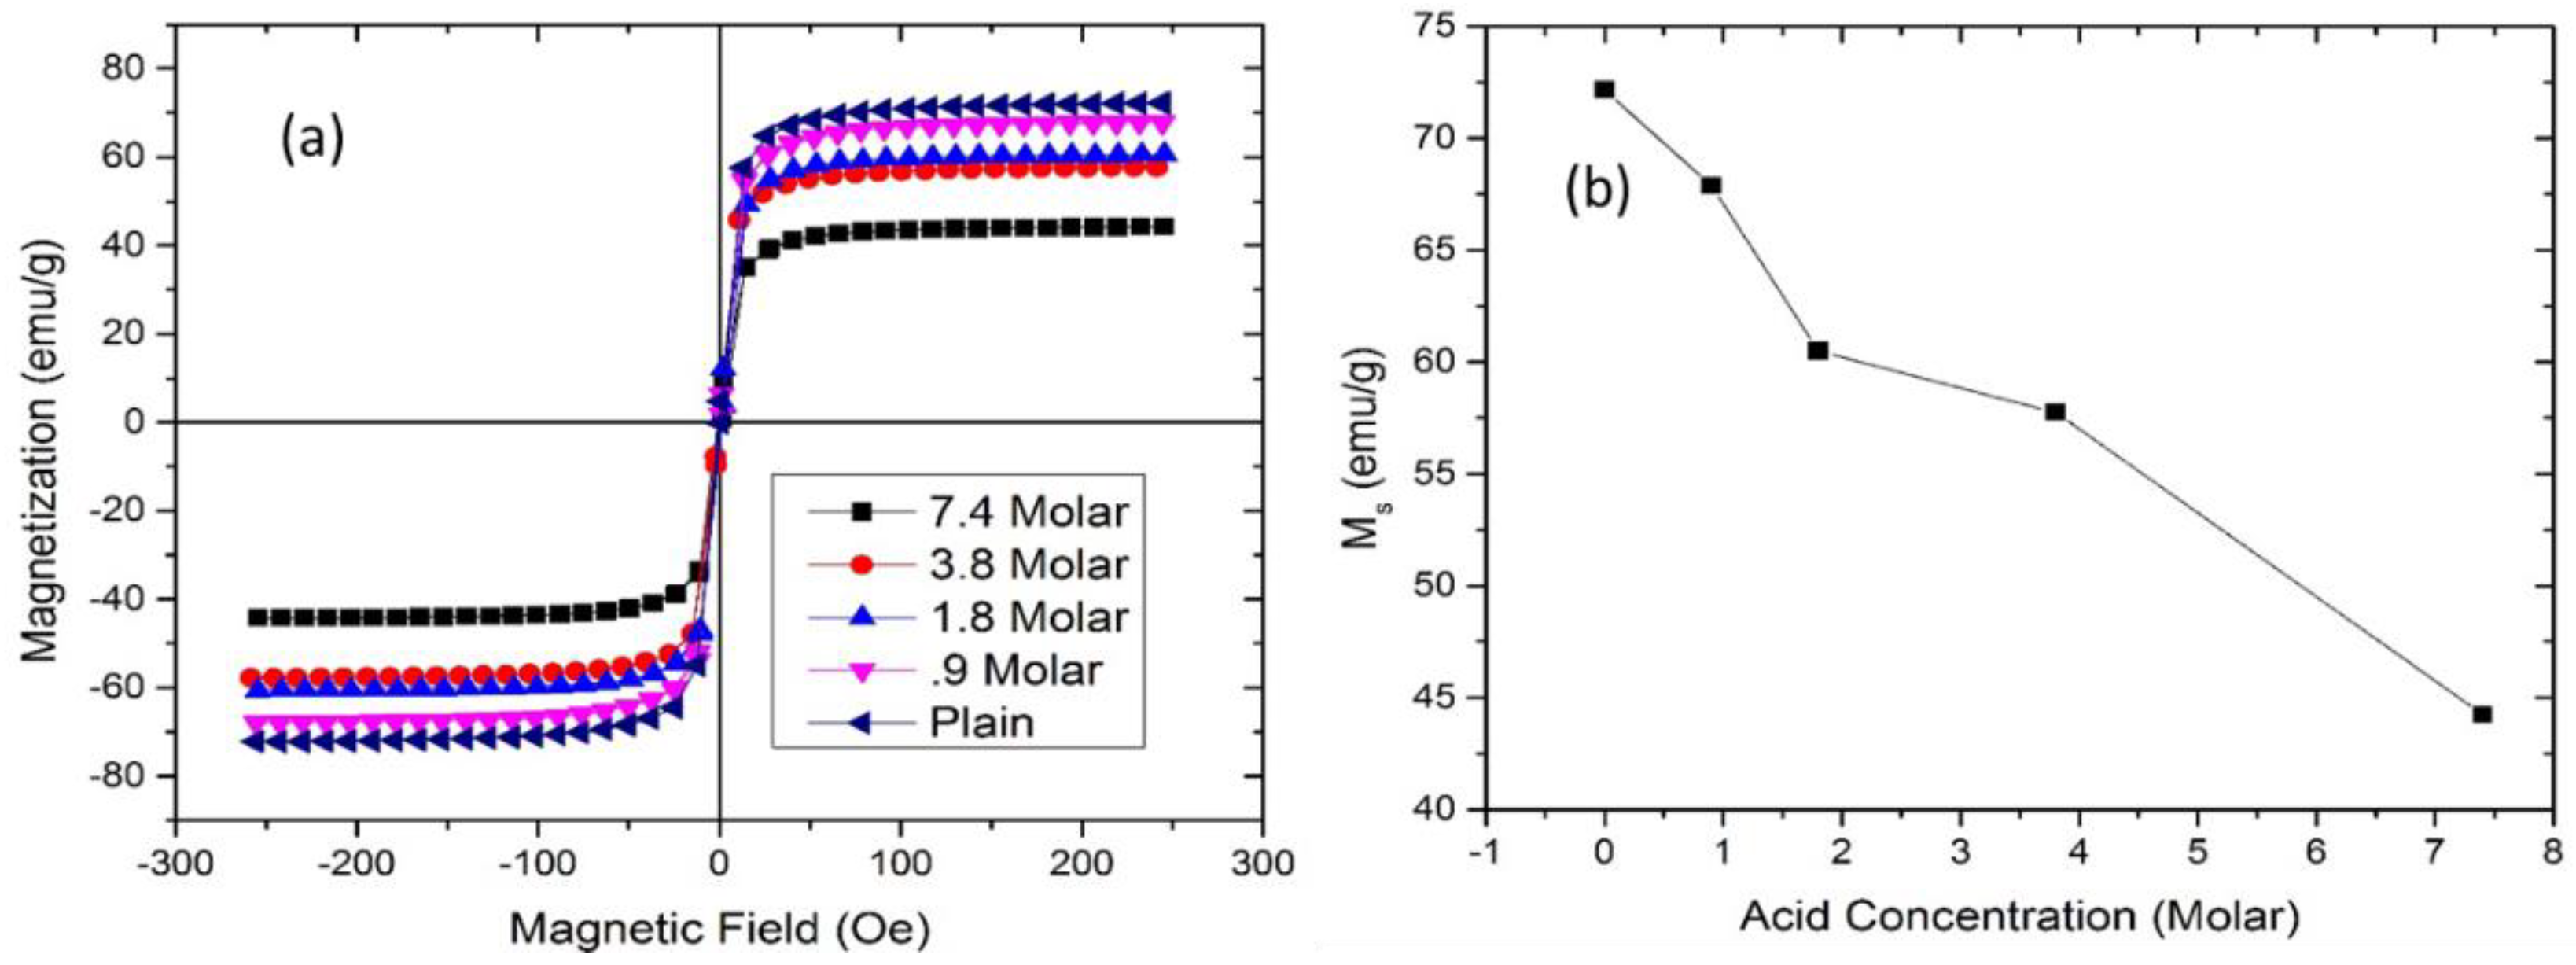
The results from the PPMS furthered the legitimacy of this assumption by showing a decrease in saturation magnetization (MS) for the ribbon as a function of acid concentration, which can be seen in Figure 3a,b. It can be seen that while the saturation magnetization decreased, no obvious effect existed on the magnetic coercivity or anisotropy of the ribbon. The decrease in MS has been previously reported for acid-treated ribbons with increases in acid concentration [16,17].
The frequency dependence was also tested for the impedance-based sensor (not shown), where the acid concentration used to test the frequency dependence was 7.4 M due to its large effects on the topography of the ribbon. It was found that the data using frequencies above 2 MHz possessed high amounts of noise, making its reliability questionable. For this reason, a frequency of 0.2 MHz was chosen to conduct the rest of the studies, as it exhibited low noise and accurate data. Our previous GMI study [16] has shown 2 MHz to be the optimal frequency of measurement, and further research with improved noise correction should be conducted to investigate the legitimacy of this frequency when applied to this specific sensor.
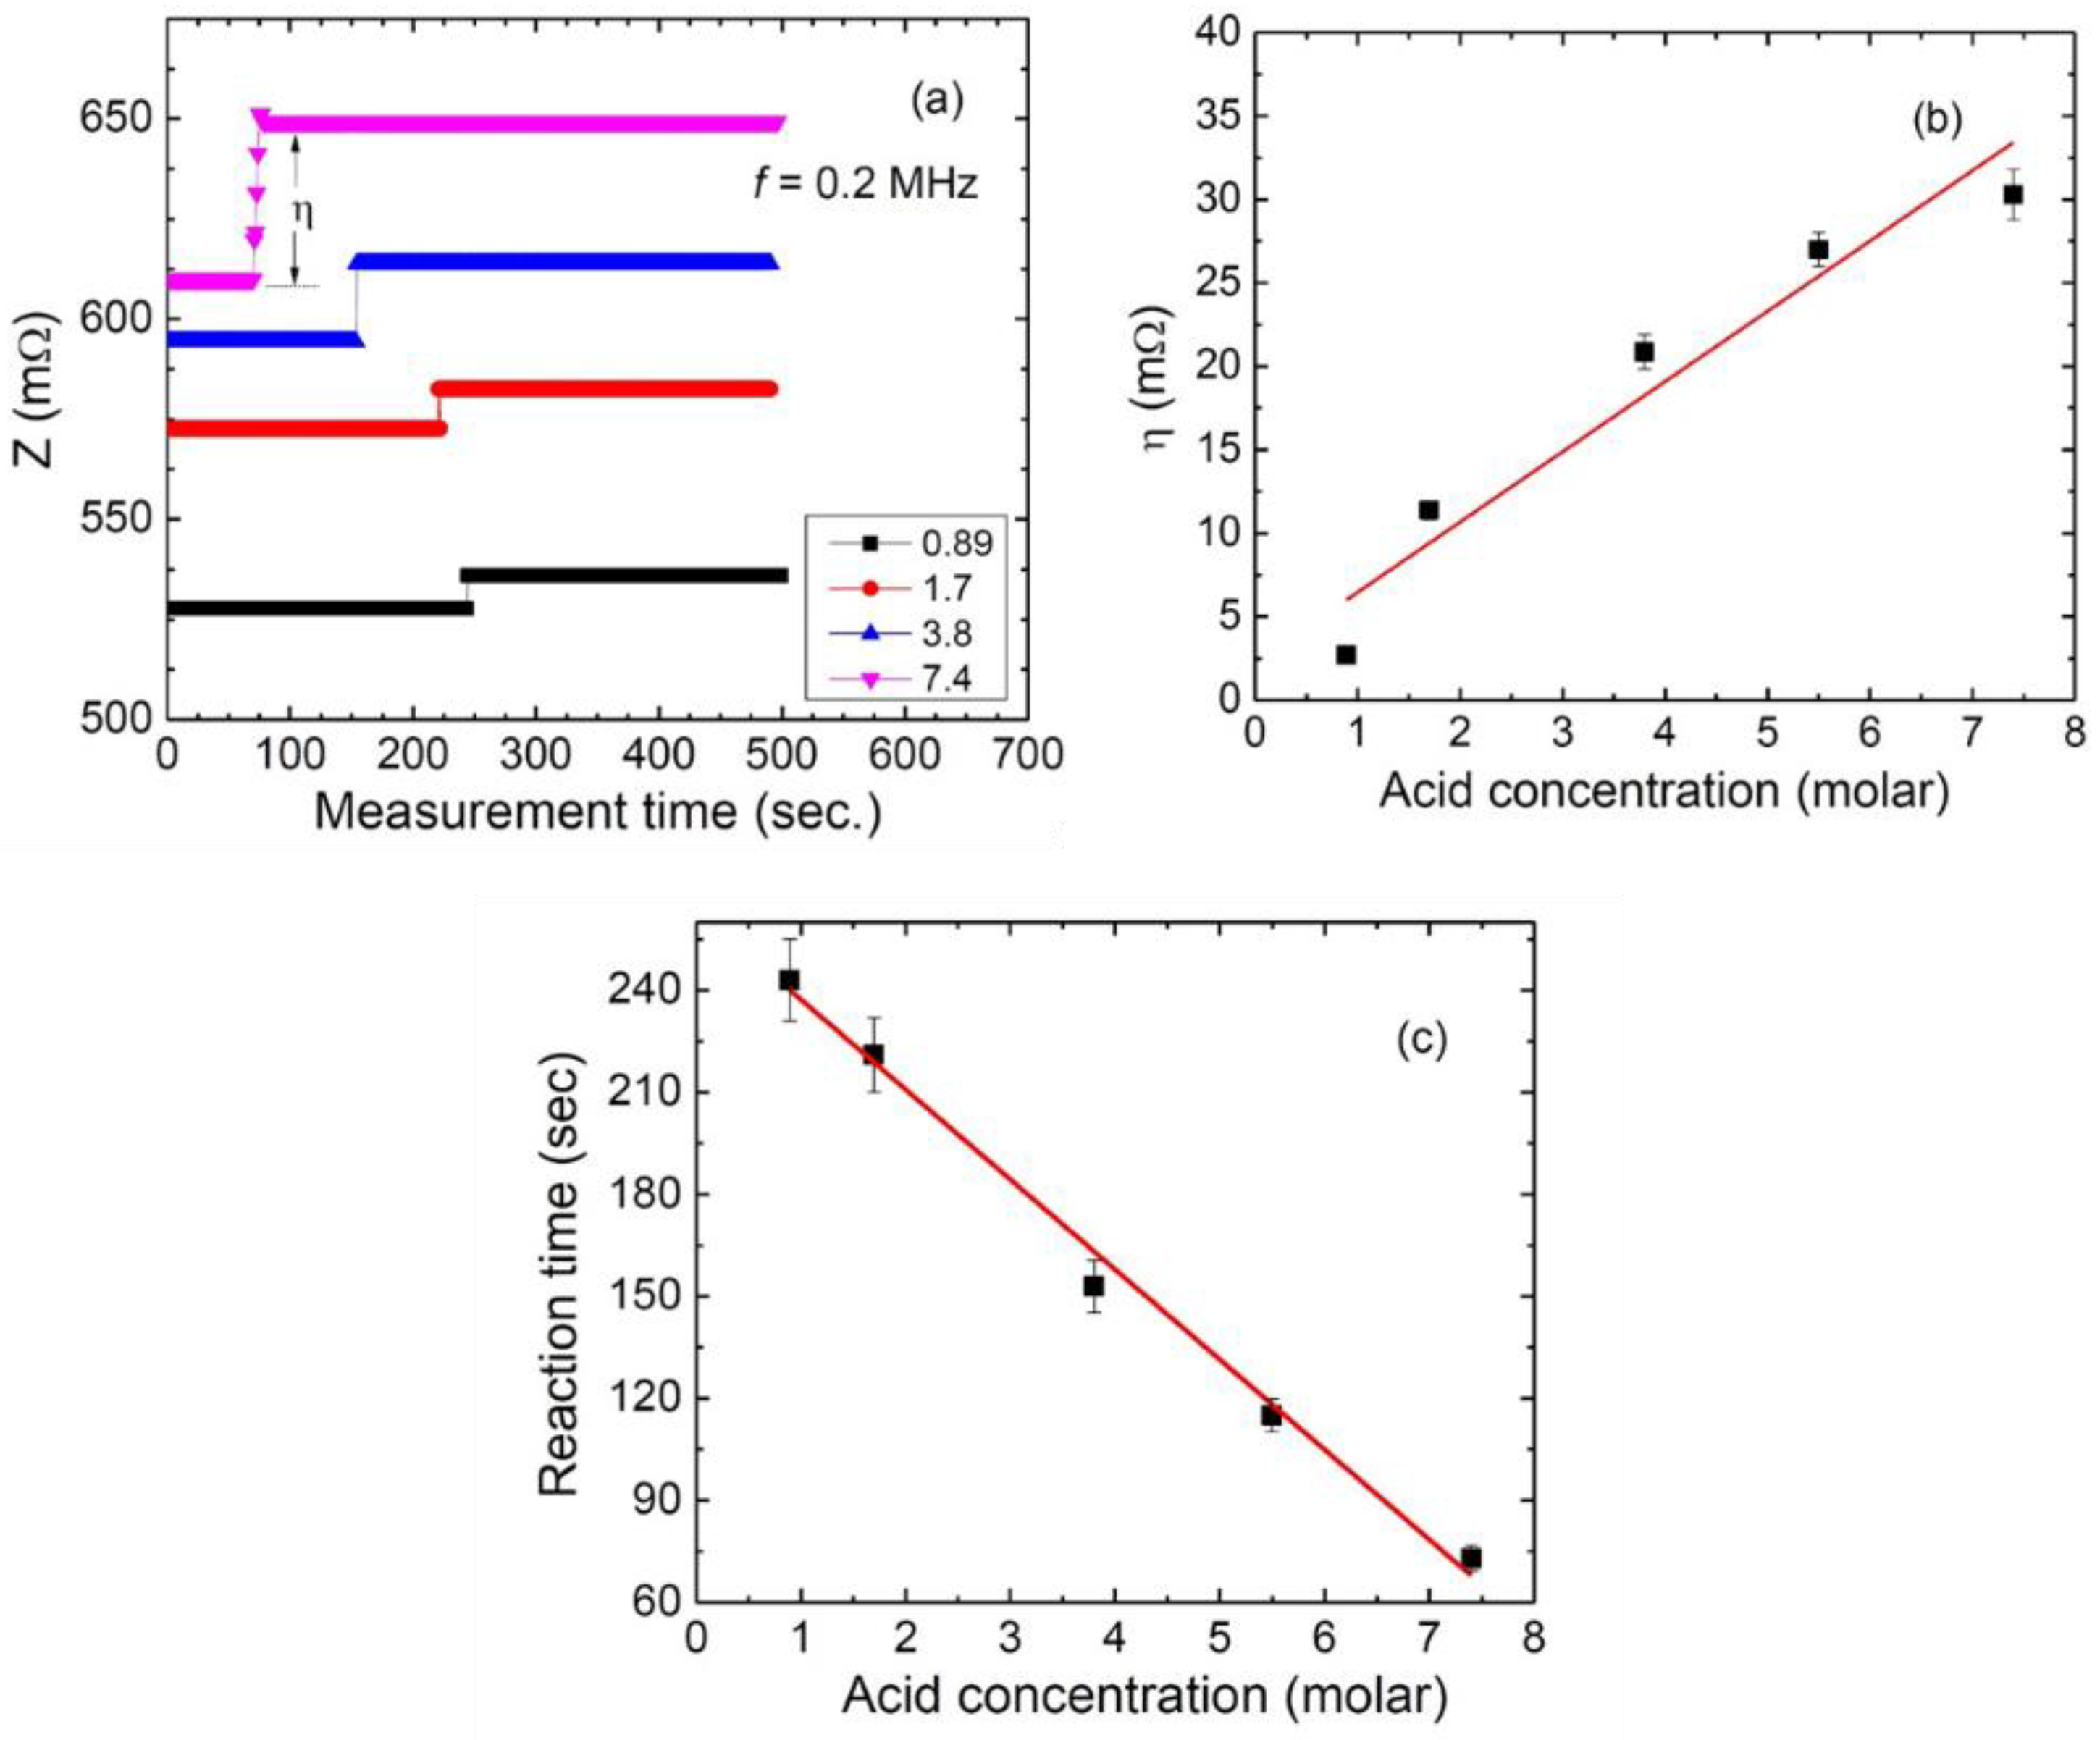
Figure 4a–c shows the results of the impedance testing performed as a function of the acid concentration, using the chosen frequency of 0.2 MHz. Figure 4a shows the change in impedance as a function of time for different acid concentrations. It is clearly seen that as the acid concentration increases, the sensitivity of the sensor increases as well—indicating efficient sensing capability. Figure 4b shows a graph of the sensor sensitivity, , as a function of acid concentration. In Figure 4b, a large slope is observed for the lower acid concentration, which lessens as the concentration increases—indicating a possible limit to the damage obtained on the ribbon from the acid. The linear fit (which was performed using an Origin function) on the graph indicates that the sensor in question would yield accurate and sensitive results for chemical sensing when properly calibrated, as well as functioning in a simple, easy-to-use manner for all users. It should be noticed that although the initial value of the impedance of ribbon used for each test was slightly different (Figure 4a), this did not affect the accuracy of the sensor, as we considered the change in impedance (not the absolute value of the impedance) due to chemical corrosion.
The spacing between the two copper wires that supplied the current to the ribbon was also found to influence the sensitivity of the sensor. As the reaction time of the HNO3 increased at lower concentrations, the acid was provided with more time to expand than at higher concentrations. Due to this occurrence, interference between the wires and acid was observed for separations of less than 20 mm, leading to 20 mm being the ideal amount of separation for the wires. It was found that the reaction time of the change in impedance also yielded important information on the concentrations of corrosive chemicals and showed an almost linear decrease in reaction time as the acid concentration grew (Figure 4c); therefore, this aspect of the sensor can simultaneously be used as a sensing unit as well.
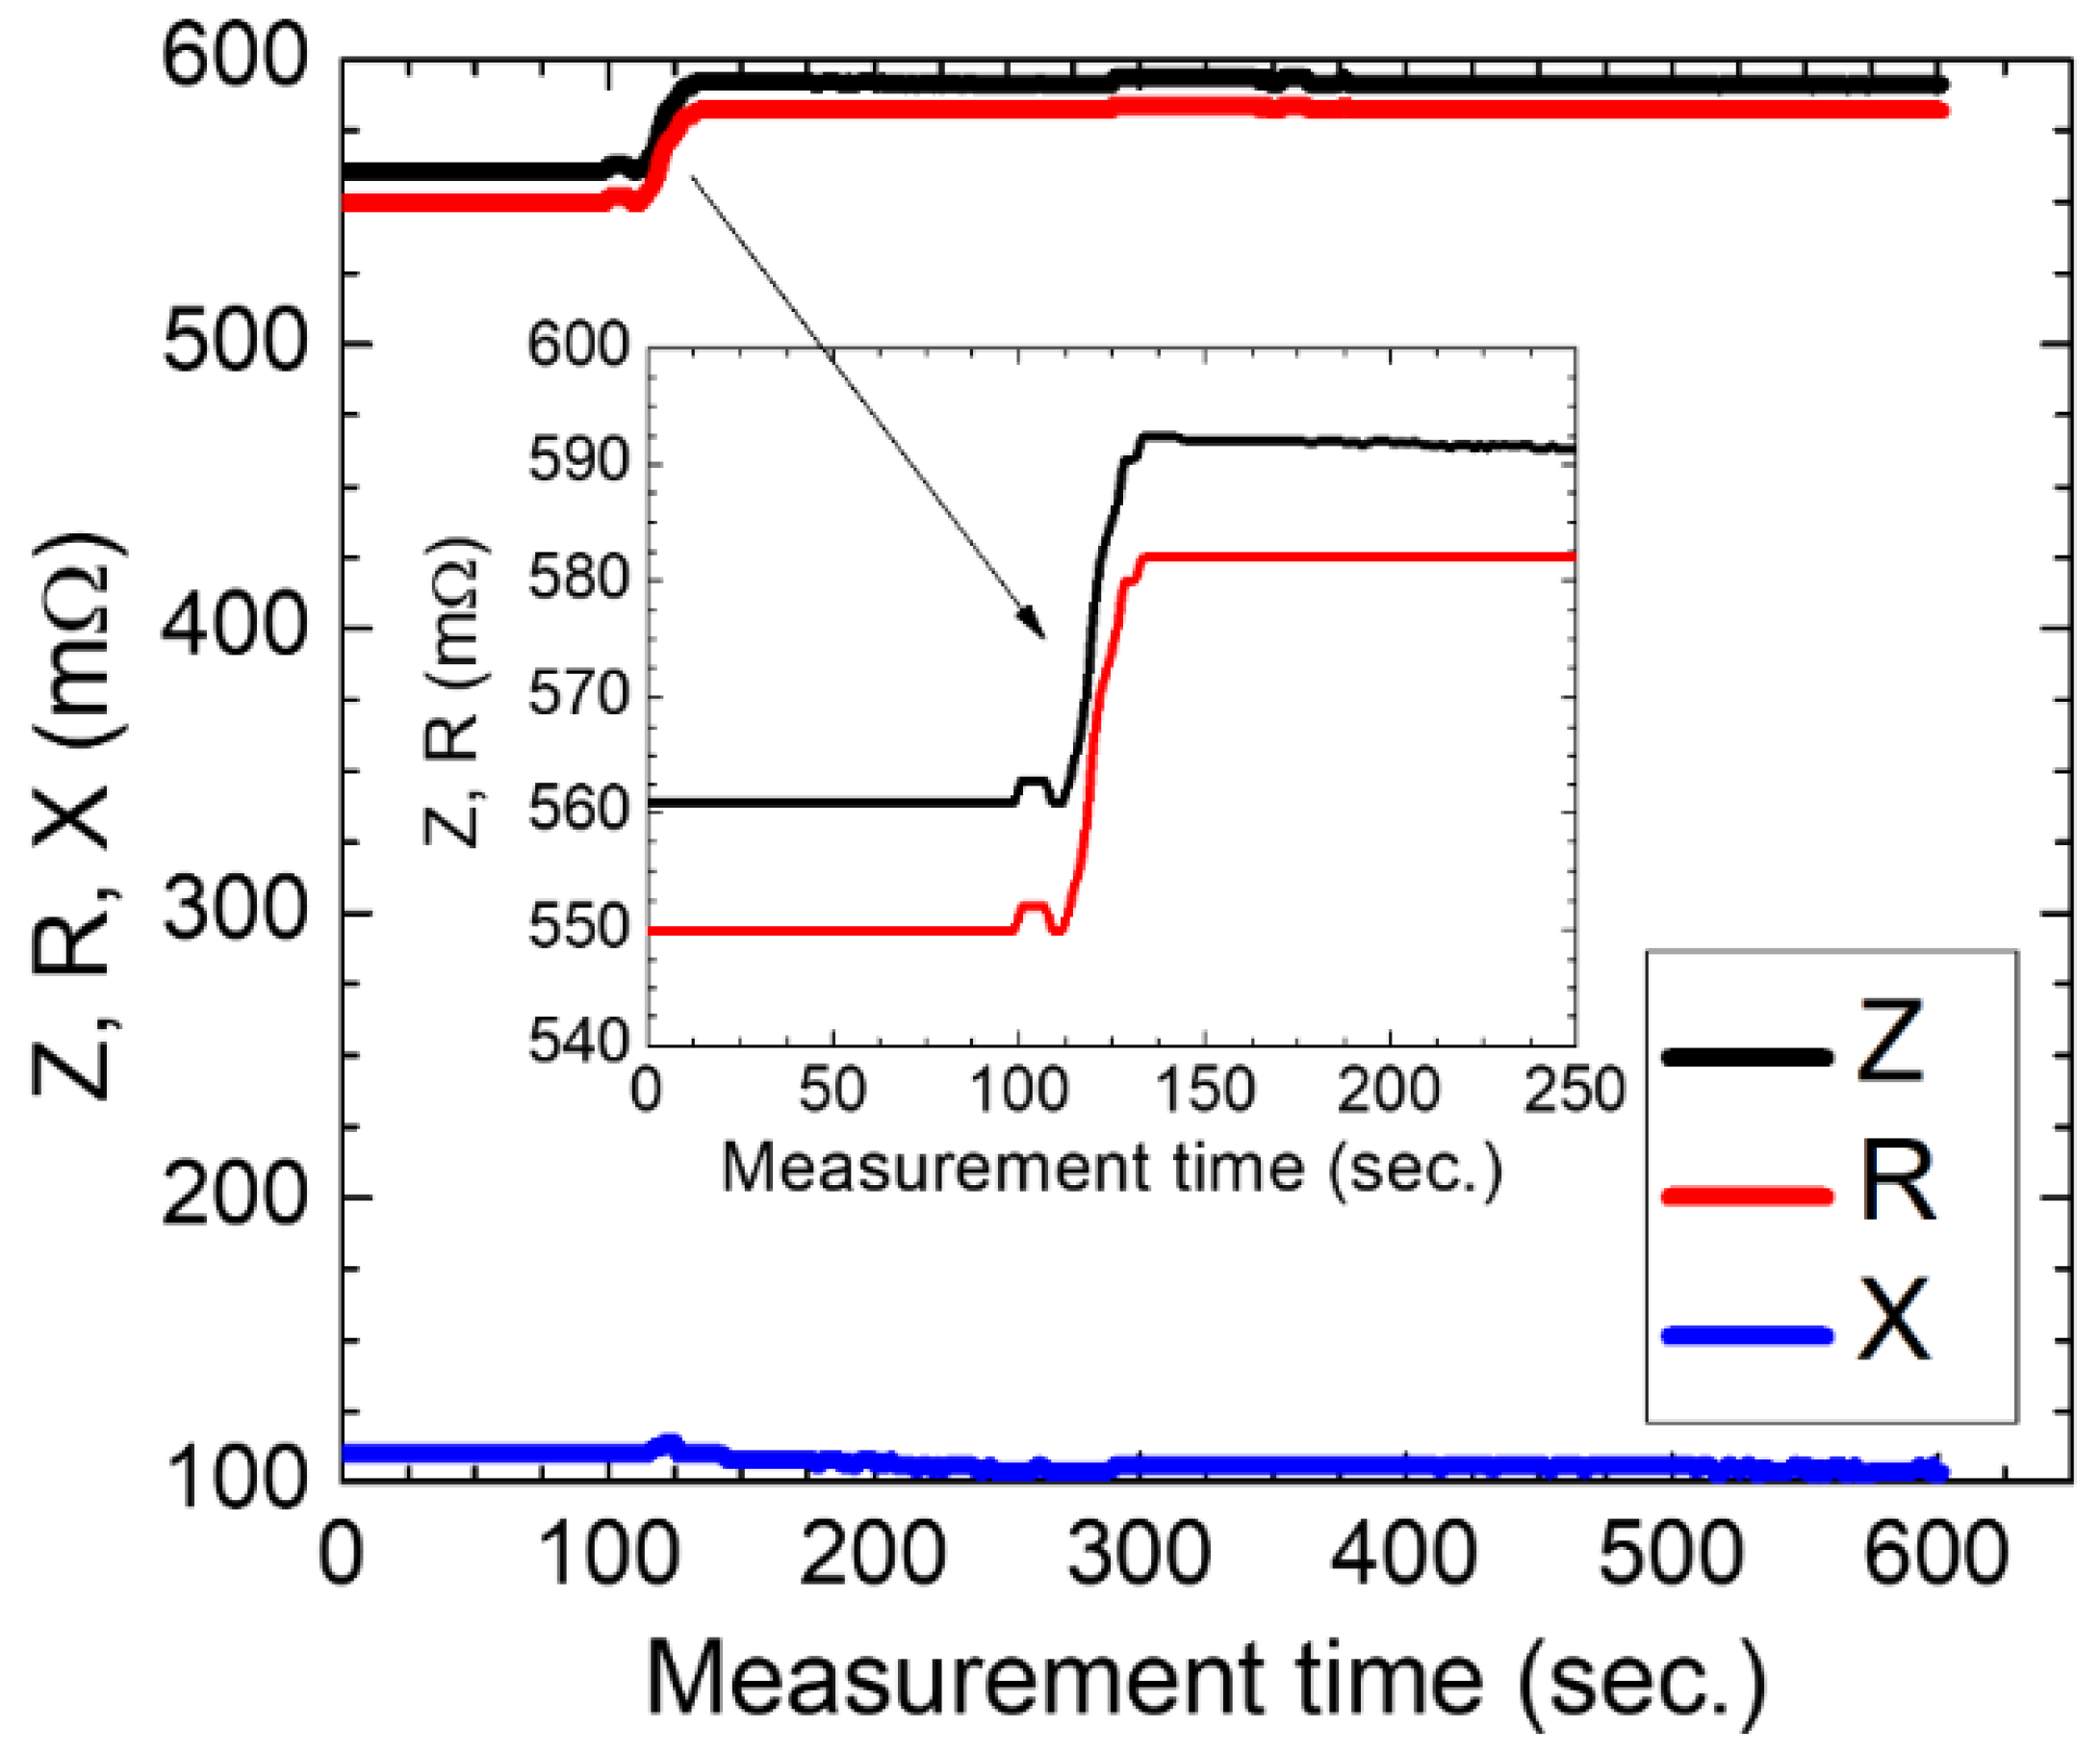
It is generally known that the ac impedance (Z) consists of its real (R, ac resistance) and imaginary (X, reactance) parts [18]. A fundamental question thus emerges as to how R and X were altered subject to the acid treatment. We found that although the saturation magnetization MS (also the magnetic permeability) decreased significantly with an increase in acid concentration (Figure 3b), leading to the corresponding changes in magnetic reactance (X), the contribution of the change in X to the change in Z was insignificant (Figure 5). It can be clearly seen in Figure 5 that the impedance was mostly resistive in this sensor, and thus provided the main contribution to the sensitivity—as was observed from the impedance analyzer data. The change in Z due to the chemical corrosion nearly corresponded to the change in R; this fact supports further investigation of a more sensitive outcome at higher frequencies than looked at in this study.
An impedance-based corrosive chemical sensor to be used with liquid corrosive chemicals is a novel addition to the field of impedance-based sensors [18,19]. Many sensors have been constructed for use in the medical field as biosensors for drug delivery and cancer monitoring [18,19,20,21]. Many more have been constructed using impedance spectroscopy for chemical detection in the atmosphere, but usually using non-conductive, non-magnetic materials. GMI effects have been studied with applications in corrosive chemical sensors [13,14,15,16,17], and while GMI techniques are known for their sensitivity, they also require an external magnetic field and often a reference probe. The design of our new chemical sensor is easy to use and construct and has the potential to be more cost effective and energy efficient than GMI chemical sensors due to its ability to function with no external magnetic field or chemicals, while also operating without any form of reference probe. The exploitation of GMI sensitivity in conjunction with the simplicity of many electrochemical sensors has brought about a novel impedance-based sensor that can be used to improve safety in many chemical-using industries. Nonetheless, we note that the drop may not be a good measure for the amount as the acid concentration depends on the surface tension of the liquid—so the accuracy of the sensor could be affected by the actual amount of acid placed on the amorphous strip. However, this effect seems less significant in our study, as we observed the linear dependence of the sensor sensitivity (also the reaction time) with respect to acid concentration (Figure 4b,c). We found that when identical ribbons were used for chemical tests, the obtained results were almost the same; this indicates that the use of identical ribbons in our sensor is necessary for chemical sensing applications. It should also be noted that the results presented in this study refer to the corrosion produced by HNO3, which is a strong acid, in order to demonstrate the proof-of-concept of our chemical sensor. Comprehensive tests on different and less corrosive substances such as perfluorooctanoic acid would be useful to see the sensitivity of the sensor and its limitations. The uncontrollable use of perfluorooctanoic acid in household and industrial applications might negatively impact human health and our living environment [4], so real-time monitoring of perfluorooctanoic acid’s effects is becoming increasingly important. All this warrants further studies. From other application perspectives, the presently developed sensor might be combined with other electronic devices to test iron level changes in blood of patients diagnosed with diabetes, COVID-19, and other related diseases.
4. Conclusions
We have proposed a new approach based on radio-frequency impedance technology and soft ferromagnetic ribbons for the real-time monitoring of chemical corrosion. A large change in the ac impedance with increasing acid concentrations has been found, demonstrating the possibility of developing disposable chemical sensors for the strength estimation of corrosive chemicals such as HNO3. Since the ribbon used is commercially available at a low cost and as the measurement system is quick and low power-consuming, the proposed sensor can be used as an easy, quick, and low-cost chemical probe in industry and for environmental safety purposes.
Author Contributions
Conceptualization, I.B., J.D., M.-H.P.; methodology, I.B., J.D. and K.Y.H.; software, J.D.; validation, I.B., J.D. and M.-H.P.; formal analysis, I.B., J.D.; investigation, I.B., J.D.; resources, M.-H.P.; writing—original draft preparation, I.B.; writing—review and editing, I.B., J.D. and M.-H.P.; supervision, M.-H.P.; funding acquisition, M.-H.P. All authors have read and agreed to the published version of the manuscript.
Funding
The authors acknowledge support from the USF research foundation (Grant number: 125300). I.B also acknowledges support from the USF-NSF REU program (Grant number: DMR-1263066).
Institutional Review Board Statement
Not required.
Informed Consent Statement
Not required.
Data Availability Statement
Upon request.
Conflicts of Interest
The authors declare no conflict of interest.
References
- Banica, F.G. Chemical Sensors and Biosensors: Fundamentals and Applications; John Wiley & Sons, Ltd.: Hoboken, NJ, USA, 2012; pp. 367–403. [Google Scholar]
- Janata, J. Electrochemical Sensors and Their Impedances: A Turtorial. Crit. Rev. Anal. Chem. 2002, 32, 109–120. [Google Scholar] [CrossRef]
- Ye, W.; Guo, J.; Chen, S.; Yang, M. Nanoporous membrane based impedance sensors to detect the enzymatic activity of botulinum neurotoxin A. J. Mater. Chem. B 2013, 1, 6544–6550. [Google Scholar] [CrossRef] [PubMed]
- Suhaimi, N.F.; Baharin, S.N.A.; Jamion, N.A.; Zain, Z.M.; Sambasevam, K.P. Polyaniline-chitosan modified on screen-printed carbon electrode for the electrochemical detection of perfluorooctanoic acid. Microchem. J. 2023, 188, 108502. [Google Scholar] [CrossRef]
- Sambasevam, K.P.; Sateria, S.F.; Baharin, S.N.A.; Azman, N.J.; Wakid, S.A.; Shahabuddin, S. An optimization of fungal chitin grafted polyaniline for ammonia gas detection via Box Behnken design. Int. J. Biol. Macromol. 2023, 238, 124079. [Google Scholar] [CrossRef] [PubMed]
- Liu, L.; Li, X.; Dutta, P.K.; Wang, J. Room temperature impedance spectroscopy-based sensing of formaldehyde with porous TiO2 under UV illumination. Sens. Actuators B Chem. 2013, 185, 1–9. [Google Scholar] [CrossRef]
- Kummer, A.M.; Hierlemann, A.; Baltes, H. Tuning Sensitivity and Selectivity of Complementary Metal Oxide Semiconductor-Based Capacitive Chemical Microsensors. Anal. Chem. 2004, 76, 2470–2477. [Google Scholar] [CrossRef] [PubMed]
- Suni, I.I. Impedance methods for electrochemical sensors using nanomaterials. TrAC 2008, 27, 604–611. [Google Scholar] [CrossRef]
- Johnson, A.M.; Sadoway, D.R.; Cima, M.J.; Langer, R. Design and Testing of an Impedance-Based Sensor for Monitoring Drug Delivery. J. Electrochem. Soc. 2005, 152, H6–H11. [Google Scholar] [CrossRef]
- Josse, F.; Lukas, R.; Zhou, R.; Schneider, S.; Everhart, D. AC-impedance-based chemical sensors for organic solvent vapors. Sens. Actuators B Chem. 1996, 35–36, 363–369. [Google Scholar] [CrossRef]
- Chan, C.Y.; Guo, J.; Sun, C.; Tsang, M.K.; Tian, F.; Hao, J.; Chen, S.; Yang, M. A reduced graphene oxide-Au based electrochemical biosensor for ultrasensitive detection of enzymatic activity of botulinum neurotoxin A. Sens. Actuators B Chem. 2015, 220, 131–137. [Google Scholar] [CrossRef]
- Jiang, J.; Wang, X.; Chao, R.; Ren, Y.; Hu, C.; Xu, Z.; Liu, G.L. Cellphone based Portable Bacteria Pre-Concentrating microfluidic Sensor and Impedance Sensing System. Sens. Actuators B 2014, 193, 653. [Google Scholar] [CrossRef]
- Kurlyandskaya, G.V.; Fal Miyar, V.; Saad, A.; Asua, E.; Rodriguez, J. Giant magnetoimpedance: A label-free option for surface effect monitoring. J. Appl. Phys. 2007, 101, 054505. [Google Scholar] [CrossRef]
- Kurlyandskaya, G.V.; Miyar, V.F. Surface modified amorphous ribbon based magnetoimpedance biosensor. Biosens. Bioelectron. 2007, 22, 2341–2345. [Google Scholar] [CrossRef] [PubMed]
- Marzo, F.F.; Pierna, A.R.; Barranco, J.; Lorenzo, A.; Barroso, J.; García, J.A.; Pérez, A. Determination of trace metal release during corrosion characterization of FeCo-based amorphous metallic materials by stripping voltammetry. New materials for GMI biosensors. J. Non. Cryst. Solids 2008, 354, 5169–5171. [Google Scholar] [CrossRef]
- Devkota, J.; Huong, N.T.; Srikanth, H.; Phan, M.H. Magneto-impedance Based Probe of Various Concentrations of Corrosive Chemicals. IEEE Trans. Magn. 2014, 50, 1–4. [Google Scholar]
- Kotagiri, G.; Markandeyulu, G.; Doble, M.; Nandakumar, V. Magnetoimpedance studies on urine treated Co66Ni7Si7B20 ribbons. J. Magn. Magn. Mater. 2015, 394, 309–317. [Google Scholar] [CrossRef]
- Phan, M.H.; Peng, H.X. Giant magnetoimpedance materials: Fundamentals and applications. Prog. Mater. Sci. 2008, 53, 395–405. [Google Scholar] [CrossRef]
- Thiabgoh, O.; Eggers, T.; Phan, M.H. A new contactless magneto-LC resonance technology for real time respiratory motion monitoring. Sens. Actuators A Phys. 2017, 265, 120. [Google Scholar] [CrossRef]
- Devkota, J.; Howell, M.; Mohapatra, S.; Mukherjee, P.; Srikanth, H.; Phan, M.H. Magneto-reactance based detection of MnO nanoparticle-embedded Lewis lung carcinoma cancer cells. J. Appl. Phys. 2015, 117, 17D123. [Google Scholar] [CrossRef]
- Jimenez, V.O.; Hwang, K.Y.; Nguyen, D.; Rahman, Y.; Albrecht, C.; Senator, B.; Thiabgoh, O.; Devkota, J.; Bui, V.D.A.; Lam, D.S.; et al. Magnetoimpedance Biosensors and Real-Time Healthcare Monitors: Progress, Opportunities, and Challenges. Biosensors 2022, 12, 517. [Google Scholar] [CrossRef] [PubMed]
Figure 1.
Schematic of the impedance-based measurement system using a soft ferromagnetic ribbon as a chemical sensing element. Photograph of a four-probe measurement using the ribbon, with arrows indicating the electrical contact areas using silver paint.
Figure 1.
Schematic of the impedance-based measurement system using a soft ferromagnetic ribbon as a chemical sensing element. Photograph of a four-probe measurement using the ribbon, with arrows indicating the electrical contact areas using silver paint.

Figure 2.
SEM images of the (a) untreated and (b,c) acid-treated (7.4 Molar HNO3) ribbons. XRD patterns of the untreated and acid-treated (7.4 Molar HNO3) ribbons with reference to the sample holder; (d) XRD patterns of the untreated and HNO3-treated ribbons.
Figure 2.
SEM images of the (a) untreated and (b,c) acid-treated (7.4 Molar HNO3) ribbons. XRD patterns of the untreated and acid-treated (7.4 Molar HNO3) ribbons with reference to the sample holder; (d) XRD patterns of the untreated and HNO3-treated ribbons.

Figure 3.
(a) Magnetic hysteresis (M–H) loops taken at 300 K for the untreated and acid-treated ribbons for different concentrations; (b) Saturation magnetization is plotted as a function of acid concentration.
Figure 3.
(a) Magnetic hysteresis (M–H) loops taken at 300 K for the untreated and acid-treated ribbons for different concentrations; (b) Saturation magnetization is plotted as a function of acid concentration.

Figure 4.
(a) Changes in the ac impedance (Z) at different acid concentrations as a function of measurement time at a fixed frequency of 0.2 MHz. As the acid concentration increased, a stronger change in impedance could be observed; (b) shows the sensor sensitivity, , as a function of acid concentration. The linear fit displayed on the graph implies reliable and efficient sensing capabilities; (c) shows the reaction time as a function of acid concentration, indicating another potential sensing source from the sensor.

Figure 5.
The impedance, Z, and its components: the resistance, (R) and reactance (X) as a function of measurement time during acid treatment. It can be observed that at the chosen frequency of 0.2 MHz, the main contribution to the sensor sensitivity came from the resistance.
Figure 5.
The impedance, Z, and its components: the resistance, (R) and reactance (X) as a function of measurement time during acid treatment. It can be observed that at the chosen frequency of 0.2 MHz, the main contribution to the sensor sensitivity came from the resistance.

Disclaimer/Publisher’s Note: The statements, opinions and data contained in all publications are solely those of the individual author(s) and contributor(s) and not of MDPI and/or the editor(s). MDPI and/or the editor(s) disclaim responsibility for any injury to people or property resulting from any ideas, methods, instructions or products referred to in the content. |
© 2023 by the authors. Licensee MDPI, Basel, Switzerland. This article is an open access article distributed under the terms and conditions of the Creative Commons Attribution (CC BY) license (https://creativecommons.org/licenses/by/4.0/).
Share and Cite
MDPI and ACS Style
Berman, I.; Devkota, J.; Hwang, K.Y.; Phan, M.-H. A Disposable Soft Magnetic Ribbon Impedance-Based Sensor for Corrosion Monitoring. Appl. Sci. 2023, 13, 6011. https://0-doi-org.brum.beds.ac.uk/10.3390/app13106011
AMA Style
Berman I, Devkota J, Hwang KY, Phan M-H. A Disposable Soft Magnetic Ribbon Impedance-Based Sensor for Corrosion Monitoring. Applied Sciences. 2023; 13(10):6011. https://0-doi-org.brum.beds.ac.uk/10.3390/app13106011
Chicago/Turabian StyleBerman, Izabella, Jagannath Devkota, Kee Young Hwang, and Manh-Huong Phan. 2023. "A Disposable Soft Magnetic Ribbon Impedance-Based Sensor for Corrosion Monitoring" Applied Sciences 13, no. 10: 6011. https://0-doi-org.brum.beds.ac.uk/10.3390/app13106011
Note that from the first issue of 2016, this journal uses article numbers instead of page numbers. See further details here.