
Driver Attention Detection Based on Improved YOLOv5
College of Electrical Information Engineering, Jiangsu University of Technology, Changzhou 213000, China
*
Author to whom correspondence should be addressed.
†
These authors contributed equally to this work.
Appl. Sci. 2023, 13(11), 6645; https://0-doi-org.brum.beds.ac.uk/10.3390/app13116645
Submission received: 26 March 2023
/
Revised: 20 May 2023
/
Accepted: 26 May 2023
/
Published: 30 May 2023
(This article belongs to the Collection Advances in Image Processing, Analysis and Recognition Technology)
Abstract
:In response to negative impacts such as personal and property safety hazards caused by drivers being distracted while driving on the road, this article proposes a driver’s attention state-detection method based on the improved You Only Look Once version five (YOLOv5). Both fatigue and distracted behavior can cause a driver’s attention to be diverted during the driving process. Firstly, key facial points of the driver are located, and the aspect ratio of the eyes and mouth is calculated. Through the examination of relevant information and repeated experimental verification, threshold values for the aspect ratio of the eyes and mouth under fatigue conditions, corresponding to closed eyes and yawning, are established. By calculating the aspect ratio of the driver’s eyes and mouth, it is possible to accurately detect whether the driver is in a state of fatigue. Secondly, distracted abnormal behavior is detected using an improved YOLOv5 model. The backbone network feature extraction element is modified by adding specific modules to obtain different receptive fields through multiple convolution operations on the input feature map, thereby enhancing the feature extraction ability of the network. The introduction of Swin Transformer modules in the feature fusion network replaces the Bottleneck modules in the C3 module, reducing the computational complexity of the model while increasing its receptive field. Additionally, the network connection in the feature fusion element has been modified to enhance its ability to fuse information from feature maps of different sizes. Three datasets were created of distracting behaviors commonly observed during driving: smoking, drinking water, and using a mobile phone. These datasets were used to train and test the model. After testing, the mAP (mean average precision) has improved by 2.4% compared to the model before improvement. Finally, through comparison and ablation experiments, the feasibility of this method has been verified, which can effectively detect fatigue and distracted abnormal behavior.
1. Introduction
In recent years, with the continuous improvement of China’s industrial level and degree of intelligence, its social and economic levels have developed rapidly, and at the same time, the number of vehicles has also been increasing day by day. With the growth of China’s transportation network, traffic accidents are becoming more and more frequent, which brings great safety hazards to people’s daily travel and even affects people’s life and property safety to a great extent. Among many traffic accidents, distracted driving is one of the important issues in road traffic safety [1]. According to investigations conducted by relevant departments, distracted driving is the main cause of traffic accidents, particularly in major accidents, where this proportion is even higher. In heavy traffic accidents, it accounts for about 43% of the causes, and in large trucks and on highways, it accounts for 37% [2]. If distracted behaviors such as smoking or using a mobile phone cause drivers to take their eyes off the road during high-speed driving, there is a high probability that this could lead to personal injury and property damage [3]. Distracted driving includes fatigued driving behavior and distracted driving behavior, of which fatigued driving behavior is clearly described in Chinese road traffic safety law. A driver is considered fatigued if they have been continuously and uninterruptedly driving the vehicle for more than 4 h [4]. Distracted driving behavior refers to those where drivers turn their attention to activities unrelated to driving, including visual distraction and cognitive distraction, which are dangerous behaviors that result in the loss of decision-making and operational ability of drivers [5].
In addition, in current important industrial processes, it is also necessary to maintain the attention of the monitoring personnel to avoid accidents in the production process, resulting in unnecessary waste of materials and economic losses. Among them, the main causes of inattention are distraction and fatigue. Common distracted behaviors mainly include smoking, drinking water, using mobile phones, etc. The use of mobile phones in particular causes distraction to a large extent. The driving process and industrial production process carry safety risks. Fatigue makes it difficult for people to concentrate, which will also have a great impact on the current work. Therefore, to avoid the occurrence of potential accidents, it is important to further attention detection of personnel in daily production and life, especially in road traffic safety. At present, unmanned driving and intelligent assisted driving technology have been widely used. When detecting the driver’s distraction, timely assisted driving can prevent many traffic accidents.
Currently, there are two main methods of personnel attention detection: detection methods based on wearable devices and detection methods based on machine vision. Detection methods based on wearable devices collect physiological signals such as electroencephalograms [6], electrocardiograms, and electromyograms [7] of the tested person through medical detection equipment, which can directly reflect the physical state of the tested personnel with high accuracy. However, due to the limited number of use scenarios, this kind of wearable device has low applicability, complicated operation, and high cost, which may seriously affect the accuracy of detection in practical work. Detection methods based on machine vision are used to analyze the facial features of the tested personnel to judge whether their attention is diverted. This non-contact detection method has higher real-time performance than wearable detection and is more convenient and cost-effective in the detection process [8]. With the increasing maturity of machine vision and deep learning technologies, the use of machine vision-based methods for detecting targets is currently a hot research topic. In the field of object detection, Liu et al. [9] proposed a YOLOv3 model with four detection layers to automatically identify pavement gaps, which adopted a multi-scale fusion structure to improve detection performance. Wang et al. [10] proposed a YOLOv3 object detection method that integrates data augmentation and structural optimization. They optimized the model using residual networks and the CIoU loss function, resulting in an overall improvement in mean average precision (mAP) on the test dataset. Wu et al. [11] proposed an input-level fusion module driven by local adaptive lighting for infrared and visible target detection, which combined with YOLOv5L could achieve the best performance on the Drone Vehicle data set. Yang et al. [12] proposed the KPE-YOLOv5 model, which improves the feature extraction capability for small objects by incorporating the scSE attention module and adding a small-object detection layer. In face detection of personnel, Ying et al. [13] proposed a fatigue detection algorithm based on facial multifeature fusion. The video processing involved marking gray image frames and performing histogram equalization using the Dlib toolkit. Facial features were extracted in real time based on facial marker points, and the evaluation of facial features achieved a detection accuracy of fatigued behavior of more than 94.4%. Jia et al. [14] designed a method combining a facial feature detection system and fatigue judgment algorithm to detect the real-time status of drivers, which has a higher detection speed and accuracy. Chen et al. [15] improved the traditional BP neural network model, effectively eliminating false alarms caused by facial expressions and improving the detection accuracy of the model. Xiang et al. [16] proposed a fatigued driving detection system based on a 3D convolutional neural network combined with a channel attention mechanism. The attention mechanism module was used to optimize feature weight, which significantly improved fatigue detection performance. Huang et al. [17] designed a deep 3D residual network with an attention mechanism and introduced an encoder–decoder module to extract multi-scale features. This method effectively detects driver distraction. Du et al. [18] created a method which, by combining the driving data and the bio-signals of the driver, constructs a one-dimensional convolutional neural network to detect fatigue, which is better than traditional detection methods. Qin et al. [19] proposed an improved convolutional neural network which uses HOG feature maps as inputs and has achieved good performance on AUCD2 and SFD3 datasets for distracted driving detection. Ye et al. [20] developed a driver fatigue detection system based on residual redundant channel attention networking and head attitude estimation, which integrated 3D head attitude estimation and fatigue detection based on deep learning and achieved good results in the evaluation of four datasets. Zheng et al. [21] developed a MAX-MIN driver fatigue detection algorithm based on deep learning to eliminate the impact of poor environmental adaptability on fatigue detection and obtained values of EAR and MAR through image comparison. The above research has had a positive effect on the process of static detection, and continuous dynamic behavior is not included in the detection range.
To address the aforementioned situation, this paper proposes a driver attention detection method based on improved YOLOv5. The main work is as follows:
- First, the key facial points of the tested personnel are located, and their aspect ratio is calculated by locating the eye and mouth key points. Then a fatigue condition such as yawning or blinking is judged by the aspect ratio value. After that, distracted behavior is detected by selecting several behaviors which are more likely to divert attention in daily work situations, such as drinking, smoking, and playing with cell phones.
- Secondly, in terms of improvement, we modify the feature extraction element of the YOLOv5 backbone network and add a designated module to enhance the model’s feature extraction capability, achieving accurate detection of small-sized targets in the feature map.
- Finally, the feature fusion network in YOLOv5 was improved by introducing the Swin Transformer module to replace the Bottleneck module from the C3 module, which enhanced the global perception of the model. After that, the network connection was improved, thereby enhancing the ability of the model to fuse different-sized feature maps.
2. YOLOv5 Algorithm Introduction
YOLO [22] is a kind of object detection algorithm, which means that the neural network only needs to see the picture once to output results. In June 2020, Ultralights’ team proposed the YOLOv5 model of the YOLO series. The entire network can be divided into four parts: input end, backbone network, neck network, and prediction end. In the input end, methods such as Mosaic data augmentation, adaptive anchor box calculation, and adaptive image scaling are used for preprocessing. The main network structure mainly includes C3, Conv, and SPPF modules. The Neck network adopts the PANet structure improved from FPN [23], and the Detect structure predicts three different-sized feature maps. Mosaic data augmentation randomly scales, crops, arranges, and splices images, greatly enhancing the diversity of the dataset and detection ability for small targets; adaptive anchor box calculation adaptively calculates the best anchor box value for different datasets; adaptive image scaling adaptively adds minimum black edges to the original image, reducing the black edges at both ends of the image, reducing computation time, so that the speed of target detection will improve. As shown in Figure 1, the C3 module consists of three standard convolutional layers and several Bottleneck modules. Its structure is divided into two branches, one of which passes through the standard convolutional layer and Bottleneck module, while the other only passes through a standard convolutional layer. Finally, the two branches are concatenated.
The newly released YOLOv7 has been improved in terms of speed and accuracy but, given its large model size and high hardware requirements, it is limited in practical applications. Therefore, YOLOv5 was used for optimization. YOLOv5 has four versions, which are controlled by two parameters: depth and width. To ensure real-time detection, the network model with the minimum size and the fastest speed, YOLOv5s, was chosen as the benchmark for model optimization. The network model structure of YOLOv5s is shown in Figure 1.
3. Related Work
3.1. Fatigue Detection
Fatigue detection first requires key point localization for the person being tested, and key facial point localization is also called face alignment. In order to ensure the accuracy of the model, this element uses a high-resolution network (HRNet) [24] to detect the key facial points, obtaining a high-precision localization model of 98 key facial points. The specific location identification is shown in Figure 2.
Eye aspect ratio (EAR) [25] is the ratio of eye width to eye length and can be used to measure the opening and closing of the eyes. EAR value changes with the size of the eye; when the eye is open, EAR value is larger, and when the eye is closed, EAR value tends toward 0. Firstly, the eye contour is located, and then the EAR value is calculated by the eye key point, and the eye state of the detected person is judged by the change in EAR value. The positioning of the left eye key points are The formula for EAR calculation is as follows:
After multiple tests and data checks, it was found that detection accuracy and stability were higher when the EAR value was set to 0.15, so the threshold was set to 0.15. When EAR is less than 0.15, it can be judged that the eye’s state is closed.
Similar to eye aspect ratio, mouth aspect ratio (MAR) [26] can be used to measure the opening and closing of the mouth. When the mouth is closed, MAR value tends toward 0, and as the mouth opens, MAR value gradually increases. It is mainly used to detect yawning and judge fatigue. First, the mouth contour is located, then the MAR value is calculated using the key points of the mouth and the mouth state is judged by the change in MAR value. The key points of the mouth are located at −. The MAR value of the mouth relates to the calculation formula of the eye as follows:
The test results of fatigue detection are shown in Figure 3, namely yawning, closing eyes, and yawning and closing eyes at the same time. After literature review and multiple experiments, it was found that the detection effect was better when MAR value was set to 0.5, so the threshold was set to 0.5. When MAR value is greater than 0.5, it can be judged that the mouth is in a yawning state.
3.2. Distraction Behavior Detection
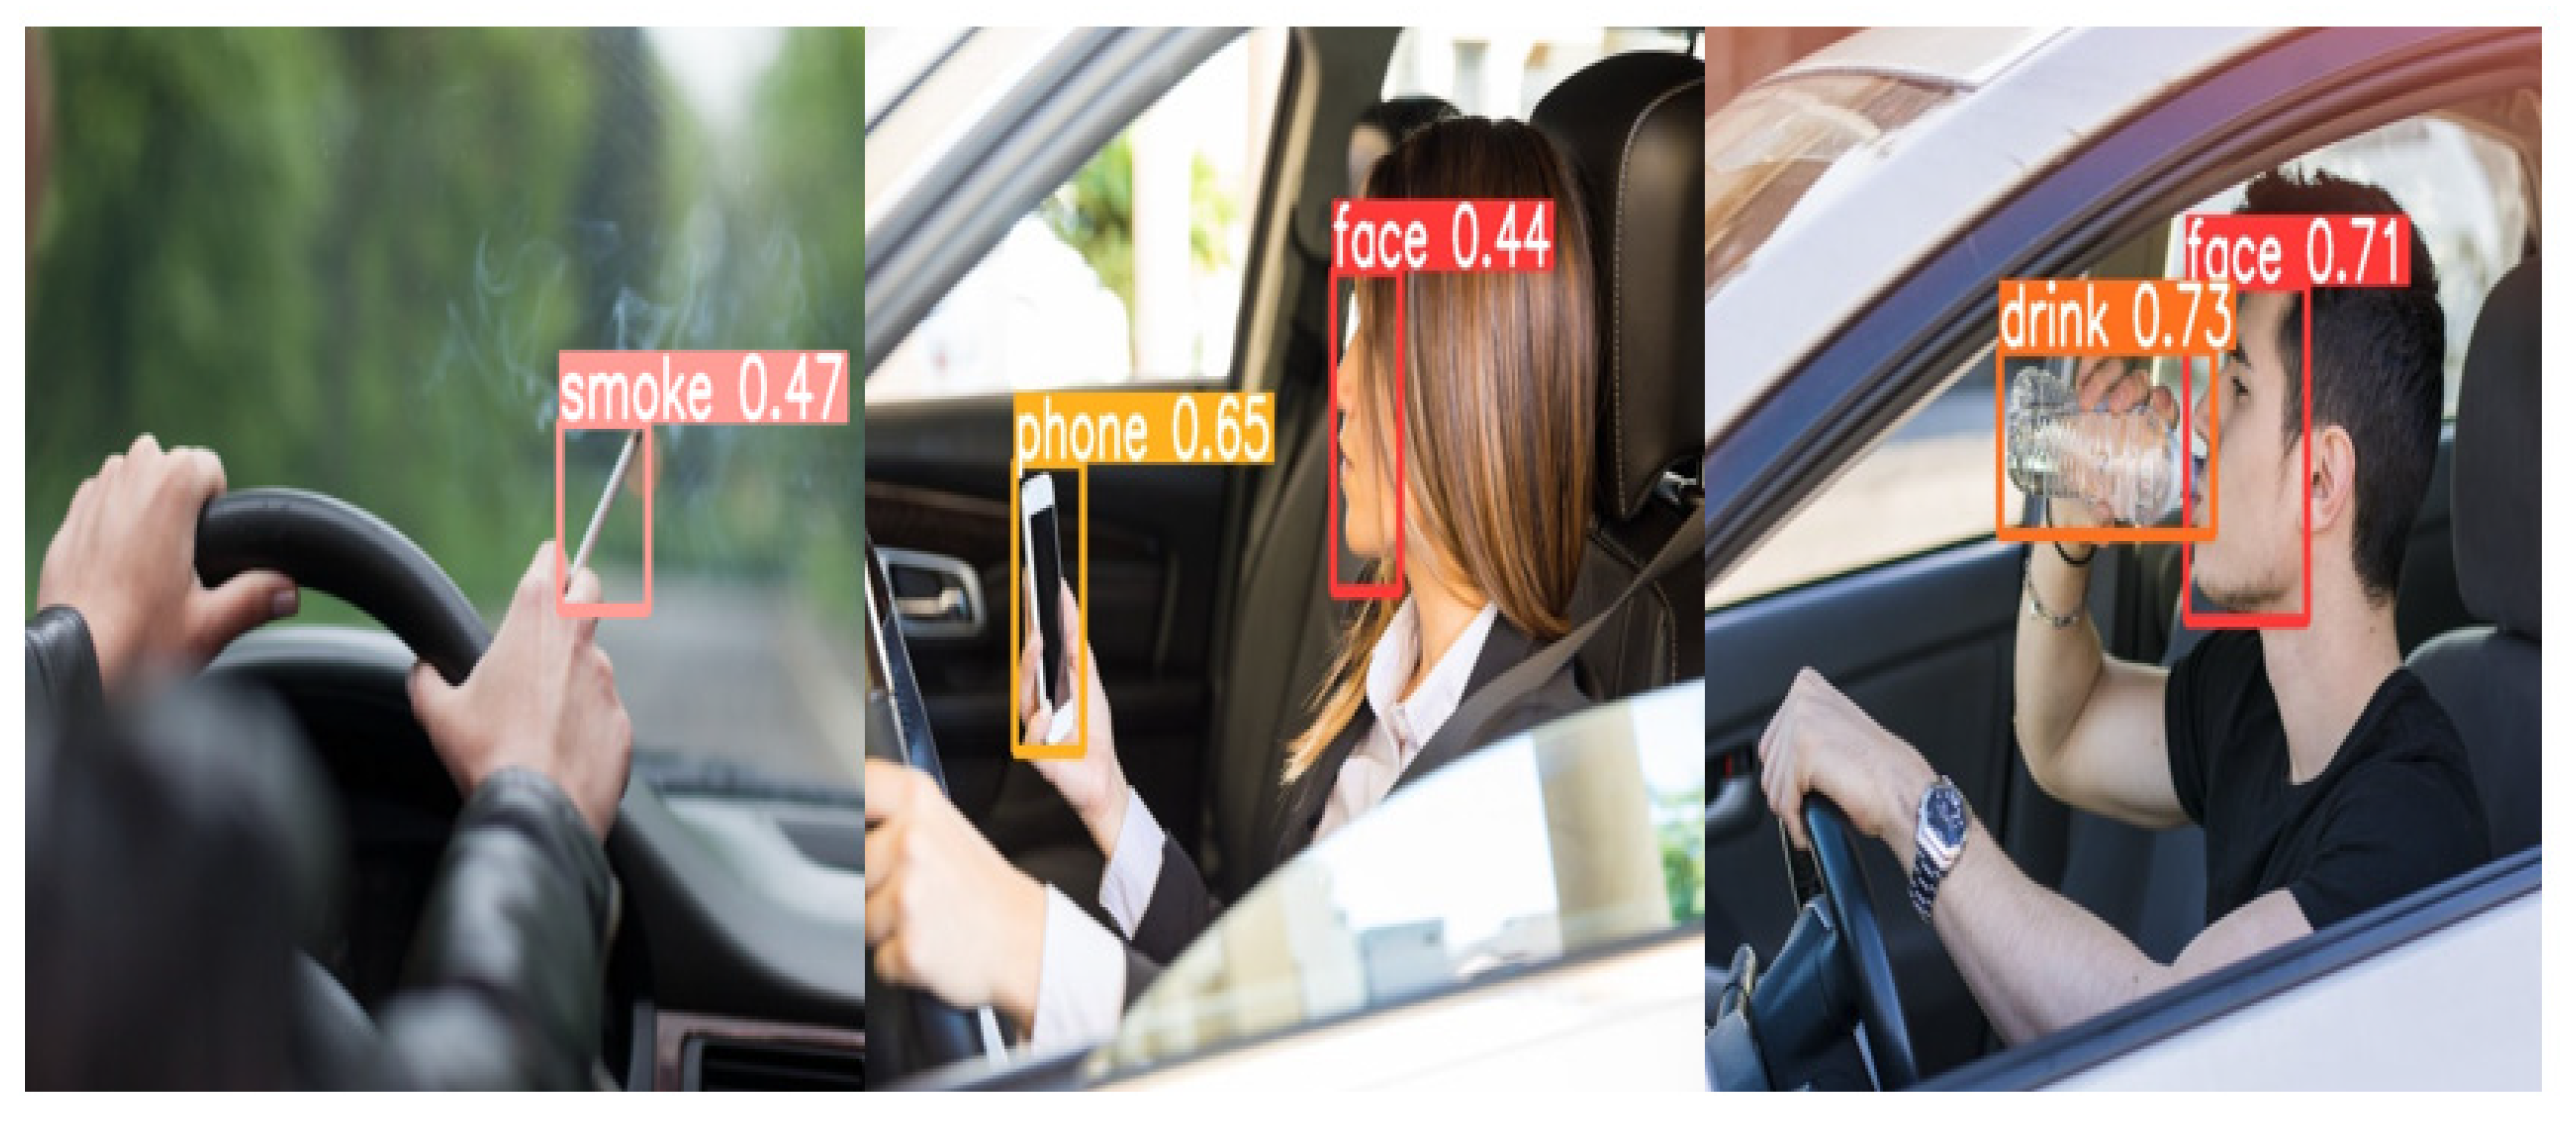
When detecting common distracted behaviors in practical life and work, distracted behavior detection is mainly divided into three categories: smoking, drinking, and phone use. About 3000 related datasets were prepared first, and the three types of behaviors were labeled with the image labeling tool LabelImg, and the dataset was labeled in YOLO format for subsequent training operations. Finally, behavior detection was performed by YOLOv5 after training, and the detection structure is shown in Figure 4. However, there may be cases of missing detection and false detection for small targets in the detected images at present.
4. Related Improvement Work
4.1. Backbone Network Improvement
During the object detection process, the YOLOv5 backbone network utilizes a convolutional neural network called CSPDarknet structure. In the detection process, there may be many small-sized objects, and to achieve precise detection of them, the feature extraction capability was enhanced by adding a set of modules after the SPPF structure of the YOLOv5 backbone network. These modules perform multiple different convolutional operations on the input feature map to enhance the network’s ability to extract features. The specific steps are as follows: first, after the SPPF structure of the trunk network feature extraction stage is put in place, a module and three convolution operations are added, in which the input is divided into two branches, one of which passes through a convolution operation and a set module, while the other passes only through a convolution operation, and finally, after the splicing operation, it passes through a convolution operation. The specified module contains 6 different convolution operations. After the input feature map is processed through these 6 different convolution operations, different receptive fields are obtained. By stacking convolution layers, the receptive field is enlarged, and then different receptive fields are used for feature extraction. The output of the feature maps obtained in each type of receptive field is concatenated and finally output after concatenation. Perceiving different feature information through multiscale receptive fields can enhance the network’s ability to extract features, especially for detecting small-sized objects. The specific structure is shown in Figure 5.
When given input feature information X, the module outputs information Y as shown in Equation (3):
The variables to are defined as shown in Equation (4):
The abbreviation represents different convolutional operations, and the symbol “+” represents the Concat operation.
4.2. Swin Transformer Module
Swin Transformer [27], a paper which was released by Microsoft on 25 March 2021 and which uses a Transformer framework to deal with computer vision tasks, can serve as a general backbone for computer vision and has yielded good results in image segmentation and object detection. Swin Transformer proposes an approach including sliding operations and hierarchical design to address the problem of increased computational cost caused by the increasing scale of visual entities and high resolutions. Swin Transformer consists of three modules as its basic structure, namely Patch Embedding, Swin Transformer Block, and Patch Merging. The Swin Transformer module is the main module, as shown in Figure 6.
In the first Block1 stage, the input feature map is operated by LayerNorm to obtain , then the standardized feature map is calculated to obtain the intermediate result of the layer by window attention operation and addition with the residual structure; the calculation process is shown in Formula (5). Then the standardization is conducted again. Finally, the full connection layer is used and added to the residual structure to obtain ; the calculation process is shown in Formula (6).
In Block1, Window Multi-head Self-Attention (W-MSA) is adopted, in Block2, Shifted Window Multi-head Self-Attention (SW-MSA) is adopted, and the two mechanisms are used alternately. In Swin Transformer Block, Transformer Block appears in pairs.
The C3 module used in YOLOv5s in this article consists of three convolutional modules and a Bottleneck module. Compared to traditional Transformer modules, the introduction of Swin Transformer modules first reduces computation and improves network operation speed. Secondly, by using a sliding-window attention mechanism to increase receptive field, it enhances the feature expression ability of small targets, enabling the model to have a larger receptive field to perceive global information from the entire feature map during feature fusion or feature extraction. Therefore, the Swin Transformer idea was borrowed for the feature fusion section, and it was introduced into the C3 module of the feature fusion network to replace the Bottleneck module, as shown in Figure 7a,b, where Swin represents the Swin Transformer module.
4.3. Neck Network Improvement
The YOLOv5 feature fusion network adopts PANet architecture, which references FPN structure and introduces bottom-up path augmentation structure. The FPN + PAN structure maximizes the role of both low-level and high-level feature information, enhancing object detection ability. After upsampling high-level feature information, FPN fuses it with the low-level feature information to achieve complementary fusion of high-level semantic features and low-level detail features, enhancing semantic expression across multiple scales. PAN then performs bottom-up feature fusion, combining low-level and high-level feature information and sending three outputs to the detection layer as the final feature map output. The main improvement of this paper on the feature fusion network is its modification of the network connection method. In the Neck section of the original YOLOv5 network model, only feature maps of three sizes, 80 × 80, 40 × 40, and 20 × 20, were combined in the feature fusion stage. To enable the network model to more fully integrate information, a larger feature map, sized 160 × 160, was added for feature fusion. Additionally, the ability to fuse feature maps of different sizes was enhanced based on the original feature fusion network. This improved the ability to detect small objects such as cigarette butts and cell phones. The modified network structure diagram is shown in Figure 8.
4.4. Loss Function
In the process of model training, it is necessary to grasp the actual input values of the model and the output values of the model and calculate the difference between the two, that is, calculate the loss function. In this paper, the loss function of the YOLOv5 model mainly consists of three parts: classification loss, confidence loss, and localization loss. Among them, confidence loss and classification loss are calculated by the BCE Loss method, and rectangular box loss is calculated by the CIoU Loss method. The calculation formulas of CIoU and are shown in Formulas (7) and (8). Compared with the previous IoU Loss, GIoU Loss, and DIOU Loss methods, CIoU Loss adds the calculation of overlap area, center point distance, and aspect ratio at the same time on the basis of the previous ones.
wherein represents the distance between the centers of the prediction box and the ground truth box, represents the length of the diagonal of the minimum rectangle covering both boxes, represents the similarity of the aspect ratio of two boxes, α is the weight coefficient of and its formula is shown in Formulas (9) and (10).
5. Experimental Results
5.1. Introduction to Experimental Dataset
In order to evaluate whether the accuracy of the model for detecting human attention has improved after the improvements, the VOC open source dataset was used in this experiment. About 3500 images of smoking, drinking, and mobile phone use were selected and labeled, and there were four categories of labels: face, smoke, drink, and phone. The dataset was divided into training and validation sets in a 9:1 ratio. During the preprocessing stage, Mosaic data augmentation was used to scale and stitch together any four images, which enriched the dataset to some extent and strengthened the robustness of the network.
The experimental environment configuration and evaluation metrics are introduced below, followed by a comparison with the model before improvement through ablation experiments and presentation of the experimental results.
5.2. Experimental Environment Configuration
The operating system of this experiment is Win10 Chinese version. The main hardware components of the experiment are an Intel (R) Core (TM) i7-10875H CPU; 16G memory; and a NVIDIA GeForce RTX2060 GPU. The deep learning framework adopted is PyTorch. When training, epoch was set to 150, the batch size was set to 16, and the optimizer selected was SGD.
5.3. Evaluation Index
This experiment uses Average Precision (AP), Mean Average Precision (mAP), Detection Rate (Frame Per Second, FPS) and Model Size as evaluation indicators as follows:
where P represents the accuracy rate and the proportion of the number of correctly predicted samples in the positive samples; R represents the recall rate and the proportion of predicted positive samples in the positive samples. TP represents the number of actual positive samples predicted as positive, FP represents the number of actual negative samples predicted as positive, and FN represents the number of actual positive samples predicted as negative. AP represents the average precision value, and mAP is the mean value of the average precision of all categories. Detection rate is the time taken by the model to detect an image. Model size refers to the size of the weight file obtained after training.
5.4. Analysis of Experimental Results
The comparison experiments of various models on the same VOC dataset are shown in Table 1. Compared with other mainstream one-stage detection algorithms YOLOv4 and YOLOv7, the improved YOLOv5 model has an average precision higher by 1.1% and 0.8%, respectively, and also has certain improvements in detection speed. Although the improved FPS has decreased to 55 f/s, it still maintains high recognition rate and real-time detection compared to the newer YOLOv7 algorithm. In addition, in terms of model size, the improved YOLOv5 is only 17.5 MB compared to YOLOv4 and YOLOv7 algorithms, which is much smaller than the other two algorithms, reducing deployment costs and facilitating rapid deployment of the model in car systems and other application scenarios.
The various improvement strategies were trained and tested on the VOC dataset, and the impact of different improvement strategies on the original model is shown in Table 2. After introducing the Swin Transformer module, the model had a larger receptive field to perceive global information, and the detection accuracy was improved. Improving the backbone network and connection method resulted in a decrease in detection speed but improved detection accuracy for small objects. Additionally, the detection accuracy of the three types of distracted behavior was also improved to some extent, as shown in Table 3.
As shown in Table 3, compared with the unimproved model, the detection accuracy of three types of distracted behavior and facial recognition improved. The detection accuracy of smoking increased by approximately 4%, the detection accuracy of mobile phone usage increased by approximately 3%, the detection accuracy of drinking water increased by approximately 0.9%, and the facial recognition accuracy increased by approximately 1.8%. In addition, to intuitively understand the detection performance of the improved model, three types of distracted behavior that appear in the actual driving dataset were detected in both the YOLOv5 model and the improved model, and the original images and the detection results before and after improvement were visualized as shown in Figure 9. From the experimental results, it can be concluded that the improved model has higher accuracy in detecting small targets such as cigarettes and mobile phones and has higher applicability in detecting distracted behavior that leads to attention diversion during actual driving processes.
6. Conclusions
This article proposes a method of determining whether drivers have diverted attention while driving, which is mainly divided into fatigue detection and distracted abnormal behavior detection. Among them, many distracted behaviors during driving are summarized into three common types: smoking, drinking water, and playing with phones. For fatigue detection, this method uses the calculation of the ratio values of the width and height of the eyes and mouth. For the detection of distracted behavior, this article improves upon the YOLOv5 model by adding multiple convolution operations in the backbone network to obtain different receptive fields and enhance the network’s feature extraction capability. The Swin Transformer module was introduced to replace a Bottleneck module in the C3 module of the feature fusion network, which enhances the model’s awareness of global information and improves the network connection modes in the feature fusion network to enhance the model’s feature fusion ability. The ability of the model to detect small objects such as cigarettes and drinking water was improved.
The proposed method in this paper was experimentally validated as having improved mAP compared to the original YOLOv5 model. Additionally, when compared to the newer YOLOv7 model, it had a smaller model size and higher detection accuracy but a slower detection speed than the original model. Further improvements will be made in future research to address the detection speed issue and improve the real-time performance of the network model. Moreover, distracted behavior impacting traffic safety is not limited to the three types studied in this paper, and other behaviors will also be studied in future research.
Author Contributions
Conceptualization, Z.W. and K.Y.; methodology, Z.W.; software, Z.W.; validation, Z.W. and F.G.; resources, Z.W. and F.G.; writing—original draft, Z.W. All authors have read and agreed to the published version of the manuscript.
Funding
This research was supported by Jiangsu University of Technology graduate practice innovation project (XSJCX22_39).
Institutional Review Board Statement
Not applicable.
Informed Consent Statement
Not applicable.
Data Availability Statement
The main purpose of this study is to improve the detection of human attention in YOLOv5. The experimental dataset was mainly obtained through public data such as VOC.
Acknowledgments
The authors gratefully acknowledge the reviewers and editor-in-chief for their careful work, and they also thank the data sharer for their selfless dedication.
Conflicts of Interest
The authors declare no conflict of interest.
References
- Yan, Y.; Zhong, S.; Tian, J.; Song, L. Driving distraction at night: The impact of cell phone use on driving behaviors among young drivers. Transp. Res. Part F Traffic Psychol. Behav. 2022, 91, 401–413. [Google Scholar] [CrossRef]
- Wang, X.; Xu, R.; Zhang, S.; Zhuang, Y.; Wang, Y. Driver distraction detection based on vehicle dynamics using naturalistic driving data. Transp. Res. Part C Emerg. Technol. 2022, 136, 103561. [Google Scholar] [CrossRef]
- Xiao, W.; Liu, H.; Ma, Z.; Chen, W. Attention-based deep neural network for driver behavior recognition. Future Gener. Comput. Syst. 2022, 132, 152–161. [Google Scholar] [CrossRef]
- Tan, W.; Yuan, X.; Zhang, X.; Wang, J. An enhanced adaptive large neighborhood search for fatigue-conscious electric vehicle routing and scheduling problem considering driver heterogeneity. Expert Syst. Appl. 2023, 218, 119644. [Google Scholar] [CrossRef]
- Xue, Q.; Wang, X.; Li, Y.; Guo, W. Young Novice Drivers’ Cognitive Distraction Detection: Comparing Support Vector Machines and Random Forest Model of Vehicle Control Behavior. Sensors 2023, 23, 1345. [Google Scholar] [CrossRef]
- Wang, F.; Wan, Y.; Li, M.; Huang, H.; Li, L.; Hou, X. Recent Advances in Fatigue Detection Algorithm Based on EEG. Intell. Autom. Soft Comput. 2023, 35, 3573–3586. [Google Scholar] [CrossRef]
- Choi, G.; Ziyang, G.; Wu, J.; Esposito, C.; Choi, C. Multi-modal Biometrics Based Implicit Driver Identification System Using Multi-TF Images of ECG and EMG. Comput. Biol. Med. 2023, 159, 106851. [Google Scholar] [CrossRef]
- Chang, R.C.-H.; Wang, C.-Y.; Chen, W.-T.; Chiu, C.-D. Drowsiness Detection System Based on PERCLOS and Facial Physiological Signal. Sensors 2022, 22, 5380. [Google Scholar] [CrossRef]
- Liu, Z.; Gu, X.; Chen, J.; Wang, D.; Chen, Y.; Wang, L. Automatic recognition of pavement cracks from combined GPR B-scan and C-scan images using multiscale feature fusion deep neural networks. Autom. Constr. 2023, 146, 104698. [Google Scholar] [CrossRef]
- Wang, D.; Liu, Z.; Gu, X.; Wu, W.; Chen, Y.; Wang, L. Automatic Detection of Pothole Distress in Asphalt Pavement Using Improved Convolutional Neural Networks. Remote Sens. 2022, 14, 3892. [Google Scholar] [CrossRef]
- Wu, J.; Shen, T.; Wang, Q.; Tao, Z.; Zeng, K.; Song, J. Local Adaptive Illumination-Driven Input-Level Fusion for Infrared and Visible Object Detection. Remote Sens. 2023, 15, 660. [Google Scholar] [CrossRef]
- Yang, R.; Li, W.; Shang, X.; Zhu, D.; Man, X. KPE-YOLOv5: An Improved Small Target Detection Algorithm Based on YOLOv5. Electronics 2023, 12, 817. [Google Scholar] [CrossRef]
- Ying, Y.; Zhang, H.; Zhang, W.; Yuan, Y.; Li, C. Fatigue Working Detection Based on Facial Multifeature Fusion. IEEE Sens. J. 2023, 23, 5956–5961. [Google Scholar]
- Jia, H.; Xiao, Z.; Ji, P. Real-time fatigue driving detection system based on multi-module fusion. Comput. Graph. 2022, 108, 22–33. [Google Scholar] [CrossRef]
- Chen, J.; Yan, M.; Zhu, F.; Xu, J.; Li, H.; Sun, X. Fatigue Driving Detection Method Based on Combination of BP Neural Network and Time Cumulative Effect. Sensors 2022, 22, 4717. [Google Scholar] [CrossRef]
- Xiang, W.; Wu, X.; Li, C.; Zhang, W.; Li, F. Driving Fatigue Detection Based on the Combination of Multi-Branch 3D-CNN and Attention Mechanism. Appl. Sci. 2022, 12, 4689. [Google Scholar] [CrossRef]
- Huang, T.; Fu, R. Driver Distraction Detection Based on the True Driver’s Focus of Attention. IEEE Trans. Intell. Transp. Syst. 2022, 23, 19374–19386. [Google Scholar] [CrossRef]
- Du, G.; Zhang, L.; Su, K.; Wang, X.; Teng, S.; Liu, P.X. A multimodal fusion fatigue driving detection method based on heart rate and PERCLOS. IEEE Trans. Intell. Transp. Syst. 2022, 23, 21810–21820. [Google Scholar] [CrossRef]
- Qin, B.; Qian, J.; Xin, Y.; Liu, B.; Dong, Y. Distracted driver detection based on a CNN with decreasing filter size. IEEE Trans. Intell. Transp. Syst. 2021, 23, 6922–6933. [Google Scholar] [CrossRef]
- Ye, M.; Zhang, W.; Cao, P.; Liu, K. Driver Fatigue Detection Based on Residual Channel Attention Network and Head Pose Estimation. Appl. Sci. 2021, 11, 9195. [Google Scholar] [CrossRef]
- Zheng, H.; Wang, Y.; Liu, X. Adaptive Driver Face Feature Fatigue Detection Algorithm Research. Appl. Sci. 2023, 13, 5074. [Google Scholar] [CrossRef]
- Redmon, J.; Divvala, S.; Girshick, R.; Farhadi, A. You only look once: Unified, real-time object detection. In Proceedings of the IEEE Conference on Computer Vision and Pattern Recognition, Las Vegas, NV, USA, 27–30 June 2016; pp. 779–788. [Google Scholar]
- Li, Z.; Li, E.; Xu, T.; Samat, A.; Liu, W. Feature Alignment FPN for Oriented Object Detection in Remote Sensing Images. IEEE Geosci. Remote Sens. Lett. 2023, 20, 1–5. [Google Scholar] [CrossRef]
- Sun, K.; Xiao, B.; Liu, D.; Wang, J. Deep high-resolution representation learning for human pose estimation. In Proceedings of the IEEE/CVF Conference on Computer Vision and Pattern Recognition, Long Beach, CA, USA, 15–20 June 2019; pp. 5693–5703. [Google Scholar]
- Dewi, C.; Chen, R.-C.; Chang, C.-W.; Wu, S.-H.; Jiang, X.; Yu, H. Eye Aspect Ratio for Real-Time Drowsiness Detection to Improve Driver Safety. Electronics 2022, 11, 3183. [Google Scholar] [CrossRef]
- Zhu, T.; Zhang, C.; Wu, T.; Ouyang, Z.; Li, H.; Na, X.; Liang, J.; Li, W. Research on a Real-Time Driver Fatigue Detection Algorithm Based on Facial Video Sequences. Appl. Sci. 2022, 12, 2224. [Google Scholar] [CrossRef]
- Liu, Z.; Lin, Y.; Cao, Y.; Hu, H.; Wei, Y.; Zhang, Z. Swin transformer: Hierarchical vision transformer using shifted windows. In Proceedings of the IEEE/CVF International Conference on Computer Vision Workshops (ICCVW), Montreal, BC, Canada, 11–17 October 2021; pp. 10012–10022. [Google Scholar]
Figure 1.
YOLOv5s network model structure diagram.

Figure 2.
98-Point Face Position Identification.

Figure 3.
Fatigue detection.

Figure 4.
Three kinds of distracted behavior detection.

Figure 5.
(a) Backbone network improvement; (b) modular structure.

Figure 6.
Swin Transformer Block architecture.

Figure 7.
(a) C3 module structure diagram; (b) Swin module structure diagram.

Figure 8.
Improved network structure diagram.

Figure 9.
(a) Comparison of smoking before and after improvement; (b) comparison of drinking before and after improvement; (c) comparison of mobile phone use before and after improvement.
Figure 9.
(a) Comparison of smoking before and after improvement; (b) comparison of drinking before and after improvement; (c) comparison of mobile phone use before and after improvement.


Table 1.
Performance comparison of different network models.
| Network Model | mAP/% | FPS/(f/s) | Size (MB) |
|---|---|---|---|
| YOLOv4 | 85.2 | 24 | 244 |
| YOLOv5s | 83.9 | 63.3 | 13.7 |
| YOLOv7 | 85.5 | 49 | 71.3 |
| Improved YOLOv5 | 86.3 | 55 | 17.5 |
Table 2.
Ablation experiment.
| Swin Transformer | Backbone Improvement | Neck Improvement | mAP/% | FPS/(f/s) | Size (MB) |
|---|---|---|---|---|---|
| - | - | - | 83.9 | 63.3 | 13.7 |
| √ | - | - | 84.2 | 58.1 | 13.8 |
| - | √ | √ | 84.6 | 59 | 17.4 |
| √ | √ | √ | 86.3 | 55 | 17.5 |
Table 3.
The precision comparison of distraction behavior before and after improvement.
| Distracted Behavior | Before AP/% | Improved AP/% |
|---|---|---|
| face | 93.2 | 95 |
| smoke | 61.8 | 65.8 |
| drink | 95.8 | 96.7 |
| phone | 84.7 | 87.7 |
Disclaimer/Publisher’s Note: The statements, opinions and data contained in all publications are solely those of the individual author(s) and contributor(s) and not of MDPI and/or the editor(s). MDPI and/or the editor(s) disclaim responsibility for any injury to people or property resulting from any ideas, methods, instructions or products referred to in the content. |
© 2023 by the authors. Licensee MDPI, Basel, Switzerland. This article is an open access article distributed under the terms and conditions of the Creative Commons Attribution (CC BY) license (https://creativecommons.org/licenses/by/4.0/).
Share and Cite
MDPI and ACS Style
Wang, Z.; Yao, K.; Guo, F. Driver Attention Detection Based on Improved YOLOv5. Appl. Sci. 2023, 13, 6645. https://0-doi-org.brum.beds.ac.uk/10.3390/app13116645
AMA Style
Wang Z, Yao K, Guo F. Driver Attention Detection Based on Improved YOLOv5. Applied Sciences. 2023; 13(11):6645. https://0-doi-org.brum.beds.ac.uk/10.3390/app13116645
Chicago/Turabian StyleWang, Zhongzhou, Keming Yao, and Fuao Guo. 2023. "Driver Attention Detection Based on Improved YOLOv5" Applied Sciences 13, no. 11: 6645. https://0-doi-org.brum.beds.ac.uk/10.3390/app13116645
Note that from the first issue of 2016, this journal uses article numbers instead of page numbers. See further details here.