
CI-UNet: Application of Segmentation of Medical Images of the Human Torso

Department of Electrical Engineering, Guizhou University, Guiyang 550025, China
*
Author to whom correspondence should be addressed.
Appl. Sci. 2023, 13(12), 7293; https://0-doi-org.brum.beds.ac.uk/10.3390/app13127293
Submission received: 29 May 2023
/
Revised: 16 June 2023
/
Accepted: 16 June 2023
/
Published: 19 June 2023
(This article belongs to the Special Issue Machine Learning-Based Medical Image Analysis)
Abstract
:The study of human torso medical image segmentation is significant for computer-aided diagnosis of human examination, disease tracking, and disease prevention and treatment. In this paper, two application tasks are designed for torso medical images: the abdominal multi-organ segmentation task and the spine segmentation task. For this reason, this paper proposes a net-work model CI-UNet improve the accuracy of edge segmentation. CI-UNet is a U-shaped network structure consisting of encoding and decoding networks. Firstly, it replaces UNet’s double convolutional backbone network with a VGG16 network loaded with Transfer Learning. It feeds image information from two adjacent layers in the VGG16 network into the decoding grid via information aggregation blocks. Secondly, Polarized Self-Attention is added at the decoding network and the hopping connection, which allows the network to focus on the compelling features of the image. Finally, the image information is decoded by convolution and Up-sampling several times to obtain the segmentation results. CI-UNet was tested in the abdominal multi-organ segmentation task using the Chaos (Combined CT-MR Healthy Abdominal Organ Segmentation) open challenge dataset and compared with UNet, Attention UNet, PSPNet, DeepLabv3+ prediction networks, and dedicated network for MRI images. The experimental results showed that the average intersegmental union (mIoU) and average pixel accuracy (mPA) of organ segmentation were 82.33% and 90.10%, respectively, higher than the above comparison network. Meanwhile, we used CI-UNet for the spine dataset of the Guizhou branch of Beijing Jishuitan Hospital. The average intersegmental union (mIoU) and average pixel accuracy (mPA) of organ segmentation were 87.97% and 93.48%, respectively, which were approved by the physicians for both tasks.
1. Introduction
Medical imaging of the torso helps doctors look at the organs and bone structures in the body. The organs will be damaged to varying degrees when the abdomen is subjected to penetrating or blunt trauma. The vital issue in trauma is damage to the internal organs, with the liver and kidneys being the most severely damaged [1]. Injuries to crucial internal organs can cause severe conditions such as bleeding, shock, infection, or peritonitis. They will be life-threatening if the injured person does not receive prompt and effective treatment. Applying computed tomography, magnetic resonance imaging, and other cross-sectional imaging techniques to clinical practice has led to qualitative changes in disease diagnosis [2,3,4]. These imaging images effectively help physicians make consultations for more accurate results and timely disease treatment.
1.1. Research Motivation
In the field of medical image processing, deep learning has shown significant advantages. Deep learning techniques use image data to discover inherent patterns and condition features. In most cases, medical data interpretation are obtained through medical experts’ analysis. Due to the subjective nature of medical imaging, doctors often make incorrect assessments [5]. Deep learning is an excellent way to improve the evaluation of medical images by traditional experts, and many scholars have started to incorporate deep learning techniques for medical imaging research. Deep learning image processing techniques are divided into image classification, target recognition, and semantic segmentation. Image classification techniques classify medical images for diseases, while target recognition techniques and semantic segmentation techniques perform lesion region detection. The existing deep learning semantic segmentation techniques are mainly applied to the human brain [6,7,8,9], liver [10,11,12,13], heart [14,15,16,17], lung [18,19,20,21], and kidney [22,23,24,25] parts.
The development of semantic segmentation techniques has been very rapid in recent years. In the early stage of technology development, people mainly used pixel-level cluster-based segmentation, threshold segmentation, and decision tree classification methods. Nowadays, researchers use Volumetric Memory Networks [26,27,28], Prototype View [29], Region Semantic Contrast and Aggregation [30], Deep Hierarchical Semantic Segmentation [31], and other methods for semantic segmentation research and application. Volumetric Memory Network is a neural network model for processing 3D data. While traditional neural networks mainly process flat image data, volumetric neural networks are specifically designed to process 3D data, such as stereo images, medical images, and 3D scan data. In [26], a novel memory-enhanced network VMN with rich and non-redundant structure, is proposed for volumetric interactive segmentation by combining interactive image segmentation methods with volumetric memory networks. A quality evaluation module is also proposed to facilitate the automatic suggestion of appropriate slices for iterative correction. The technique can handle various interactions, e.g., scribbles, bounding boxes, and extreme clicks. In [29], the prototype view approach is proposed, which identifies several limitations of the parametric isolation regime in semantic segmentation, followed by a non-parametric alternative based on unlearnable prototypes. Instead of learning individual weights/query vectors for each class in a fully parametric manner, the model represents each class as a set of unlearnable prototypes that depend only on the average features of several training pixels in that class. The work anticipates that this work will trigger a rethinking of the current de facto design of semantic segmentation models. In [30], learning semantic segmentation from weakly labeled data in the literature is challenging because inferring dense object regions from sparse semantic labels are complex. In that paper, Regional Semantic Comparison and Aggregation (RCA) is proposed, where semantic aggregation is used to collect various relational contexts in memory to enrich redundant semantic representations. In this way, RCA obtains robust fine-grained semantic understanding and eventually establishes new state-of-the-art results in PASCAL VOC 2012 and COCO 2014. Ref. [31] discusses hierarchical semantic segmentation (HSS), which aims at a structured pixel-level description of visual observations based on a class. Also designed is HSSN, a generalized HSS framework. HSSN directly converts HSS to a pixel-level multi-label classification task, bringing minimal architectural changes to the current segmentation model. HSSN first explores the inherent properties of the hierarchy as training targets, forcing segmentation predictions to obey the hierarchical structure. In addition, through hierarchy-induced margin constraints, HSSN reshapes the pixel embedding space to generate well-structured pixel representations and improve segmentation. The authors of that paper experiment with HSSN on Mapillary Vistas 2.0 [32], Cityscapes [33], LIP [34], and PASCAL-Person-Part [35] to show the generality and superiority of HSSN. The above work provides implications for the research development of image segmentation. Currently, medical images suffer from low contrast of target objects, blurred boundaries, and high noise. The large number of images and pictures makes it difficult for medical workers to process them promptly, which poses a significant challenge to the medical system [36].
1.2. Research Objectives
In this paper, we design a deep learning algorithm CI-UNet, which can improve the accuracy of foreground target edge segmentation in medical images and the problem of partial organ undetectability. This study will finally be correlated with orthopedic spine images, and we used CI-UNet to perform scoliosis angle calculations in Guizhou residents of Guizhou Province, China. The research contributions and practical aspects of our proposed method can be summarized as follows:
- In the multi-organ segmentation task, image rotation and Cutout [37] data enhancement were performed for the insufficient amount of data in the dataset, and the effects of different rotation angles on the results of the dataset evaluation metrics and whether what level of Cutout data augmentation can better mitigate the problem of overfitting the dataset due to rotational data augmentation;
- In the multi-organ experimental analysis, firstly, we increased the generalization ability of the network by modifying the backbone network and adding Transfer Learning. Secondly, the Polarized Self-Attention was added to the network to increase the overlap and localization ability of the prediction results with the actual labels. Finally, the network was fused with image information by adding an information aggregation module. The result of experiment showed that our designed CI-UNet achieves better results in evaluation metrics when compared with the current, more popular networks. At the same time, this paper has designed a scheme to cope with the imbalance in the Chaos dataset;
- In the practical application of spine segmentation, we transposed the experience of multi-organ semantic segmentation experiments. Then, CI-UNet was applied to the spine dataset of the Guizhou branch of Beijing Jishuitan Hospital. CI-UNet was validated for semantic segmentation of 2 classification classes of X-ray spine images. From the perspective of practical applications, we are actively trying to provide computer-aided diagnostic applications for spinal disorders in Guizhou people.
2. Materials and Methods
2.1. Data Source of Organ
The tomographic abdominal organ dataset Chaos [38] is a medical imaging dataset focusing on abdominal organs such as liver, kidney, and spleen structures. This dataset is prominent in the adjunctive treatment of diseases such as acute liver failure, impaired renal function, and abdominal aneurysms. Abdominal imaging is an essential subfield of diagnostic radiology, which plays a vital role in daily control and postoperative follow-up. Imaging modalities of Chaos dataset images are mainly composed of electron computed tomography (CT) and magnetic resonance imaging (MRI). The CT data images were used in 40 cases, with the task of single-organ segmentation of the abdominal liver, and the MRI data images are used in 80 points, with the mission of multi-organ segmentation of the abdomen. Imaging modalities of the MRI data images are divided into longitudinal relaxation imaging (T1) and transverse relaxation imaging (T2), with T2 imaging being practical in showing lesion areas, edema, and tumors. T2 imaging effectively shows lesion areas, edema, and tumors and usually provides better soft tissue contrast than T1 imaging. For the above reasons, this experiment selected T2 imaging MRI medical image maps for abdominal 4-organ image segmentation; the organs are the spleen, left kidney, right kidney, and liver. Partial T2 dataset, partial T2 dataset corresponding labels, and labeled organ location schematics are shown in Figure 1a–c, respectively.
2.2. Data Pre-Processing
Since the T2 data in the Chaos test set did not have corresponding segmentation labels, we used only the T2 data in the Chaos training set for organ segmentation experiments of multiple organs in the abdomen. Individual training images and their corresponding labels are 1 set, with 623 sets in total. The image resolution of most of the data was 256 × 256. Dataset converted the training data to PASCAL VOC [39] dataset format. After the format conversion was completed, it was centrally rotated by a group with a rotation angle of plus ten and minus ten degrees and added to the original dataset. Since the rotated reinforced data can lead to overfitting in training, to suppress the overfitting situation. A random 30% of the data in the dataset is selected for Cutout data operation. The schematic diagram of Cutout data reinforcement is shown in Figure 2.
2.3. CI-UNet Network Model
UNet is widely used in medical image segmentation fields with good results. It uses a symmetric coding and decoding structure, and the coding network part uses convolutional and pooling layers for feature extraction and Down-sampling, which can compress the information of the input image into higher-level abstract features. The decoder part uses the deconvolution layer and Up-sampling layer for Up-sampling and feature reconstruction to restore the feature mapping of the encoder output to the exact as the input image. The UNet network structure is shown in Figure 3.
The UNet network institutions are straightforward and aesthetically pleasing but have the following problems:
- The results are not good after a large number of data training repetitions, which can easily cause overfitting and other problems, and the convergence process is slow. When the amount of data is insufficient, the segmentation effect of UNet is not satisfactory;
- The splitting accuracy and positioning precision cannot be combined, and the essential parts cannot be centralized;
- The image features in each layer of the coding network do not interact with each other, resulting in insufficient information entering the coding part, which eventually affects the output results.
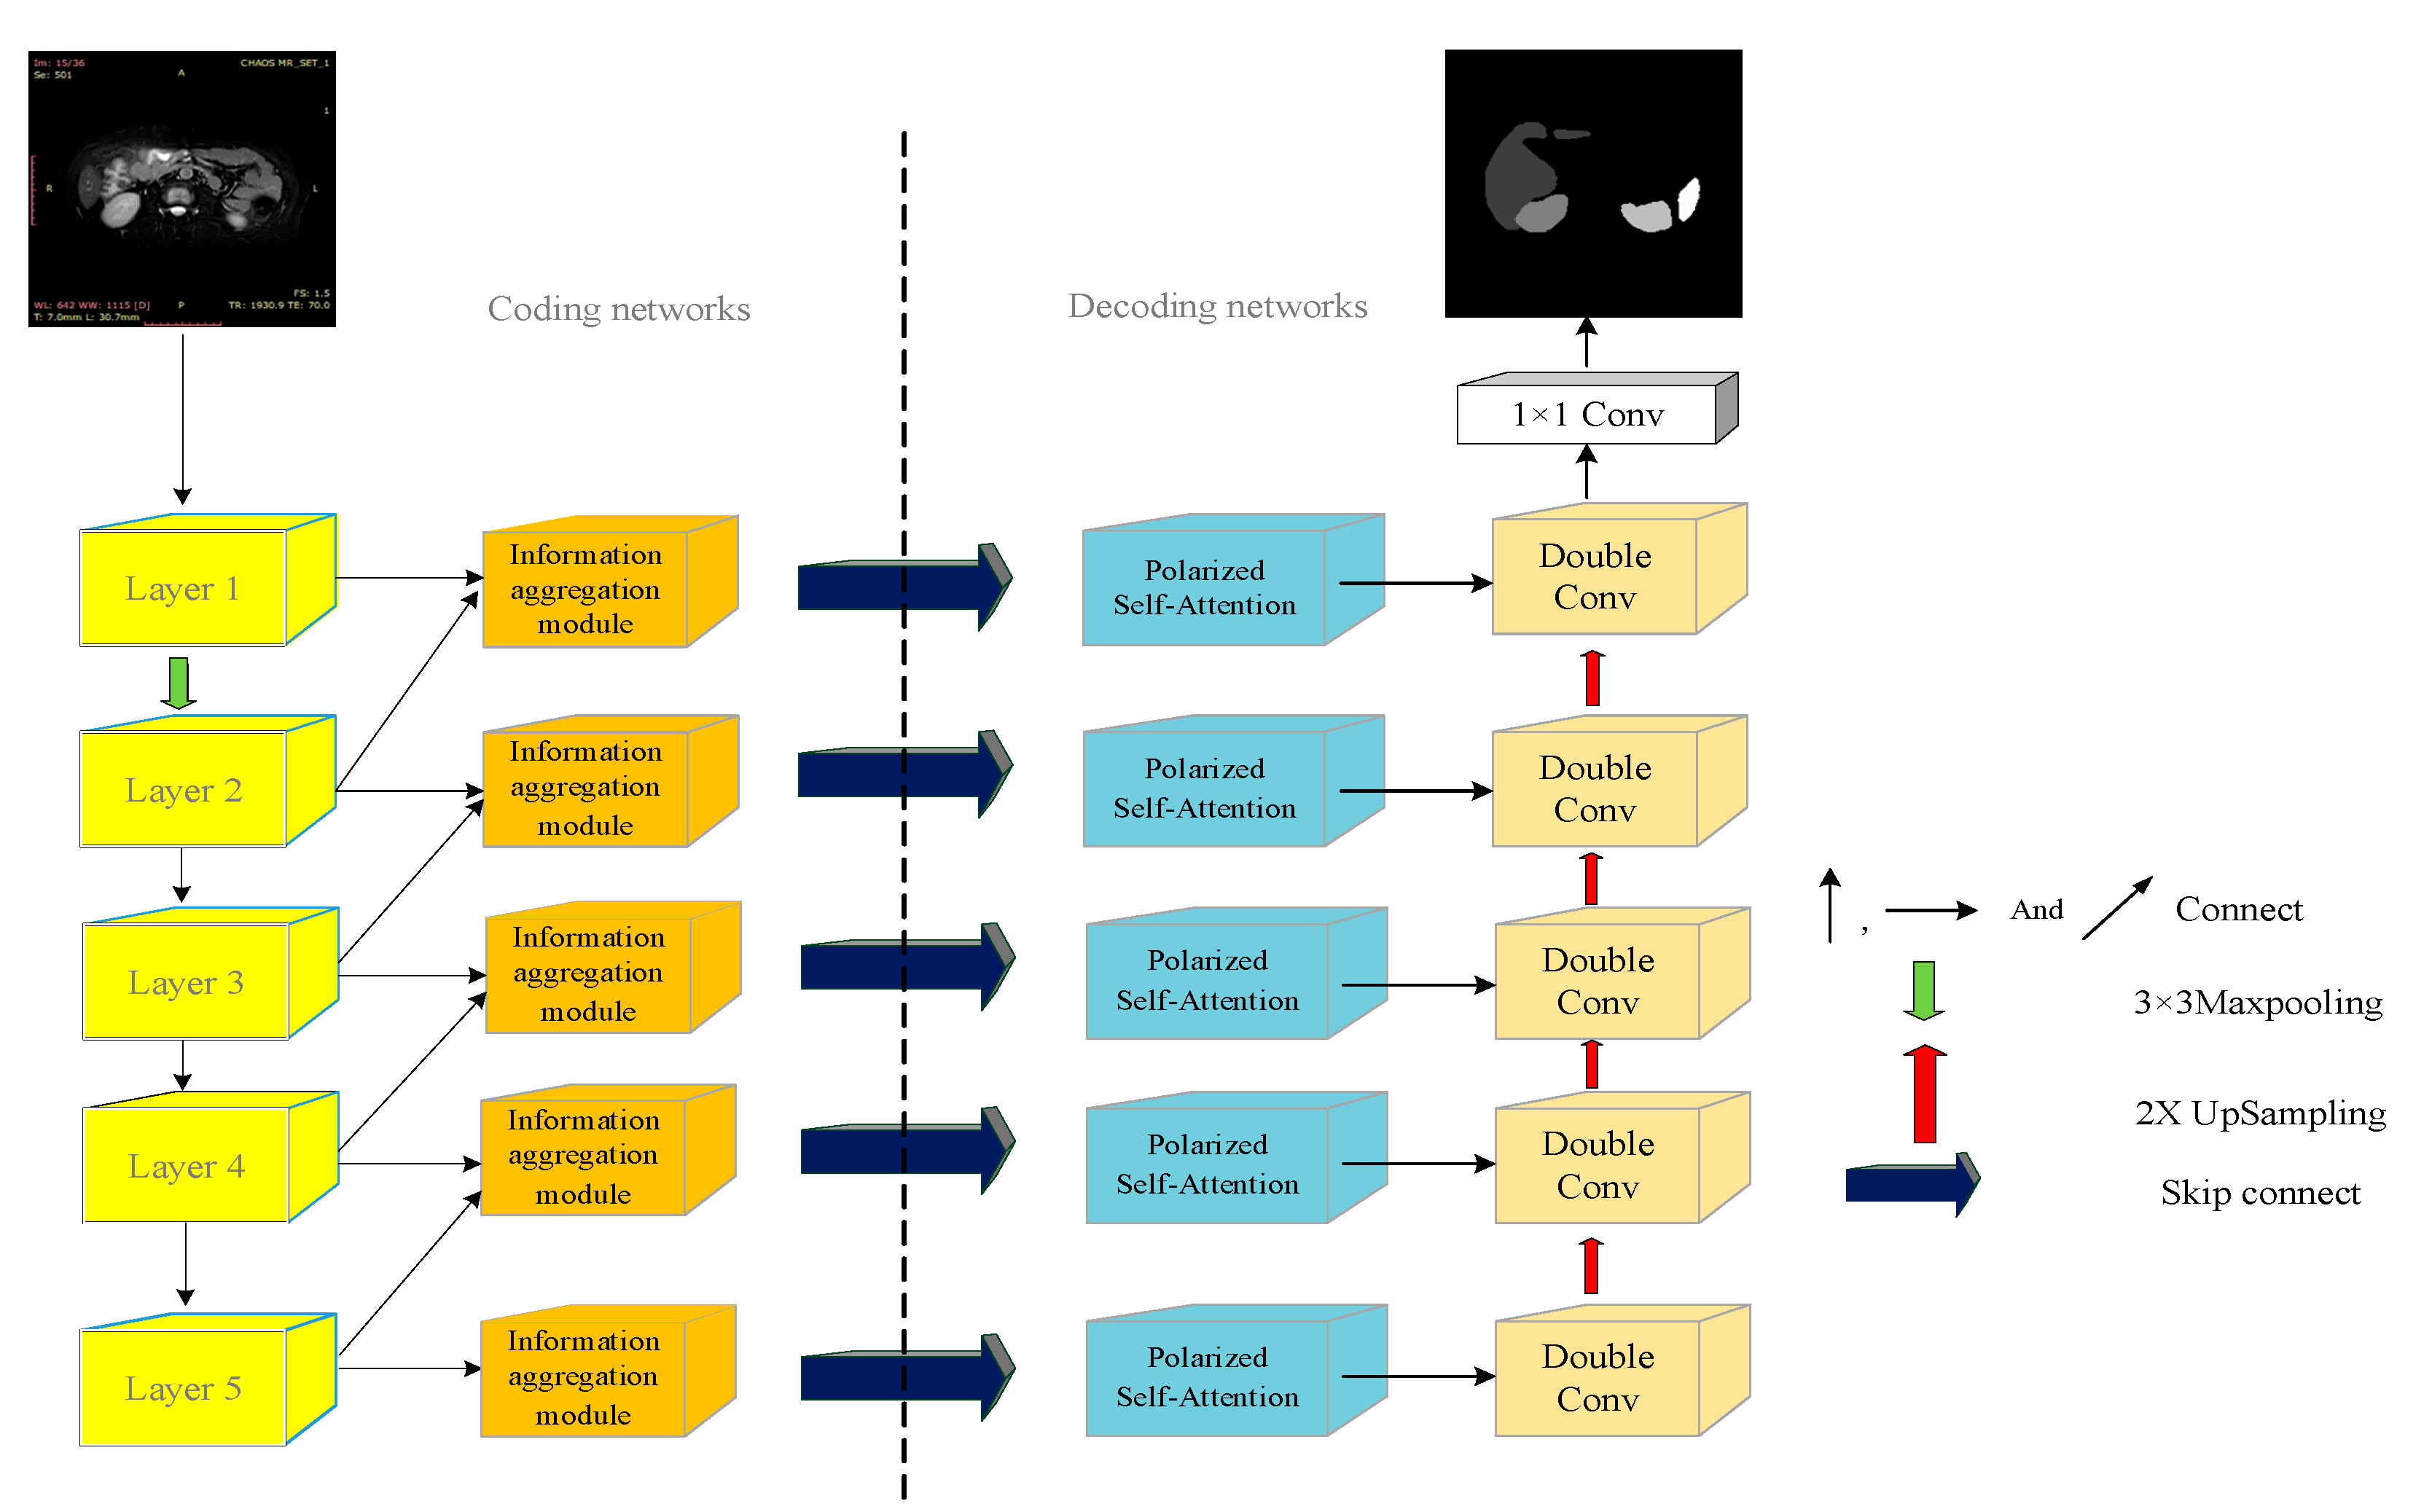
The model in this paper is inspired by the idea of UNet, and the network structure is rationalized and modified for the above three problems, and the network structure of the model CI-UNet in this paper is shown in Figure 4.
VGG16 [40], which contains Transfer Learning, replaces the double convolution backbone to make the network more generally. Transfer Learning can train the target domain’s model weights using the source domain’s model weights and cope well with the problem of fewer new datasets.
The VGG16 network is first pre-trained on the ImageNet dataset with weights and then trained in conjunction with the Chaos dataset. In this paper, we use ImageNet to perform network pre-training, mainly for two reasons. On the one hand, ImageNet is a data collection with a large amount of pre-labeled training data in the image field, which is a great advantage, and the more significant the number of trained parameters, the more reliable it is; on the other hand, because ImageNet has 1000 categories, there are many categories, and it is a general image data, which is not too related to the field. Hence, the generality is good and can be used after pre-training. VGG16 backbone Transfer Learning schematic is shown in Figure 5.
The VGG16 network extracts features by stacking multiple 3 × 3 convolutional kernels instead of large convolutional kernels. It reduces the number of parameters needed for computation and expands the perceptual field again, allowing the network to better mine image information. The structure of the VGG16 backbone feature extraction network is shown in Figure 6.
In the UNet network structure, the shallow feature maps differ significantly from the deep feature maps. In this paper, we refer to the UNet++ idea to fuse the information of two adjacent levels, and the fused information enters the decoding network through the jump connection. We are adding Polarized Self-Attention [41] in the decoding network. The Polarized Self-Attention mechanism processes the feature information and focuses the target region on the foreground organ part of the image. The image information is passed from bottom to top in the decoding network. The lowermost fusion information is passed upward by two times of Up-sampling after extracting features with two 3 × 3 convolutional kernels. The passed information is spliced with the fused information from the jump connection, and the process is repeated until the shallowest decoding network. The split prediction map is finally output by 1 × 1 convolution pixel by pixel.
2.4. Information Aggregation Module
The role of the Information aggregation block is to fuse deep information with shallow information. The information aggregation block is designed to focus on acquiring high symbolic information from the in-depth information and merging it with the shallow network messages through a series of network structures, where there is both high and low efficient information in the image information. Its input is the feature maps of two adjacent layers of the coded network. The deep layer information pooled by global average pooling, 1 × 1 convolution, and the Sigmoid activation function is finally multiplied with the original feature map weights. The global average pooling Down-samples the pixel points of the output layer and extracts the valuable features. The Sigmoid function fixes all the valid information values between 0 and 1 and multiplies them with the original deep information to obtain the optimized deep information. This focuses the deep information feature map on the practical part. Finally, the deep and shallow information maps are spliced in the channel direction to obtain the semantic information of the two adjacent layers, and the spliced feature map enters the coding network. The information aggregation block fuses the information between the layers, enriches it, and makes it efficient. The last layer of aggregation block only does feature extraction for itself and does not fuse with other layers of information for output. The structure diagrams of the information aggregation module and the last layer of the information aggregation module are shown in Figure 7a,b.
2.5. Polarized Self-Attention
In computer vision, attention enables the network to capture the image structure better and selectively focus on the salient parts. Attention mechanisms can be divided into two categories, channel attention mechanisms, and spatial attention mechanisms. A dual attention mechanism combining spatial and channel dimensions is called a hybrid attention mechanism. In the hybrid attention mechanism, channel and spatial attention can be connected in a series-parallel manner. Based on the hybrid attention mechanism, this paper adopts Polarized Self-Attention for the characteristics of poor contrast, blurred boundary of torso medical image data, etc. The structure of Polarized Self-Attention is divided into two branches: the self-attention mechanism of spatial dimension and the self-attention mechanism of channel dimension, and the results of these. The output of Polarized Self-Attention is obtained by fusing the influences of the two channels. Compared with other attention methods, Polarized Self-Attention does not compress the spatial and channel dimensions, so it does not lose too much information. Since there is no compression in the spatial and channel dimensions, it will naturally cause problems such as too much computation and memory explosion if the dimension is not reduced.
On the other hand, Polarized Self-Attention (PSA) has two design advantages that are different from other attention mechanisms, namely, Polarization Filtering and Enhancement, where Polarization Filtering serves to improve the contrast of the image. Since the total intensity is lost during the filtering process, additional compensation is needed to recover the original information. This leads to the introduction of filtering and High Dynamic Range (HDR), where filtering completely collapses the features in one dimension and keeps the dimensions in the orthogonal direction at high resolution. HDR increases the attention range with a Softmax function on the smallest tensor module of the attention module and then maps it dynamically with a Sigmoid function. The Polarized Self-attention mechanism takes full advantage of the self-attention mechanism’s modeling capability and helps improve the segmentation accuracy of the network in this paper. The structure of the Polarized Self-Attention mechanism is shown in Figure 8.
2.6. Loss Function
The loss function in this paper is obtained by adding the Cross-entropy loss function and Dice loss function. The mixed-use of the loss function can improve the ability of the network to detect small targets and enhance the segmentation ability. The loss function in this paper is shown in Equation (1).
The Cross-entropy loss function is the most commonly used in classification, which measures the difference in a probability distribution. y is the actual probability of sample xi, fθ(x) is the predicted fraction of a specific sample probability, and S denotes the Softmax function. The multiclassification Cross-entropy loss function is shown in Equation (2).
The Dice loss function was first proposed in V-net [42] and has been widely used in medical image segmentation. The Dice loss function is named after the Dice coefficient, a metric function used to evaluate the similarity of two samples. The Dice coefficient compares whether the predicted image labels are similar to the samples of the actual image labels, and an enormous value means that the two samples are more similar. The mathematical expression of the Dice coefficient is shown in Equation (3).
The mathematical expression of the Dice loss function is shown in Equation (4).
2.7. Evaluation Methodology Indicators
In this experiment, Pixel Accuracy (PA), Mean Pixel Accuracy (mPA), and Mean Intersection over Union (mIoU) are used to measure the segmentation of pixel points.
Pixel Accuracy, which indicates the number of correctly segmented pixels as a percentage of all pixels, can be used to evaluate the global accuracy of the model. For k + 1 class segmentation targets, where the target to be segmented is class k, and when the background is class 1. The formula pii denotes the number of correctly classified pixels; pij denotes the number of pixels whose class i is predicted to be class j. The pixel accuracy calculation formula is shown in Equation (5).
Mean Pixel Accuracy, which represents the average of all category pixel accuracies, is the sum divided by the number of categories, as shown in Equation (6).
Mean Intersection over Union, which calculates the arithmetic mean of the intersection ratios in each category, is used to measure the pixel overlap of the dataset. Mean Intersection over Union is shown in Equation (7).
3. Results
3.1. Related Work on Organ
The multi-organ segmentation experimental environment is a computing platform with a Win11 operating system, INTEL-12900K processor, and RTX4090 24G × 2 graphics card. The experimental code uses Python programming language, and the deep learning framework is Pytorch. CI-UNet model training uses the Adam optimization algorithm. The output image size is 256 × 256. The training’s start learning rate is 1 × 10⁻⁵, the termination learning rate is 0.01 times the start learning rate, and the cyclical learning rate can obtain better training results [43]. The momentum parameter of the optimizer is 0.9, the second moment is 0.999, and the batch size of the model training is 8. The training generations are the sum of the Cross-entropy loss function and Dice loss function, and the total training generations are 100. The ratio of the training set and validation set is 8:2.
In this section, we experiment with the Chaos dataset, which has 623 original images. The 623 original data do not give good results, so proper data enhancement is needed. We use a rotation of 10 degrees for data augmentation, and we use data augmentation for two reasons:
- Some data enhancement methods cannot transform the original data image and label at the same time. In contrast, image rotation can make the image and label produce the same change, and the structure and change in the original image are small;
- As a proven method of image enhancement, image rotation is widely used in various fields and has strong versatility.
In this paper, we conducted ablation experiments for the rotation angle of the image, and we selected 5°,10°, 20°, and 30° for the angle transformation, which is used for VGG16 backbone UNet network for the experiments. The results of different rotation angles in the VGG16 network are shown in Table 1.
Table 1 shows that the best mIoU and mPA evaluation metrics performance was achieved at a rotation angle of 10°. A very likely reason for this situation is that the selection of the angular band has a tangible impact on the nature of the data. Medical images usually need to preserve spatial orientation, and a more significant rotation may make the images unrealistic from a clinical point of view. There is little difference in the evaluation metrics between the rotation angle of 5° and 10°. However, we enhanced the data with a rotation angle of 10° to create a moderate differentiation in the images. We believe that setting an angle of 10° and being able to expand the dataset will not affect the image characteristics of the dataset significantly. Therefore, this paper selects the expanded dataset with a rotation angle of 10° as the experimental dataset.
Cutout as a data enhancement method can cope with regularization well, but excessive Cutout can reduce the accuracy of the network. Here, we take three different degrees of Cutout data enhancement methods for ablation experiments. The results of ablation experiments with different degrees of Cutout are shown in Table 2.
When validating the dataset with Cutout using the VGG16 backbone UNet, it was found that the accuracy of the evaluation metrics obtained when using a Cutout ratio of 30% was better than when using a Cutout ratio of 20% and 40%. We analyze the reason for this. As deep learning training is prone to overfitting, various regularization methods are needed. Cutout is a unique form of Dropout. The size of the feature map values of the shallow feature map has increased, and the distribution of the deep feature map is wider. We selected a combination of Rotation 10° and Cutout for data enhancement from the above experimental results. We used Cross-Validation [44,45,46] to select the dataset parameter. Cross-Validation helps to perform model parameter determination and, simultaneously, can avoid the limitations and specificity of fixed division datasets. The primary purpose of conducting crossover experiments is to determine the appropriate learning rate, optimizer, and second moment. We choose the generic 0.9 and 0.999 to conduct the experiments. The Cross-Validation results are shown in Figure 9a,b.
As can be seen from Figure 9 above, in each cross-validation, the starting learning rate is 1 × 10⁻⁵ when each evaluation index is the best, the training set for Cross-Validation is 1495 sets, and the validation set is 374 sets. In the following experiments, we will determine the use of 1 × 10⁻⁵ as the learning rate parameter since the experimental results of the first group in the above crossover experiments were much higher than those of the other groups. To eliminate fluctuations, in this section, this experiment selects the average of 5 sets of experiments, the third set of experimental data for the experiment.
The following will outline and explains the results of our experimental analysis of predictive tomographic abdominal organ segmentation. By comparing the different structures of UNet, PSPNet [47], DeepLabv3+, MRI-specific algorithms, and our algorithm CI-UNet.
The ablation results of different backbone UNet networks are shown in Table 3.
The PA index reflects the global degree of correct pixel point classification, which is relatively unconvincing because the background pixel points of tomographic organ images account for the vast majority of the background pixel points, resulting in small changes in the PA index. Therefore, the paper mainly uses mIoU and mPA index data for experimental ablation illustration. From the control of mIoU and mPA index data, it can be found that the extraction effect of double convolution backbone UNet is the worst. The mIoU metric of the double convolutional backbone UNet is 73.25%, and the mPA metric is 83.32%. The monotonic structure of the UNet backbone network makes the network perform poorly in image feature information extraction, which makes the mIoU and mPA metrics much lower than the VGG16 backbone UNet, and the ResNet50 [48] backbone UNet mIoU metrics of VGG16 backbone UNet and ResNet50 backbone UNet are relatively close, 79.37% and 78.71%, respectively, and mPA metrics are 86.88% and 88.08%, respectively. mPA metrics have a 1.2% difference, which is caused by the fact that the ResNet50 backbone UNet has more pixels correctly predicted category than the VGG backbone UNet during the prediction process. The circumstance of mPA metrics for each organ of the VGG16 backbone UNet network and ResNet50 backbone UNet are shown in Figure 10.
To refine the network and enable the network to focus on effective information during decoding, the SE attention mechanism [49], the Cbam attention mechanism [50], and the Polarized Self-Attention mechanism are selected for comparison in this paper. The results of the ablation of different trunk Attention UNet structures are shown in Table 4.
As seen in Table 4, the mIoU and mPA of the Attention UNet using the VGG16 backbone and PSA attention mechanism were 81.22% and 88.75%, respectively, while the mIoU and mPA metrics of the UNet neural network using the SE and Cbam attention mechanism under the same conditions were 79.75% and 87.02%, and 81.13% and 88.60%, respectively. Similarly, the mIoU and mPA of Attention UNet using ResNet50 backbone with PSA attention mechanism are 80.03% and 90.42%, respectively. In contrast, the mIoU and mPA metrics of neural networks using SE and Cbam attention mechanisms with the same backbone are 78.94% and 87.40%, and 79.47% and 88.63%, respectively. Table 4 shows that the Polarized Self-Attention mechanism improves the UNet segmentation network more than SE, and the Cbam attention mechanism in both ResNet50 or VGG16 backbone cases and the PSA attention mechanism improves better in refining the targets. In this paper, the information aggregation module is added based on Attention UNet, and the experimental results of the ablation of Attention UNet and CI-UNet are shown in Table 5.
The algorithm in this paper uses the VGG16 network to replace the double convolutional backbone and uses the PSA attention mechanism also adds the information aggregation module for fusing the image information between the layers. Table 5 shows that the experimental results of mIoU and mPA are 82.33% and 90.10%, respectively. Compared with UNet without adding the information aggregation module under the same conditions, the improvement in accuracy is 1.11%, and the improvement in mPA is 1.35%. The algorithm in this paper is also compared with the PSPNet algorithm and DeepLabv3+ algorithm. It is also compared with dedicated algorithms developed for MRI, such as M-FCN [51] and U-Net_based [52]. The ablation results of each algorithm are shown in Table 6.
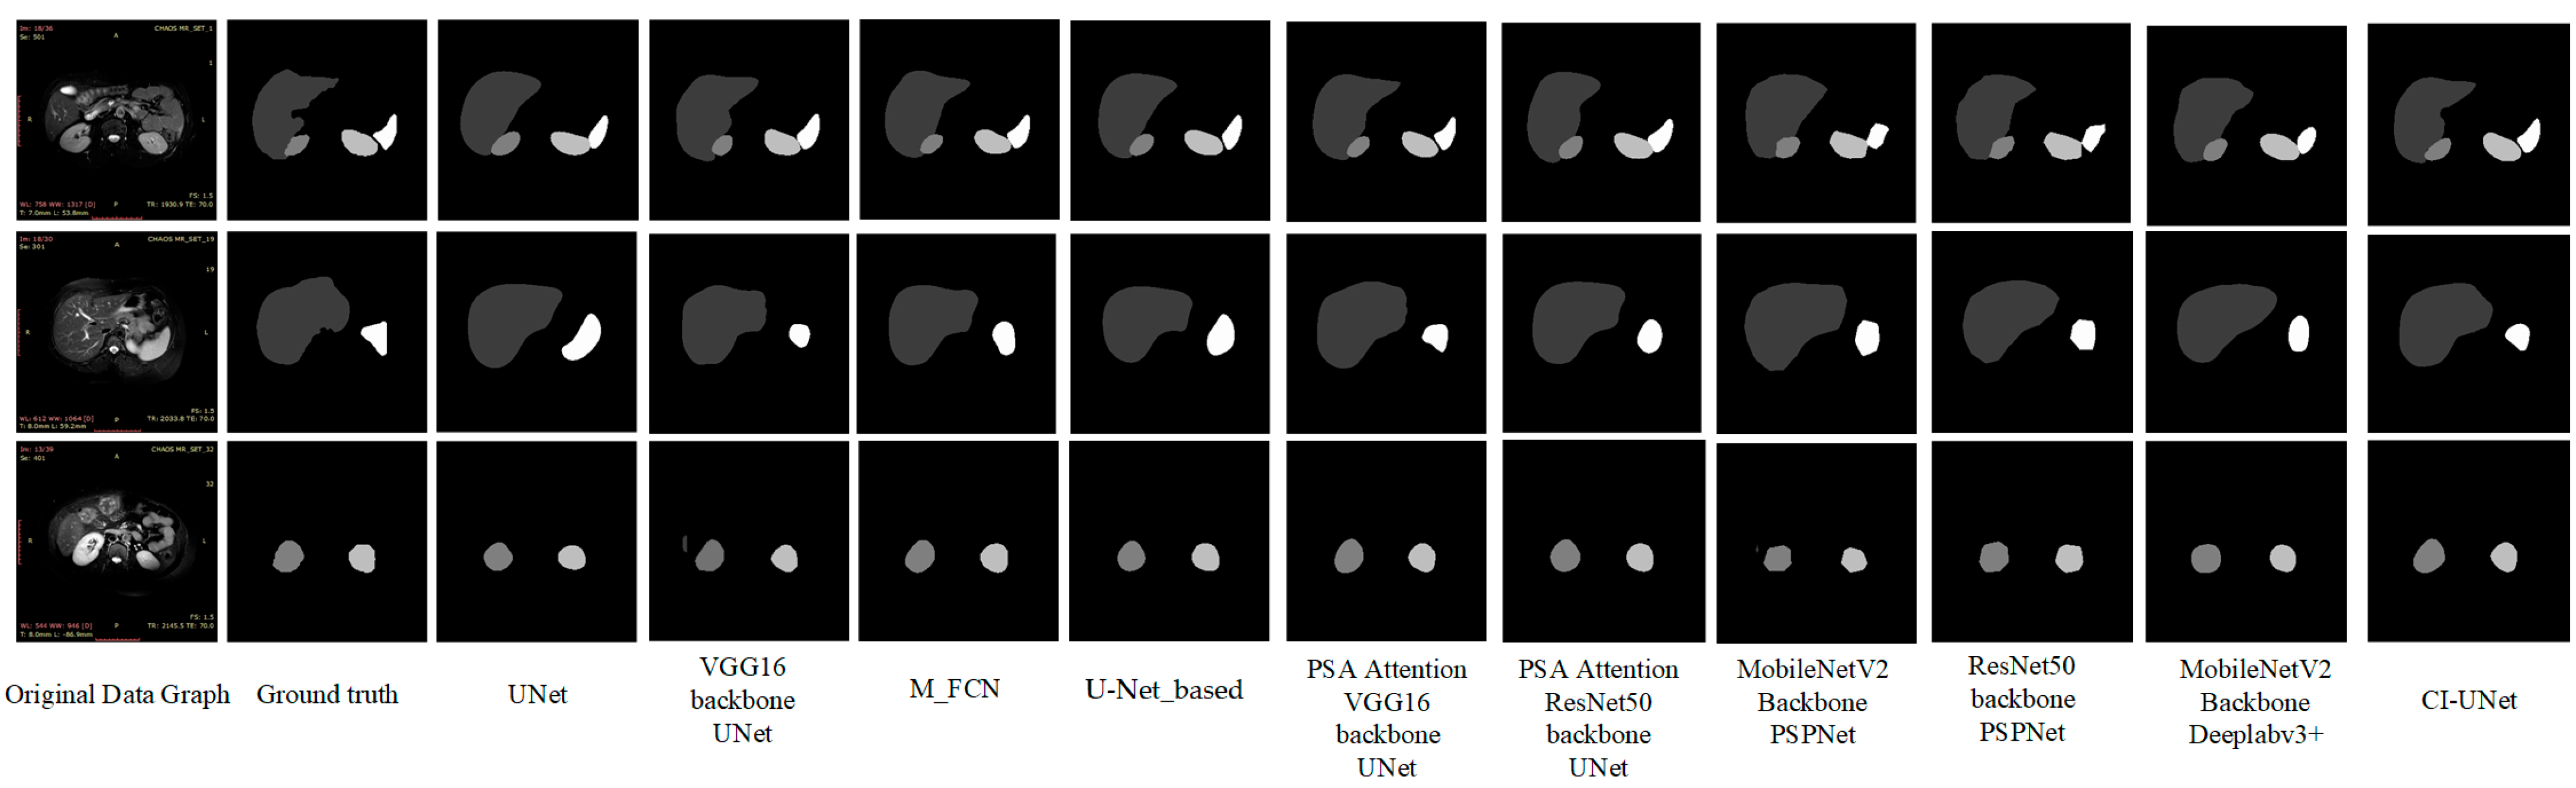
As can be seen in Table 6, the mIoU and mPA values of the ResNet50 backbone PSPNet network are 81.04% and 89.66%, respectively, lower than the algorithm in this paper by 1.28% and 0.44%, respectively. While the mIoU values of PSPNet and Deeplabv3+ networks using MobileNetV2 [53] backbones are 76.41% and 75.92%, which were lower than the algorithm in this paper by 5.92% and 6.41%, respectively. The mPA values were 87.02% and 86.04%, lower than the algorithm in this paper by 3.08% and 4.06%, respectively. We also found some dedicated algorithms for MRI 2d images for comparison. mIoU and mPA values for M-FCN are 77.21 and 86.40, respectively—5.12% and 3.7% lower than the algorithm in this paper. mIoU and mPA values for U-Net_based are 77.86 and 85.14, respectively, 4.47% and 4.96%, lower than the algorithm in this paper, respectively. The prediction plots of organ segmentation for each algorithm are shown in Figure 11.
As shown in Figure 11 above, based on visual observation, the algorithm in this paper is closest to the gold standard in terms of organ edge structure, and there are no organ prediction errors and more well-defined angles.
However, at the same time, we observed segmentation errors in the above VGG prediction result maps and PSPNet, and MobileNetV2 backbone prediction images, which all showed incorrect predictions of liver images in the third set of image predictions, of which we analyzed the reasons as follows:
- Segmentation errors due to unbalanced datasets, the accuracy of the model may be affected when dealing with unbalanced datasets. Since the number of samples in specific categories in the dataset is small, misclassification may occur, leading to a decrease in accuracy;
- Mislabeling of the dataset itself. If there is noise or outliers in the dataset, such as mislabeled data, it may also cause the neural network to learn the wrong patterns, leading to inaccurate predictions;
- Overlap between categories, where multiple objects exist for that image feature point;
- Overfitting, where the neural network is overtrained, resulting in features that need to be captured not being captured.
The confusion matrix of the algorithm in this paper on the validation set, the mIoU segmentation index for each organ, and the mPA segmentation index for each organ segmentation are shown in Figure 12a–c.
In this paper, the Chaos dataset was utilized to design a multi-organ segmentation task, and the weights were obtained after the network completed training in this paper. The CI-UNet designed in this paper can segment multiple organs in a single prediction. We have selected some representative images from the Chaos validation set for multi-organ segmentation image prediction. There are some typical features in our validation images, and the following six image structures are typical:
- No-organ images;
- Single-organ liver images;
- Left and right kidney images;
- Liver, left, and right kidney images;
- Liver, left kidney, and spleen images;
- Liver, left and right kidney, spleen images.
We use CI-UNet to make predictions for each of the above six typical images, and the prediction results are shown in Figure 13.
Data imbalance is the main problem that causes segmentation errors and affects network accuracy. Network training is more effective when the datasets inside the training set are more balanced. In the Chaos dataset, the large sample class is background, liver. The problem of unbalanced data in this paper still needs to be solved. We balance the dataset by sampling most of the samples and augmenting a few samples. After data enhancement, we processed the chaotic dataset by removing the background-only images, and the total number of images released was 300. The data images with only the liver were removed. The number of removed images is 60. Experiments were conducted for this dataset using CI-UNet and the results are shown in Table 7.
By observing Table 7, we can find that the indicators demonstrate a slight performance improvement, and we analyze the advantages of balanced datasets as follows:
- Improving model performance: When the number of samples in different categories in a dataset is unbalanced, the model tends to predict the categories with higher numbers and ignore those with lower numbers. By balancing the dataset, the number of samples in each category can be made closer, thus reducing bias and improving the learning ability of the model for each category, improving the model performance;
- Preventing overfitting: Dataset imbalance may lead to model overfitting, i.e., learning better for a more significant number of categories and worse for a smaller number of categories. It may affect the generalization ability of the model. By balancing the dataset, the risk of overfitting can be reduced, and the model can be better adapted to the samples of each category;
- Improving the accuracy of evaluation metrics: Commonly used evaluation metrics such as accuracy can give misleading results when the dataset is unbalanced. By balancing the dataset, the evaluation metrics can be made to reflect the model’s performance in each category more accurately.
The results of Grad-CAM used for the organ image are shown in Figure 14.
By observing Figure 14, it can be seen that the attention for each individual organ is basically focused on the organ attachment structures, and similar identical structures receive some lower ranking attention.
3.2. Related Work on Spine
The spine segmentation experimental environment is the same as the multi-organ segmentation task, with experimental parameters of maximum learning rate of 1 × 10⁻⁴ and the termination learning rate is 0.01 times the start learning rate, momentum parameter of the optimizer of 0.9 and second moment of 0.999, batch size of model training of 8, training generations as the sum of Cross-entropy loss function and Dice loss function, and total training generations of 100.
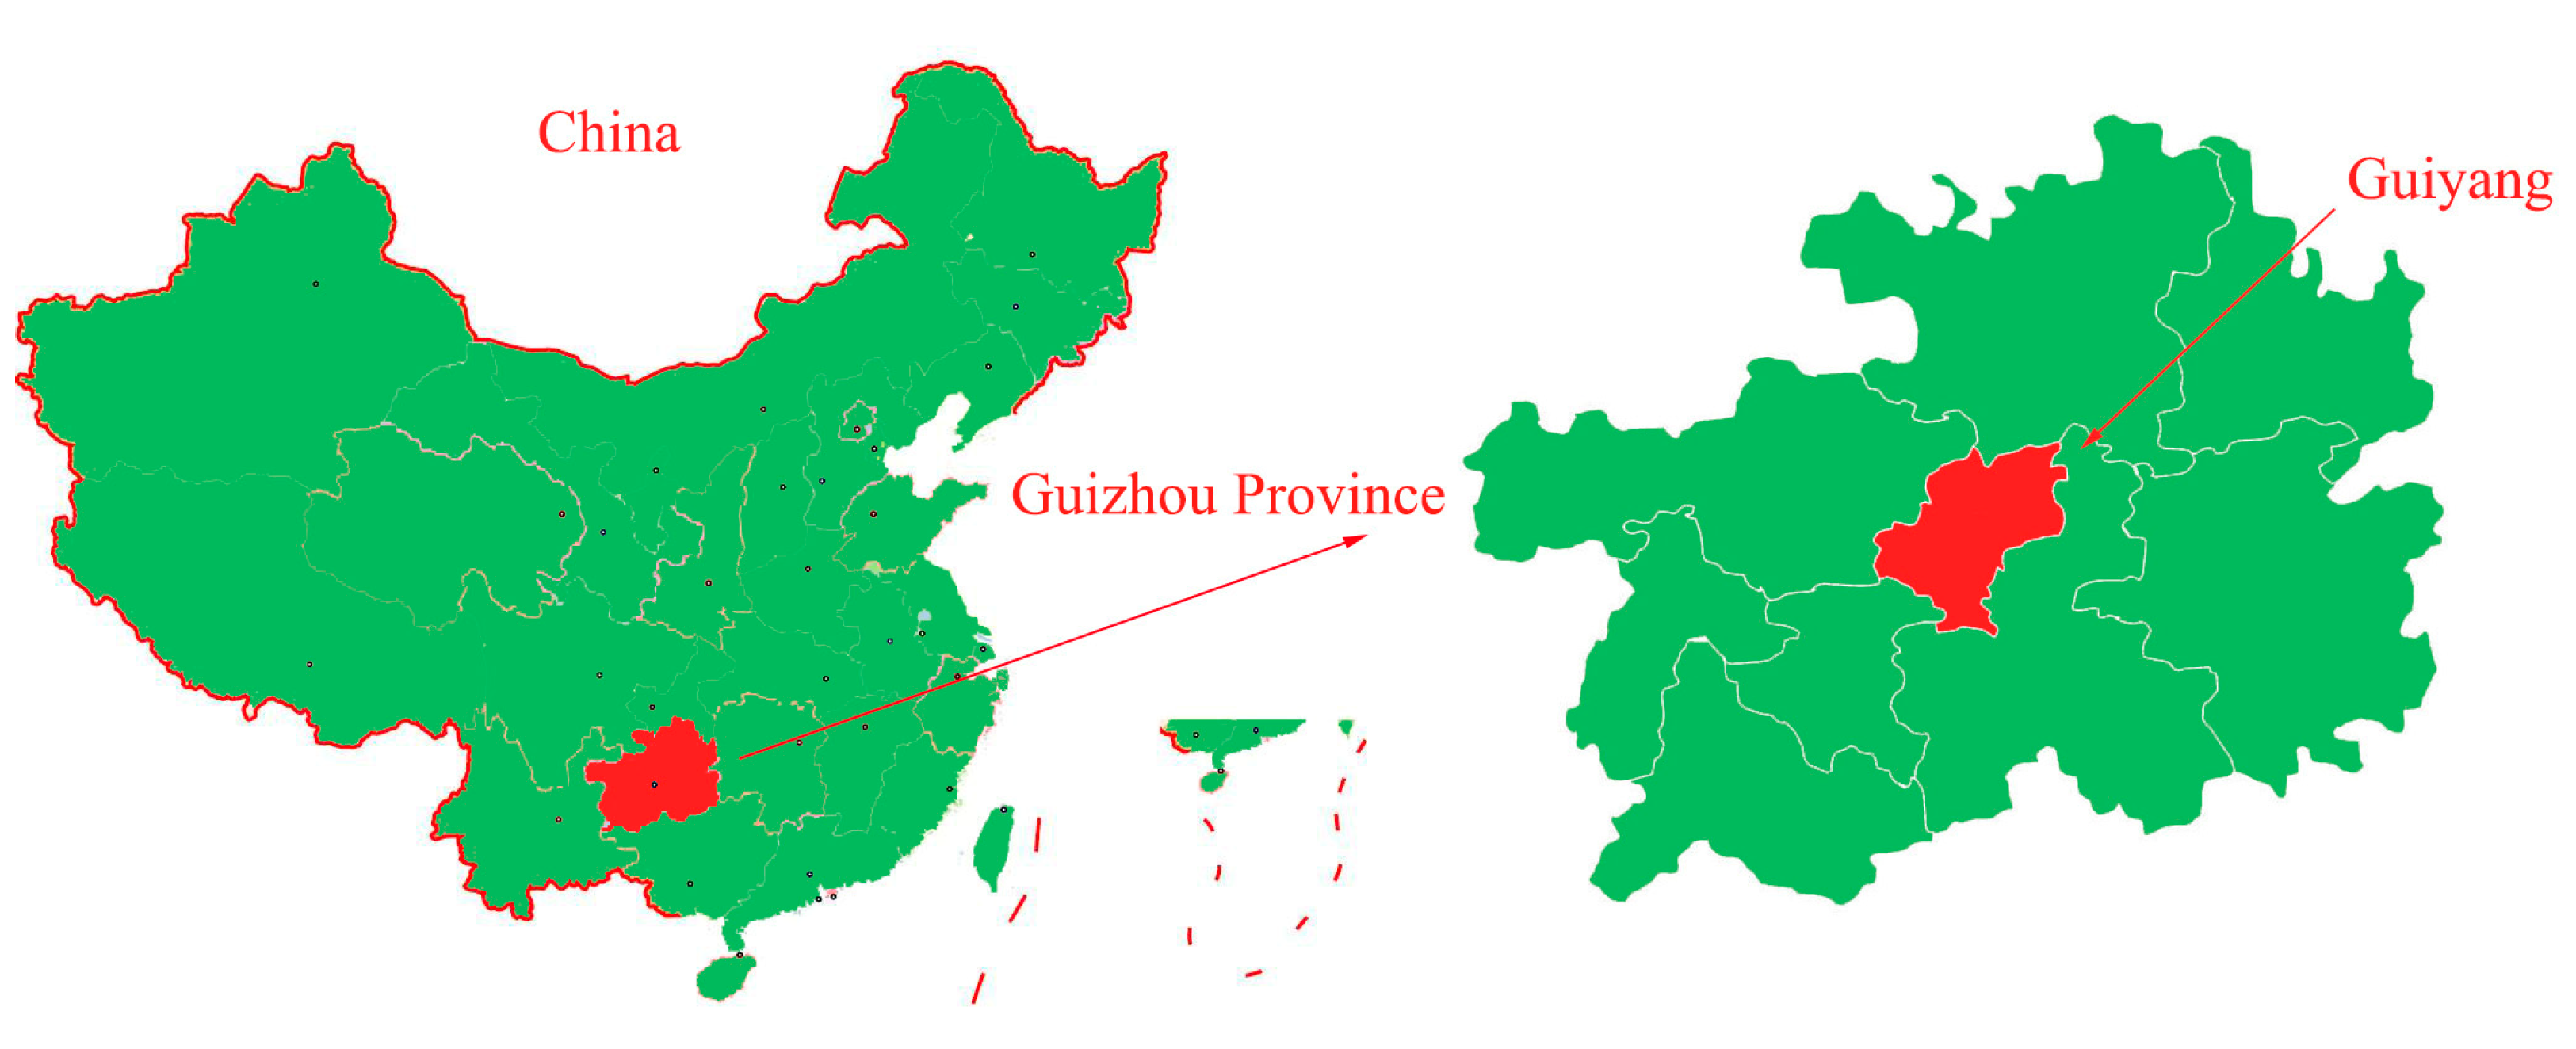
We applied the CI-UNet network designed in this paper to the spine dataset of the Guizhou branch of Beijing Jishuitan Hospital. The geographical location of Guiyang City, Guizhou Province, is shown in Figure 15.
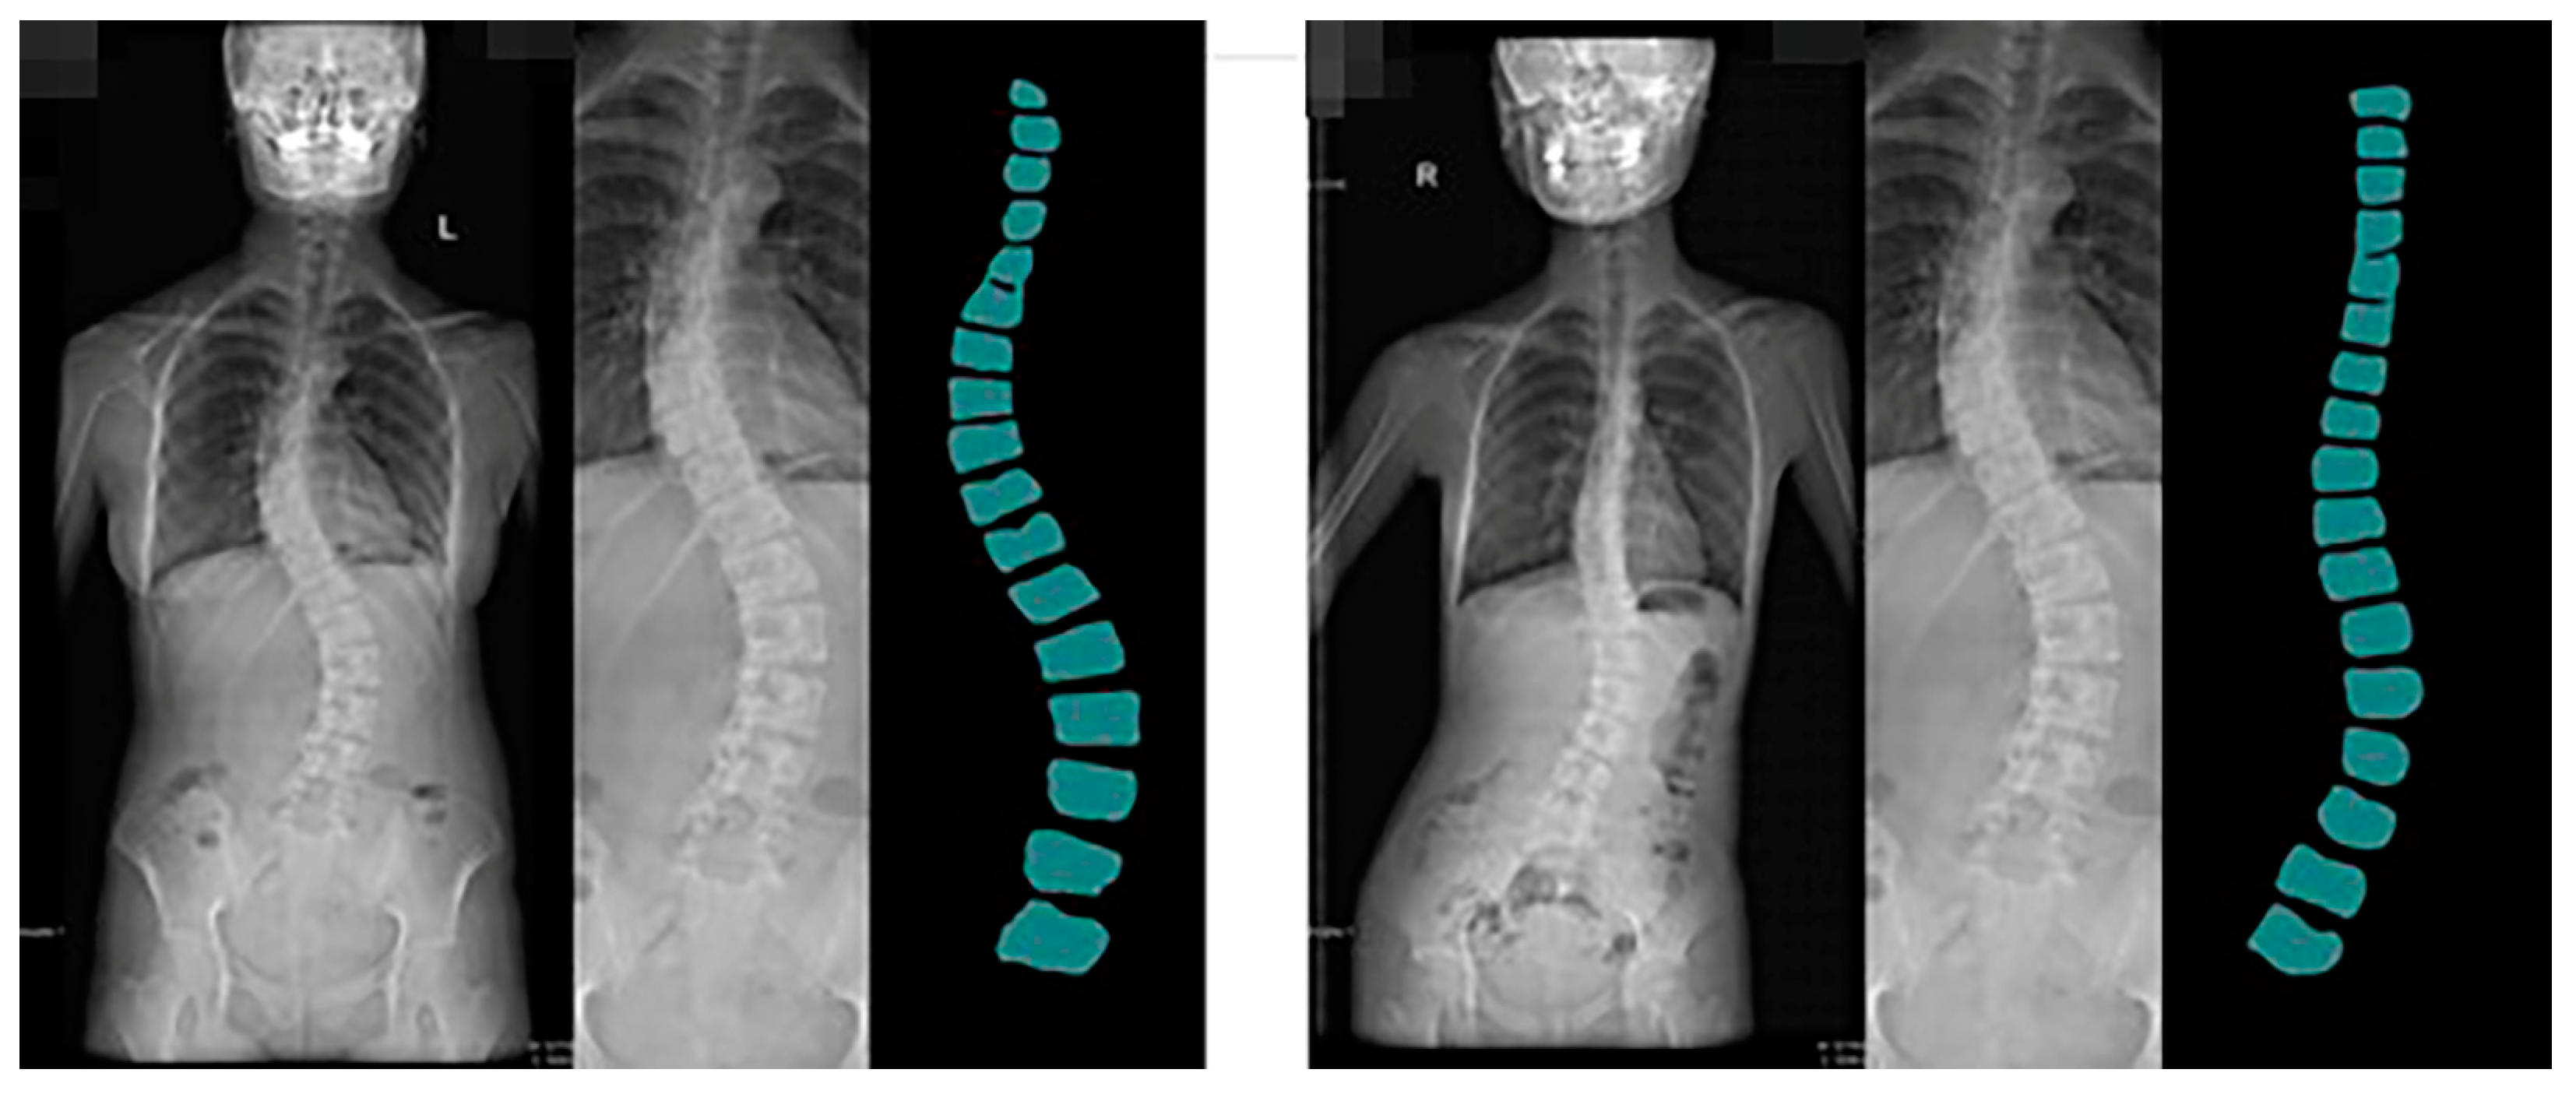
Guizhou Province is the most affected area by coal-fired fluorosis. The coal-burning type of ground fluorosis, and coal-burning polluted endemic fluorosis is a type of ground fluorosis unique to China in the world, affecting about 15 million people, with about 10 million people suffering from dental fluorosis and about 1 million people suffering from bone fluorosis. Fluorosis severely affects residents’ bone health and quality of life [54]. The spine dataset of the Guizhou branch of Beijing Jishuitan Hospital uses X-ray images of the spine medical images, which reflect the bone quality of the inhabitants of Guizhou province, China, between the ages of 18 and 70. Due to geological conditions and the level of economic development, middle-aged and elderly residents have poor height development and often suffer from a range of diseases, including scoliosis, which is particularly serious. This dataset was developed in collaboration with the Guizhou branch of Beijing Jishuitan Hospital. Many ortho X-ray medical images of residents in Guizhou province were retrieved to produce the dataset. Due to privacy and legal issues, this dataset cannot be made public, and this dataset is labeled by is manually labeled. The segmentation prediction results generated by CI-UNet are shown in Figure 16.
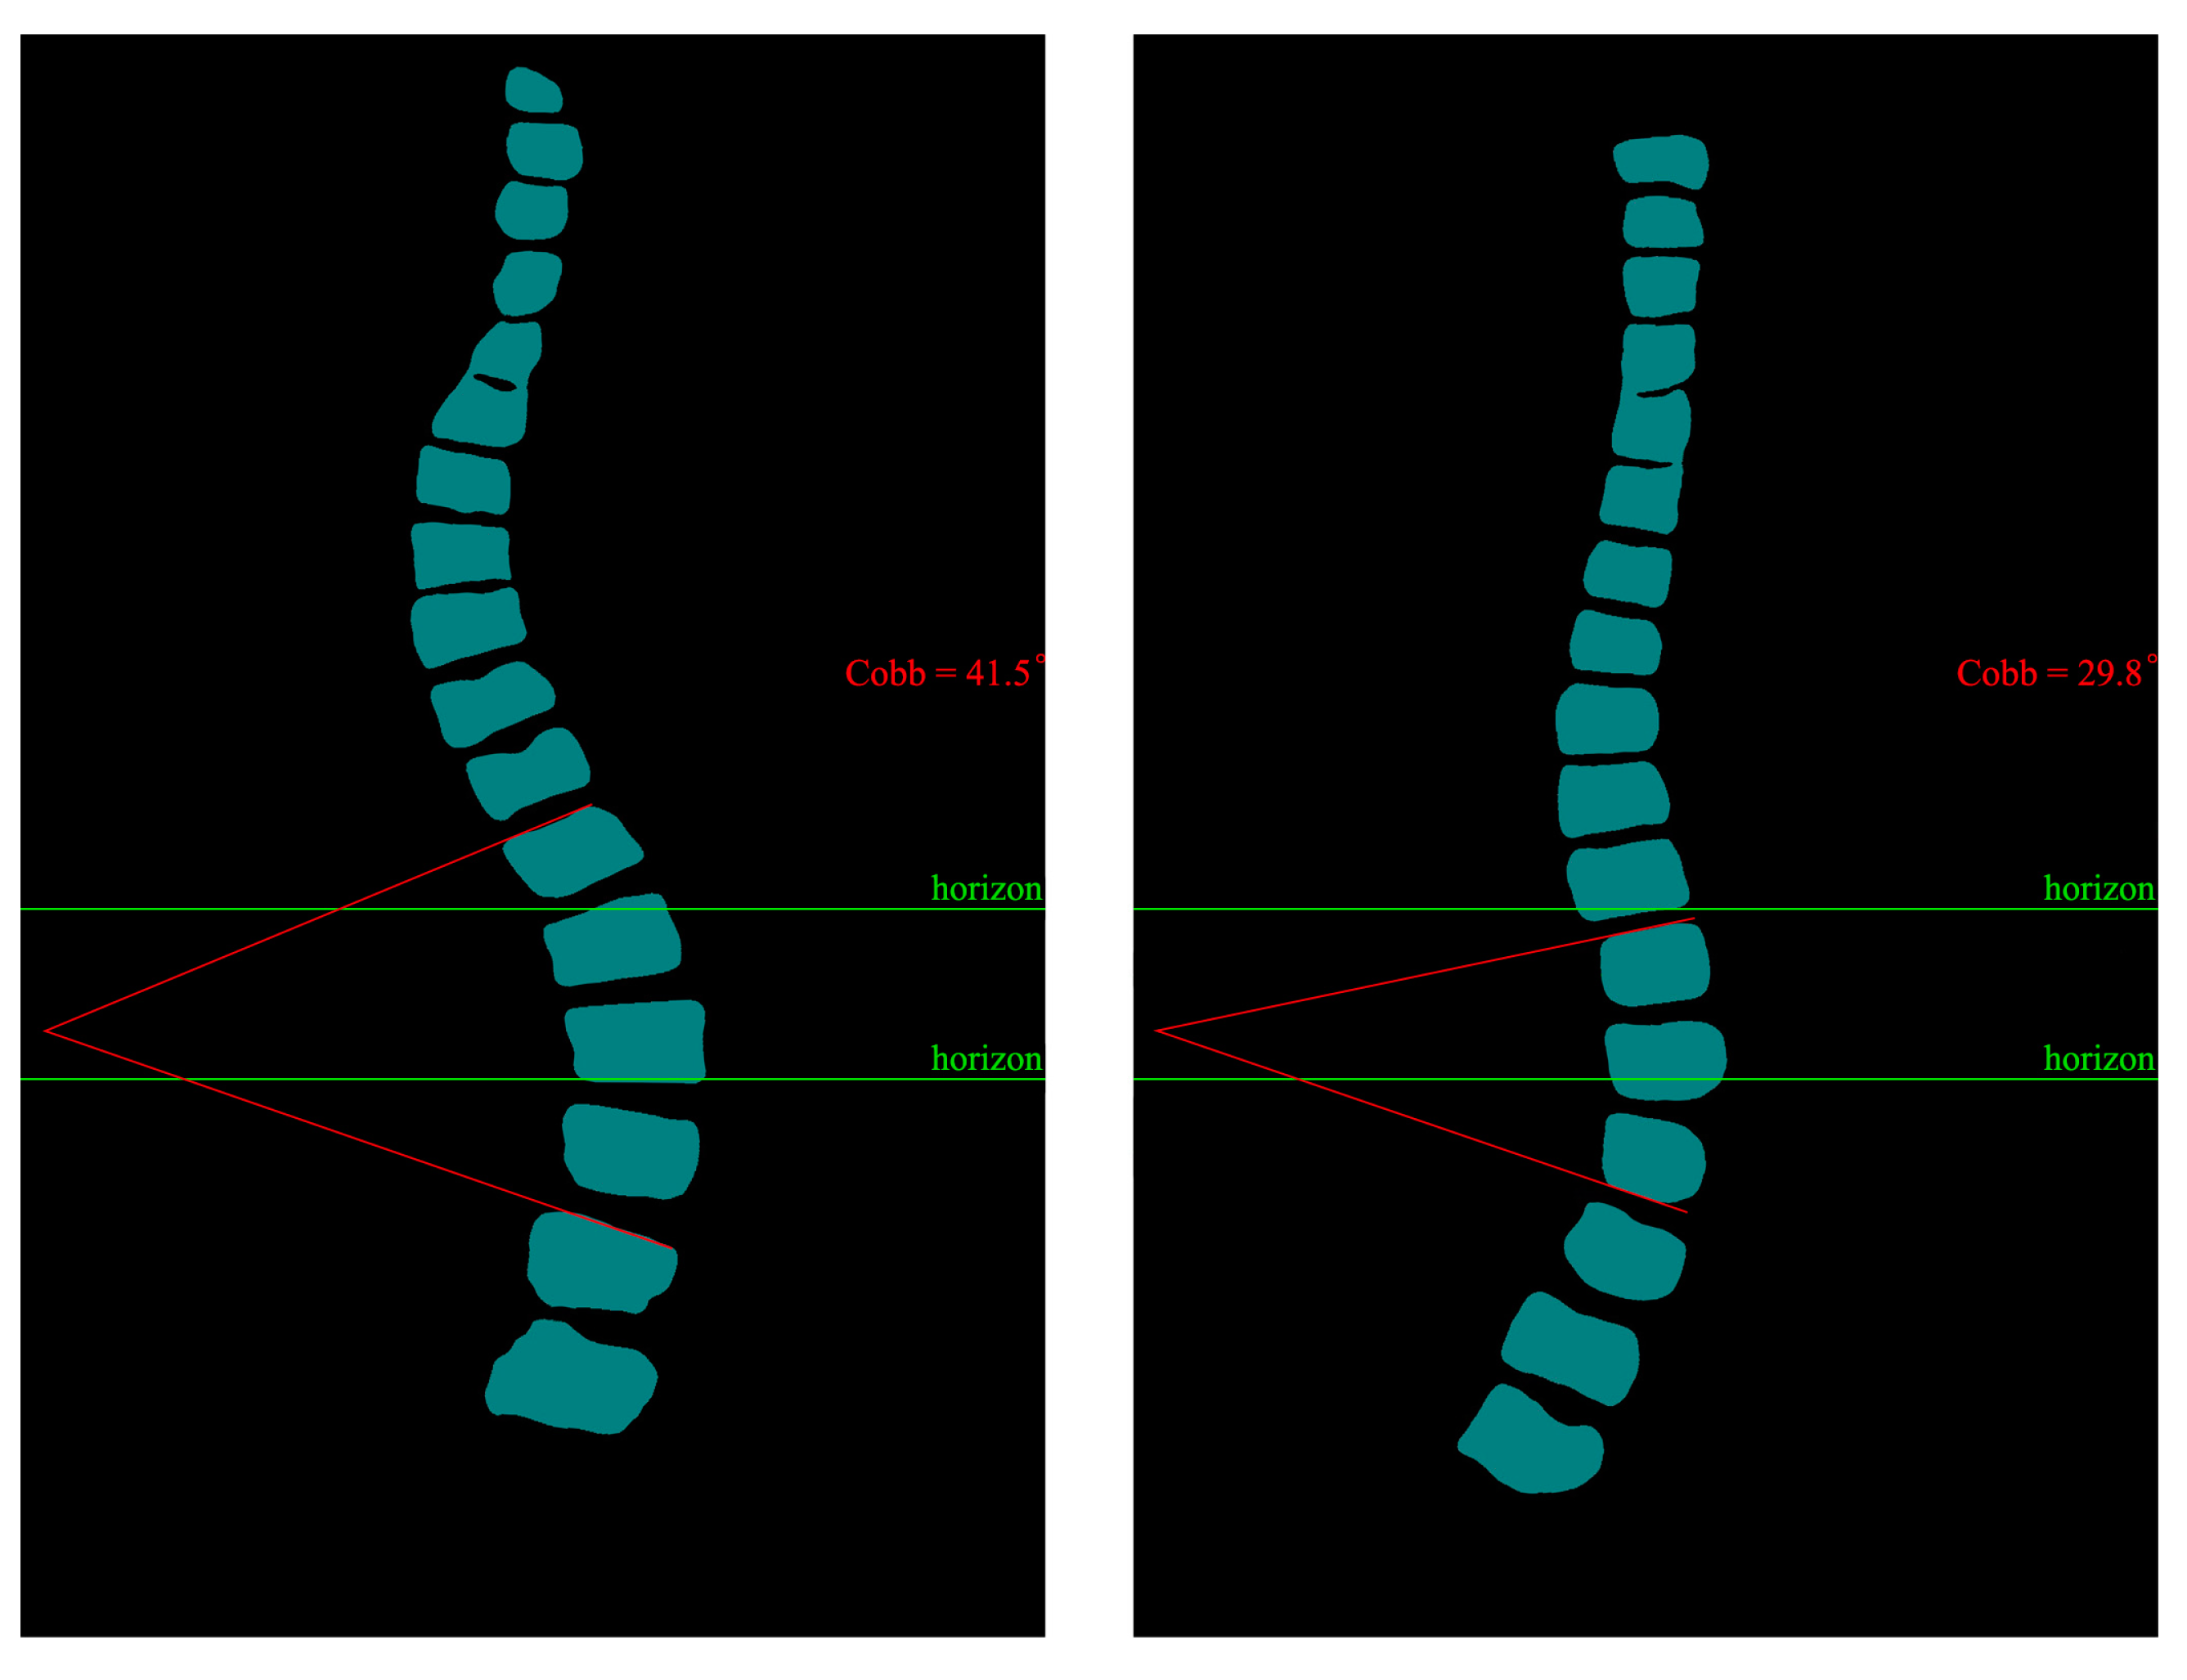
Training datasets need to be increased, resulting in less-than-optimal predictive segmentation. In the future, we will invest more human and material resources to solve the problem of data volume labeling. At the same time, we will produce more datasets for the local high prevalence of diseases. Based on the predicted images obtained, we calculated the angle of curvature of the spine. We chose the internationally used Cobb [55,56] index for spinal curvature assessment. The Cobb angle is a standard method used to measure the degree of scoliosis. It determines the degree of scoliosis by measuring the lateral bending angle of two adjacent vertebrae. Specifically, the Cobb angle is derived from the angle between two vertical lines drawn from the upper to lower surfaces of the two vertebrae.
During the measurement, the physician selects the two most curved adjacent vertebrae, draws a vertical line on their upper and lower surfaces, and then measures the angle between these two lines. This angle is the Cobb angle. Usually, the greater the Cobb angle, the more severe the scoliosis.
The Cobb angle is commonly used to diagnose scoliosis in adults, children, adolescents, and other spinal deformities. It is one of the most important indicators to assess the degree of scoliosis and the choice of treatment options. We calculated the prediction results based on the principle of Cobb calculation. The predicted image Cobb calculation results are shown in Figure 17.
We have discussed with the spine doctors that CI-UNet predictive imaging can significantly help them improve their efficiency by producing semi-automatic calculations for scoliosis alone. The doctors are very receptive to our work, and we will follow up with more tasks for more body structures.
For the segmentation task of the spine, we performed the same task as the multi-organ segmentation task described in the previous section, and the results of the spine segmentation experiments for each network are shown in Table 8.
The results of the spine segmentation experiments are shown in Table 8. We found that the mIoU and mPA metrics of the VGG backbone are higher than the ResNet50 backbone metrics in the spine segmentation experiments. Compared with the double convolutional backbone UNet, CI-UNet is 12.35 percentage points higher in the mIoU metric and 4.76 percentage points higher in the mPA metric. Compared with the MobileNetV2 and ResNet50 backbone PSPNet, CI-UNet is 13.2 and 9.9 percentage points higher in mIoU metrics and 5.25 and 4.23 in mPA metrics, respectively. Compared with M-FCN, it is 6.76% higher in the mIoU metric and 2.74% higher in the mPA metric. Compared to U-Net_based, it is 6.2% higher in the mIoU metric and 2.34% higher in the mPA metric. The total amount of data of the spine dataset of the Guizhou branch of Beijing Jishuitan Hospital is 200, and the ratio of the training set and validation set is 9:1. Due to the small amount of data, the experimental results may have large fluctuations. We can see from the comparison of the above results that the evaluation indexes of CI-UNet designed in this paper are superior compared with other networks.
4. Discussion
4.1. Main Findings
In this study, we apply multiple Deep Learning (UNet, Attention UNet, PSPNet, DeepLabv3+, and a dedicated network for MRI images) to model the segmentation of tomographic abdominal organ images. We extend the Chaos dataset by rotation and Cutout and perform ablation experiments using multiple Deep Learning models. The CI-UNet designed in this paper was finally obtained, and we found that the CI-UNet model outperformed other network models in all metrics. Meanwhile, we applied the CI-UNet designed in this paper to spinal segmentation to provide a solution for calculating the Cobb angle for the Guizhou branch of Beijing Jishuitan Hospital.
4.2. Model Performance
Comparing different backbone networks, we found that the mPA metrics were better when using the ResNet50 backbone network for the multi-organ segmentation task; however, in the spine segmentation experiments, we found that the VGG16 network had even better mIoU metrics. Since the network designed in this paper is mainly used for the application of spine segmentation, the overlap between the predicted image and Ground truth is more critical for spine segmentation, so we choose the VGG network as the backbone feature extraction network of CI-UNet in this paper. Comparing the three different attention mechanisms, we find that the Polarized Self-Attention mechanism fits the network model more closely and improves accuracy. Compared with PSPNet, DeepLabv3+, and other MRI-specific networks, our model is more advantageous. Comparing the three different attention mechanisms, we find that the Polarized Self-Attention mechanism fits the network model more closely and improves accuracy. When comparing with PSPNet, DeepLabv3+ networks, and MRI-specific networks, we found that our model is superior.
4.3. Mission Statement
In this study, tomographic abdominal multi-organ experiments were first performed. Then the network CI-UNet designed in this paper was linked to the spine segmentation. We needed a more accurate foreground segmentation of the spine because accurate edge segmentation could better facilitate our Cobb angle calculation. After our practical discussions with the physicians, the physicians approved our work. Therefore, this experiment is helpful for doctors.
4.4. Model Advantages
The UNet network is symmetrical and beautiful in morphology, and this paper integrates the UNet idea and feature fusion idea to design a CI-UNet network for the features of blurred boundaries, different shapes, and different sizes of tomography abdominal organ images. A method for organ shape segmentation of MRI images based on the CI-UNet network is proposed through extensive experiments. The main contributions and innovations are as follows:
- In the multi-organ segmentation task, image rotation and Cutout data enhancement were performed for the case of an insufficient dataset, and the most suitable enhancement method for the multi-organ organ segmentation task was finally obtained through ablation experiments, which was both rotations by ten degrees and Cutout by 30 percent of the image.
- The UNet dual convolutional feature extraction network is replaced by the VGG16 network equipped with Transfer Learning in the encoding network. The information aggregation module is designed to fuse the feature maps of the network networks of two adjacent layers to diversify the information of the feature maps entering the jump link part to solve the problems of low accuracy of organ edge segmentation and failure to detect some organs due to monotonic transfer.
- Adding a Polarized Self-Attention mechanism to the decoding network can enhance the feature representation of the output information of the jump connection layer so that the network can focus on conveying organ image shape features and improve the accuracy of organ shape segmentation.
- The hybrid loss function is constructed by using the Cross-entropy loss function and the Dice loss function, which can not only effectively evaluate the similarity between the target and the gold standard by the Dice loss function, but also can make the network model converge quickly by Cross-entropy stable backpropagation of the corresponding gradient of each category. To verify the method’s effectiveness in this paper, extensive experiments are conducted on the Chaos dataset. The results show that the proposed model can separate the image features and avoid redundant, repetitive transmission of irrelevant information. Furthermore, the average cross-merge ratio of organ segmentation reaches 82.33%, and the average pixel accuracy reaches 90.10%, significantly higher than many other networks. In the above experimental data, the spleen and left kidney have fewer label prospects than other organs, resulting in poor organ segmentation. We designed a scheme to balance the dataset by sampling most samples. A balanced dataset can effectively prevent overfitting, increase robustness, and allow the network to obtain better training accuracy. At the same time, we put CI-UNet into the practical application of spine segmentation and actively discuss with physicians; our work will relieve physicians’ work pressure and provide them with a reference for computer-aided diagnosis.
- When put into practical application, the network of this paper was also applied to the dataset of the Guizhou branch of Beijing Jishuitan Hospital, where a private dataset was set up according to the actual situation in Guizhou. Here, we also conducted experiments to calculate the spinal curvature angle using the international standard Cobb angle calculation, and the doctors approved the results.
5. Conclusions
This paper proposes a deep learning-based image segmentation network for empirically predicting stemmed medical segmentation images with minor improvements in segmentation edges and accuracy. We can summarize our main contributions as follows. First, we built a deep learning-based prediction model to predict abdominal organ segmentation images. We explored the enhanced dataset using pre-ablation and cross-validation experiments to obtain the optimal parameters. Secondly, the model can better reflect the edge segmentation of organs and slightly improve the accuracy. Thirdly, the application of CI-UNet to spine image segmentation with better results was approved by physicians. In addition, it is expected that these re- results will help to develop spine segmentation images and assist in calculating spine bending angles.
There are some potential limitations of our study. In spine segmentation and angle calculation, the spine prediction results are misjudged when our predicted images have some stray or misjudged points; we will fix our calculation method and expand our spine dataset to find better training parameters for the network. Later, we will conduct more and better deep-learning research around orthopedic diseases in the local population of Guizhou province to better serve doctors’ diagnoses.
Author Contributions
Conceptualization, Z.H., X.W. and J.Q.; methodology, X.W. and J.Q.; software, X.W., D.M. and J.Q.; validation, Q.W., Z.H. and J.Q.; formal analysis, J.Q.; investigation, Q.W., X.W. and J.Q.; data curation, D.M. and J.Q. writing—original draft preparation, D.M. and J.Q.; writing—review and editing, Y.T. and J.Q.; visualization, X.W., Y.T. and J.Q.; supervision, X.W. All authors have read and agreed to the published version of the manuscript.
Funding
This work was supported in part by the National Natural Science Foundation of China under grant 61861007 and 61640014; in part by the Guizhou Province Science Technology Support Plan under grant [2022]264; in part by the Guizhou Education Department Innovation Group Project under grant KY [2021]012; and in part by the Guizhou Province Science and Technology Planning Project ZK [2021]303.
Informed Consent Statement
Informed consent was obtained from all subjects participating in the study, and written informed consent was also obtained from patients for the publication of this article.
Data Availability Statement
The data are currently being withheld due to the privacy of the individuals for whom the dataset was designed.
Acknowledgments
We would like to thank Zhao Guoquan from the Guizhou Branch of Beijing Jishuitan Hospital for his medical help and guidance on this article.
Conflicts of Interest
The authors declare no conflict of interest.
References
- Park, S. Clinical analysis for the correlation of intra-abdominal organ injury in the patients with rib fracture. Korean J. Thorac. Cardiovasc. Surg. 2012, 45, 246. [Google Scholar] [CrossRef]
- Lee, J.G.; Jun, S.; Cho, Y.W.; Lee, H.; Kim, G.B.; Seo, J.B.; Kim, N. Deep learning in medical imaging: General overview. Korean J. Radiol. 2017, 18, 570–584. [Google Scholar] [CrossRef] [PubMed] [Green Version]
- Suzuki, K. Overview of deep learning in medical imaging. Radiol. Phys. Technol. 2017, 10, 257–273. [Google Scholar] [CrossRef]
- Zhou, S.K.; Greenspan, H.; Davatzikos, C.; Duncan, J.S.; Van Ginneken, B.; Madabhushi, A.; Prince, J.L.; Rueckert, D.; Summers, R.M. A review of deep learning in medical imaging: Imaging traits, technology trends, case studies with progress highlights, and future promises. Proc. IEEE 2021, 109, 820–838. [Google Scholar] [CrossRef]
- Razzak, M.I.; Naz, S.; Zaib, A. Deep learning for medical image processing: Overview, challenges and the future. In Classification in BioApps: Automation of Decision Making; Springer: Cham, Switzerland, 2018; pp. 323–350. [Google Scholar]
- Shehab, L.H.; Fahmy, O.M.; Gasser, S.M.; El-Mahallawy, M.S. An efficient brain tumor image segmentation based on deep residual networks (ResNets). J. King Saud Univ.-Eng. Sci. 2021, 33, 404–412. [Google Scholar] [CrossRef]
- Hrosik, R.C.; Tuba, E.; Dolicanin, E.; Jovanovic, R.; Tuba, M. Brain image segmentation based on firefly algorithm combined with k-means clustering. Stud. Inform. Control 2019, 28, 167–176. [Google Scholar]
- Nuechterlein, N.; Mehta, S. 3D-ESPNet with pyramidal refinement for volumetric brain tumor image segmentation. In Brainlesion: Glioma, Multiple Sclerosis, Stroke and Traumatic Brain Injuries, Proceedings of the 4th International Workshop, BrainLes 2018, Held in Conjunction with MICCAI 2018, Granada, Spain, 16 September 2018; Springer International Publishing: Cham, Switzerland, 2019. [Google Scholar]
- Radha, R.; Gopalakrishnan, R. A medical analytical system using intelligent fuzzy level set brain image segmentation based on improved quantum particle swarm optimization. Microprocess. Microsyst. 2020, 79, 103283. [Google Scholar] [CrossRef]
- Dou, Q.; Chen, H.; Jin, Y.; Yu, L.; Qin, J.; Heng, P.A. 3D deeply supervised network for automatic liver segmentation from CT volumes. In Medical Image Computing and Computer-Assisted Intervention–MICCAI 2016, Proceedings of the 19th International Conference, Athens, Greece, 17–21 October 2016; Springer International Publishing: Cham, Switzerland, 2016. [Google Scholar]
- Fan, T.; Wang, G.; Li, Y.; Wang, H. Ma-net: A multi-scale attention network for liver and tumor segmentation. IEEE Access 2020, 8, 179656–179665. [Google Scholar] [CrossRef]
- Xie, X.; Pan, X.; Shao, F.; Zhang, W.; An, J. Mci-net: Multi-scale context integrated network for liver ct image segmentation. Comput. Electr. Eng. 2022, 101, 108085. [Google Scholar] [CrossRef]
- Lei, T.; Wang, R.; Zhang, Y.; Wan, Y.; Liu, C.; Nandi, A.K. DefED-Net: Deformable encoder-decoder network for liver and liver tumor segmentation. IEEE Trans. Radiat. Plasma Med. Sci. 2021, 6, 68–78. [Google Scholar] [CrossRef]
- Ye, C.; Wang, W.; Zhang, S.; Wang, K. Multi-depth fusion network for whole-heart CT image segmentation. IEEE Access 2019, 7, 23421–23429. [Google Scholar] [CrossRef]
- Liu, T.; Tian, Y.; Zhao, S.; Huang, X.; Wang, Q. Automatic whole heart segmentation using a two-stage u-net framework and an adaptive threshold window. IEEE Access 2019, 7, 83628–83636. [Google Scholar] [CrossRef]
- Liao, X.; Qian, Y.; Chen, Y.; Xiong, X.; Wang, Q.; Heng, P.-A. MMTLNet: Multi-Modality Transfer Learning Network with adversarial training for 3D whole heart segmentation. Comput. Med. Imaging Graph. 2020, 85, 101785. [Google Scholar] [CrossRef]
- Habijan, M.; Leventić, H.; Galić, I.; Babin, D. Whole heart segmentation from CT images using 3D U-net architecture. In Proceedings of the 2019 International Conference on Systems, Signals and Image Processing (IWSSIP), IEEE, Osijek, Croatia, 5–7 June 2019; pp. 121–126. [Google Scholar]
- Gite, S.; Mishra, A.; Kotecha, K. Enhanced lung image segmentation using deep learning. Neural Comput. Appl. 2022, 34, 1–15. [Google Scholar] [CrossRef]
- He, B.; Hu, W.; Zhang, K.; Yuan, S.; Han, X.; Su, C.; Zhao, J.; Wang, G.; Wang, G.; Zhang, L. Image segmentation algorithm of lung cancer based on neural network model. Expert Syst. 2022, 39, e12822. [Google Scholar] [CrossRef]
- Jalali, Y.; Fateh, M.; Rezvani, M.; Abolghasemi, V.; Anisi, M.H. ResBCDU-Net: A deep learning framework for lung CT image segmentation. Sensors 2021, 21, 268. [Google Scholar] [CrossRef]
- Hu, H.; Li, Q.; Zhao, Y.; Zhang, Y. Parallel deep learning algorithms with hybrid attention mechanism for image segmentation of lung tumors. IEEE Trans. Ind. Inform. 2020, 17, 2880–2889. [Google Scholar] [CrossRef]
- Chen, G.; Yin, J.; Dai, Y.; Zhang, J.; Yin, X.; Cui, L. A novel convolutional neural network for kidney ultrasound images segmentation. Comput. Methods Programs Biomed. 2022, 218, 106712. [Google Scholar] [CrossRef]
- Chen, G.; Dai, Y.; Zhang, J.; Yin, X.; Cui, L. MBANet: Multi-branch aware network for kidney ultrasound images segmentation. Comput. Biol. Med. 2022, 141, 105140. [Google Scholar] [CrossRef]
- Chen, G.P.; Zhao, Y.; Dai, Y.; Zhang, J.X.; Yin, X.T.; Cui, L.; Qian, J. Asymmetric U-shaped network with hybrid attention mechanism for kidney ultrasound images segmentation. Expert Syst. Appl. 2023, 212, 118847. [Google Scholar] [CrossRef]
- da Cruz, L.B.; Júnior, D.A.D.; Diniz, J.O.B.; Silva, A.C.; de Almeida, J.D.S.; de Paiva, A.C.; Gattass, M. Kidney tumor segmentation from computed tomography images using DeepLabv3+ 2.5 D model. Expert Syst. Appl. 2022, 192, 116270. [Google Scholar] [CrossRef]
- Maturana, D.; Scherer, S. Voxnet: A 3d convolutional neural network for real-time object recognition. In Proceedings of the 2015 IEEE, RSJ International Conference on Intelligent Robots and Systems (IROS), Hamburg, Germany, 28 September–2 October 2015. [Google Scholar]
- Garcia, A.; Donoso, F.; Rodriguez, J.; Escolano, S.; Cazorla, M.; Lopez, J. Pointnet: A 3d convolutional neural network for real-time object class recognition. In Proceedings of the 2016 International Joint Conference on Neural Networks (IJCNN), Vancouver, BC, Canada, 24–29 July 2016. [Google Scholar]
- Zhou, T.; Li, L.; Bredell, G.; Li, J.; Unkelbach, J.; Konukoglu, E. Volumetric memory network for interactive medical image segmentation. Med. Image Anal. 2023, 83, 102599. [Google Scholar] [CrossRef] [PubMed]
- Zhou, T.; Wang, W.; Konukoglu, E.; Van Gool, L. Rethinking semantic segmentation: A prototype view. In Proceedings of the IEEE/CVF Conference on Computer Vision and Pattern Recognition, New Orleans, LA, USA, 18–24 June 2022. [Google Scholar]
- Zhou, T.; Zhang, M.; Zhao, F.; Li, J. Regional semantic contrast and aggregation for weakly supervised semantic segmentation. In Proceedings of the IEEE CVF Conference on Computer Vision and Pattern Recognition, New Orleans, LA, USA, 18–24 June 2022. [Google Scholar]
- Li, L.; Zhou, T.; Wang, W.; Li, J.; Yang, Y. Deep hierarchical semantic segmentation. In Proceedings of the IEEE CVF Conference on Computer Vision and Pattern Recognition, New Orleans, LA, USA, 18–24 June 2022. [Google Scholar]
- Neuhold, G.; Ollmann, T.; Rota Bulo, S.; Kontschieder, P. The mapillary vistas dataset for semantic understanding of street scenes. In Proceedings of the IEEE International Conference on Computer Vision, Venice, Italy, 22–29 October 2017. [Google Scholar]
- Cordts, M.; Omran, M.; Ramos, S.; Rehfeld, T.; Enzweiler, M.; Benenson, R.; Franke, U.; Roth, S.; Schiele, B. The cityscapes dataset for semantic urban scene understanding. In Proceedings of the IEEE Conference on Computer Vision and Pattern Recognition, Las Vegas, NV, USA, 27-30 June 2016. [Google Scholar]
- Liang, X.; Gong, K.; Shen, X.; Lin, L. Look into person: Joint body parsing & pose estimation network and a new benchmark. IEEE Trans. Pattern Anal. Mach. Intell. 2018, 41, 871–885. [Google Scholar]
- Xia, F.; Wang, P.; Chen, X.; Yuille, A.L. Joint multi-person pose estimation and semantic part segmentation. In Proceedings of the IEEE Conference on Computer Vision and Pattern Recognition, Honolulu, HI, USA, 21–26 July 2017. [Google Scholar]
- Gillies, R.J.; Kinahan, P.E.; Hricak, H. Radiomics: Images are more than pictures, they are data. Radiology 2016, 278, 563–577. [Google Scholar] [CrossRef] [Green Version]
- DeVries, T.; Taylor, G.W. Improved regularization of convolutional neural networks with cutout. arXiv 2017, arXiv:1708.04552. [Google Scholar]
- Kavur, A.E.; Gezer, N.S.; Barış, M.; Aslan, S.; Conze, P.-H.; Groza, V.; Pham, D.D.; Chatterjee, S.; Ernst, P.; Özkan, S.; et al. CHAOS challenge-combined (CT-MR) healthy abdominal organ segmentation. Med. Image Anal. 2021, 69, 101950. [Google Scholar] [CrossRef] [PubMed]
- Everingham, M.; Van Gool, L.; Williams, C.K.I.; Winn, J.; Zisserman, A. The pascal visual object classes (voc) challenge. Int. J. Comput. Vis. 2010, 88, 303–338. [Google Scholar] [CrossRef] [Green Version]
- Simonyan, K.; Zisserman, A. Very deep convolutional networks for large-scale image recognition. arXiv 2014, arXiv:1409.1556. [Google Scholar]
- Liu, H.; Liu, F.; Fan, X.; Huang, D. Polarized self-attention: Towards high-quality pixel-wise regression. arXiv 2021, arXiv:2107.00782. [Google Scholar]
- Milletari, F.; Navab, N.; Ahmadi, S.A. V-net: Fully convolutional neural networks for volumetric medical image segmentation. In Proceedings of the 2016 Fourth International Conference on 3D Vision (3DV), Stanford, CA, USA, 25–28 October 2016. [Google Scholar]
- Smith, L.N. Cyclical learning rates for training neural networks. In Proceedings of the 2017 IEEE Winter Conference on Applications of Computer Vision (WACV), Santa Rosa, CA, USA, 27–29 March 2017. [Google Scholar]
- Berrar, D. Encyclopedia of Bioinformatics and Computational Biology; Ranganathan, S., Gribskov, M., Nakai, K., Schönbach, C., Eds.; Academic Press: Oxford, UK, 2019; pp. 542–545. [Google Scholar]
- Browne, M.W. Cross-validation methods. J. Math. Psychol. 2000, 44, 108–132. [Google Scholar] [CrossRef] [Green Version]
- Arlot, S.; Celisse, A. A Survey of Cross-Validation Procedures for Model Selection. Stat. Surv. 2010, 4, 40–79. [Google Scholar] [CrossRef]
- Zhao, H.; Shi, J.; Qi, X.; Wang, X.; Jia, J. Pyramid scene parsing network. In Proceedings of the IEEE Conference on Computer Vision and Pattern Recognition, Honolulu, HI, USA, 21–26 July 2017. [Google Scholar]
- He, K.; Zhang, X.; Ren, S.; Sun, J. Deep Residual Learning for Image Recognition. In Proceedings of the IEEE Conference on Computer Vision and Pattern Recognition, Las Vegas, NV, USA, 27–30 June 2016. [Google Scholar]
- Hu, J.; Shen, L.; Sun, G. Squeeze-and-excitation networks. In Proceedings of the IEEE Conference on Computer Vision and Pattern Recognition, Salt Lake City, UT, USA, 18–23 June 2018. [Google Scholar]
- Woo, S.; Park, J.; Lee, J.Y.; Kweon, I.S. Cbam: Convolutional block attention module. In Proceedings of the European Conference on Computer Vision (ECCV), Munich, Germany, 8–14 September 2018. [Google Scholar]
- Li, J.; Luo, Y.; Shi, L.; Zhang, X.; Li, M.; Zhang, B.; Wang, D. Automatic fetal brain extraction from 2D in utero fetal MRI slices using deep neural network. Neurocomputing 2020, 378, 335–349. [Google Scholar] [CrossRef]
- Zhou, R.; Hu, S.; Ma, B.; Ma, B. Automatic Segmentation of MRI of Brain Tumor Using Deep Convolutional Network. BioMed Res. Int. 2022, 2022, 4247631. [Google Scholar] [CrossRef]
- Sandler, M.; Howard, A.; Zhu, M.; Zhmoginov, A.; Chen, L.C. Mobilenet v2: Inverted residuals and linear bottlenecks. In Proceedings of the IEEE Conference on Computer Vision and Pattern Recognition, Salt Lake City, UT, USA, 18–23 June 2018. [Google Scholar]
- Ciosek, Ż.; Kot, K.; Kosik-Bogacka, D.; Łanocha-Arendarczyk, N.; Rotter, I. The effects of calcium, magnesium, phosphorus, fluoride, and lead on bone tissue. Biomolecules 2021, 11, 506. [Google Scholar] [CrossRef] [PubMed]
- Horng, M.H.; Kuok, C.P.; Fu, M.J.; Lin, C.J.; Sun, Y.N. Cobb angle measurement of spine from X-ray images using convolutional neural network. Comput. Math. Methods Med. 2019, 2019, 6357171. [Google Scholar] [CrossRef] [Green Version]
- Lechner, R.; Putzer, D.; Dammerer, D.; Liebensteiner, M.; Bach, C.; Thaler, M. Comparison of two-and three-dimensional measurement of the Cobb angle in scoliosis. Int. Orthop. 2017, 41, 957–962. [Google Scholar] [CrossRef] [Green Version]
Figure 1.
(a) Partial T2 dataset; (b) Partial T2 dataset corresponding labels; (c) Labeled organ location schematics.
Figure 1.
(a) Partial T2 dataset; (b) Partial T2 dataset corresponding labels; (c) Labeled organ location schematics.

Figure 2.
(a) Data original image; (b) Cutout processed image.

Figure 3.
UNet Network Architecture.

Figure 4.
The network structure of the model CI-UNet.

Figure 5.
VGG16 backbone Transfer Learning schematic.

Figure 6.
The structure of the VGG16 backbone feature extraction network.

Figure 7.
(a) The structure diagrams of the information aggregation module; (b) The last layer of the information aggregation module.
Figure 7.
(a) The structure diagrams of the information aggregation module; (b) The last layer of the information aggregation module.

Figure 8.
The structure of the Polarized Self-Attention mechanism.

Figure 9.
(a) Cross-Validation mIoU index results; (b) Cross-Validation mPA index results.

Figure 10.
Circumstance of mPA metrics for each organ.

Figure 11.
The prediction plots of organ segmentation for each algorithm.

Figure 12.
(a) The confusion matrix of the algorithm in this paper on the validation set; (b) The mIoU segmentation index for each organ; (c) The mPA segmentation index for each organ segmentation.
Figure 12.
(a) The confusion matrix of the algorithm in this paper on the validation set; (b) The mIoU segmentation index for each organ; (c) The mPA segmentation index for each organ segmentation.

Figure 13.
Segmentation prediction results of CI-UNet for typical images.

Figure 14.
The results of Grad-CAM used for the images.

Figure 15.
The geographical location of Guiyang City, Guizhou Province.

Figure 16.
The segmentation prediction results generated by CI-UNet.

Figure 17.
The predicted image Cobb calculation results.


Table 1.
The results of different rotation angles in VGG16 network.
| Algorithm | Backbone | Rotation Angle | mIoU (%) | mPA (%) | PA (%) |
|---|---|---|---|---|---|
| UNet | VGG16 | 5° | 79.24 | 86.32 | 98.66 |
| 10° | 79.17 | 86.38 | 98.64 | ||
| 20° | 76.49 | 85.98 | 98.41 | ||
| 30° | 71.15 | 79.89 | 98.02 |
Table 2.
The results of ablation experiments with different degrees of Cutout.
| Algorithm | Backbone | Cutout Ratio (%) | mIoU (%) | mPA (%) | PA (%) |
|---|---|---|---|---|---|
| UNet | VGG16 | 20° | 79.18 | 86.98 | 98.68 |
| 30° | 79.37 | 86.48 | 98.64 | ||
| 40° | 79.16 | 86.54 | 98.62 |
Table 3.
The ablation results of different backbone UNet networks.
| Algorithm | Backbone | Attention | mIoU (%) | mPA (%) | PA (%) |
|---|---|---|---|---|---|
| UNet | Double Conv | None | 73.25 | 83.32 | 98.21 |
| VGG16 | None | 79.37 | 86.88 | 98.64 | |
| ResNet50 | None | 78.71 | 88.08 | 98.60 |
Table 4.
The results of the ablation of different trunk Attention UNet structures.
| Algorithm | Backbone | Attention | mIoU (%) | mPA (%) | PA (%) |
|---|---|---|---|---|---|
| Attention UNet | VGG16 | SE | 79.75 | 87.02 | 98.67 |
| ResNet50 | SE | 78.94 | 87.40 | 98.45 | |
| VGG16 | Cbam | 81.13 | 88.60 | 98.68 | |
| ResNet50 | Cbam | 79.47 | 88.63 | 98.67 | |
| VGG16 | PSA | 81.22 | 88.75 | 98.60 | |
| ResNet50 | PSA | 80.03 | 90.42 | 98.72 |
Table 5.
The experimental results of the ablation of Attention UNet and CI-UNet.
| Algorithm | Backbone | Attention | mIoU (%) | mPA (%) | PA (%) |
|---|---|---|---|---|---|
| Attention UNet | VGG16 | SE | 79.75 | 87.02 | 98.67 |
| ResNet50 | SE | 78.94 | 87.40 | 98.45 | |
| VGG16 | Cbam | 81.13 | 88.60 | 98.68 | |
| ResNet50 | Cbam | 79.47 | 88.63 | 98.67 | |
| VGG16 | PSA | 81.22 | 88.75 | 98.60 | |
| ResNet50 | PSA | 80.03 | 90.42 | 98.72 | |
| CI-UNet | VGG16 | PSA | 82.33 | 90.10 | 98.85 |
Table 6.
The ablation results of each algorithm.
| Algorithm | Backbone | Attention | mIoU (%) | mPA (%) | PA (%) |
|---|---|---|---|---|---|
| PSPNet | MobileNetV2 | None | 76.41 | 87.02 | 98.49 |
| ResNet50 | None | 81.04 | 89.66 | 98.71 | |
| Deeplabv3+ | MobileNetV2 | None | 75.92 | 86.04 | 98.42 |
| M-FCN | None | None | 77.21 | 86.40 | 98.51 |
| U-Net_based | None | None | 77.86 | 85.14 | 98.55 |
| CI-UNet | VGG16 | PSA | 82.33 | 90.10 | 98.85 |
Table 7.
CI-UNet results with balanced dataset.
| Algorithm | Backbone | Attention | mIoU (%) | mPA (%) | PA (%) |
|---|---|---|---|---|---|
| CI-UNet | VGG16 | PSA | 83.07 | 90.74 | 98.82 |
Table 8.
The results of the spine segmentation experiments.
| Algorithm | Backbone | Attention | mIoU (%) | mPA (%) | PA (%) |
|---|---|---|---|---|---|
| UNet | Double Conv | None | 75.62 | 88.72 | 91.16 |
| VGG16 | None | 85.31 | 91.31 | 95.89 | |
| ResNet50 | None | 82.26 | 90.5 | 94.78 | |
| Attention UNet | VGG16 | SE | 85.44 | 92.18 | 95.95 |
| ResNet50 | SE | 82.21 | 91.03 | 94.46 | |
| VGG16 | Cbam | 86.59 | 92.95 | 96.30 | |
| ResNet50 | Cbam | 83.33 | 91.03 | 95.15 | |
| VGG16 | PSA | 86.45 | 92.46 | 96.21 | |
| ResNet50 | PSA | 84.18 | 91.42 | 96.10 | |
| PSPNet | MobileNetV2 | None | 74.71 | 88.23 | 91.47 |
| ResNet50 | None | 78.07 | 89.25 | 93.05 | |
| Deeplabv3+ | MobileNetV2 | None | 83.63 | 91.75 | 95.09 |
| M-FCN | None | None | 81.21 | 90.74 | 94.89 |
| U-Net_based | None | None | 81.77 | 91.14 | 95.07 |
| CI-UNet | VGG16 | PSA | 87.97 | 93.48 | 96.46 |
Disclaimer/Publisher’s Note: The statements, opinions and data contained in all publications are solely those of the individual author(s) and contributor(s) and not of MDPI and/or the editor(s). MDPI and/or the editor(s) disclaim responsibility for any injury to people or property resulting from any ideas, methods, instructions or products referred to in the content. |
© 2023 by the authors. Licensee MDPI, Basel, Switzerland. This article is an open access article distributed under the terms and conditions of the Creative Commons Attribution (CC BY) license (https://creativecommons.org/licenses/by/4.0/).
Share and Cite
MDPI and ACS Style
Qin, J.; Wang, X.; Mi, D.; Wu, Q.; He, Z.; Tang, Y. CI-UNet: Application of Segmentation of Medical Images of the Human Torso. Appl. Sci. 2023, 13, 7293. https://0-doi-org.brum.beds.ac.uk/10.3390/app13127293
AMA Style
Qin J, Wang X, Mi D, Wu Q, He Z, Tang Y. CI-UNet: Application of Segmentation of Medical Images of the Human Torso. Applied Sciences. 2023; 13(12):7293. https://0-doi-org.brum.beds.ac.uk/10.3390/app13127293
Chicago/Turabian StyleQin, Junkang, Xiao Wang, Dechang Mi, Qinmu Wu, Zhiqin He, and Yu Tang. 2023. "CI-UNet: Application of Segmentation of Medical Images of the Human Torso" Applied Sciences 13, no. 12: 7293. https://0-doi-org.brum.beds.ac.uk/10.3390/app13127293
Note that from the first issue of 2016, this journal uses article numbers instead of page numbers. See further details here.