
Numerical Investigation of the Cavitation Characteristics in Venturi Tubes: The Role of Converging and Diverging Sections
Faculty of Mechanical Engineering & Automation, Zhejiang Sci-Tech University, Hangzhou 310018, China
*
Author to whom correspondence should be addressed.
Appl. Sci. 2023, 13(13), 7476; https://0-doi-org.brum.beds.ac.uk/10.3390/app13137476
Submission received: 8 May 2023
/
Revised: 18 June 2023
/
Accepted: 19 June 2023
/
Published: 25 June 2023
(This article belongs to the Topic Fluid Mechanics)
Abstract
:Cavitation is a typical physical process that has shown to be highly valuable in the wastewater treatment field. This study aims to investigate the effects of the converging and diverging sections of a Venturi tube on the cavitation flow field. Multiphase flows in tubes are presented using the mixture model and the standard k-ε model. And the Schnerr and Sauer cavitation model is employed to simulate the vapor–liquid phase transition process. Both grid independence and the numerical method’s feasibility were validated before the research. The results showed that the influence of the divergence section length on Venturi cavitation characteristics depends on the provided pressure conditions. As the pressure increases, shorter divergence sections result in more significant cavitation effects. The length of the convergence section displays various cavitation behaviors under different pressure situations. A small contraction section length can achieve better cavitation effects in high-pressure applications, whereas the opposite is true in low-pressure cases. Within the scope of this study, it was observed that the Venturi tube with a divergent section of 14 Lt and a convergent one of 2.4 Lt provided enhanced cavitation performance when subjected to inlet pressures ranging from 0.8 to 1.2 MPa. Our findings indicate that the selection of converging and diverging section lengths in Venturi tubes should consider the corresponding operational pressure conditions, which provides valuable guidance and engineering significance in the research and development of Venturi cavitation devices in hydraulic engineering.
1. Introduction
Cavitation is a typical vapor–liquid phase change mechanism that is commonly found in throttling structures. When the liquid’s local static pressure is lower than the saturated vapor pressure at a reference temperature, the tiny gas nuclei in the liquid or the gap at the solid–liquid interface gradually grow under the action of internal and external pressure differences, and finally collapse and release a large amount of energy after pressure recovery [1,2,3,4]. Currently, cavitation plays an important role in addressing the issue of wastewater [5,6]. The localized high temperature and high-pressure environment created by cavitation bubble collapse can cause the water molecules near the bubble surface to pyrolyze into hydroxyl and hydrogen free radicals, which then have the effect of oxidizing organic pollutants in the water body through the diffusion of hydroxyl free radicals in the liquid medium [7]. Various studies have assessed the efficacy of cavitation in wastewater treatment: Innocenzi et al. [8] carried out laboratory-scale research on the effectiveness and possibility of treating methyl orange solution with cavitation of the Venturi tube; their results demonstrated that the cavitation induction into the oxidation process can improve dye degradation under regulated operating settings. Bagal et al. [9] investigated the degradation effect of the residual pharmaceutical diclofenac sodium in wastewater using a novel approach combining hydraulic cavitation and heterogeneous photocatalysis and discovered that, under ideal conditions, the combined treatment had an advantage over the single treatment scheme. Mezule et al. [10] developed a rotational cavitation device that generates cavitation in a thin water layer in order to investigate the effect of hydrodynamic cavitation on the disinfection of E. coli. Experiments have demonstrated that hydrodynamic cavitations are particularly efficient in reducing bacterial division capacity. Badve et al. [11] used a cavitation device that included a stator and a rotor assembly to clean effluent from the wood finishing sector within a specific rotating speed range, and they discovered that the chemical oxygen demand (COD) in real wastewater may be significantly lowered. Therefore, it is evident that hydraulic cavitation has shown considerable promise in the realm of wastewater treatments.
However, the design of hydrodynamic cavitation reactors has a substantial impact on their cavitation performance. At present, there exist four main types of cavitation reactors that are typically utilized in a laboratory setting: the orifice plate, the Venturi tube, vortex, and rotary types [12,13]. While the latter two types exhibit low pressure loss, their intricate structure and high maintenance costs serve as limiting factors for their widespread adoption. In contrast, both the orifice plate and Venturi tube cavitation reactors operate on similar principles of cavitation and offer the advantages of simple design, ease of use, and strong controllability. Nevertheless, the orifice plate cavitation reactors are more prone to blockages at sudden changes in the flow channel section and experience greater pressure losses than the Venturi tube counterparts. Therefore, the Venturi tube cavitation reactors are more widely applied in the field of hydraulic cavitation.
Until recently, researchers’ interest in Venturi cavitation characteristics has not waned. Most of them focus on the cavitation inception, evolution process, cavitation instability, and the structural parameters of Venturi tubes. Simpson et al. [14] analyzed the effect of key geometric parameters, such as the throat length and diffuser angle of Venturi tubes on cavitation inception. Further, Li et al. [15] investigated the impact of various geometric parameters on cavitation inception using a numerical simulation and experimental methods and discovered that flow resistance determines cavitation inception. Sato et al. [16] used a high-speed video camera to visualize the behavior of a moving bubble cavitation in a Venturi from the inception to collapse process. Brunhart et al. [17] verified two mechanisms of vapor shedding (re-entrant jet and condensation shock) and offered more information on vapor shedding using the computational fluid dynamics (CFDs) method. Fang et al. [18] investigated the primary features and physical signals of two vapor-shedding mechanisms in Venturi tubes using a self-developed compressible cavitation phase change solver. Long et al. [19] evaluated the global cavitation behavior in a Venturi tube and found that the inlet pressures had no effect on the cavity length, which was only a function of the pressure ratio or the cavitation number. Kuldeep et al. [20] optimized the structural characteristics of various types of Venturi tubes (such as slit, circular, and elliptical), and they came to the conclusion that the optimal geometry for cavitational activity has a throat height/diameter to length ratio of 1:1 and a divergence angle of 6.5°. Shi et al. [21] carried out two-dimensional (2D) CFD simulations using a two-phase mixture model to investigate the impact of the convergent angle on the cavitation performance in the Venturi tube; the numerical findings revealed that a larger convergent angle enhances the cavitation yield but requires more power. In addition, they developed a semi-empirical model for predicting cavitation in the Venturi tubes. In a study by Zhao et al. [22], experiments were conducted to identify the role of the Venturi divergent angle in bubble breakup and showed that the divergent angle had a significant influence on the deceleration process. The larger the divergent angle, the shorter the distance and time, which is required for bubble deceleration.
While much research has been conducted on the inception, evolution, and structural parameters of Venturi-induced cavitation, there remains a lack of discussion on the influence of converging and diverging section lengths of a Venturi on cavitation characteristics under varying operating pressure. Furthermore, in this study, the convergence and divergence angles of the Venturi tube, which are significant factors influencing cavitations, were not altered. This provided a favorable starting point for conducting such research. Additionally, the Venturi cavitation reactors are often subject to different pressure conditions in various application scenarios, such as wastewater treatment, organic compound synthesis, and biodiesel production [23,24,25]. Therefore, we focus our attention on an investigation of the effect of diverging and converging section lengths on cavitation characteristics at different pressure conditions. In this study, several Venturi devices with varying converging and diverging section lengths were simulated with a two-phase mixture model and the standard k-ε turbulence model, and the simulated results were validated using an actual pressure drop and flow rate data. Additionally, changes in the cavitation flow field within the Venturi under different pressure conditions were also investigated. Other flow field characteristics in the Venturi, such as the maximum throat velocity, mass flow rate, and vapor volume, were also measured and analyzed. The findings and conclusions from this study can provide insights for the design and application of Venturi cavitation devices.
2. Materials and Methods
2.1. Governing Equation and Turbulence Model
The governing equation can be utilized to elucidate the liquid flow behavior in a Venturi tube. In the presence of cavitation, the flow in a Venturi tube is a combination of vapor and liquid phases. To describe the two-phase flow of vapor and liquid in a Venturi tube, the mixture model is applied [7,15,21,26]. Based on this, a hypothesis is proposed, which assumes that the vapor and liquid phases are homogeneously mixed and able to permeate each other, regardless of their relative velocities. Moreover, it is assumed that the fluid is continuous during the flow process and the impact of volume force on fluid movement is negligible. The continuity and momentum equations of the mixture phase are provided as follows:
where ρm, νm, and μm denote the mixed phase’s density, mass-averaged velocity, and viscosity, respectively. p is pressure; ∇ is the nabla symbol.
The phenomenon of cavitation is often accompanied by significant turbulence and the formation of cavities within the fluid flow, which grow, merge, collapse, and ultimately affect the performance and durability of engineering devices. The complex nature of cavitation events, which exhibit different time-scales and are influenced by various flow parameters, poses significant challenges for accurate and efficient numerical simulation. Although Direct Numerical Simulation (DNS) can be used to simulate the details of cavitation flows, it is computationally expensive and impractical for most actual engineering applications. Consequently, the Reynolds-averaged Navier–Stokes (RANS) equations are widely accepted to model the time-averaged variables of such a turbulent flow in the Venturi device. According to the calculations performed using the Reynolds number formula,
where ρw denotes water density, ν represents the average flow velocity at the inlet of the Venturi tube, d is the diameter at the inlet of the Venturi tube, and μw represents the viscosity of water.
The Reynolds numbers for all investigated operating conditions in this study fall within the range of 34,174 to 141,767. These values significantly exceed the widely accepted critical Reynolds number threshold of 5000 for lamina flow in pipes. Hence, it can be inferred that the flow inside the Venturi tube exhibits turbulent characteristics. To account for the turbulence, the standard k-ε model is employed, which has been extensively validated by previous researchers [20,27,28]. The transport equations for the turbulence kinetic energy (k) and its dissipation rate (ε) are expressed as follows:
where ρ denotes fluid density; k is turbulent kinetic energy; ε is turbulent kinetic energy dissipation rate. x and the subscripts i and j represent the coordinate direction; ui is the component of the velocity vector in the i direction; Gk represents the generation of turbulence kinetic energy due to the mean velocity gradients; Gb is the generation of turbulence kinetic energy due to buoyancy; YM represents the contribution of the fluctuating dilatation in compressible turbulence to the overall dissipation rate; SK and Sε are user-defined source terms; σk and σε are the turbulent Prandtl numbers of turbulent kinetic energy k and dissipation rate ε, which are 1.0 and 1.3, respectively. C1ε, C2ε, and C3ε are model constants, which are 1.44, 1.92, and 0.09, respectively. μt is turbulent viscosity.
2.2. Cavitation Model
The Rayleigh–Plesset equation and its variations are commonly employed to simulate mass transfer in the cavitation phenomena. Within the Ansys Fluent software package, three prevailing cavitation models are available, namely, the Singhal, Schnerr and Sauer, and Zwart–Gerber–Belamri models. Among these models, the Singhal model is the most comprehensive, considering the effects of phase transition, bubble motion, turbulent pressure fluctuations, and non-condensable gases on vapor phase formation and condensation. However, its numerical stability is inferior to that of the Schnerr and Sauer model and the Zwart–Gerber–Belamri model. In addition, prior studies [21,28,29] have utilized the Schnerr and Sauer model to analyze Venturi cavitation, making it a suitable choice for simulating vapor–liquid mass transfer in Venturi tubes. The rate of evaporation (Re) and the rate of condensation (Rc) of vapor in the Schnerr and Sauer models can be expressed as follows:
When
When
where ρv is the density of vapor; ρl is the density of liquid phase; P is the pressure in the liquid surrounding the bubble; PV is the saturated vapor pressure of water; Fvap and Fcond are empirical calibration coefficients for evaporation and condensation, which are 1.0 and 0.2, respectively. αv is the vapor volume fraction; ℜB is the bubble radius; αv is a function of ℜB
where nb is the bubble number density, and the default value of nb = 1 × 10¹³ m−3 is taken in Fluent.
2.3. Geometric Model
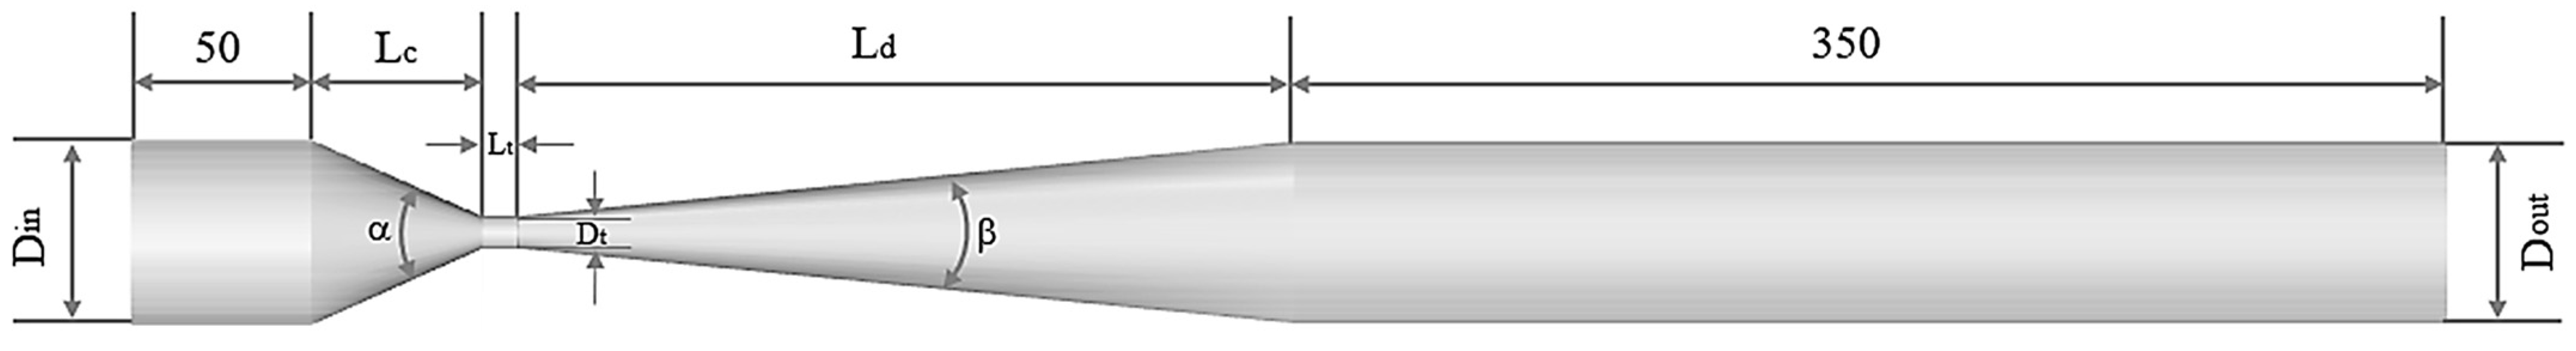
Figure 1 shows the geometric structure of a Venturi tube. Based on the Venturi pipe designed by Long et al. [19], the straight pipe of the inlet and outlet sections is adequately extended. The entrance straight pipe is 5Dt, and the outlet straight pipe is 35Dt. Meanwhile, in order to investigate the impact of the lengths of converging and diverging sections on Venturi cavitation characteristics, a series of 15 Venturi models were constructed under varying operational conditions, as outlined in Table 1. The models maintained a consistent throat diameter (Lt = Dt = 10 mm), convergence angle (α = 45°), and divergence angle (β = 12°). In addition, the dimensionless parameter cavitation number is also included in Table 1, which reflects the cavitation flow state inside the Venturi tube, which is obtained from the following equation:
where Pout is the outlet pressure, and Uth is the average velocity at the throat of the Venturi tube.
2.4. Solution Strategy and Grid Independence
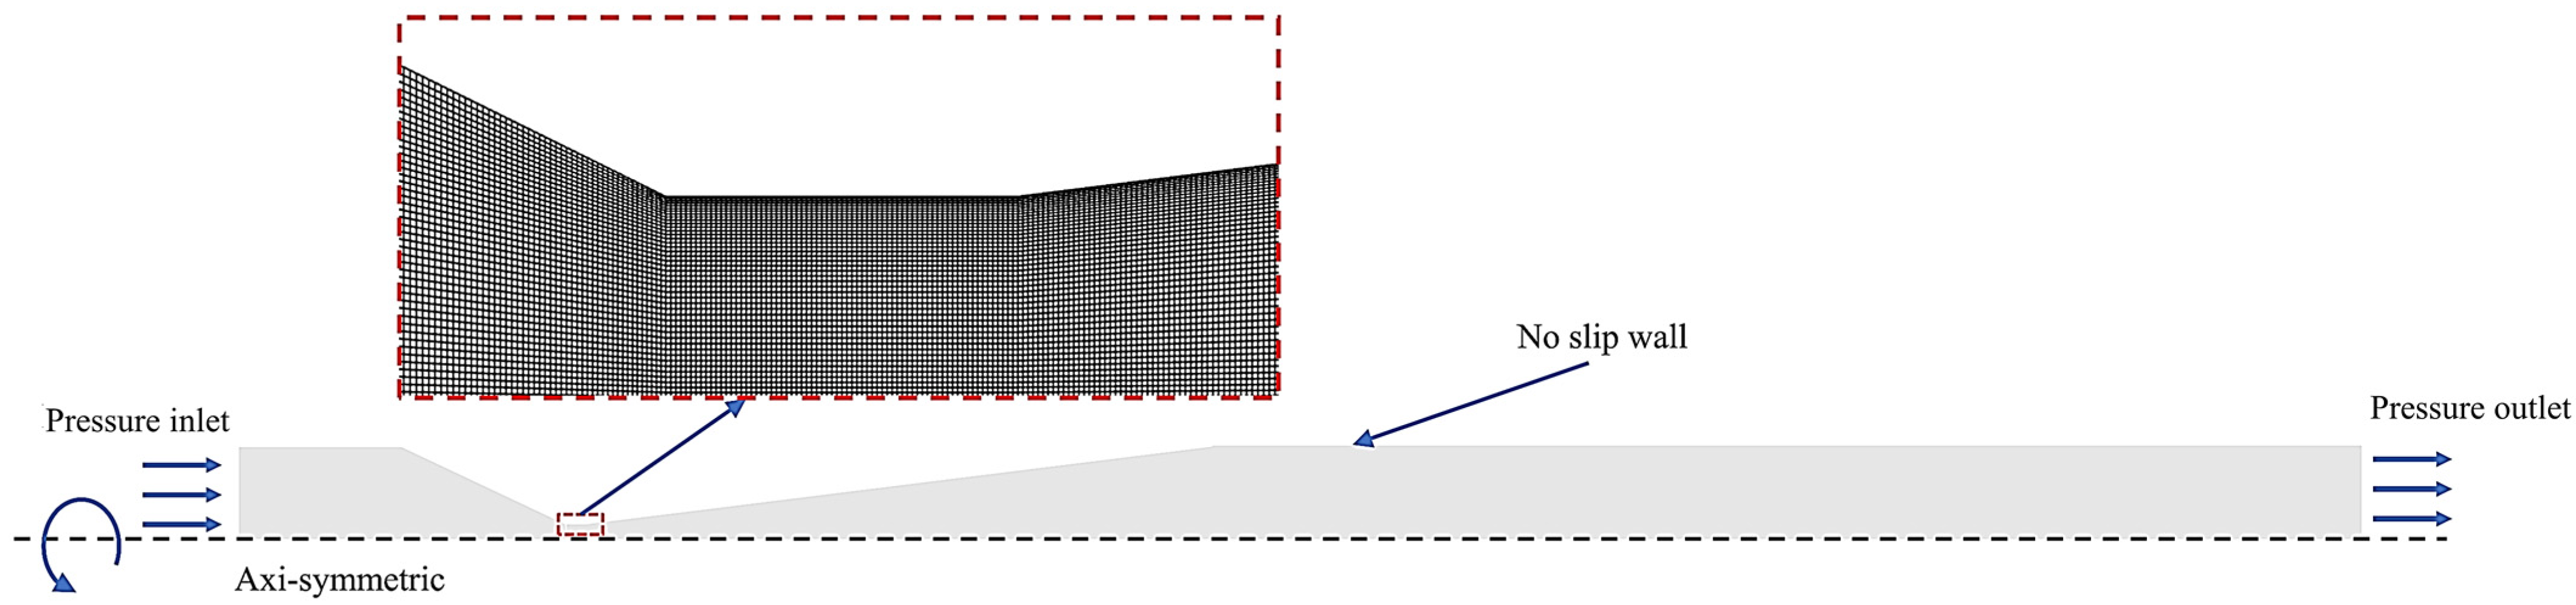
In the present study, 2D axi-symmetric models of Venturi tubes were simulated using a pressure-based solver. The working fluids considered were water and vapor, and the surrounding environment was maintained at 25 °C. The specific boundary conditions used for calculations in this study are listed in Table 2. For pressure solution, the PRESTO scheme was selected, and the first-order upwind discretization scheme was employed to discretize turbulent kinetic energy and turbulent dissipation rates. The momentum and vapor were discretized using the second-order upwind discretization scheme and QUICK scheme, respectively. Pressure–velocity coupling was carried out using the SIMPLE algorithm. To ensure convergence, the consistency of mass flow rates at the inlet and outlet was checked, and a convergence criterion of residual of the continuity equation below 10−5 was set. All CFD simulations were performed under steady-state conditions.
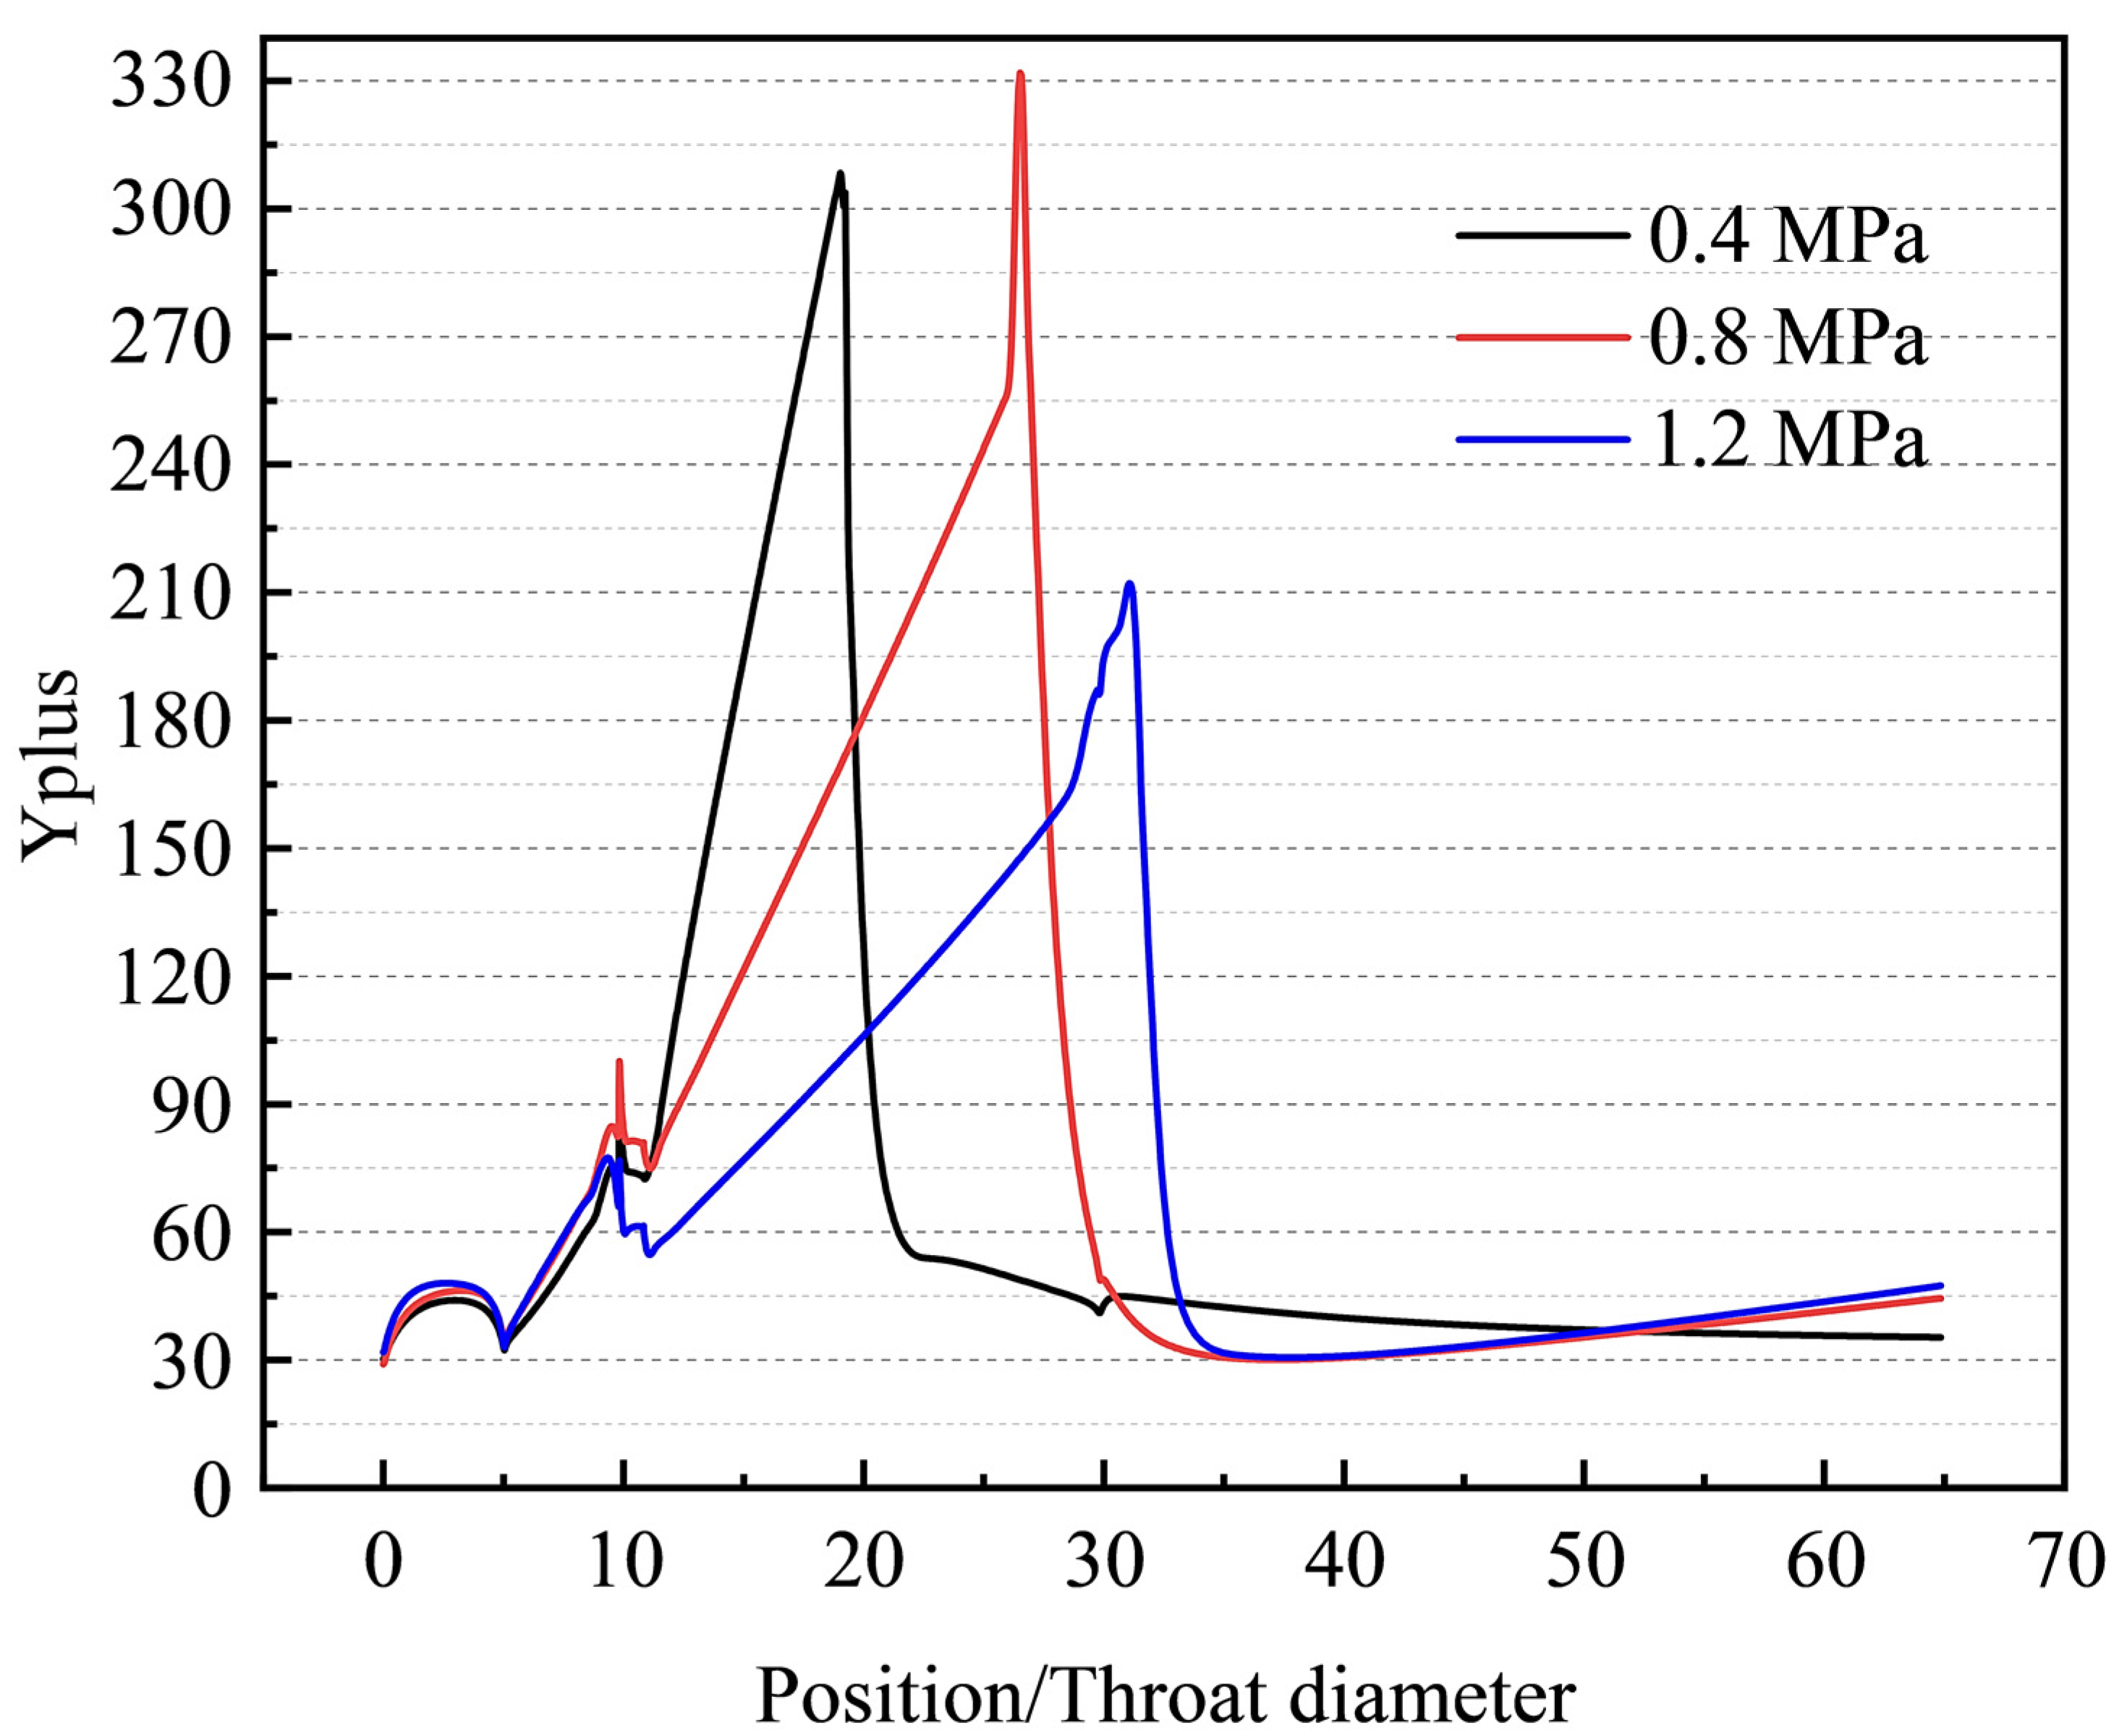
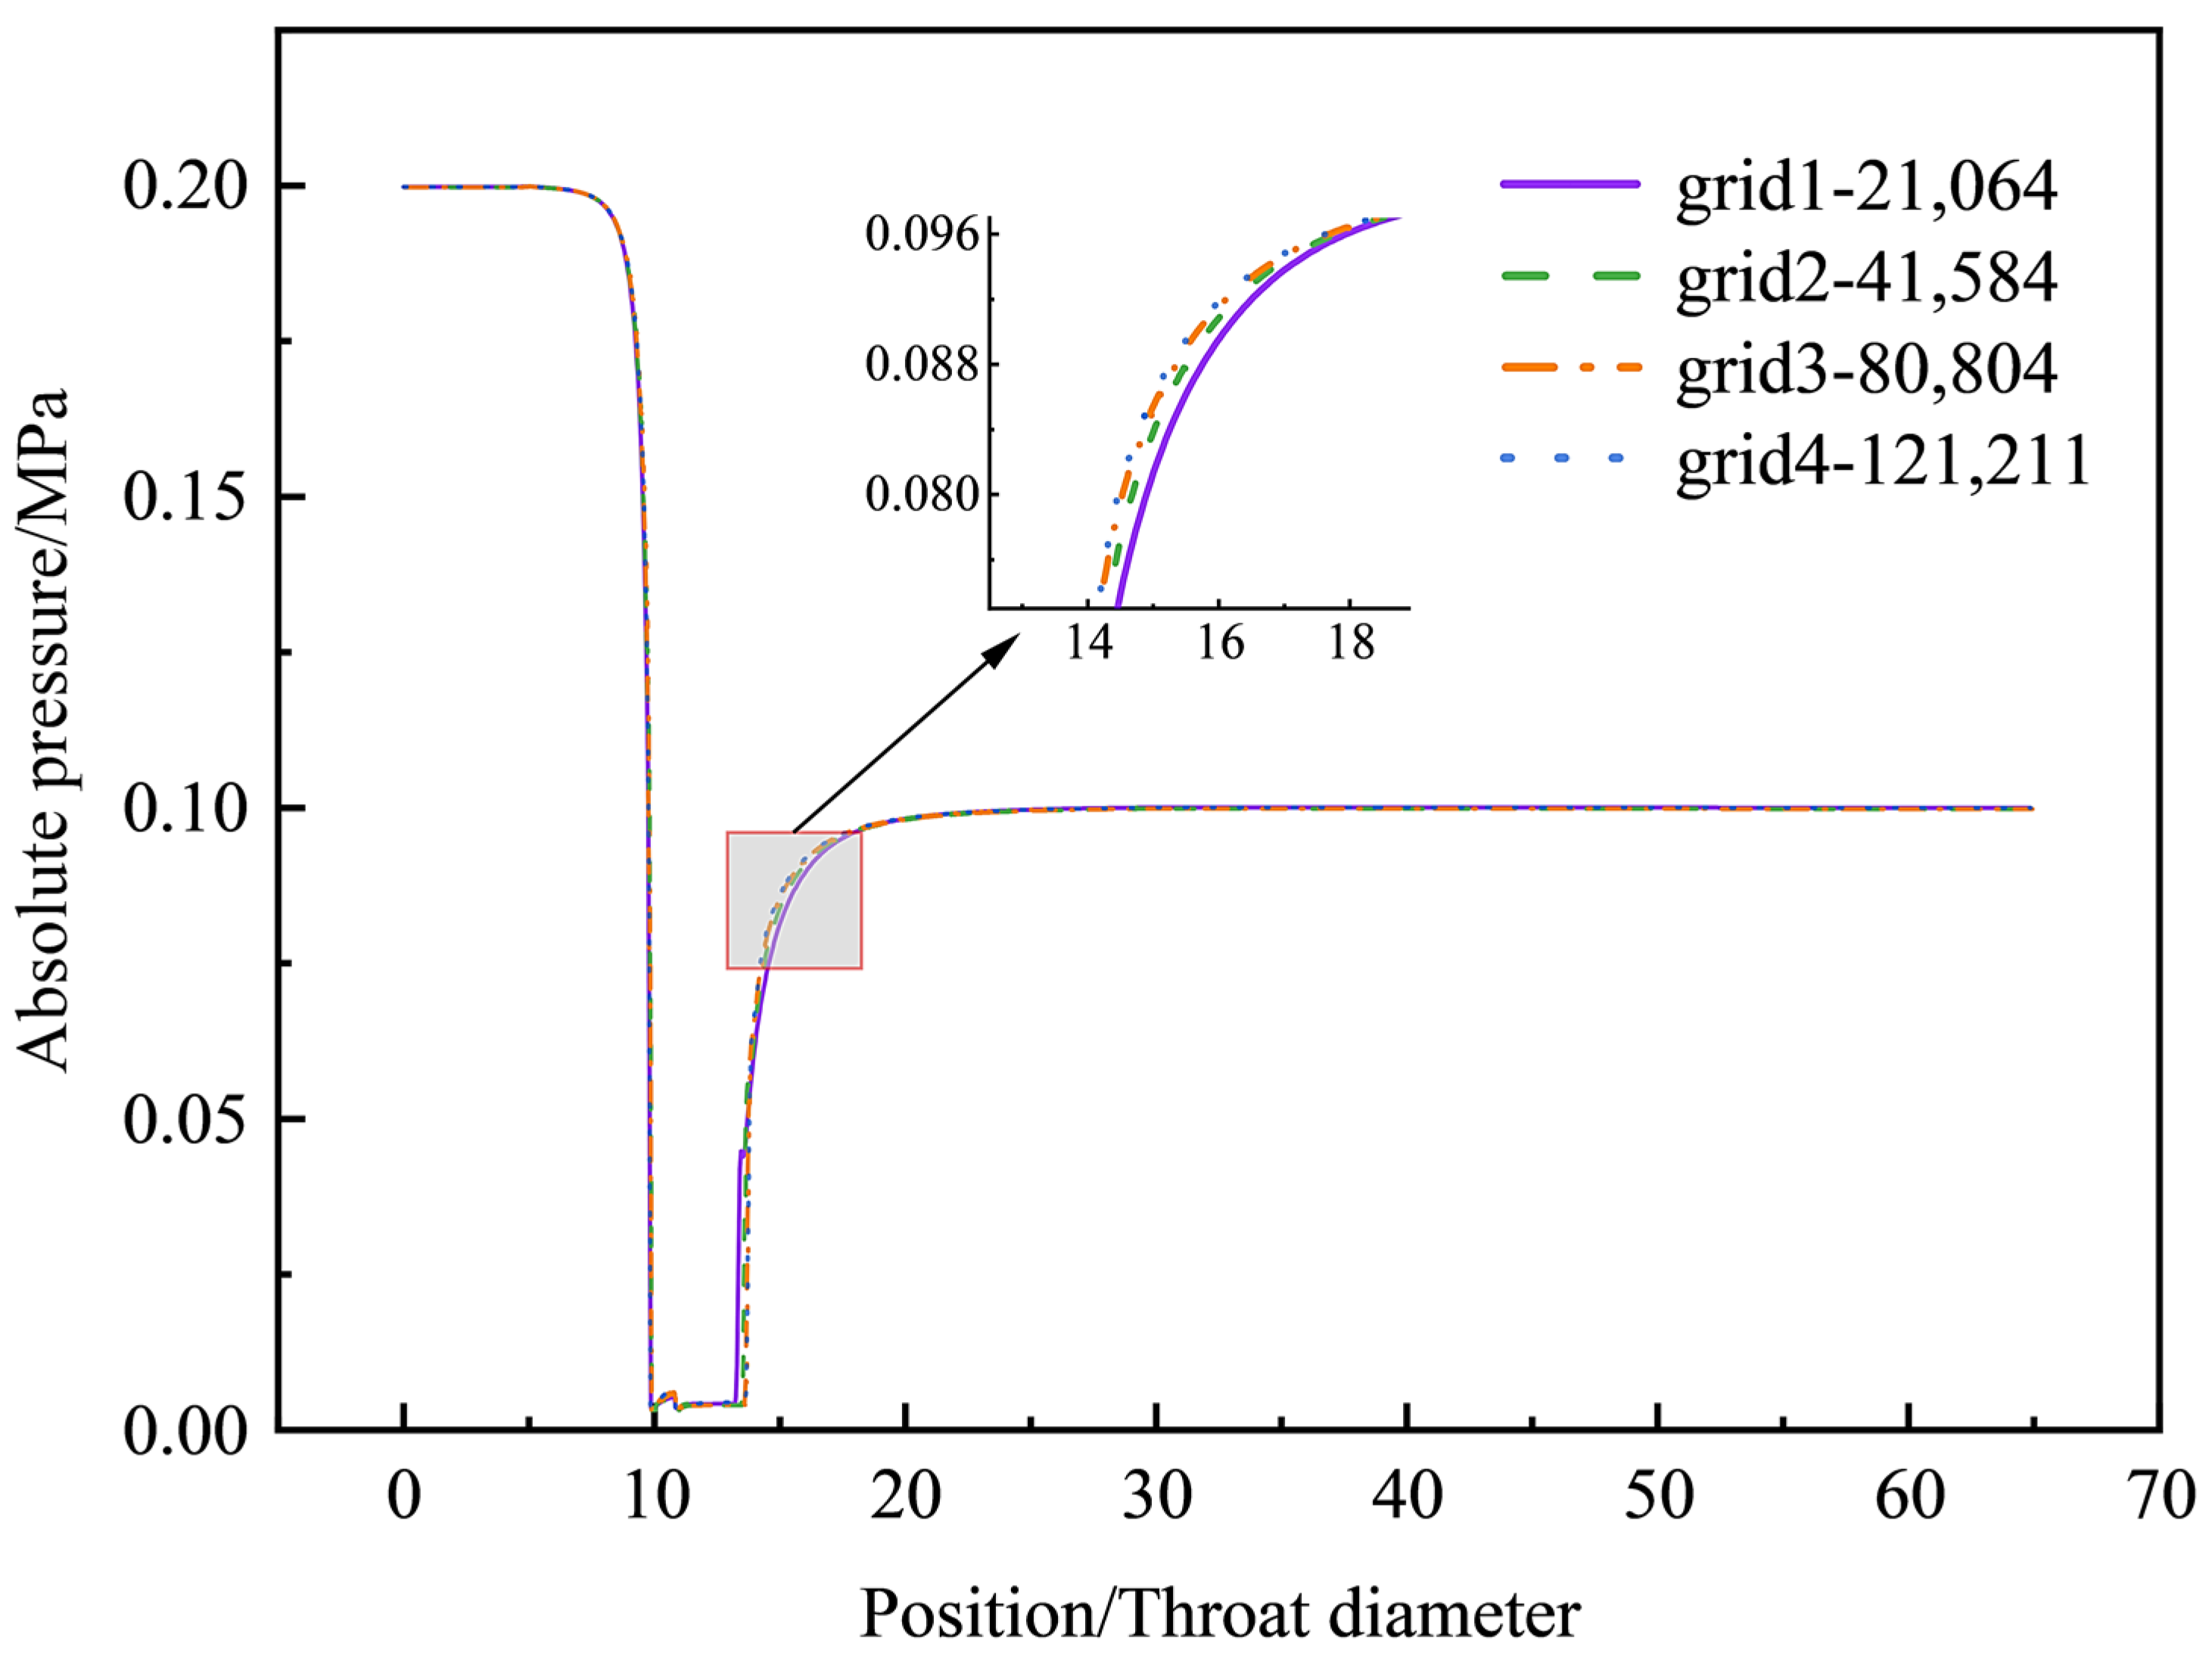
Accurate simulations in computational fluid dynamics (CFDs) require careful consideration of the mesh size used. Therefore, conducting a sensitivity analysis is crucial to evaluate the impact of varying grid sizes on the accuracy and consistency of simulation results. As shown in Figure 2, ANSYS ICEM was employed to generate a structural mesh and apply local refinement to create half of two-dimensional Venturi geometric model, given its axial symmetry characteristics. Additionally, initial grid layers were positioned within the turbulent core region to ensure that most wall-adjacent grids had Y+ values exceeding 30. The heights of the first layer of grids were set to 0.1 mm, 0.08 mm, and 0.05 mm for model circumstances of 0.4 MPa, 0.8 MPa, and 1.2 MPa, respectively. The Y+ distribution of the Venturi tube is depicted in Figure 3 across three distinct pressure conditions. It is evident that the Y+ values for all pressure conditions predominantly reside within a reasonable range of 30 to 300 (suitable for standard wall functions). For the Venturi geometric model with a divergence segment length of 190 mm, four different grid sizes were generated with respective cell counts of 21,064, 41,584, 80,804, and 121,211. Figure 4 displays the absolute pressure profile along the Venturi wall for four distinct mesh sizes. It is evident that no significant deviation in the pressure distribution occurs upon further grid refinement beyond a certain point when using 80,804 grid cells. Therefore, it can be asserted that a grid containing 80,804 cells is sufficient to conduct the present simulation. The identical mesh generation approach was also utilized for both the model parameters of 140 mm and 240 mm divergence section lengths, resulting in mesh element counts of 74,632 and 87,484, respectively.
3. Results and Discussion
3.1. Verification of the Simulation Method
In order to verify the reliability of the proposed numerical method, the Venturi tube geometry model utilized in the Long et al. [19,30] experiment was employed as the CFD calculation model. The inlet pressure was fixed at 0.4 MPa, whereas the outlet pressure ranged between 0.091 MPa and 0.378 MPa, with the temperature set at 19 °C, resulting in a saturation vapor pressure of 2200 Pa. In addition, the pressure ratio is defined as the ratio of outlet pressure to inlet pressure, which can be written as follows:
where Pin is the inlet pressure.
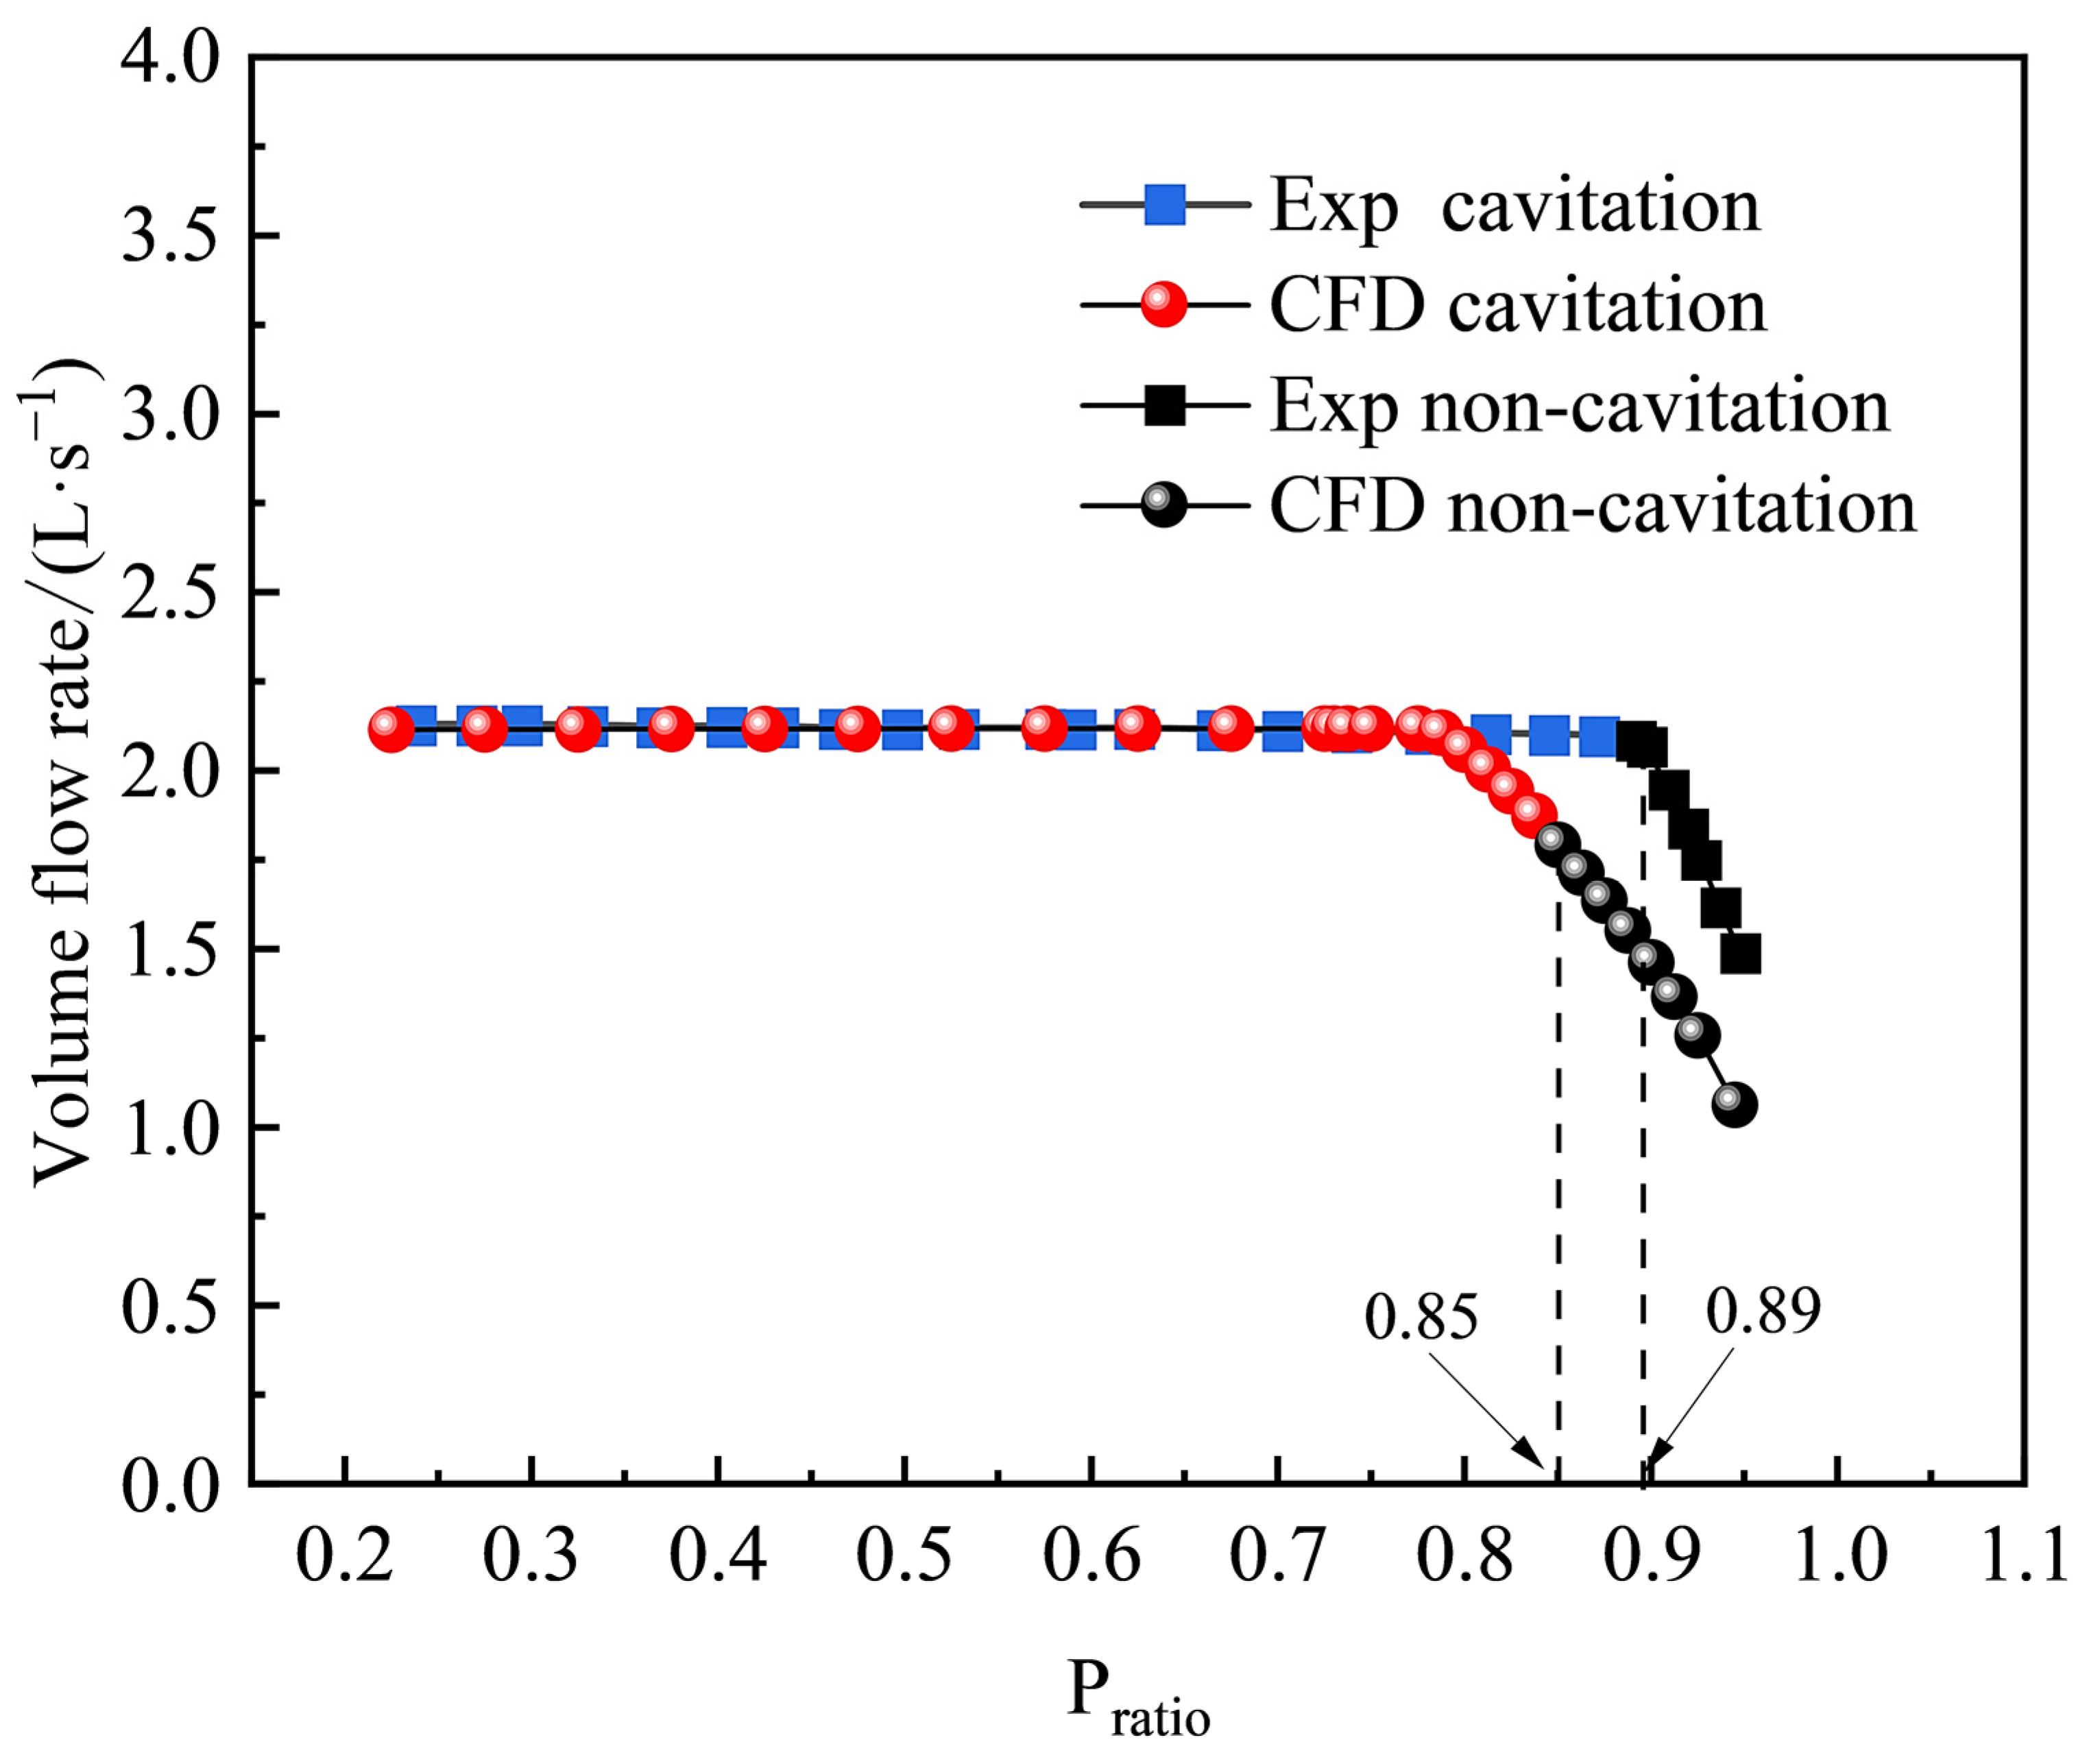
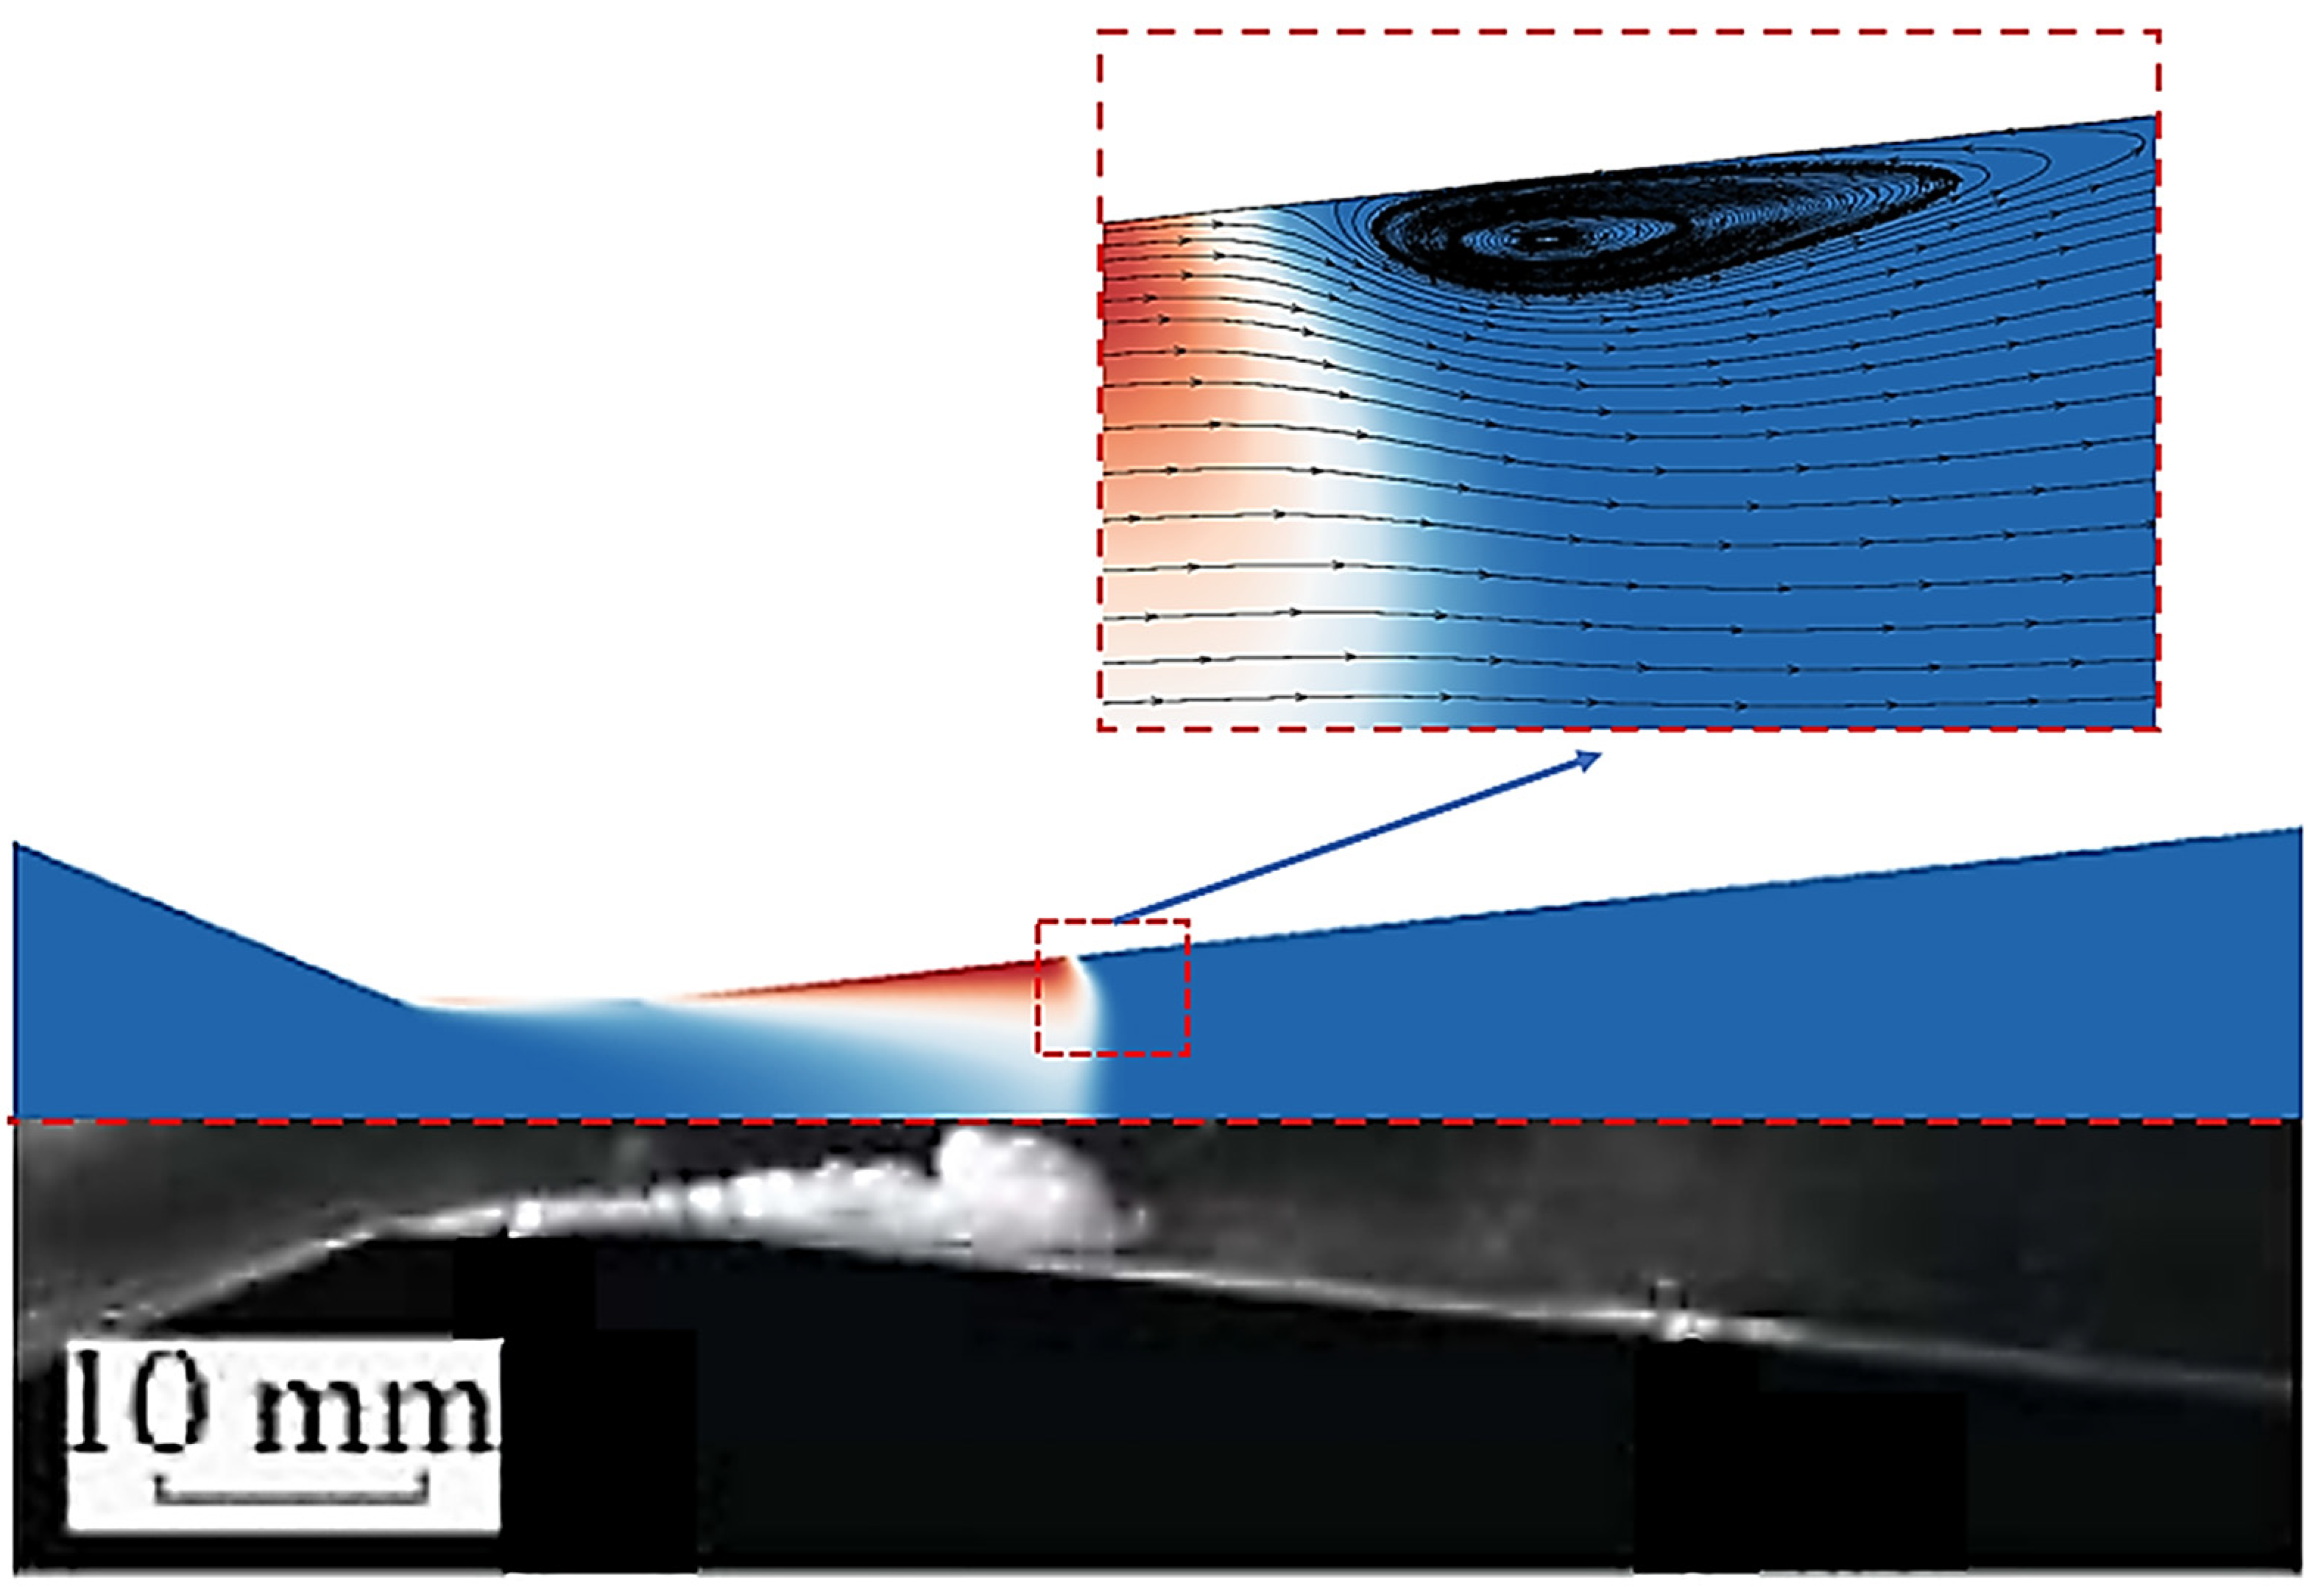
The simulated flow rate results were subsequently compared with the experimental data. Figure 5 displays a comparison between the measured flow rate and the predicted values obtained from numerical simulations using the Venturi tube model employed in the experiment. As depicted in the figure, while there exists a discrepancy of 4.49% between the critical pressure ratio prediction from numerical simulation and its corresponding experimental value at the inception of cavitation, the numerical simulation results agree well with the experimental values for pressure ratios below 0.8. Figure 6 shows a comparison of the distribution of the vapor phase obtained from the experiment [30] and numerical simulations at an outlet pressure value of 0.188 MPa. It is noteworthy that there is a high degree of consistency in the extent of cavity development between the two approaches. And from the detailed local flow streamlines, it can be observed that there is a recirculation region at the downstream end of the cavitation region. The emergence of this structure effectively inhibits further extension of the cavity. This observation indicates a good agreement between the numerical simulation results and the experimental measurements under cavitation conditions.
3.2. Effects of Divergent Length on Cavitation Characteristics
3.2.1. Analysis of Pressure and Vapor Volume Fraction
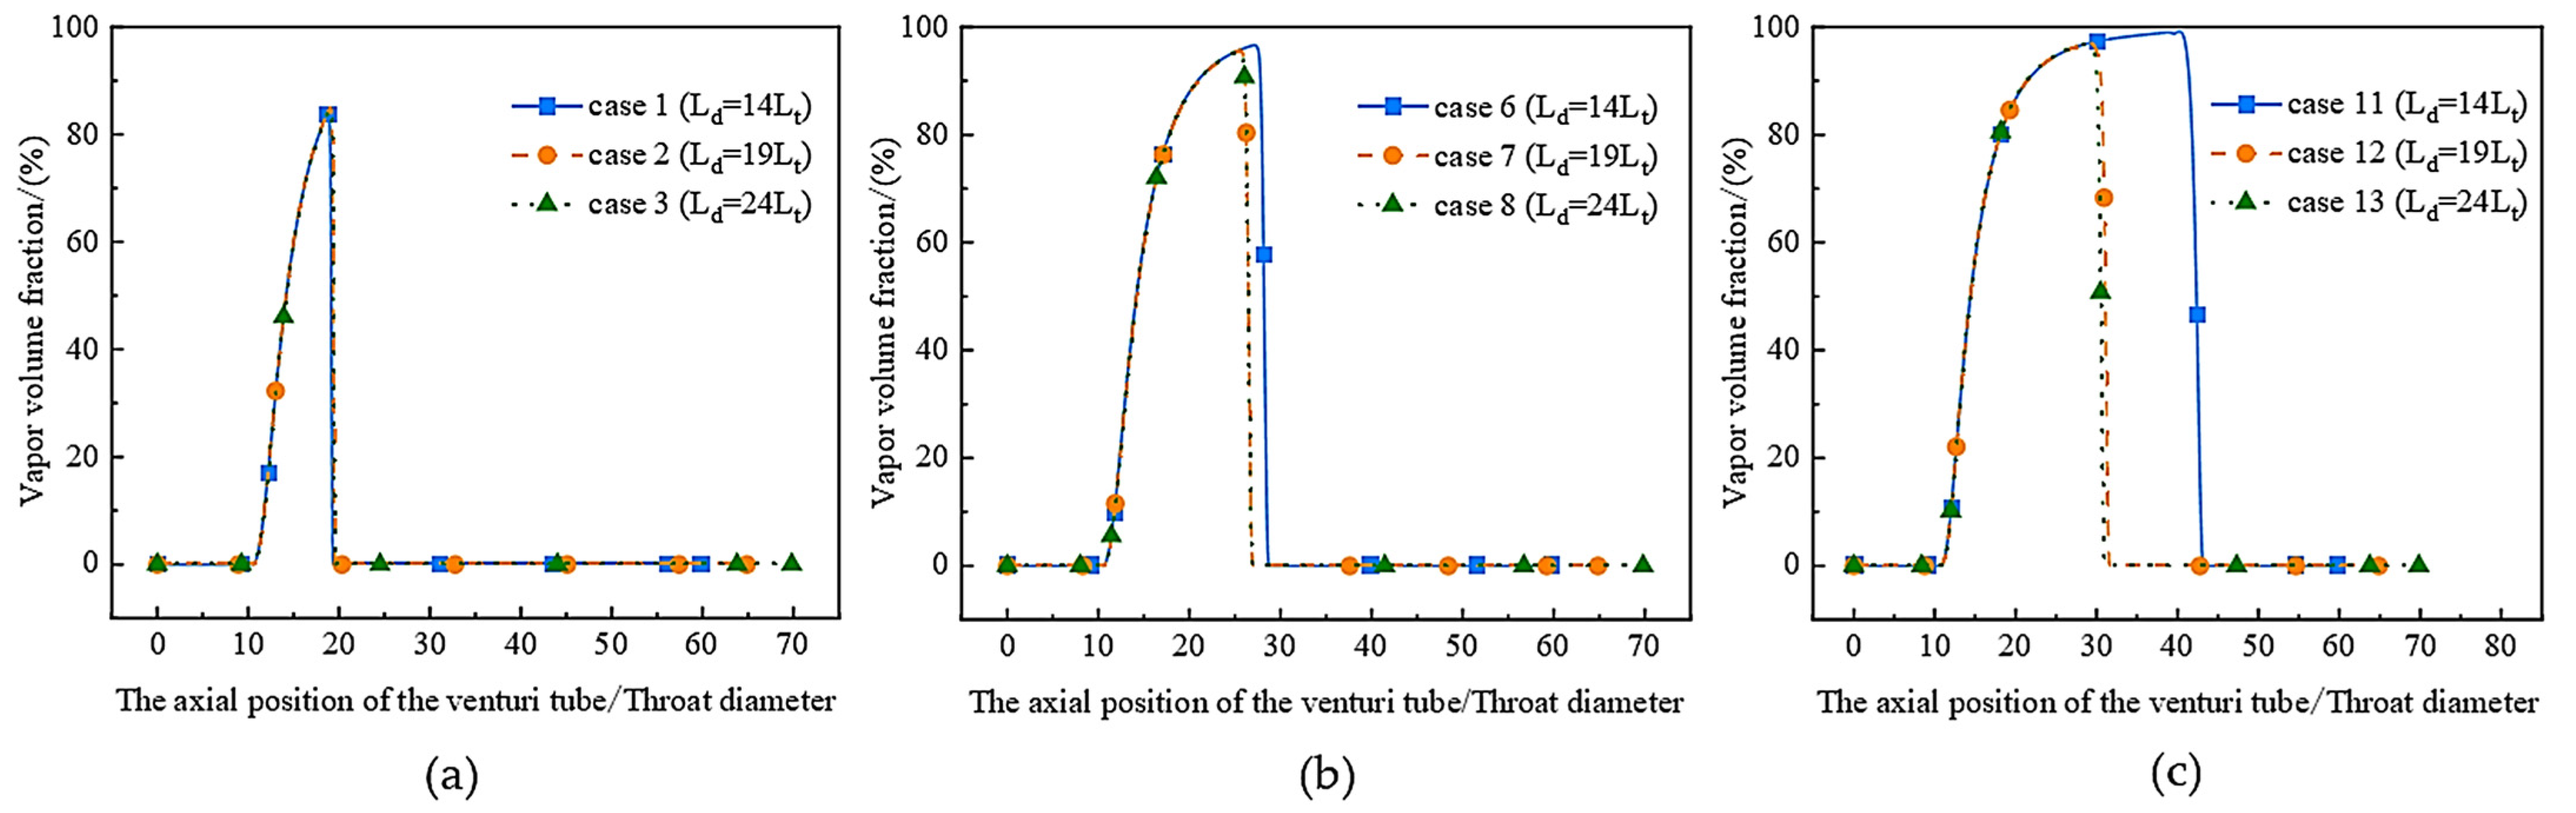
Figure 7 and Figure 8 depict the changes in the absolute pressure and vapor volume fraction for varying divergence lengths of Venturi tubes at inlet pressures of 0.4 MPa, 0.8 MPa, and 1.2 MPa. The results indicate that the absolute pressure variation profile is similar across all three operating conditions, characterized by a sudden drop in pressure, followed by the lowest pressure in the throat, and eventually rebounding to the outlet pressure. The aforementioned process was also reported in a study conducted by Hwang et al. [28], who observed that the pressure flatness at the throat of the Venturi indicates the occurrence of a phase transition. However, our current study reveals that the influence of the divergence length on the absolute pressure is contingent upon the inlet pressure. Specifically, when the inlet pressure is 0.4 MPa, as depicted in Figure 7a, the curves representing the absolute pressure variation for the three different divergence lengths show a remarkable overlap, suggesting that the length of the divergence section has a negligible effect on the absolute pressure under these conditions. In Figure 7b,c, the effect of the length of the divergence section on the absolute pressure becomes more prominent when the inlet pressure is either 0.8 or 1.2 MPa. It is observed that shorter divergence sections in Venturi tubes result in longer low-pressure zones, which promote bubble formation. This distinction becomes increasingly apparent with higher inlet pressures. The rationale behind this phenomenon can be ascribed to the synergistic impact of two key factors: the inlet pressure and the expansion of the diameter in the diverging section. In the context of higher pressure conditions, the length of the low-pressure zone within the Venturi tube is not solely determined by the magnitude of the inlet pressure but is also influenced by the degree of diameter expansion in the diverging section. Venturi tubes with shorter diverging sections exhibit a relatively smaller increase in diameter. As a result, the velocity decay inside the tube is gradual, leading to an extended low-pressure zone. Figure 8 exhibits a rising trend in the vapor volume fraction within the Venturi’s throat, which is aligned with the previously discussed pressure variation. These findings indicate that the low-pressure region in the throat plays a significant role in generating cavities. Furthermore, it has been observed that there exists a certain degree of overlap in the ascending segment of the vapor phase curve under varying pressure conditions, suggesting that alterations in the length of the divergent section do not impact the cavitation characteristics of the throat. Moreover, at an inlet pressure of 0.4 MPa, the distribution of vapor volume fraction remains consistent across different divergence section lengths. However, at inlet pressures of 0.8 MPa and 1.2 MPa, this consistency is broken, and an increasing trend is observed in both the amplitude and coverage area of the vapor volume fraction with a decreasing divergence section length. This shows that shorter divergence section lengths under higher pressure circumstances are beneficial to enhance the cavitation effect in the Venturi tube.
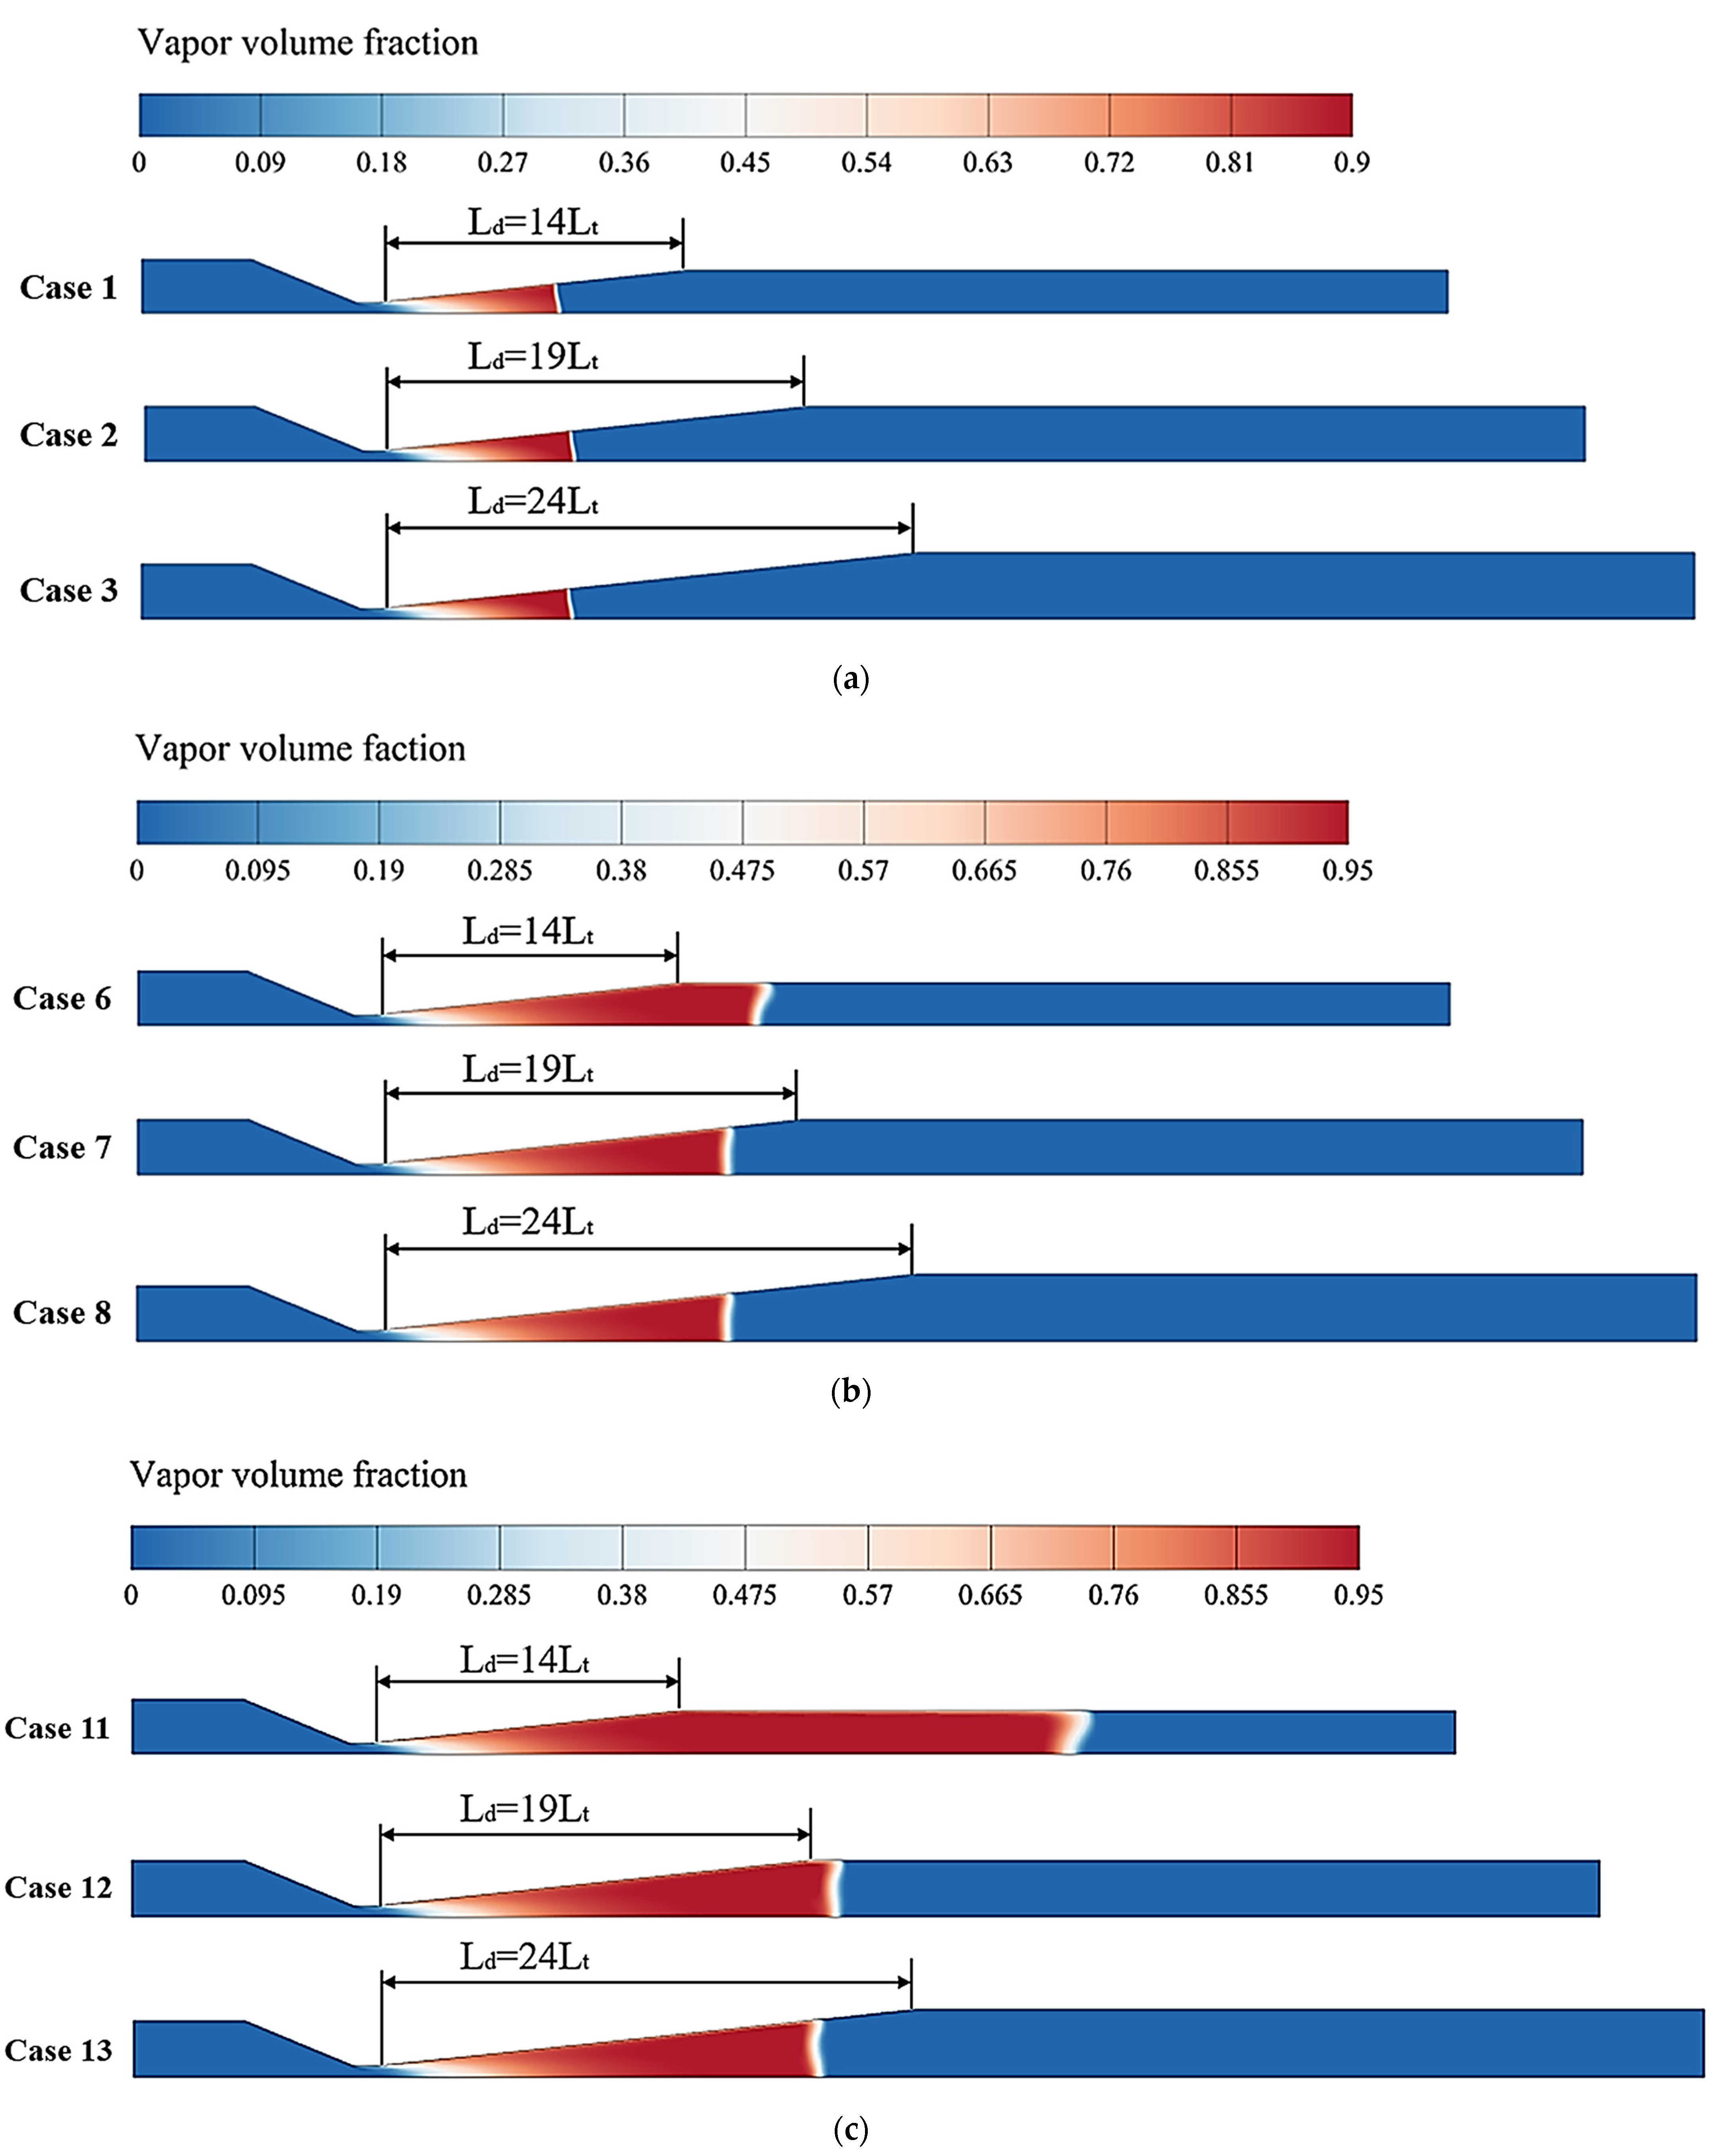
Figure 9 presents a comparison of the vapor volume fraction contours for three divergence lengths of the Venturi at various inlet pressures. The figure illustrates that vapor initially appears in the neck of the Venturi and then develops further in the divergence section. Furthermore, it is worth noting that the sensitivity of the vapor volume fraction exhibits variations under different pressure conditions. When the inlet pressure is 0.4 MPa, the cavity lengths of the Venturi with different divergence lengths are very similar, as demonstrated in Figure 9a. This can be attributed to the relatively small pressure difference in the Venturi at this point, resulting in a shorter low-pressure zone formed in the Venturi throat compared to the 0.8 and 1.2 MPa conditions. According to the research by Bashir et al. [31], the extent of cavity growth is determined by the residence time of the cavity within the low-pressure region. Thus, under the pressure condition of 0.4 MPa, the generated cavity has a shorter residence time in the throat and collapses in the diffusion section before it fully develops to the outlet. So, the cavity length is weakly influenced by the length of the divergence section in this situation. Figure 9b,c show that the Venturi with a shorter divergence length has a broader coverage of the cavitation region when the inlet pressure is 0.8 or 1.2 MPa. This variation can be attributed to the fact that the shorter divergence section reduces the cross-sectional area of the outlet, which in turn reduces the pressure recovery rate in the Venturi and lengthens the cavitation coverage area. This is also confirmed by the work of Kuldeep et al. [20], which shows that the pressure recovery rate in the downstream section has a significant impact on the growth of these generated cavities.
3.2.2. Analysis of Cavitation Collapse Strength
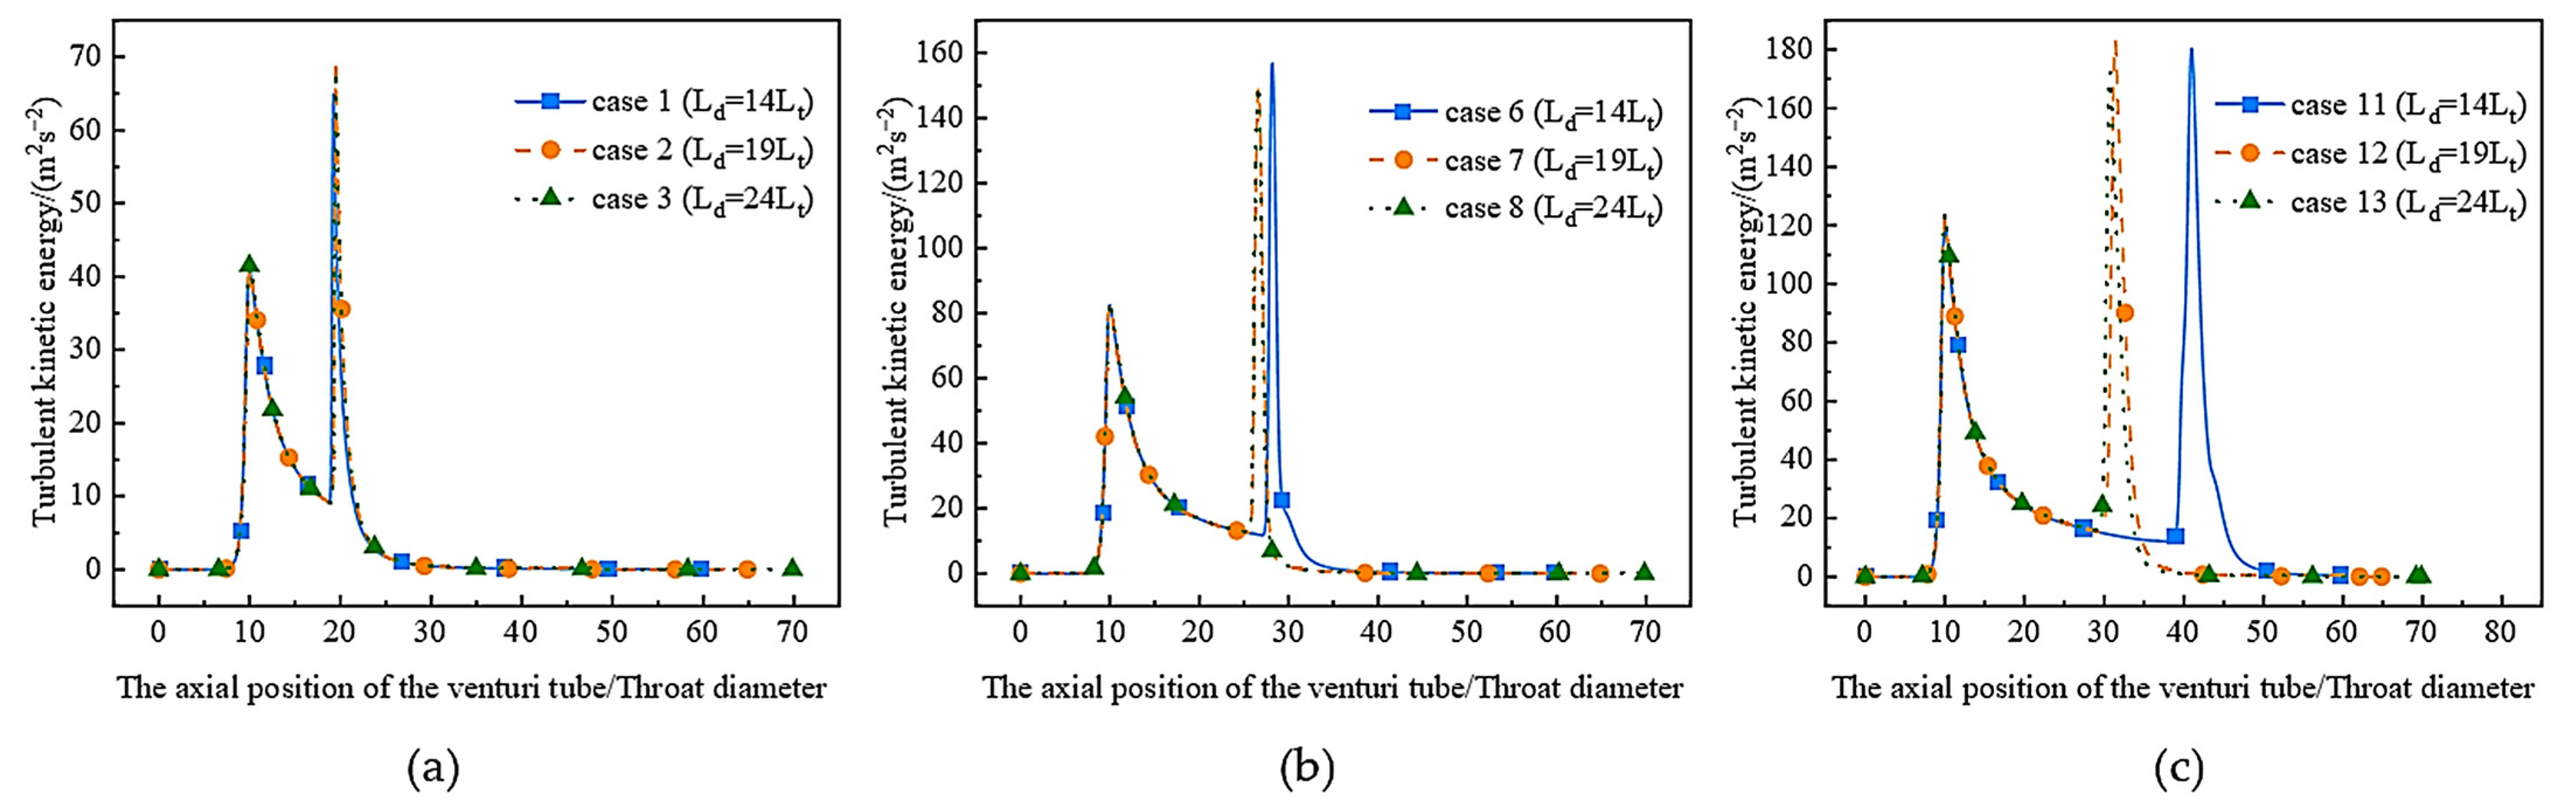
Figure 10 depicts the profiles of the turbulence kinetic energy (TKE) along the axis of a Venturi tube for various inlet pressures, which reveals two conspicuous spikes in TKE within the Venturi tube, corresponding to the inception of cavitation at the throat and the subsequent collapse of bubbles in the divergence section. Notably, the surge in the TKE during the collapse of cavitation bubbles surpasses that during the throat cavitation inception, which is indicative of a pronounced release of energy during bubble collapse. Upon comparing Figure 10a–c, it is evident that changes in the length of the divergence segment do not significantly impact the fluctuation behavior of the first turbulent kinetic energy inside the Venturi tube, which can be attributed to the fact that variations in the length of the divergent section have no impact on the cavitation characteristics at the throat of the Venturi tube. Nonetheless, there are noticeable differences in the variations of the second turbulent kinetic energy within the tube due to changes in the length of the Venturi tube divergence under various inlet pressures.
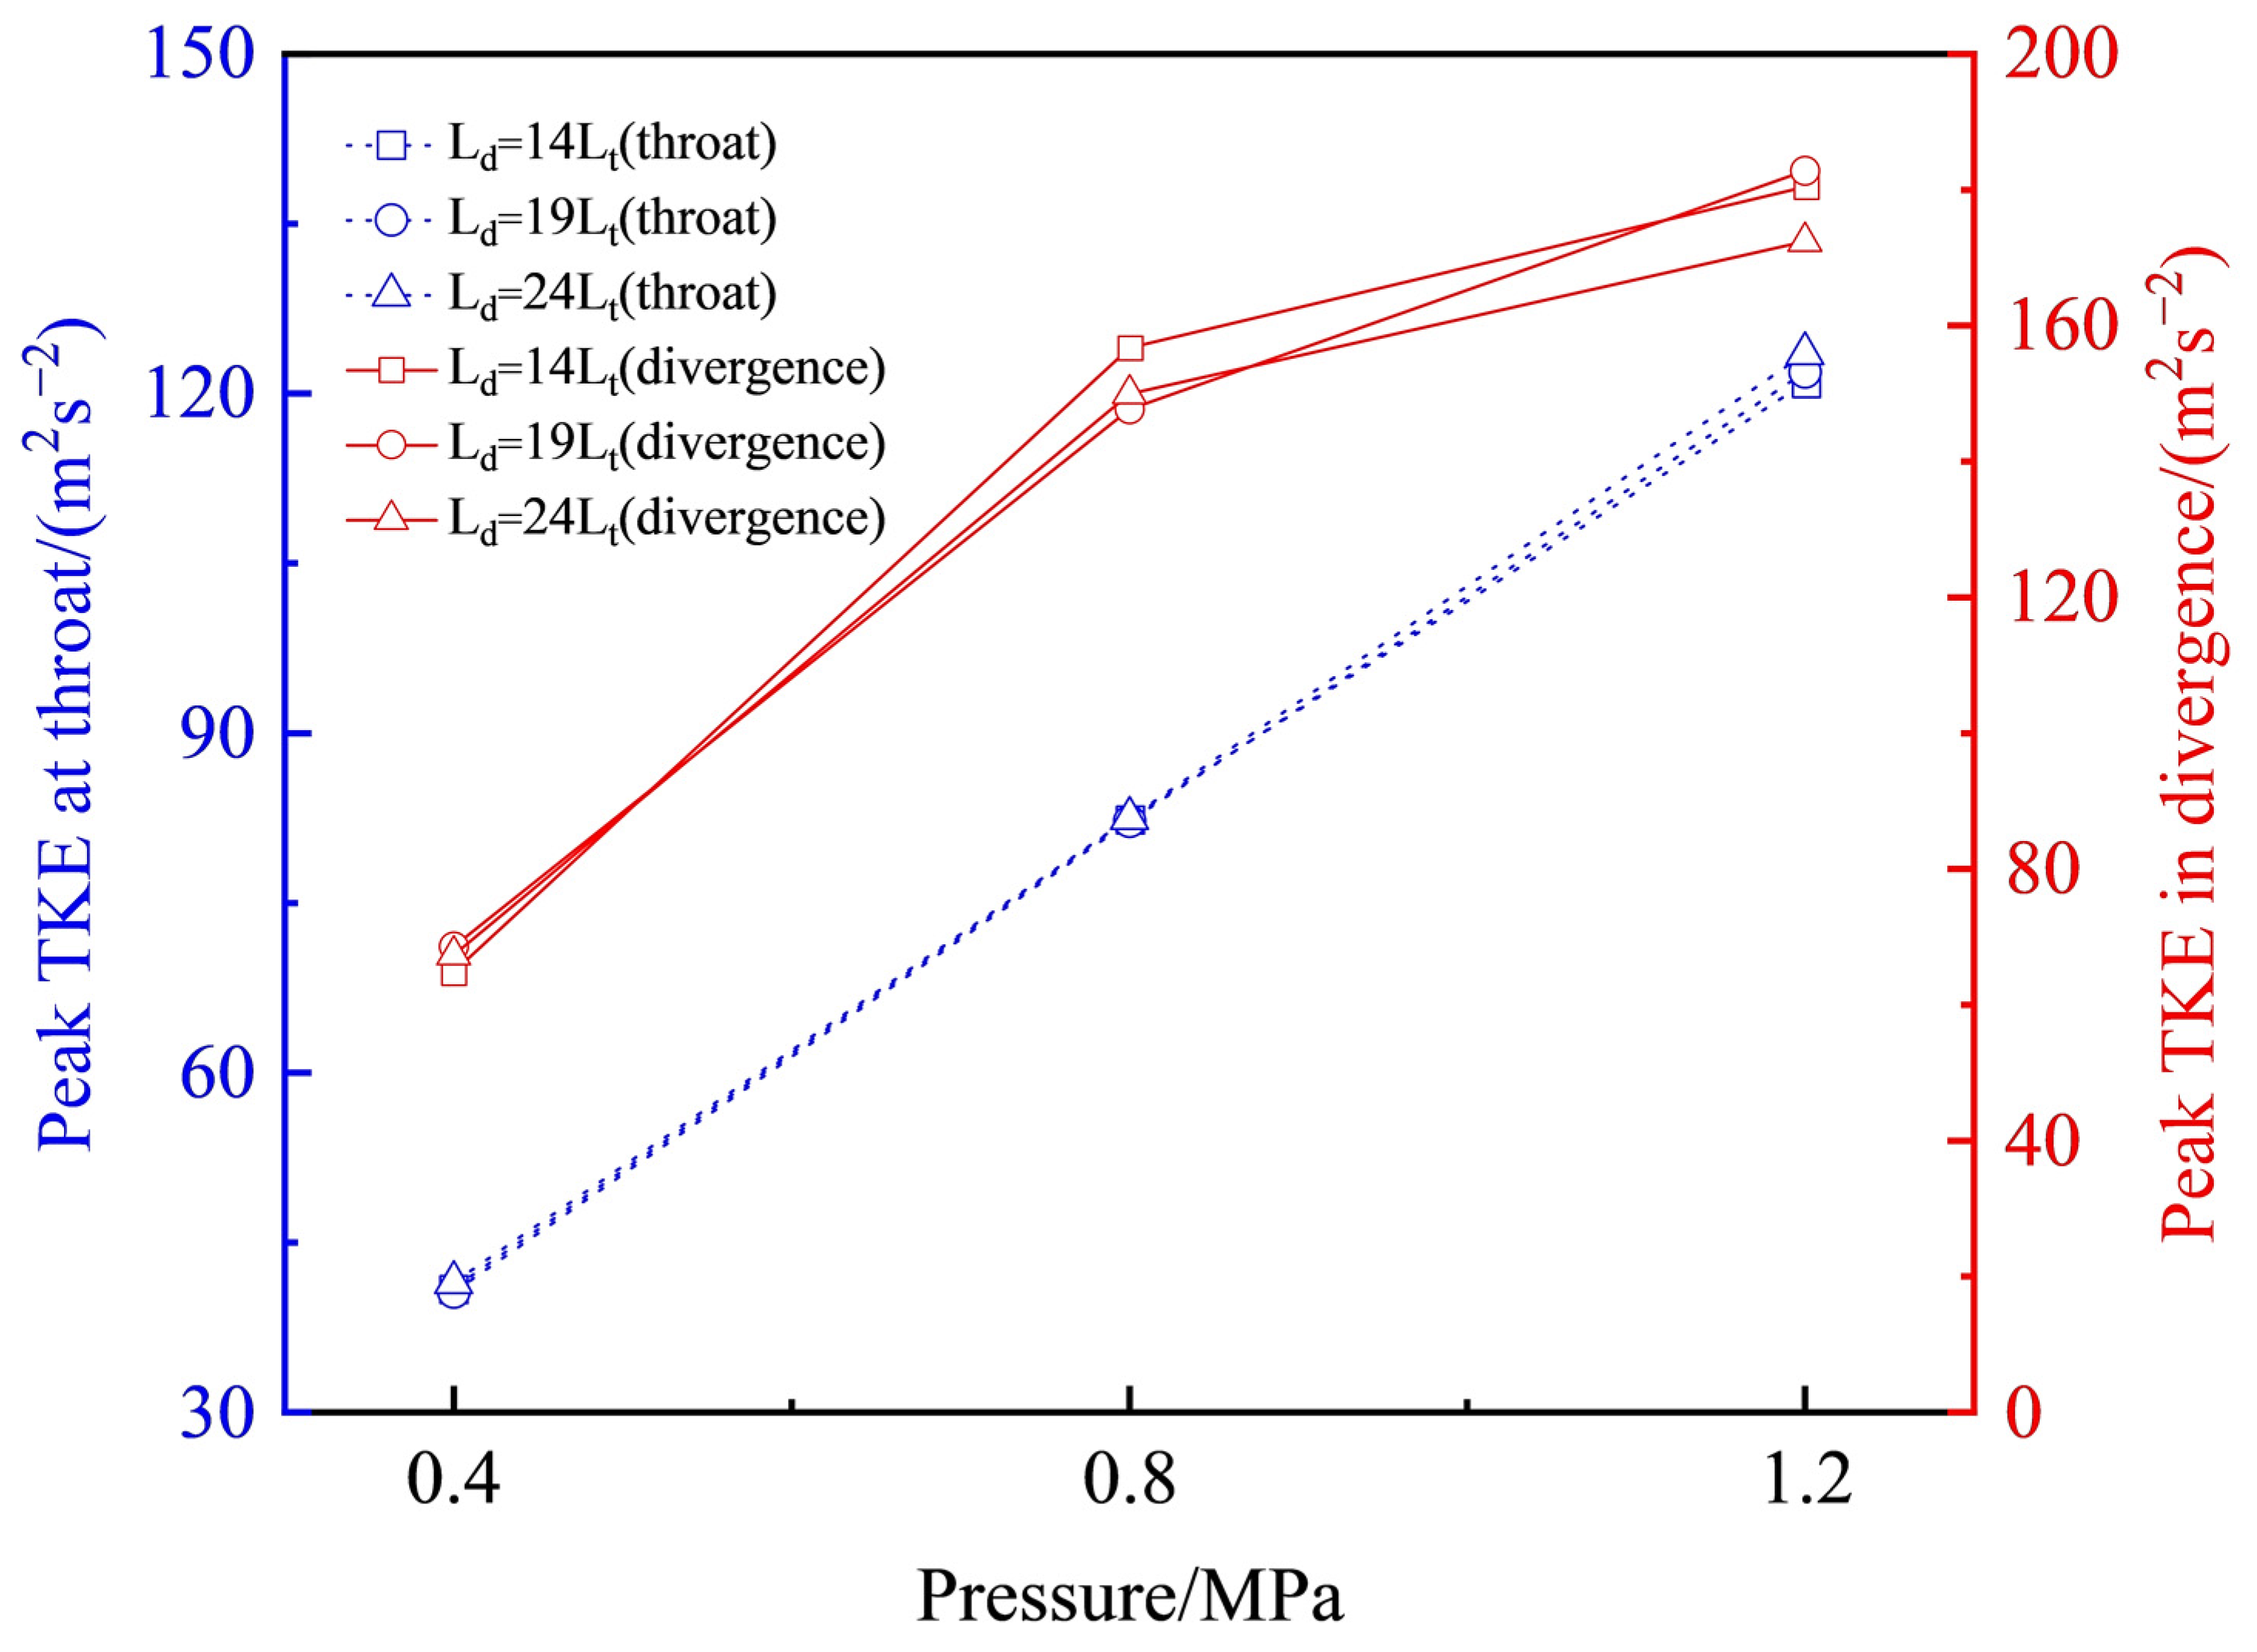
To gain further insights into the fluctuation characteristics of the turbulent kinetic energy, Figure 11 exhibits the trends in the variation at two distinct locations of peak turbulent kinetic energy across diverse pressure conditions. It can be seen that the turbulent kinetic energy peak values at the throat of the Venturi tube are consistent for different divergence lengths at different inlet pressures, and the peak values show a linear relationship with the inlet pressure. In addition, as the inlet pressure increases from 0.4 to 1.2 MPa, the turbulent kinetic energy peak in the divergence section of the Venturi tube undergoes two stages of growth. In the first stage, a short divergence section results in fast peak growth. In the second stage, the slow growth of the peak value can be attributed to the fact that as the cavities develop closer to the exit straight section under higher pressure conditions, the variation in the cross-sectional area at the diffuser section is minimal, leading to a slow enhancement of the cavitation collapse intensity. Furthermore, the maximum diameter that the cavities can achieve imposes a limitation on further improvements in the cavitation collapse intensity.
3.2.3. Analysis of Flow Field Parameters
Several significant flow field parameters at three different pressure conditions were collected in Table 3 to assess the impact of divergence section length on the cavitation flow field more accurately. The table shows that for the inlet pressure of 0.4 MPa, the variation of the cavitation volume of Venturi with different divergence section lengths is very tiny. However, at the inlet pressure of 0.8 and 1.2 MPa, Venturi tubes with shorter divergence section lengths obviously have higher cavitation volumes, which is consistent with the analysis in Figure 8. Furthermore, the maximum velocity of the throat increases slightly as the length of the divergence section decreases under varied inlet conditions. Another fact we may observe is that with the same inlet pressure, the outlet mass flow rate of Venturi tubes with various diffusion lengths is nearly identical, indicating that the diffusion length has no significant impact on the outlet mass flow rate.
3.3. Effects of the Convergent Length on Cavitation Characteristics
3.3.1. Analysis of Pressure and Vapor Volume Fraction
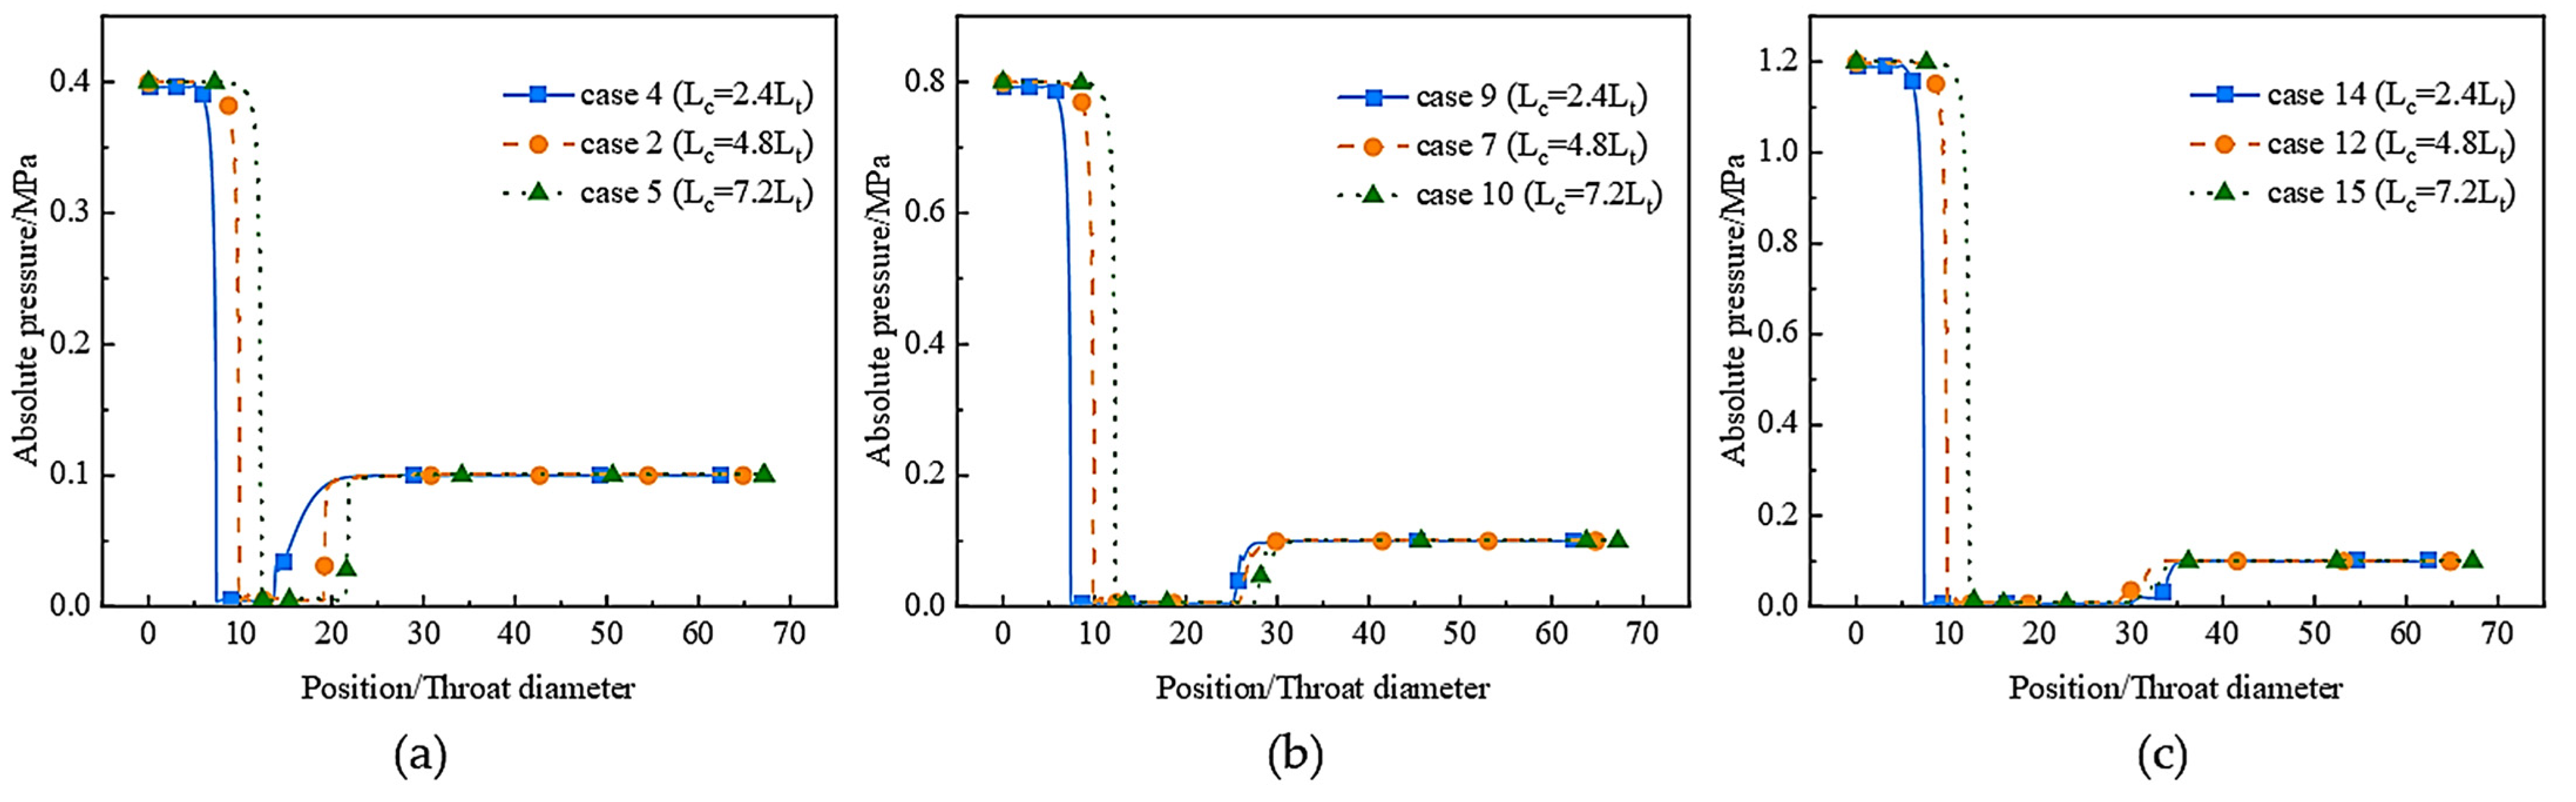
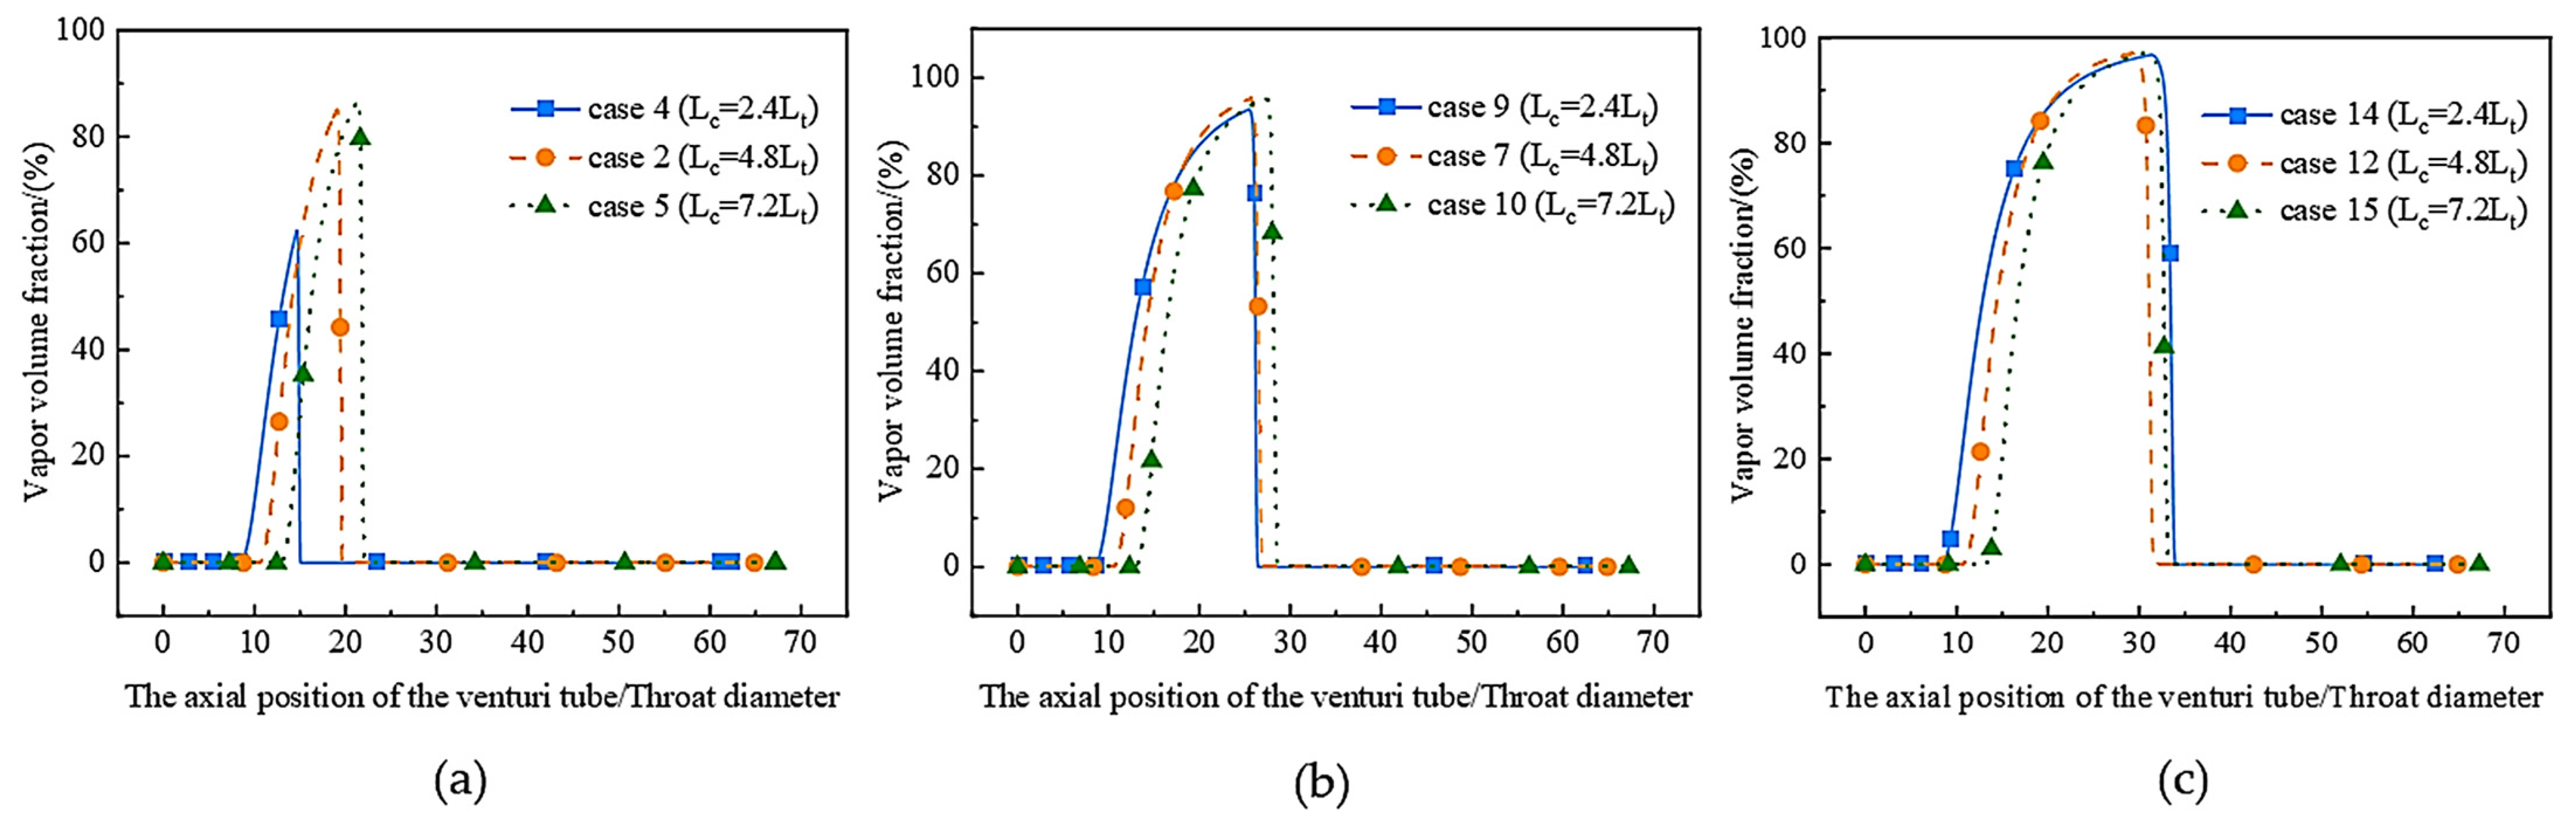
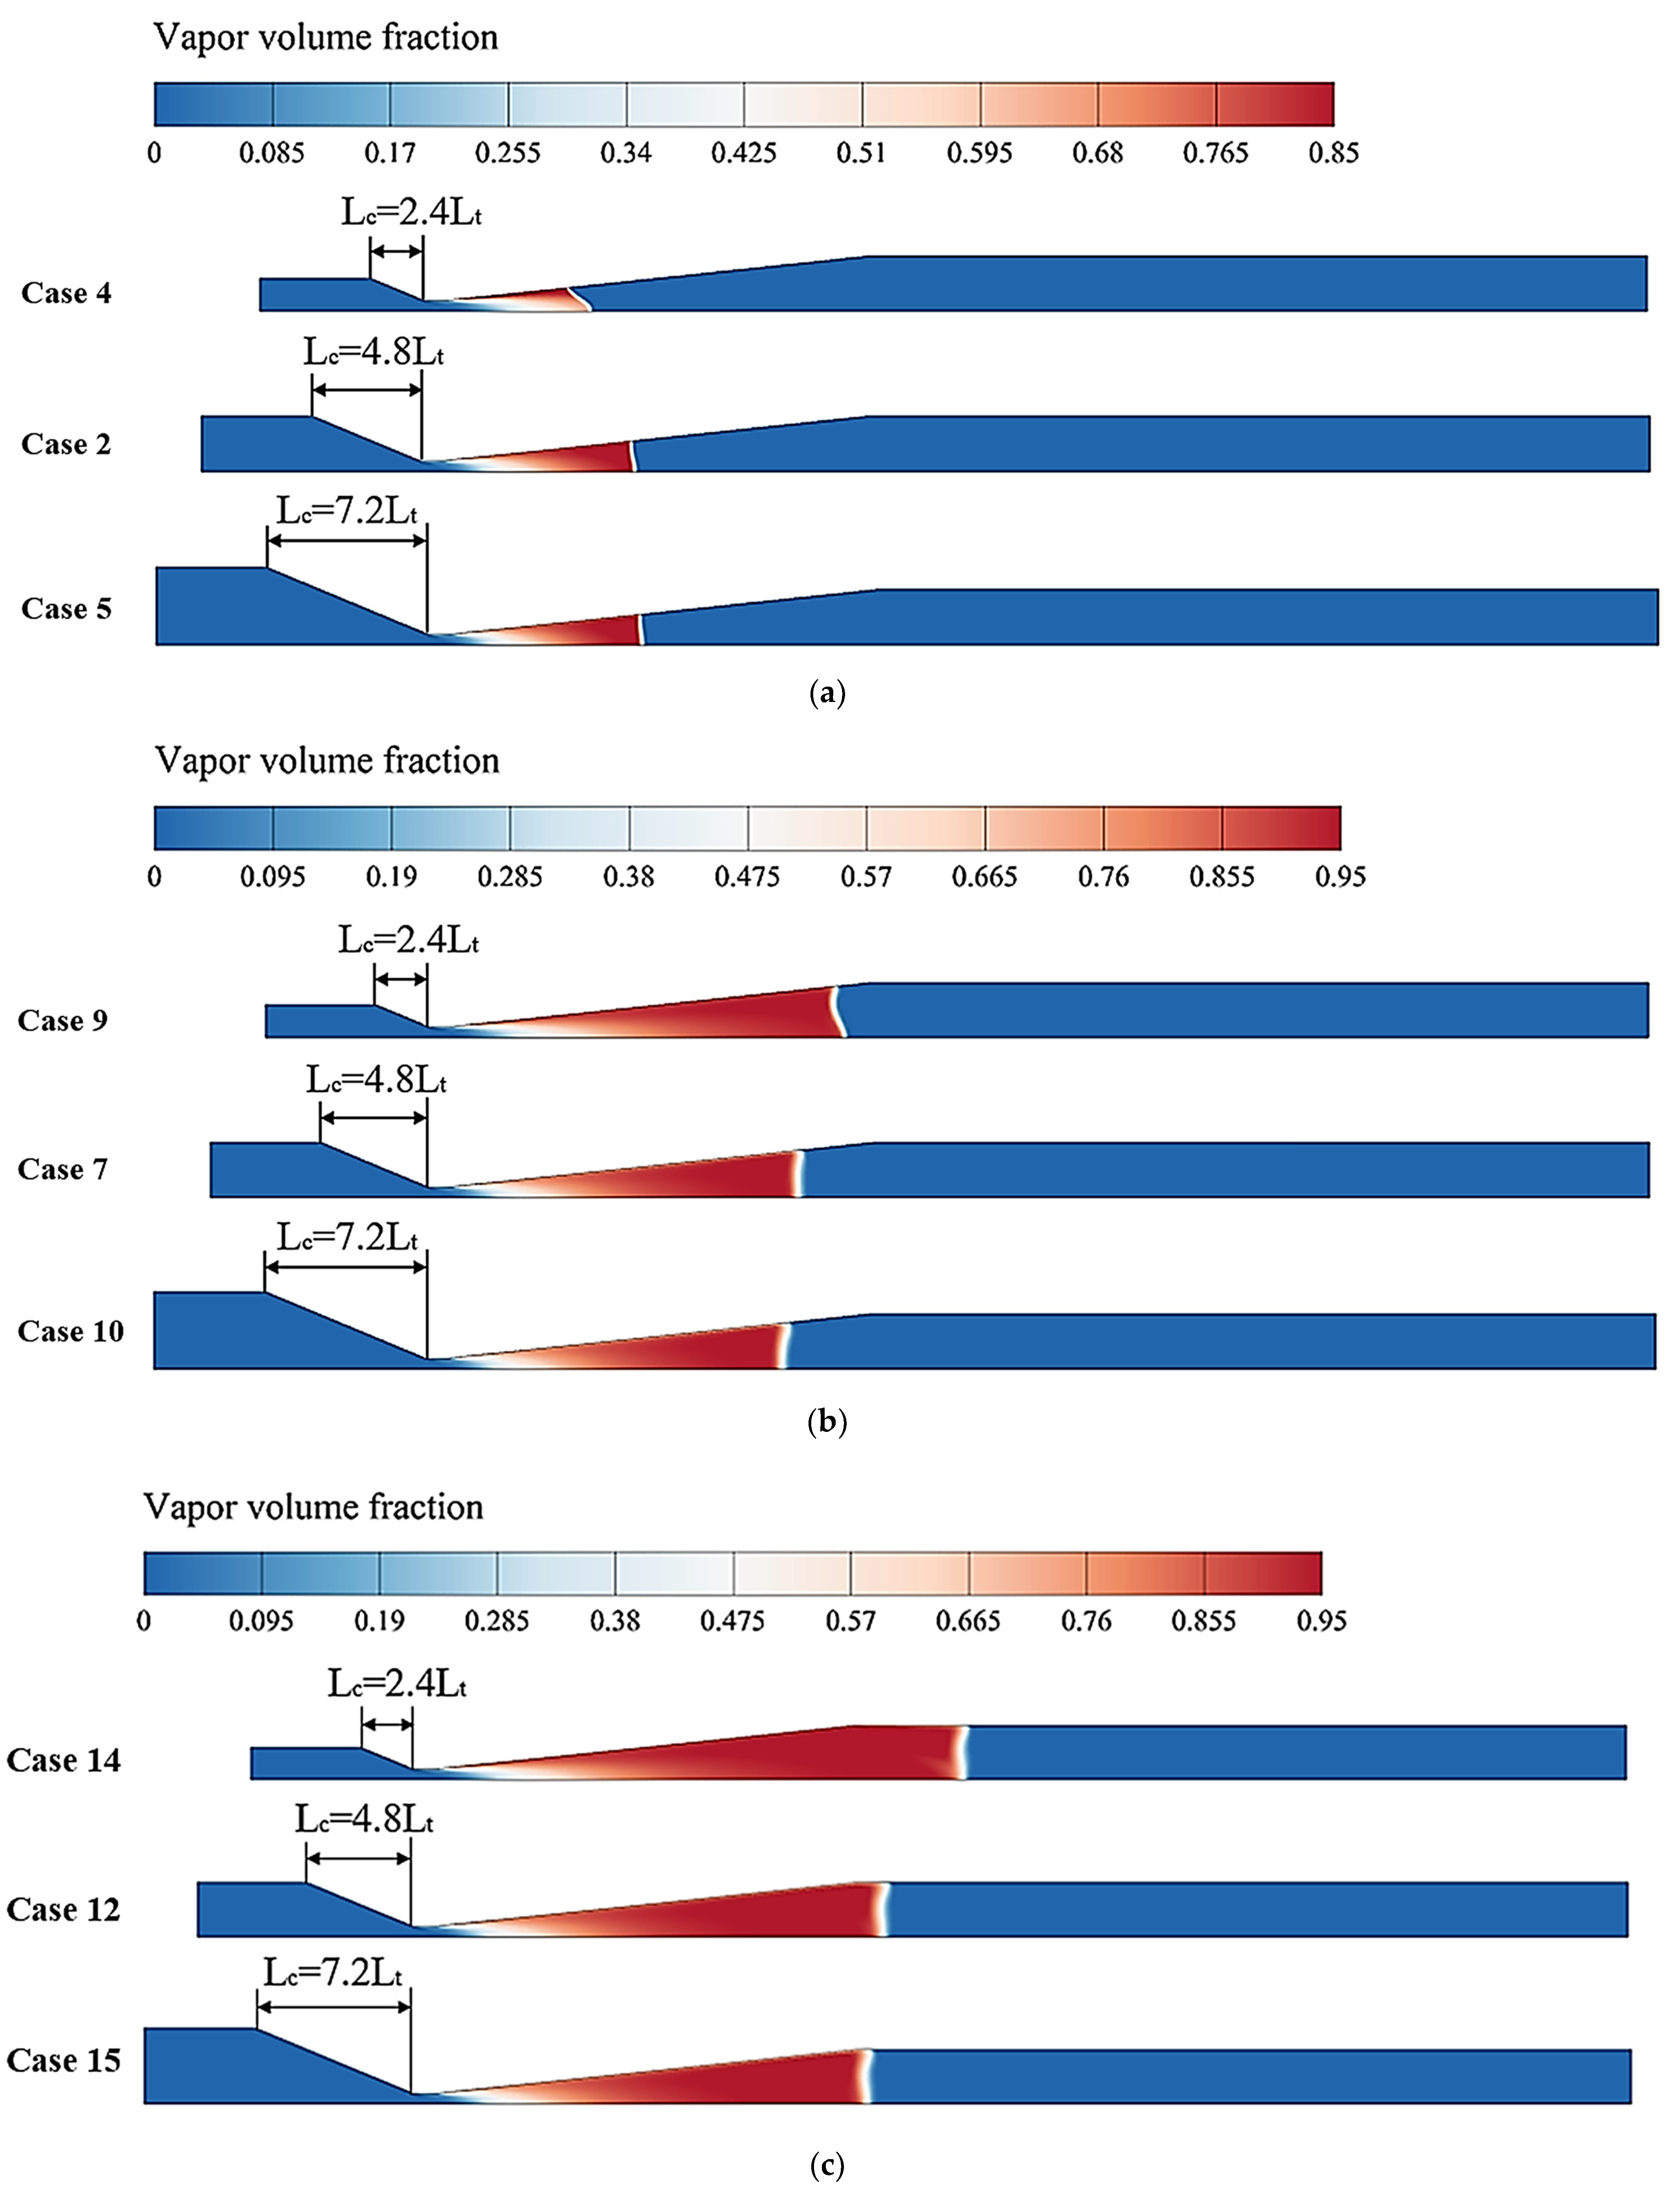
Figure 12 and Figure 13 disclose the influence of the convergence section length on the absolute pressure and vapor volume fraction at various inlet pressures. Figure 12 indicates that the impact of the convergence section length on the absolute pressure of the flow field depends on the inlet pressure. Specifically, when the inlet pressure is 0.4 MPa, a slower pressure recovery rate is observed for the Venturi with a 24 mm convergence section length. These results suggest that a contraction section length of 24 mm results in a higher throat velocity and slower velocity reduction, potentially impacting the intensity of cavitation. However, for inlet pressures of 0.8 or 1.2 MPa, a shorter convergence section length leads to a longer low-pressure region, with greater differences observed as the inlet pressure increases. Furthermore, changes in the absolute pressure can affect the volume fraction of vapor, as depicted in Figure 13. The coverage and amplitude of the vapor volume fraction decrease as the length of the convergence section decreases when the inlet pressure is 0.4 MPa. Conversely, when the inlet pressure is 1.2 MPa, the coverage area of the vapor volume fraction increases with decreasing convergence section lengths. These findings indicate that the impact of the convergence section length on the cavitation characteristics of the Venturi tube is non-monotonic and also dependent on the inlet pressure conditions.
Figure 14 compares the effect of the length of the convergence section on the distribution of the vapor phase under different pressure conditions in a more visible way. It can be observed that the cavitation cloud within the Venturi tube, characterized by a 24 mm convergence section length, exhibits a distinct “jet” shape under an inlet pressure of 0.4 MPa. Furthermore, it is noteworthy to mention that the length of the cavitation cloud is comparatively shorter compared to other convergence length scenarios. The observed phenomenon can be ascribed to the direct impact of the length of the convergence section on the cross-sectional area of the inlet. The Venturi tube with a small cross-sectional area of the inlet has a higher inflow velocity under the same inlet pressure. Cavities in the throat may have a shorter residence time due to the higher flow velocity, and they are carried into the divergence section by the flow before they fully develop and are pushed to both sides of the tube axis by the flow. As a result, cavitation clouds develop into the shape of jets. However, when the inlet pressure is 0.8 or 1.2 MPa, the shorter convergence length of the Venturi tube has a longer cavitation cloud. There are two potential causes for this. On the one hand, as depicted in Figure 12, a bigger pressure difference causes the low-pressure area with a shorter contraction section length to be longer, which is beneficial to the development of the cavity. Furthermore, fluid impinging on the wall of the convergence section will result in a significant flow loss at high-pressure differentials. Shorter convergence structures reduce the flow loss in the convergence section, improve the throat velocity, and extend the cavitation cloud’s coverage area.
3.3.2. Analysis of Cavitation Collapse Strength
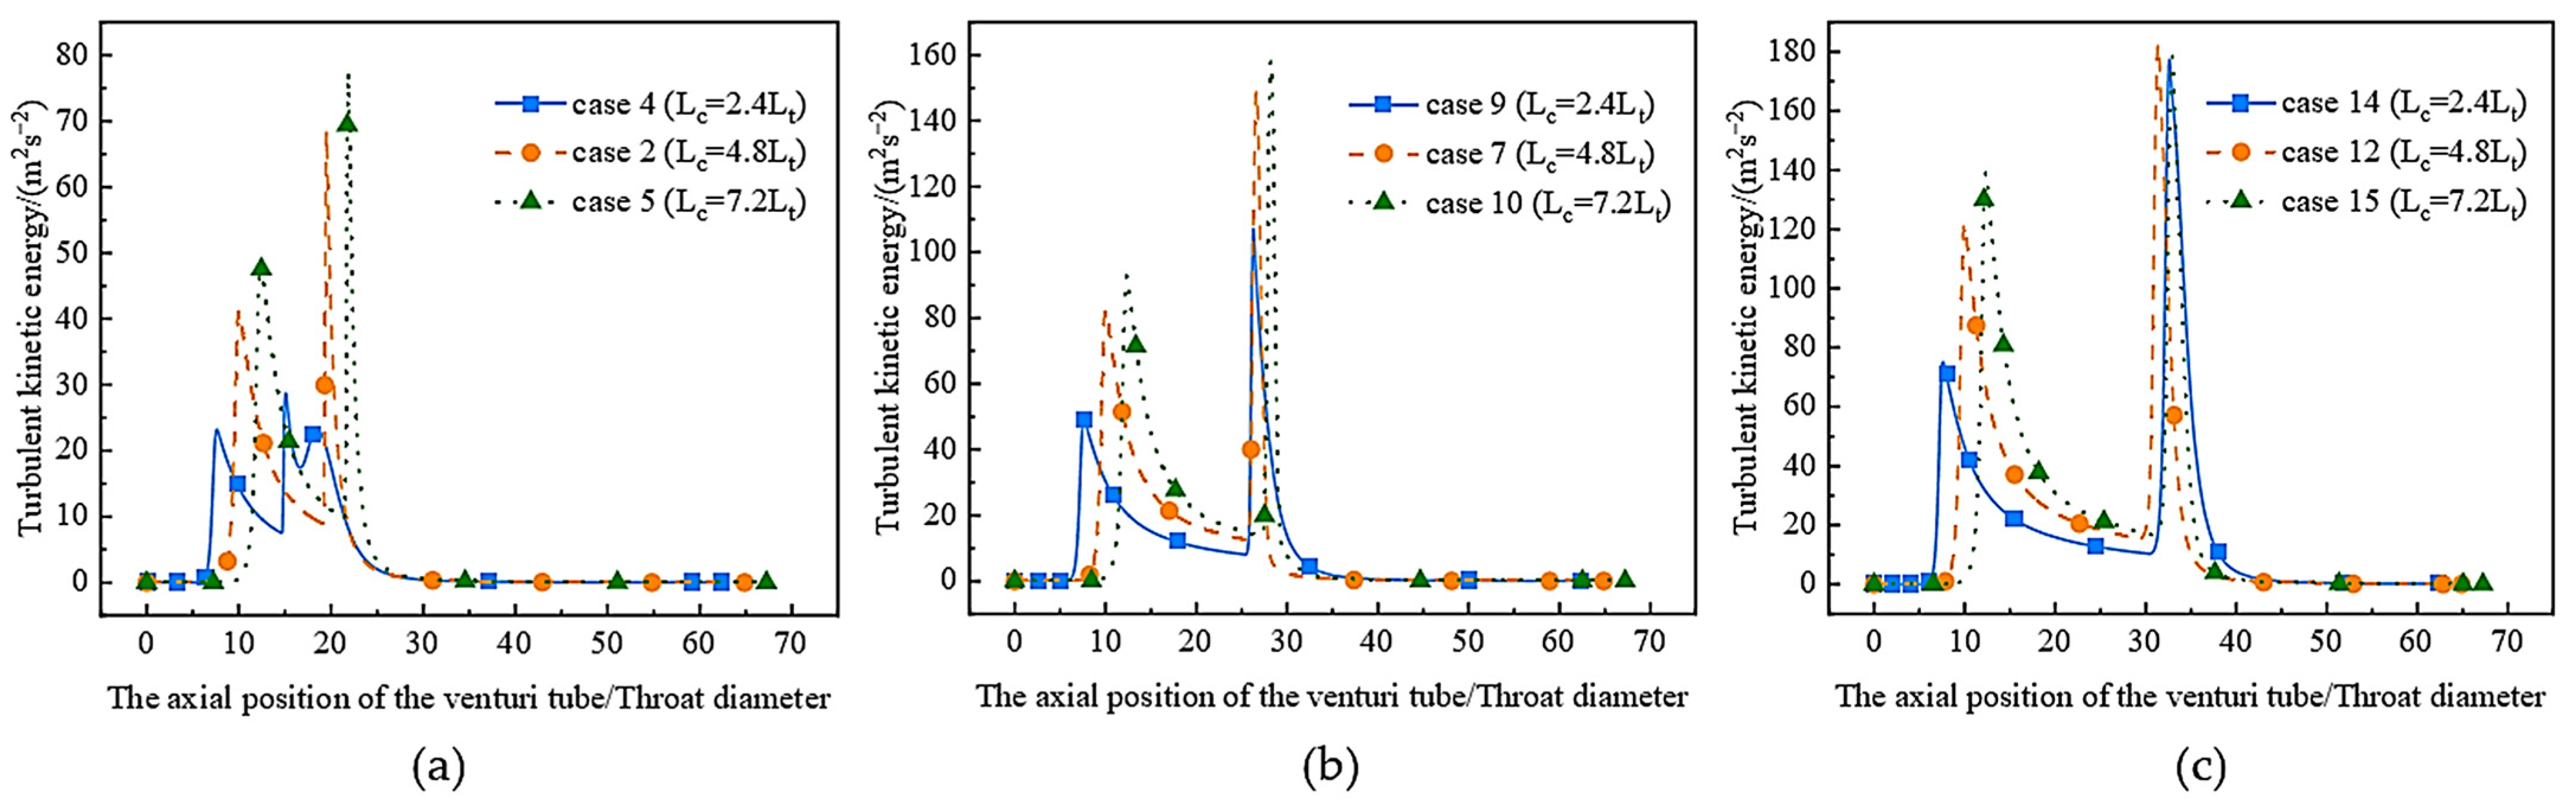
The formation and collapse of cavities often lead to changes in the local turbulent kinetic energy [14,20]. Figure 15 depicts the profile of turbulent kinetic energy distribution within the Venturi tube under varying inlet pressures. The plot effectively captures the discernible alterations in turbulent kinetic energy resulting from the inception of cavitation at the throat region and the subsequent bubble collapse in the divergence segment. In contrast to Venturi tubes with varying divergence lengths, alterations in the convergence length of a Venturi tube exert an influence on the turbulent kinetic energy at both the throat and diffuser sections. Comparing the profiles of the turbulent kinetic energy in Figure 15a–c, it is evident that the effect of the convergence length on the turbulence kinetic energy at the throat is consistent, regardless of the pressure conditions. Clearly, the peak value of the turbulent kinetic energy at the throat increases with the increasing convergence length. The turbulent kinetic energy distribution at the divergence section of a Venturi tube varies differently under varying pressure conditions. Specifically, at an inlet pressure of 0.4 MPa, it is apparent from Figure 15a that Venturi tubes with longer convergence lengths exhibit higher peak turbulent kinetic energy and stronger bubble collapse intensity at the divergence section. Conversely, at an inlet pressure of 1.2 MPa, the peak turbulent kinetic energy at the divergence section of Venturi tubes with different convergence lengths is similar, and the intensity of the bubble collapse is comparable as well. These observations suggest that the variations in the turbulent kinetic energy at the divergence section of the Venturi tube are more sensitive to pressure conditions than the convergence length.
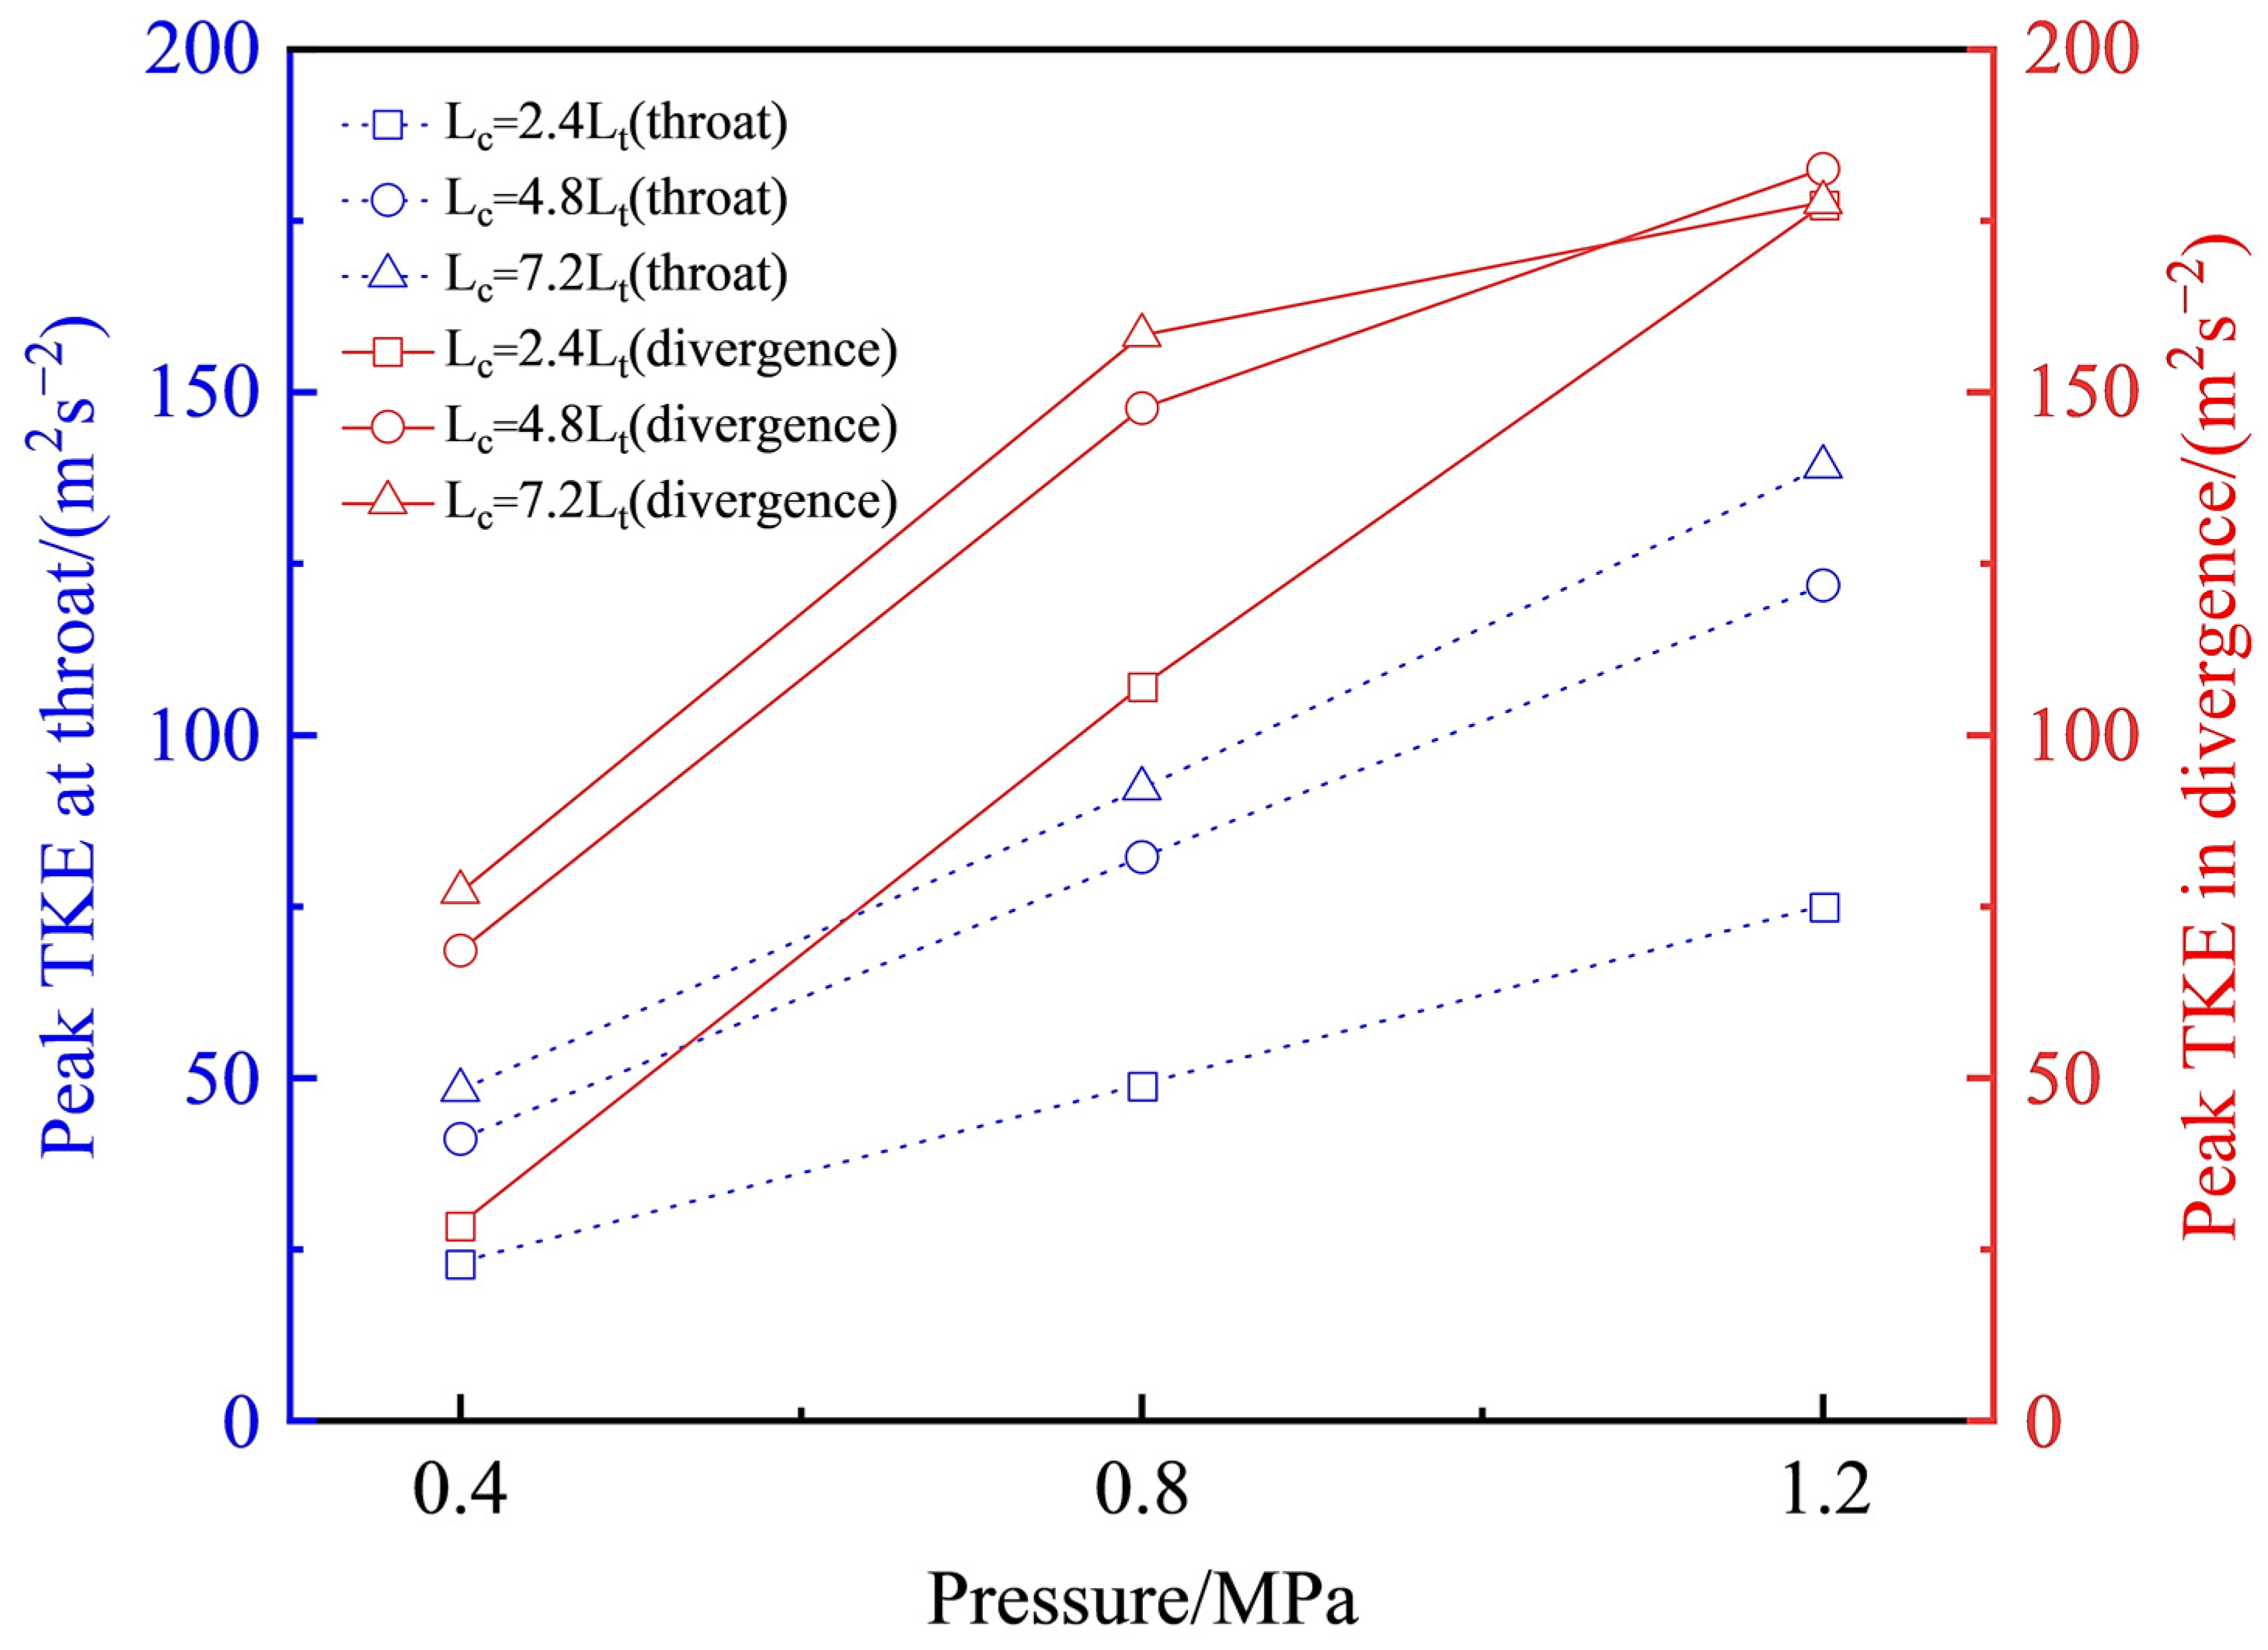
Figure 16 presents the trends in the variations of the two locations of turbulent kinetic energy peaks within the Venturi tube. In general, both peaks show an increase as the inlet pressure rises. The growth trend of the peak at the throat is relatively stable. Longer convergent sections in the Venturi tube lead to higher turbulent kinetic energy peaks. However, the impact of the convergent section length on the turbulent kinetic energy peak in the divergence section depends on the inlet pressure. As the inlet pressure increases, the effect of the convergent section length on the turbulent kinetic energy peak in the divergence section gradually diminishes. This indicates that the effect of the Venturi tube convergence section length on the downstream bubble collapse strength is limited, and this effect gradually weakens as the inlet pressure increases.
3.3.3. Analysis of Flow Field Parameters
Table 4 presents the variations in several flow field parameters for each Venturi model across different inlet pressure conditions. According to the data in the table, under different inlet pressures, the mass flow rate and the maximum velocity of the throat show different degrees of decrease with an increase in the length of the convergence section. This indicates that the maximum velocity of the throat and the mass flow of the Venturi are not only related to the inlet pressure but also to the length of the convergence section. In addition, the variation in the cavitation volume observed in the table indicates that the effect of the convergence section’s length on the cavitation characteristics depends on the provided inlet pressure. When the inlet pressure is low, a short convergence section length does not improve the cavitation effect of the Venturi tube. When the inlet pressure is high, a small convergence section length can significantly improve the cavitation effect, and the cavitation effect becomes more significant as the inlet pressure rises. Thus, the specified pressure conditions should be considered while determining the length of the convergence section.
4. Conclusions
In this study, the CFD method was used to study the Venturi tube’s cavitation phenomenon. The effects of convergence and divergence segment length on Venturi tube cavitation characteristics are investigated and discussed. The findings provide useful guidance for designing and studying Venturi structures under various pressure conditions. The present work leads to the following conclusions:
The cavitation characteristics around the throat region are generally unaffected by changes in the divergence section’s length. In addition, the influence of the divergent section length on Venturi cavitation characteristics relies on the pressure conditions provided. With the increase in pressure drop, the Venturi tubes with shorter divergence section lengths have longer low-pressure areas, which can yield greater cavitation zones. The peak turbulence kinetic energy at the divergence section of the Venturi tube shows a two-stage growth. In the first growth stage, the Venturi tubes with shorter divergence sections have a faster growth rate of the turbulence kinetic energy, resulting in a significant enhancement of the bubble collapse strength. In the second growth stage, the growth rate of the turbulence kinetic energy peak slows down due to the limited development space of the straight section, leading to a suppression of the enhancement of bubble collapse strength.
Unlike the divergence section, the length of the convergence section has a more profound impact on the cavitation behavior in the Venturi tube. Under different pressure conditions, the length of the convergence section exhibits varied cavitation behavior. The cavitation effect in the Venturi tube is not enhanced by shortening the length of the convergence section when the inlet pressure is low. In contrast, a shorter convergence section length can extend the low-pressure area and promote the formation of longer cavitation clouds when the inlet pressure is high. The amplification of turbulent kinetic energy induced by the inception of a cavity at the throat of the Venturi tube increases as the length of the tube’s contraction section grows. However, the primary factor influencing turbulence kinetic energy at the diffuser section is the inlet pressure conditions. With increasing inlet pressure, the effect of changing the contraction section length on turbulence kinetic energy at the diffuser section gradually diminishes.
Under the same inlet pressure, the effect of Venturi tube divergence section lengths on the outlet mass flow rate and maximum throat velocity is minor, whereas the length of the convergence section has some discernible impact on these parameters. As the convergent section increases, the outlet mass flow rate and the maximum throat velocity exhibit a decreasing trend.
Author Contributions
Conceptualization, Y.L. and B.L.; methodology, Y.L.; software, B.L.; validation, B.L.; formal analysis, Y.L.; investigation, B.L.; resources, Y.L.; writing—original draft preparation, B.L.; writing—review and editing, Y.L.; supervision, Y.L.; project administration, Y.L.; funding acquisition, Y.L. All authors have read and agreed to the published version of the manuscript.
Funding
This research was funded by the Scientific Research Start-up Fund of Zhejiang Sci-Tech University, grant no.11132932619106.
Institutional Review Board Statement
Not applicable.
Informed Consent Statement
Not applicable.
Data Availability Statement
Not applicable.
Acknowledgments
The authors would like to thank the editor and anonymous reviewers for their constructive suggestions, which comprehensively improved the quality of the paper. The authors would also like to thank the support from Zhejiang Sci-Tech University.
Conflicts of Interest
The authors declare no conflict of interest.
References
- Carpenter, J.; Badve, M.; Rajoriya, S.; George, S.; Saharan, V.K.; Pandit, A.B. Hydrodynamic cavitation: An emerging technology for the intensification of various chemical and physical processes in a chemical process industry. Rev. Chem. Eng. 2017, 33, 433–468. [Google Scholar] [CrossRef]
- Sarvothaman, V.P.; Simpson, A.; Ranade, V.V. Comparison of Hydrodynamic Cavitation Devices based on Linear and Swirling Flows: Degradation of dichloroaniline in water. Ind. Eng. Chem. Res. 2020, 59, 13841–13847. [Google Scholar] [CrossRef]
- Sarvothaman, V.P.; Simpson, A.T.; Ranade, V.V. Modelling of vortex based hydrodynamic cavitation reactors. Chem. Eng. J. 2018, 377, 119639. [Google Scholar] [CrossRef] [Green Version]
- Gogate, P.R.; Pandit, A.B. Hydrodynamic Cavitation Reactors: A state of the art review. Rev. Chem. Eng. 2001, 17, 1–85. [Google Scholar] [CrossRef]
- Rajoriya, S.; Bargole, S.; George, S.; Saharan, V.K. Treatment of textile dyeing industry effluent using hydrodynamic cavitation in combination with advanced oxidation reagents. J. Hazard. Mater. 2018, 344, 1109–1115. [Google Scholar] [CrossRef]
- Wang, C.; Jin, R.; He, Z.; Qiao, Y.; Wang, Y.; Wang, K.; Lu, Y.; Wang, X.; Liu, D. A new water treatment technology for degradation of B[a]A by Hydrodynamic Cavitation and Chlorine Dioxide Oxidation. Ultrason. Sonochem. 2020, 61, 104834. [Google Scholar] [CrossRef] [PubMed]
- Abbas-Shiroodi, Z.; Sadeghi, M.T.; Baradaran, S. Design and optimization of a cavitating device for Congo red decolorization: Experimental investigation and CFD simulation. Ultrason. Sonochem. 2021, 71, 105386. [Google Scholar] [CrossRef]
- Innocenzi, V.; Prisciandaro, M.; Vegliò, F. Study of the effect of operative conditions on the decolourization of azo dye solutions by using hydrodynamic cavitation at the lab scale. Can. J. Chem. Eng. 2020, 98, 1980–1988. [Google Scholar] [CrossRef]
- Bagal, M.V.; Gogate, P.R. Degradation of diclofenac sodium using combined processes based on hydrodynamic cavitation and heterogeneous photocatalysis. Ultrason. Sonochem. 2014, 21, 1035–1043. [Google Scholar] [CrossRef]
- Mezule, L.; Tsyfansky, S.; Yakushevich, V.; Juhna, T. A simple technique for water disinfection with hydrodynamic cavitation: Effect on survival of Escherichia coli. Desalination. 2009, 248, 152–159. [Google Scholar] [CrossRef]
- Badve, M.; Gogate, P.; Pandit, A.; Csoka, L. Hydrodynamic cavitation as a novel approach for wastewater treatment in wood finishing industry. Sep. Purif. Technol. 2013, 106, 15–21. [Google Scholar] [CrossRef]
- Wang, B.; Su, H.; Zhang, B. Hydrodynamic cavitation as a promising route for wastewater treatment—A review. Chem. Eng. J. 2021, 412, 128685. [Google Scholar] [CrossRef]
- Wang, B.; Liu, Y.; Zhang, H.; Shi, W.; Xiong, M.; Gao, C.; Cui, M. Hydrodynamic cavitation and its application in water treatment combined with ozonation: A review. J. Ind. Eng. Chem. 2022, 114, 33–51. [Google Scholar] [CrossRef]
- Simpson, A.; Ranade, V.V. Modeling Hydrodynamic Cavitation in Venturi: Influence of Venturi Configuration on Inception and Extent of Cavitation. AIChE J. 2019, 65, 421–433. [Google Scholar] [CrossRef]
- Li, M.; Bussonnière, A.; Bronson, M.; Xu, Z.; Liu, Q. Study of Venturi tube geometry on the hydrodynamic cavitation for the generation of microbubbles. Miner. Eng. 2019, 132, 268–274. [Google Scholar] [CrossRef]
- Sato, K.; Hachino, K.; Saito, Y. Inception and Dynamics of Traveling-Bubble-Type Cavitation in a Venturi. Nippon. Kikai Gakkai Ronbunshu B Hen 2004, 70, 69–76. [Google Scholar] [CrossRef] [Green Version]
- Brunhart, M.; Soteriou, C.; Gavaises, M.; Karathanassis, I.; Koukouvinis, P.; Jahangir, S.; Poelma, C. Investigation of cavitation and vapor shedding mechanisms in a Venturi nozzle. Phys. Fluids. 2020, 32, 083306. [Google Scholar] [CrossRef]
- Fang, L.; Li, W.; Li, Q.; Wang, Z. Numerical investigation of the cavity shedding mechanism in a Venturi reactor. Int. J. Heat Mass Transf. 2020, 156, 119835. [Google Scholar] [CrossRef]
- Long, X.; Zhang, J.; Wang, J.; Xu, M.; Lyu, Q.; Ji, B. Experimental investigation of the global cavitation dynamic behavior in a Venturi tube with special emphasis on the cavity length variation. Int. J. Multiphase Flow. 2017, 89, 290–298. [Google Scholar] [CrossRef]
- Kuldeep; Saharan, V.K. Computational study of different Venturi and orifice type hydrodynamic cavitating devices. J. Hydrodyn. 2016, 28, 293–305. [Google Scholar] [CrossRef]
- Shi, H.; Li, M.; Nikrityuk, P.; Liu, Q. Experimental and numerical study of cavitation flows in Venturi tubes: From CFD to an empirical model. Chem. Eng. Sci. 2019, 207, 672–687. [Google Scholar] [CrossRef]
- Zhao, L.; Sun, L.C.; Mo, Z.Y.; Du, M.; Huang, J.; Bao, J.J.; Tang, J.G.; Xie, G. Effects of the divergent angle on bubble transportation in a rectangular Venturi channel and its performance in producing fine bubbles. Int. J. Multiphase Flow. 2019, 114, 192–206. [Google Scholar] [CrossRef]
- Kim, H.J.; Nguyen, D.X.; Bae, J.H. The performance of the sludge pretreatment system with Venturi tubes. Water Sci. Technol. 2008, 57, 131–137. [Google Scholar] [CrossRef]
- Ramisetty, K.A.; Pandit, A.B.; Gogate, P.R. Novel Approach of Producing Oil in Water Emulsion Using Hydrodynamic Cavitation Reactor. Ind. Eng. Chem. Res. 2014, 53, 16508–16515. [Google Scholar] [CrossRef]
- Maddikeri, G.L.; Gogate, P.R.; Pandit, A.B. Intensified synthesis of biodiesel using hydrodynamic cavitation reactors based on the interesterification of waste cooking oil. Fuel 2014, 237, 285–292. [Google Scholar] [CrossRef]
- Dastane, G.G.; Thakkar, H.; Shah, R.; Perala, S.; Raut, J.; Pandit, A.B. Single and multiphase CFD simulations for designing cavitating Venturi. Chem. Eng. Res. Des. 2019, 149, 1–12. [Google Scholar] [CrossRef]
- Chitsaz, H.R.; Omidkhah, M.R.; Ghobadian, B.; Ardjmand, M. Optimizing Different Angles of Venturi in Biodiesel Production Using CFD Analysis. Iran. J. Chem. Chem. Eng. 2019, 38, 285–295. [Google Scholar]
- Hwang, H.J.; Park, J.; Min, J.K. A numerical study on the flow control characteristic of a cavitating Venturi with one- and two-stage diffusers. J. Mech. Sci. Technol. 2021, 35, 1463–1472. [Google Scholar] [CrossRef]
- Ashrafizadeh, S.M.; Ghassemi, H. Experimental and numerical investigation on the performance of small-sized cavitating Venturis. Flow Meas. Instrum. 2015, 42, 6–15. [Google Scholar] [CrossRef]
- Long, X.P.; Wang, J.; Zuo, D.; Zhang, J.Q.; Ji, B. Experimental investigation of the instability of cavitation in veturi tube under different cavitation stage. J. Mech. Eng. 2018, 54, 209–215. [Google Scholar] [CrossRef] [Green Version]
- Bashir, T.A.; Soni, A.G.; Mahulkar, A.V.; Pandit, A.B. The CFD driven optimisation of a modified Venturi for cavitational activity. Can. J. Chem. Eng. 2011, 89, 1366–1375. [Google Scholar] [CrossRef]
Figure 1.
The geometry of the Venturi tube.

Figure 2.
The refinement of the Venturi tube throat.

Figure 3.
Distribution of Y plus at different inlet pressures.

Figure 4.
Absolute pressure profile of Venturi in four different mesh sizes.

Figure 5.
Comparison of experimental flow rate and simulation results.

Figure 6.
Comparison of the distribution of vapor phase between the experiment and the numerical results.
Figure 6.
Comparison of the distribution of vapor phase between the experiment and the numerical results.

Figure 7.
Absolute pressure variation along Venturi wall with different divergence lengths under varying inlet pressure: (a) 0.4 MPa, (b) 0.8 MPa, and (c) 1.2 MPa.
Figure 7.
Absolute pressure variation along Venturi wall with different divergence lengths under varying inlet pressure: (a) 0.4 MPa, (b) 0.8 MPa, and (c) 1.2 MPa.

Figure 8.
Vapor volume fraction variation in Venturi tube with different divergence lengths under varying inlet pressure: (a) 0.4 MPa, (b) 0.8 MPa, and (c) 1.2 MPa.
Figure 8.
Vapor volume fraction variation in Venturi tube with different divergence lengths under varying inlet pressure: (a) 0.4 MPa, (b) 0.8 MPa, and (c) 1.2 MPa.

Figure 9.
Vapor volume fraction contour of Venturi tubes at various inlet pressures and divergence lengths: (a) 0.4 MPa, (b) 0.8 MPa, and (c) 1.2 MPa.
Figure 9.
Vapor volume fraction contour of Venturi tubes at various inlet pressures and divergence lengths: (a) 0.4 MPa, (b) 0.8 MPa, and (c) 1.2 MPa.

Figure 10.
The variation of turbulent kinetic energy along the axis of the Venturi tube under varying pressure conditions: (a) 0.4 MPa, (b) 0.8 MPa, and (c) 1.2 MPa.
Figure 10.
The variation of turbulent kinetic energy along the axis of the Venturi tube under varying pressure conditions: (a) 0.4 MPa, (b) 0.8 MPa, and (c) 1.2 MPa.

Figure 11.
Variations of turbulence kinetic energy peaks at two locations (throat and divergence) in a Venturi tube under different pressures.
Figure 11.
Variations of turbulence kinetic energy peaks at two locations (throat and divergence) in a Venturi tube under different pressures.

Figure 12.
Absolute pressure variation along Venturi wall with different convergence lengths under varying inlet pressure: (a) 0.4 MPa, (b) 0.8 MPa, and (c) 1.2 MPa.
Figure 12.
Absolute pressure variation along Venturi wall with different convergence lengths under varying inlet pressure: (a) 0.4 MPa, (b) 0.8 MPa, and (c) 1.2 MPa.

Figure 13.
Vapor volume fraction variation in Venturi tube with different convergence lengths under varying inlet pressure: (a) 0.4 MPa, (b) 0.8 MPa, and (c) 1.2 MPa.
Figure 13.
Vapor volume fraction variation in Venturi tube with different convergence lengths under varying inlet pressure: (a) 0.4 MPa, (b) 0.8 MPa, and (c) 1.2 MPa.

Figure 14.
Vapor volume fraction contour of Venturi tubes at various inlet pressures and convergence lengths: (a) 0.4 MPa, (b) 0.8 MPa, and (c) 1.2 MPa.
Figure 14.
Vapor volume fraction contour of Venturi tubes at various inlet pressures and convergence lengths: (a) 0.4 MPa, (b) 0.8 MPa, and (c) 1.2 MPa.

Figure 15.
Variation of turbulence kinetic energy along the axis of the Venturi tube under different inlet pressures: (a) 0.4 MPa, (b) 0.8 MPa, and (c) 1.2 MPa.
Figure 15.
Variation of turbulence kinetic energy along the axis of the Venturi tube under different inlet pressures: (a) 0.4 MPa, (b) 0.8 MPa, and (c) 1.2 MPa.

Figure 16.
Variations of turbulence kinetic energy peaks at two locations (throat and diffuser) in a Venturi tube under different pressures.
Figure 16.
Variations of turbulence kinetic energy peaks at two locations (throat and diffuser) in a Venturi tube under different pressures.


Table 1.
Structural and operational parameters of Venturi model.
| Cases | Pin (MPa) | σ | LC (mm) | Din (mm) | LC/Din | Ld (mm) | Dout (mm) | Ld/Dout |
|---|---|---|---|---|---|---|---|---|
| 1 | 0.4 | 0.2595 | 48 | 50.00 | 0.960 | 140 | 39.42 | 3.55 |
| 2 | 0.2603 | 48 | 50.00 | 0.960 | 190 | 50.00 | 3.80 | |
| 3 | 0.2608 | 48 | 50.00 | 0.960 | 240 | 60.46 | 3.97 | |
| 4 | 0.2480 | 24 | 29.88 | 0.803 | 190 | 50.00 | 3.80 | |
| 5 | 0.2678 | 72 | 69.64 | 1.030 | 190 | 50.00 | 3.80 | |
| 6 | 0.8 | 0.1294 | 48 | 50.00 | 0.960 | 140 | 39.42 | 3.55 |
| 7 | 0.1298 | 48 | 50.00 | 0.960 | 190 | 50.00 | 3.80 | |
| 8 | 0.1299 | 48 | 50.00 | 0.960 | 240 | 60.46 | 3.97 | |
| 9 | 0.1236 | 24 | 29.88 | 0.803 | 190 | 50.00 | 3.80 | |
| 10 | 0.1328 | 72 | 69.64 | 1.030 | 190 | 50.00 | 3.80 | |
| 11 | 1.2 | 0.0860 | 48 | 50.00 | 0.960 | 140 | 39.42 | 3.55 |
| 12 | 0.0863 | 48 | 50.00 | 0.960 | 190 | 50.00 | 3.80 | |
| 13 | 0.0865 | 48 | 50.00 | 0.960 | 240 | 60.46 | 3.97 | |
| 14 | 0.0823 | 24 | 29.88 | 0.803 | 190 | 50.00 | 3.80 | |
| 15 | 0.0881 | 72 | 69.64 | 1.030 | 190 | 50.00 | 3.80 |
Table 2.
Boundary conditions applied to the calculation.
| Section | Boundary Conditions | Remark |
|---|---|---|
| Working fluid | - | Primary phase: water Second phase: vapor |
| Inlet | Pressure inlet | Table 1 (0.4–1.2 MPa) |
| Outlet | Pressure outlet | 0.1 MPa |
| Wall | No slip condition | The wall treatment method: standard wall functions |
| Turbulence | Intensity and hydraulic diameter | Intensity: 3% Hydraulic diameter: 50 mm |
Table 3.
Comparison of Venturi tubes’ flow field characteristics at various pressures and diffusion lengths.
Table 3.
Comparison of Venturi tubes’ flow field characteristics at various pressures and diffusion lengths.
| Cases | Pin (MPa) | σ | Ld (mm) | Q (kg·s−1) | Vt (m·s−1) | Vol (mm3) | Vapm |
|---|---|---|---|---|---|---|---|
| 1 | 0.4 | 0.2595 | 140 | 1.88831842 | 27.29931 | 17,694.4 | 0.8916025 |
| 2 | 0.2603 | 190 | 1.88298337 | 27.26803 | 18,965.5 | 0.8933302 | |
| 3 | 0.2608 | 240 | 1.88450754 | 27.23960 | 18,932.1 | 0.8932120 | |
| 6 | 0.8 | 0.1294 | 140 | 2.67930270 | 38.68253 | 106,551 | 0.9799927 |
| 7 | 0.1298 | 190 | 2.67167545 | 38.62886 | 85,491.1 | 0.9747809 | |
| 8 | 0.1299 | 240 | 2.67394078 | 38.60078 | 85,072.4 | 0.9747983 | |
| 11 | 1.2 | 0.0860 | 140 | 3.29722403 | 47.45741 | 268,358.5 | 0.9915485 |
| 12 | 0.0863 | 190 | 3.28465412 | 47.39365 | 162,272.6 | 0.9926510 | |
| 13 | 0.0865 | 240 | 3.28479553 | 47.33728 | 149,088.7 | 0.9912778 |
Vt represent the maximum velocity of the Venturi throat; Vol is the volume of the cavity in the Venturi; Vapm is the maximum vapor holdup.
Table 4.
Comparison of Venturi tubes’ flow field characteristics at various pressures and convergence lengths.
Table 4.
Comparison of Venturi tubes’ flow field characteristics at various pressures and convergence lengths.
| Cases | Pin (MPa) | σ | LC (mm) | Q (kg·s−1) | Vt (m·s−1) | Vol (mm3) | Vapm |
|---|---|---|---|---|---|---|---|
| 4 | 0.4 | 0.2480 | 24 | 1.92805647 | 28.05349 | 8058.9 | 0.9013388 |
| 2 | 0.2603 | 48 | 1.88341402 | 27.27604 | 19,173.1 | 0.8957157 | |
| 5 | 0.2678 | 72 | 1.86739731 | 26.88531 | 19,232.4 | 0.8973735 | |
| 9 | 0.8 | 0.1236 | 24 | 2.72222116 | 39.70596 | 110,433.2 | 0.9740466 |
| 7 | 0.1298 | 48 | 2.67167545 | 38.62886 | 85,491.1 | 0.9747809 | |
| 10 | 0.1328 | 72 | 2.65792438 | 38.19953 | 77,281.3 | 0.9731250 | |
| 14 | 1.2 | 0.0823 | 24 | 3.34104545 | 48.63226 | 253,014.8 | 0.9919481 |
| 12 | 0.0863 | 48 | 3.28465412 | 47.39365 | 162,272.6 | 0.9926510 | |
| 15 | 0.0881 | 72 | 3.26788526 | 46.89446 | 146,933.8 | 0.9918739 |
Vt represent the maximum velocity of the Venturi throat; Vol is the volume of the cavity in the Venturi; Vapm is the maximum vapor holdup.
Disclaimer/Publisher’s Note: The statements, opinions and data contained in all publications are solely those of the individual author(s) and contributor(s) and not of MDPI and/or the editor(s). MDPI and/or the editor(s) disclaim responsibility for any injury to people or property resulting from any ideas, methods, instructions or products referred to in the content. |
© 2023 by the authors. Licensee MDPI, Basel, Switzerland. This article is an open access article distributed under the terms and conditions of the Creative Commons Attribution (CC BY) license (https://creativecommons.org/licenses/by/4.0/).
Share and Cite
MDPI and ACS Style
Liu, Y.; Li, B. Numerical Investigation of the Cavitation Characteristics in Venturi Tubes: The Role of Converging and Diverging Sections. Appl. Sci. 2023, 13, 7476. https://0-doi-org.brum.beds.ac.uk/10.3390/app13137476
AMA Style
Liu Y, Li B. Numerical Investigation of the Cavitation Characteristics in Venturi Tubes: The Role of Converging and Diverging Sections. Applied Sciences. 2023; 13(13):7476. https://0-doi-org.brum.beds.ac.uk/10.3390/app13137476
Chicago/Turabian StyleLiu, Yi, and Bin Li. 2023. "Numerical Investigation of the Cavitation Characteristics in Venturi Tubes: The Role of Converging and Diverging Sections" Applied Sciences 13, no. 13: 7476. https://0-doi-org.brum.beds.ac.uk/10.3390/app13137476
Note that from the first issue of 2016, this journal uses article numbers instead of page numbers. See further details here.