Article

Research on the Clothing Classification of the She Ethnic Group in Different Regions Based on FPA-CNN

1
School of Fashion Design and Engineering, Zhejiang Sci-Tech University, Hangzhou 310018, China
2
Engineering Research Center of Clothing of Zhejiang Province, Zhejiang Sci-Tech University, Hangzhou 310018, China
3
Key Laboratory of Silk Culture Inheriting and Products Design Digital Technology, Ministry of Culture and Tourism, Zhejiang Sci-Tech University, Hangzhou 310018, China
*
Author to whom correspondence should be addressed.
Submission received: 10 July 2023 / Revised: 17 August 2023 / Accepted: 25 August 2023 / Published: 27 August 2023

Abstract

:
In order to achieve the effective computer recognition of the She ethnic clothing from different regions through the extraction of color features, this paper proposes a She ethnic clothing classification method based on the Flower Pollination Algorithm-optimized color feature fusion and Convolutional Neural Network (FPA-CNN). The method consists of three main steps: color feature fusion, FPA optimization, and CNN classification. In the first step, a color histogram and color moment features, which can represent regional differences in She ethnic clothing, are extracted. Subsequently, FPA is used to perform optimal weight fusion, obtaining an optimized ratio. Kernel principal component analysis is then applied to reduce the dimensionality of the fused features, and a CNN is constructed to classify the She ethnic clothing from different regions based on the reduced fused features. The results show that the FPA-CNN method can effectively classify the She ethnic clothing from different regions, achieving an average classification accuracy of 98.38%. Compared to SVM, BP, RNN, and RBF models, the proposed method improves the accuracy by 11.49%, 7.7%, 6.49%, and 3.92%, respectively. This research provides a reference and guidance for the effective recognition of clothing through the extraction of color features.

1. Introduction

The She ethnic group is a distinct minority in southeastern China, mainly distributed in five regions: Jingning, Fu’an, Luoyuan, Xiapu, and Fuding [1]. She ethnic clothing has a continuous lineage, but in different regions, it exhibits different characteristics [2]. Accordingly, it is of great significance to distinguish the clothing features and differences of the She ethnic group in different regions for the protection, inheritance, design innovation, and sustainable development of She ethnic clothing [3,4,5].
In the past, the classification of She ethnic clothing relied mainly on manual experience, which was not only time-consuming and laborious, but also highly dependent on the subjective judgment and experience of the people making the classification. With the development of computer vision technology, researchers have achieved certain research results in the objective recognition of traditional clothing using feature extraction and clothing recognition techniques.
The objective of the feature extraction always includes shape, texture, and color. Color, as one of the most important criteria for ethnic clothing recognition, can reflect the personalized information of the ethnic group well, since color features have advantages such as good stability, scale invariance, and rotational invariance in comparison with the other two features [6]. Therefore, some researchers have proposed that it is more accurate for classification results to use color features as the main criterion for clothing recognition. Xing et al. [7] used the mean-shift clustering algorithm to extract the color features of traditional clothing, achieving the color expression of traditional clothing. Liu et al. [8] described the color of fabric images using color histogram features and successfully extracted the dominant color series using a three-level weight method. Ding et al. [9] transformed color images into grayscale images and achieved the recognition of She ethnic clothing by extracting SIFT features combined with a bag-of-words approach. Zhang et al. [10] proposed an identification system based on the fusion of color-dominant series and color moment features, which achieved high accuracy using color features. Huang et al. [11] extracted the fused bundled features that represent image position and color features, while Gupta et al. [12] integrated clothing color and texture features and obtained good retrieval results using computational vector distance. Although the above studies achieved a feature fusion to some extent, the proportional combination of single features mainly relies on subjective judgment. Considering the limitation of effectively determining the weight combination, this study introduces the Flower Pollination Algorithm (FPA) to automatically optimize the parameters instead of manual intervention. Compared to other optimization algorithms, the FPA has advantages such as fewer parameters, good stability, and resistance to premature convergence, making it suitable for global and local optimization [13].
In terms of technical recognition, Nawaz et al. [14] proposed a method using Convolutional Neural Networks (CNN) based on GoogleNet’s inception for the automatic classification of traditional ethnic clothing images in Bangladesh, achieving recognition of upper garments, lower garments, and suits. Huo et al. [15] used part detection and feature fusion techniques to classify the images of 11 representative ethnic clothing styles, including Miao, Mongolian, and Korean ethnic groups. Sun et al. [16] used a multi-task neural network to extract clothing attribute features and achieved recognition for 14 ethnic groups, including Bai, Gino, and Tibetan ethnic groups. Wu et al. [17] used semantic attributes and multi-task learning to recognize 25 ethnic minority clothing groups in Yunnan, and the recognition accuracy reached 82.5~88.4%. Currently, research on clothing recognition mainly focuses on different types of clothing styles [18,19,20], such as upper garments and lower garments or clothing styles with significant differences in contours [21,22,23]. Recognizing similar styles with small differences in the same category poses a challenge. Deep learning plays a key role in computer recognition. Common classifiers include recurrent neural networks (RNNs), Convolutional Neural Networks (CNNs), and artificial neural networks (ANNs). Compared to RNNs and ANNs, CNNs have better generalization [24,25], which provides a reference for this study.
She ethnic clothing from different regions has similarities in shape and texture features, but their color features have a certain degree of discriminability. The innovation of this work lies in proposing a recognition method for She ethnic clothing based on FPA-optimized color feature fusion and a CNN. The main contributions are as follows: (1) A method for color feature fusion and dimension reduction was proposed. The extracted color histogram features and color moment features were normalized and then optimized using the Firefly Algorithm (FPA) to obtain optimal weights. To reduce the dimensionality of the input algorithm, the proposed method also employed kernel principal component analysis (PCA) to fuse high-dimensional features, thereby reducing the complexity of the system. (2) When classifying clothing from different regions of the She ethnic group, the use of receptive fields and weight-sharing techniques reduced the number of required weights and the computational burden during network training. Through supervised learning, the information retrieval capability of the classification model was further enhanced, effectively improving the classification accuracy.
To do this, we structure the rest of this paper as follows: In Section 2, we briefly summarize the research framework, and then the experimental methods (color feature extraction, fusion, dimensionality reduction, etc.) are elaborated. In Section 3, the color analysis and She ethnic clothing classification and comparison are conducted. In Section 4, we discusses the experimental results, limitations, and future works. Finally, we present some conclusions in Section 5.

2. Experiments

2.1. Experimental Procedure

In this study, we propose a She ethnic clothing recognition method based on FPA-optimized color feature fusion and a CNN to address the challenge of effectively classifying traditional clothing from different regions with similar shape and texture features. The experimental procedure consists of three major steps: color feature extraction, FPA optimization and fusion, and CNN classification, as shown in Figure 1.

2.2. Experimental Samples

A total of 370 She ethnic clothing images were selected for the experiment, including 74 samples from each of the five regions in China: Jingning, Fu’an, Luoyuan, Xiapu, and Fuding. These images were obtained from the China She Ethnic Museum, relevant monographs [26,27], and other sources. The dataset consists of images of female upper garments of the She ethnic group. The samples were divided into a training set (80%) and a test set (20%). Figure 2 shows five typical She ethnic clothing images.
The experimental software platform used was Matlab R2022a running on a Win64 system. The hardware configuration included an Intel i5 processor and 8 GB of RAM. These resources were utilized for the implementation of the experimental procedure and analysis in the subsequent sections.

2.3. Experimental Method

2.3.1. Color Feature Extraction of She Ethnic Groups in Different Regions

In order to describe the clothing information of the She ethnic group in different regions with higher accuracy, this paper proposes a method that combines color histograms and color moment features based on HSV color space to extract the color features of the She ethnic group clothing in different regions.
(1)
Color Space Quantization
The choice of color space directly affects the extraction of color features. Compared to the RGB and CMYK color space models, the HSV color space, which consists of three color channels: Hue, Saturation, and Value, is more consistent with human visual perception [28,29,30]. This separation through H, S, and V enables a better capturing of various colors in clothing, especially in the case of the vibrant and rich colors frequently used in ethnic clothing [31]. Therefore, before the extraction of color features, the images are converted from the RGB color space to the HSV color space using the conversion formulas shown in Equations (1)–(3):
H = 0 ,                                                                                                               i f   max R , G , B = min R , G , B 60 ° × G B max R , G , B min R , G , B ,                             i f   max = R   a n d   G B 60 ° × G B max R , G , B min R , G , B + 360 ° ,     i f   max = R   a n d   G < B 60 ° × B R max R , G , B min R , G , B + 120 ° ,     i f   max = G 60 ° × R G max R , G , B min R , G , B + 240 ° ,     i f   max = B
S = 0 ,                                             i f   max = 0 1 min R , G , B max R , G , B , i f   max 0
V = max R , G , B 255
where R, G, and B represent the red, green, and blue channel values, respectively, “max” and “min” represent the maximum and minimum values among R, G, and B. H belongs to the range [0°, 360°], while S and V belong to the range [0, 1].
(2)
Color Histogram Features
The distribution of pixels in the image’s H, S, and V color channels can be described using a color histogram. In order to obtain effective features of the She ethnic clothing images, this study employs a non-uniform quantization method to process the H, S, and V channels, reducing the excessive dimensionality of the feature vector and improving the efficiency of classifier construction and recognition accuracy. In the experiment, H, S, and V were non-uniformly quantized into 16, 4, and 4 channels, respectively [32]. The three color channels were converted into a one-dimensional color feature vector, as shown in Equation (4), to further reduce the feature dimensionality:
L = 16 H + 4 S + V
where L 0 , 1 , , 255 means that the quantized color space consists of 256 color feature values, and the color histogram feature vector is obtained by L 0 , L 1 , , L 255 . The extracted histogram features for different regions of She ethnic clothing are shown in Figure 3.
(3)
Color moment features
Color moments are introduced as an effective supplement to compensate for the problem of ignoring pixel position distribution in color histograms. Color information is mainly distributed in low-order moments [33]. Therefore, in the HSV color space model, the first-order moment μ i , second-order moment σ i , and third-order moment ω i are extracted from the image. The calculation formulas are shown in Equations (5)–(7). Since each pixel has three color components in HSV (Hue, Saturation, and Value), there are nine feature vectors for color moments μ H , σ H , ω H , μ S , σ S , ω S , μ V , σ V , ω V :
μ i = 1 N N j = 1 P i , j
σ i = 1 N N j = 1 P i , j μ i 2 1 2
ω i = 1 N N j = 1 P i , j μ i 3 1 3
where i represents the color channel, N represents the total number of pixels in the image, P i , j represents the pixel value of the jth pixel in the ith color channel of the color image, μ i represents the mean value of all pixels in the ith color channel, reflecting the brightness level of the image, σ i represents the standard deviation of all pixels in the ith color channel, reflecting the color distribution range of the image, and ω i represents the skewness of all pixels in the ith color channel, reflecting the symmetry of the color distribution in the image. Figure 4 shows the color moment features of the different branches of She ethnic clothing.

2.3.2. Fusion of She Ethnic Color Features in Different Regions Based on the FPA

(1)
Feature Fusion
To obtain a comprehensive representation of She ethnic clothing images, the color histograms and color moment features are normalized and fused using the FPA to optimize the fusion weights [34]. The weighted fusion of color features contains more information [35,36]. The fused feature is denoted as t and can be expressed as follows in Equation (8):
f   = accuracy c n n α t 1 + β t 2
where f represents the objective function, t 1 represents the color histogram feature (L values) obtained from Equation (4), t 2 represents the color moment feature ( μ H , σ H , ω H , μ S , σ S , ω S , μ V , σ V , ω V ), α and β are the weights, cnn is the classifier, and accuracy represents the evaluation metric for the classification results.
The FPA algorithm is utilized for optimization by updating the parameters through the fitness function. The position update is performed by comparing the current fitness value with the historical best value until the maximum number of iterations is reached. The optimal parameter combination is obtained, and the FPA model is established for feature fusion. The optimal parameters are then used in the CNN model to recognize and classify the She ethnic clothing.
(2)
Feature Dimensionality Reduction
The color features result in a 256-dimensional color histogram feature vector and a 9-dimensional color moment feature vector. Such high-dimensional data may lead to long training times and impact the recognition accuracy of the classification model. Therefore, kernel principal component analysis is employed in this study to reduce the dimensionality of the She ethnic clothing color feature vectors. This technique yields a set of low-dimensional, independent components that can explain most of the variance in the original data, effectively achieving high-dimensional data reduction [37].

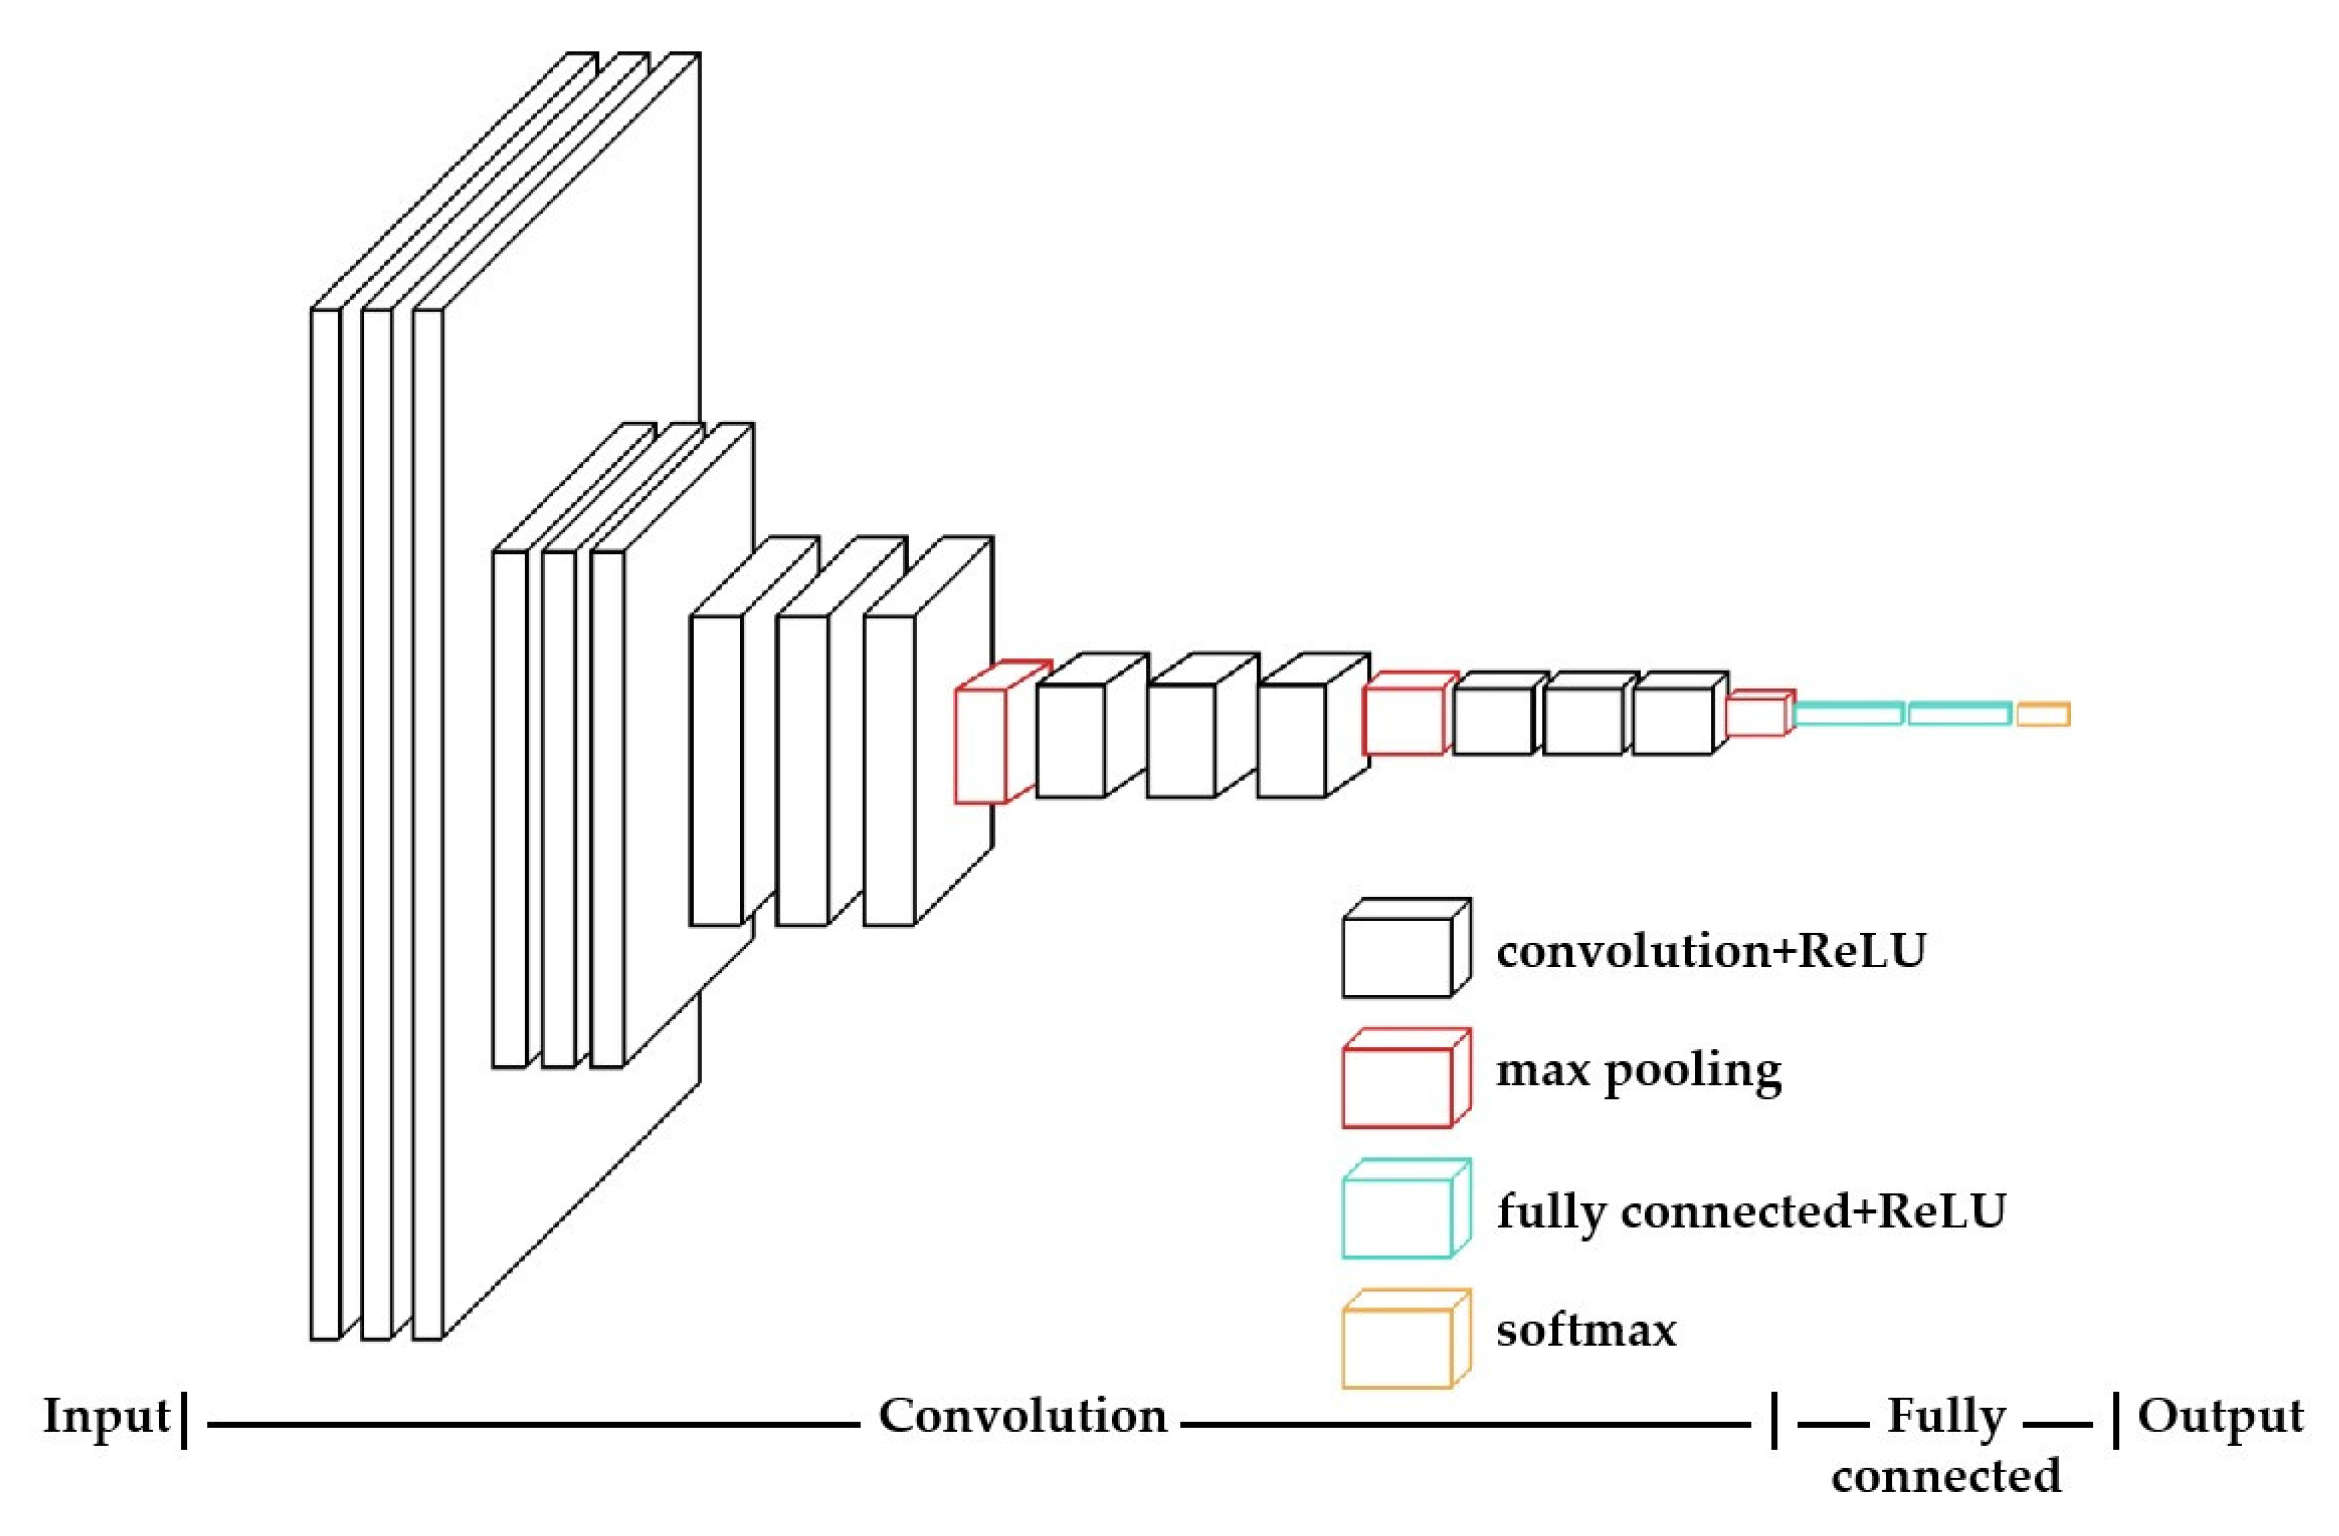
2.3.3. The Construction of the She Ethnic Clothing Classifier Based on the CNN

Considering that the She ethnic clothing images consist of repetitive local information with low complexity, traditional approaches based on shape and highly complex features are not suitable. Instead, a more in-depth local feature extraction is required. The essence of CNN image classification lies in the convolutional layers that extract local features from images and pass them to fully connected layers to obtain global features of the clothing image, thereby achieving the fine-grained classification of the clothing images. Convolutional Neural Networks (CNNs) are a type of deep neural network with a convolutional operation, and they have a deep structure [38]. In this network, the convolutional structure is used to reduce the number of network parameters and the memory usage of deeper layers. The CNN mainly consists of the following two layers.
(1)
Convolutional Layer
The convolutional layer is a hidden layer that performs convolutional operations and serves as the fundamental structure of the CNN. The function of the convolutional layer is to connect each neuron in the current layer with the neurons in the previous layer within a convolutional window. It adopts parameter sharing to allocate the same set of parameters to neurons in the same layer [39]. The convolutional process can be expressed as follows in Equation (9):
h i j k = f k i = 1 W k x i j + b k
where h i , j k represents the element at the k-th layer, the i-th row, and j-th column, W k represents the value of the input data at position (i,j), f denotes the activation function, and b k represents the bias of the convolutional kernel. The convolutional layer has two convolutional kernels and two channels, with each channel corresponding to a convolutional kernel. The activation functions used in this study are ReLU and sigmoid functions.
(2)
Pooling Layer
The pooling layer exhibits the property of local connections. Its primary function is to perform down-sampling on the data, achieve feature selection, and further prevent overfitting [40]. The pooling layer differs from the convolutional layer in that it does not have weighted coefficients, and therefore it does not require training to optimize the computation results. The general expression of the commonly used pooling method, denoted as Lp, is as follows:
A k I i , j = f x = 1 f y = 1 A k I s 0 i + x , s 0 j + y p 1 p
where s0 represents the parameters of the pooling layer and p is a predetermined parameter. When p , Lp is referred to as max pooling, which takes the maximum value within the pooling region. When p = 1, Lp calculates the average value within the pooling region and is known as average pooling.
Figure 5 shows the CNN network structure, including the five-layer convolution layer and the three-layer maximum pooling layers. Each convolutional kernel has a size of 3 × 3. The level uses ReLU as the activation function to construct a maximum pooling layer to reduce the output dimension. The convolution step size of the max pooling layer is set to 2.

3. Results and Discussion

3.1. Color Analysis of She Ethnic Clothing

To ensure the completeness of color feature extraction for She ethnic clothing, color analysis was conducted in the HSV color space using color quantization. The color distribution of the She ethnic clothing in different regions is shown in Table 1.
From Table 1, it can be seen that the color, proportion, color sequence, and color matching from different regions of She nationality are quite different. Therefore, different She ethnic clothing has its own original color information. It can also be observed that the main colors of She ethnic clothing are black and dark blue, with relatively low values of lightness. The proportions of the main colors range from 55.91% to 96.68%. The proportion of the main color in the Luoyuan region is significantly lower than that in other regions, while the Jingning region has the highest proportion, reaching 96.65%. The complementary colors of She ethnic clothing exhibit a rich and colorful palette, mainly consisting of traditional Chinese red shades (such as cheek red, crimson, and vermilion) and traditional brown shades (such as ocher, tea color, and tortoiseshell). The complementary colors form a distinct contrast in saturation and lightness with the main colors, and their proportions range from 3.35% to 44.09%. Among them, the Luo Yuan region has the richest matching colors. On the one hand, from the perspective of ethnic culture, She ethnic clothing has a strong ethnic style and ethnic characteristics. On the other hand, the She ethnic clothing in different regions also shows diversity, with variations in proportion and color schemes, which is consistent with the conclusions of [41,42]. This provides a reliable basis for the subsequent establishment of a classification model.

3.2. She Ethnic Clothing Classification Based on FPA-CNN

3.2.1. Classification Index Selection

The CNN consists of five convolutional layers and three max pooling layers. Each convolutional kernel has a size of 3 × 3. The ReLU activation function is used in the layers, and max pooling layers are constructed to reduce the output dimensions. The convolutional stride in the max pooling layers is set to 2. The evaluation metric for the experiment is image classification accuracy, which is calculated using the following Equation (11):
Accuracy = s u m Y l a b e l = y l a b e l L e n g t h y l a b e l × 100 %
where Y l a b e l represents the correctly classified samples and y l a b e l represents the samples in the test set.

3.2.2. Analysis of the She Ethnic Clothing Classification Results

Table 2 presents the classification results for the She ethnic clothing in different regions. From Table 2, it can be observed that the FPA-CNN method developed in this study achieves good recognition results for She ethnic clothing in the five regions. Among the 74 samples of She ethnic clothing, 73 are correctly classified, resulting in an overall classification accuracy of 98.65%. However, there is a case of misclassification. For instance, one item of She ethnic clothing from the Xiapu region is incorrectly classified as Fuding clothing.
There are two main reasons for the misclassification. Firstly, compared to Xia Pu clothing, Fuding clothing has two “ Red bayberry Flower” features on the collar. Xiapu clothing does not have the “Red bayberry Flower,” and the proportion of this color feature is relatively small compared to the entire item of clothing. This makes it difficult to establish effective feature differences, leading to difficulties in distinguishing clothing from these two regions and resulting in incorrect classification. Secondly, the collection of She ethnic clothing images is incomplete, which hampers the ability to fully capture the distinct features of clothing from different regions. This incomplete representation during the image collection and segmentation processes leads to feature omissions and incomplete transformation into image information. As a result, there may be similarities between the color histograms and color moment features of Fuding and Xiapu clothing, leading to the misclassification.
In summary, while the FPA-CNN method demonstrates high accuracy in classifying She ethnic clothing from different regions, there are still challenges in distinguishing certain clothing items due to subtle feature differences and incomplete image representation.

3.3. Comparative Analysis of She Ethnic Clothing Classification

3.3.1. Comparative Analysis of Parameter Optimization Methods

To address the subjectivity issue in manually determining parameter combinations, intelligent optimization algorithms are integrated into the parameter optimization process, considering the specific application scenarios. Common intelligent optimization algorithms include the Flower Pollination Algorithm (FPA) [43,44] and Particle Swarm Optimization (PSO) [45], the Bat algorithm (BA) [46], Harmony Search (HS) [47], and the Artificial Bee Colony (ABC) [48]. Compared to these algorithms, the FPA has advantages such as fewer parameters, better stability, and less susceptibility to premature convergence. The FPA also exhibits excellent global and local search capabilities, achieving high optimization efficiency [49]. The QFPA is an improved algorithm based on the FPA by Ebubekir Kaya et al. in 2022 [50].
To validate the effectiveness of the FPA, a comparison experiment was conducted on the minimum values of the second-order function using the FPA and QFPA, PSO, BA, HS, and ABC algorithms, respectively, as shown in Equation (12).
F = 20 e x p 0.2 1 2 2 i = 1 x i 2 e x p 1 2 2 i = 1 cos 2 π x i + e + 20
where F represents the objective function, which is a second-order function, xi represents the independent variables, specifically x1 and x2, and e represents the natural constant.
Algorithm 1 presents the pseudo code of the FPA; the basis of the FPA relies on both local and global pollination mechanisms. Global pollination occurs in larger areas through biotic factors; abiotic factors enable the occurrence of local pollination in more limited areas.
Algorithm 1 Pseudo code of FPA [13]
Objective min or max f X , X = x 1 , x 2 , , x d
Initialize a population of n flowers/pollen gametes with random solutions
Find the best solution g in the initial population
Define a switch probability p 0 , 1
While t < M a x G e n e r a t i o n
         for i = 1: n (all n flowers in the population)
         if rand < p,
         Draw a (d-dimensional) step vector L which obeys a Lévy distribution
            Global pollination via X i t + 1 = X i t + L g X i t
          else
            Draw ϵ from a uniform distribution in 0 , 1
            Randomly choose j and k among all the solutions
            Do local pollination via X i t + 1 = X i t + ϵ X j t X k t
end if
          Evaluate new solutions
          If new solutions are better, update them in the population
       end for
          Find the current best solution g
end while
Figure 6a shows the optimization process of the FPA, QFPA, PSO, BA, HS, and ABC algorithms. Figure 6b presents the optimization result obtained by the FPA. As shown in Figure 5a, compared with the PSO, BA, HS, and ABC algorithms, the FPA and QFPA have faster optimization speeds. Compared with the QFPA, the FPA has a slower optimization speed, but its optimization results are closer to the global optimal. After 38 iterations, the FPA finds the minimum value of 0 and maintains it throughout the remaining iterations. The optimal solution obtained with the FPA is highly accurate, with coordinates precise up to nine decimal places, indicating its ability to approximate the global minimum more effectively. Therefore, this paper adopts the FPA for She ethnic clothing color feature fusion.

3.3.2. Comparative Analysis of Feature Fusion Methods

To validate the effectiveness of the FPA color feature fusion method, this study explores the combination of color histograms and color moments by setting multiple sets of weights. The results are then compared with the results obtained from the FPA color feature fusion approach. The fused features from each set are subjected to kernel principal component analysis to construct the input set for the CNN classification model. The cumulative contribution rate of the features is approximately 95%, ensuring the objectivity and consistency of the experiments.
The testing samples were evaluated in terms of training time and classification accuracy. The results are summarized in Table 3.
According to Table 3, it can be observed that the classification accuracy of the color histogram feature is higher than that of the color moment feature when used individually. This indicates a positive correlation between the richness of information and classification accuracy. However, due to the high dimensionality of the color histogram feature, the computational complexity is high, resulting in a longer computation time, even after dimensionality reduction through the kernel principal component analysis.
In comparison with using a single feature, the fusion of multiple color features, achieved by weighting the color histograms and color moment features, effectively improves the classification accuracy for She clothing. The experiments also demonstrate that increasing the weight of the color moment feature can enhance the classification accuracy. However, when t2 reaches 0.5, the classification accuracy begins to gradually decrease. This is because, as the weight of the color histogram feature decreases, the feature information contained in the fusion of multiple color features is reduced, leading to a decrease in classification accuracy.
In this study, the FPA was used to optimize the best weight fusion, with a focus on adopting an adaptive mechanism for optimizing the color feature weights. The experimental results show that when the weights of the color histograms and color moment features are 0.645 and 0.355, respectively, the FPA color feature fusion achieves the highest classification accuracy of 97.29%, with a training time of only 13.25 s. This is because FPA color feature fusion can extract data features and obtain optimal weights for feature fusion more efficiently. Therefore, the effectiveness of the proposed FPA color feature fusion method is demonstrated, and it is adopted as the input feature for the She ethnic clothing classifier in this study.

3.3.3. Comparative Analysis of Classification Models

In order to validate the effectiveness of the classification models, this study conducted 10 classification experiments on CNN, SVM, BP, RNN, and RBF models. The test accuracy and average values obtained from these experiments are presented in Figure 7.
From Figure 7, it can be observed that, in the 10 experiments, the average classification accuracy of SVM is 86.89%. This is because the SVM model uses non-linear planes for class separation, which leads to unsatisfactory classification results for She ethnic clothing classification. Due to the presence of a large amount of redundant information in the training process, it is necessary to optimize the classifier performance by introducing deep learning networks [51]. Compared to the SVM, the classification accuracy of BP, RNN, and RBF neural network models were significantly improved, with average classification accuracy increased by 3.79%, 5%, and 7.57%, respectively. This indicates that neural networks have higher applicability in She ethnic clothing classification, especially in the fusion of color histograms and color moment features, where they exhibit better learning performance. However, the highest average classification accuracy achieved by the three aforementioned neural network models is only 94.46%.
The FPA-CNN model proposed in this paper consistently achieved the highest classification accuracy in all 10 tests, reaching a maximum of 98.65%. The average classification accuracy also reached 98.38%, showing improvements of 11.49%, 7.7%,6.49%, and 3.92% compared to the corresponding results from the SVM, BP, RNN, and RBF models, respectively. The effectiveness of the proposed method in the She ethnic clothing classification is significant. This is because, compared to traditional classification algorithms, the proposed method employs receptive fields and weight-sharing techniques, reducing the number of weights required for training the network and the associated burden. Additionally, through supervised learning, the proposed method further enhances the information acquisition capabilities of the classification model, as a result of which the classification accuracy is effectively improved.
To visually validate the effectiveness of the proposed method in She ethnic clothing feature classification, this study performed a kernel principal component analysis on the class features from the CNN, SVM, BP, RNN, and RBF classification results and simplified them into a two-dimensional plane. Based on this, comparative experiments were conducted using different classifiers, and the results are shown in Figure 8.
From Figure 8, we can see that the SVM, BP, RNN, and RBF all exhibit overlapping phenomena between two or more classes, resulting in certain classification errors. In comparison to the aforementioned classification methods, the proposed PFA-CNN method in this study demonstrates excellent performance in recognizing test samples. It achieves high classification accuracy for each category of clothing with minimal overlapping, and only a very small number of samples are incorrectly classified. Therefore, the FPA-CNN method proposed in this paper effectively classifies clothing from different regions of the She ethnic group and achieves higher classification accuracy than the SVM, BP, RNN, and RBF. This verifies that the proposed method has higher accuracy and efficiency.

3.3.4. Comparative Analysis of Classification Methods

To validate the superiority of the proposed method in this paper, we compared it with the CNN model using adaptive feature extraction. In order to ensure consistency in the classification model parameters, the experiments were conducted with the same parameters as described in Section 3.2.1, and the comparative experimental classification results are presented in Table 4.
According to Table 4, the training time for classifying She ethnic clothing using the CNN classification model is 2.07 times longer than that of the proposed method in this paper. Moreover, both the average and highest classification accuracies are lower compared to the results of the proposed method. This indicates that the utilization of the FPA and kernel principal component analysis for optimizing feature parameters effectively reduces the impact of redundant information on the recognition accuracy of the CNN, thereby significantly improving its recognition performance.

4. Discussion

The experimental section of this study primarily focuses on She ethnic clothing color extraction, clothing classification, and a comparison of classification methods. Firstly, in the color extraction phase, we unearthed the fuzzy relationship between the distribution of She ethnic groups in different regions and the combination of clothing colors. We discussed the characteristics of clothing among different branches of the She ethnic group. Secondly, this study achieved an overall classification accuracy of 98.65% by constructing a neural network discriminative model tailored to the distinctive features of She ethnic clothing. For misclassifications, these were mainly attributed to the small proportion of color features in certain patterns, preventing the formation of effective feature distinctions. Additionally, feature omissions could be present in the process of image collection and reconstruction. Finally, in the comparative experiments of clothing classification methods, the constructed model exhibited significant effectiveness in She ethnic clothing classification. This is because, compared to traditional classification algorithms, this experiment employed receptive fields and weight-sharing techniques, reducing the number of required network weights and burdens during training. Furthermore, through supervised learning, the model’s information acquisition capability was further enhanced, effectively improving classification accuracy.
The study still has certain limitations, such as a scarcity of datasets. Datasets are essential for training models, yet the existing collection of She ethnic clothing images falls short of the required quantity, which necessitates sourcing traditional clothing images from the internet or museums. The collected images also require a series of preprocessing steps before they can be used. As of now, there is no well-established standardized dataset available.
In future research, the focus will continue to be on the recognition and classification of ethnic clothing. Firstly, efforts can be directed towards improving classification accuracy. Although the FPA-CNN method proposed in this paper yielded favorable results in classifying She ethnic clothing, there is still room for improvement. Further optimization of feature extraction and classification models, such as introducing additional feature parameters, can enhance classification accuracy. Secondly, there will be an expansion of the variety of ethnic clothing types. In China, there are other precious ethnic clothing cultures that are on the verge of being forgotten, such as Tibetan and Dai ethnic clothing. The restoration and recognition of clothing images from these ethnic groups hold significant practical implications for the preservation of intangible cultural heritage.

5. Conclusions

This study focuses on the She ethnic clothing from five regions in China: Jingning, Fu’an, Luoyuan, Xiapu, and Fuding. This study extracts color histograms and color moment features and applies FPA optimization to fuse the color features. Then, using kernel principal component analysis and a CNN deep learning framework, the study classifies the She ethnic clothing from the five regions. The main conclusions are as follows:
(1) A collection of 265 color histograms and color moment feature vectors are extracted from the clothing images of the five branches of the She ethnic group, revealing the color feature distribution of each branch. Black and blue are the dominant colors in She ethnic clothing, accounting for a range of [55.91%, 96.65%], with the Jingning branch having the highest proportion. The complementary colors mainly include shades of pink and orange-red, accounting for a range of [3.35%, 44.09%], with the Luoyuan branch having the most diverse color palette.
(2) Through the FPA, the optimal weight fusion is obtained. It is found that the highest classification accuracy for the FPA color feature fusion is achieved when the weights for the color histograms and color moment features are 0.645 and 0.355, respectively, resulting in an accuracy of 97.29% with a training time of only 13.25 s.
(3) The proposed FPA-CNN model, which incorporates receptive fields and weight-sharing techniques, achieves an average classification accuracy of 98.38% for She ethnic clothing. Compared to the SVM, BP, RNN, and RBF models, the FPA-CNN model improves the accuracy by 11.49%, 7.7%, 6.49%, and 3.92%, respectively.

Author Contributions

Conceptualization, X.D. and F.Z.; methodology, X.D. and T.L.; software, X.D.; validation, X.D. and T.L.; formal analysis, X.D. and T.L.; investigation, J.C.; resources, X.D. and J.C.; writing—original draft preparation, X.D.; writing—review and editing, X.D. and T.L.; visualization, X.D. and L.M.; supervision, F.Z.; project administration, X.D. and F.Z.; funding acquisition, X.D., T.L., J.C., L.M. and F.Z. All authors have read and agreed to the published version of the manuscript.

Funding

This research was funded by the Key Laboratory of Ministry of Culture and Tourism Foundation of China (NO. 19076223-B), the Clothing Engineering Research Center of Zhejiang Province (NO. 2019FZKF08), and the Zhejiang Provincial Philosophy and Social Sciences Planning Project (NO. 22NDJC077YB).

Institutional Review Board Statement

Not applicable.

Informed Consent Statement

Not applicable.

Data Availability Statement

The data are available on request from the authors.

Acknowledgments

The authors would like to thank the anonymous reviewers for their insightful comments and constructive suggestions.

Conflicts of Interest

The authors declare no conflict of interest.

References

  1. Chen, J.Y. She’s costumes heritage context in Zhejiang and Fujian Provinces based on ethnic migration history. J. Text. Res. 2017, 38, 116–120. [Google Scholar]
  2. Yan, J.; Fan, X.R.; Chen, L.Y. Evolution causes analysis of She′s ancient costume from perspective of cultural change. J. Text. Res. 2012, 33, 111–115. [Google Scholar]
  3. Lin, H.Z. Evaluation on the Protection and Development of Intangible Cultural Heritage in She Township, Jingning from the Perspective of Ecological Civilization. Sustainability 2023, 15, 2330. [Google Scholar]
  4. Jin, Y.Z. Phoenix Nirvana—Cultural Changes of She Ethnic Group in Southwestern Zhejiang in the Context of Tourism. J. East. Asian. Stud. 2020, 20, 126–128. [Google Scholar] [CrossRef]
  5. Chen, X.M.; Bai, J.L. Application of Traditional Apparel Pattern of She Nationality in Fujian Province to the Adolescents’ Design. In Proceedings of the 10th Textile Bioengineering and Informatics Symposium, Wuhan, China, 16 May 2017. [Google Scholar]
  6. Chang, Y.; Mukai, N. Color feature based dominant color extraction. IEEE Access 2022, 10, 93055–93061. [Google Scholar] [CrossRef]
  7. Xing, L.; Zhang, J.; Liang, H.E.; Li, Z.J.; Liu, J.J. Intelligent inspection of dominant colors for Chinese traditional folk Yunjian. J. Text. Res. 2017, 38, 110–115,123. [Google Scholar]
  8. Liu, S.G.; Jiang, Y.X.; Luo, H.R. Attention-aware color theme extraction for fabric images. Text. Res. J. 2018, 88, 552–565. [Google Scholar]
  9. Ding, X.J.; Zou, C.H.; Chen, J.Y.; Zou, F.Y. Extraction and classification of She nationality clothing via visual features. Text. Res. J. 2016, 86, 1259–1269. [Google Scholar]
  10. Zhang, N.; Xiang, J.; Wang, L.; Xiong, N.; Gao, W.; Pan, R. Image retrieval of wool fabric. Part II: Based on low-level color features. Text. Res. J. 2020, 90, 797–808. [Google Scholar]
  11. Huang, D.Y.; Liu, L.; Fu, X.D.; Huang, Q.S. Clothing Retrieval via Co-segmentation and Feature Matching. J. Comput.-Aided Des. Comput. Graph. 2017, 29, 1075–1084. [Google Scholar]
  12. Gupta, M.; Bhatnagar, C.; Jalal, A.S. Clothing Image Retrieval based on Multiple Features for Smarter Shopping. In Proceedings of the 6th International Conference on Smart Computing and Communications, Kurukshetra, India, 12 July 2017. [Google Scholar]
  13. Yang, X.S. Flower Pollination Algorithm for Global Optimization. Available online: https://arxiv.org/abs/1312.5673v1 (accessed on 26 August 2023).
  14. Nawaz, M.M.T.; Hasan, R.; Hasan, M.A. Automatic categorization of traditional clothing using convolutional neural network. In Proceedings of the 2018 IEEE/ACIS 17th International Conference on Computer and Information Science, Singapore, 6–8 June 2018. [Google Scholar]
  15. Huo, P.; Wang, Y.H.; Liu, Q.J. A part-based and feature fusion method for clothing classification. In Proceedings of the Advances in Multimedia Information Processing-PCM2016: 17th Pacific-Rim Conference on Multimedia, Xi’an, China, 15 September 2016; pp. 231–241. [Google Scholar]
  16. Sun, Y.H.; Liu, Q.J. Attribute recognition from clothing using a faster R-CNN based multitask network. Int. J. Wavelets. Multi. 2018, 16, 1840009. [Google Scholar] [CrossRef]
  17. Wu, S.M.; Liu, L.; Fu, X.D.; Liu, L.J.; Huang, Q.S. Human detection and multi-task learning for minority clothing recognition. J. Imag. Graph. 2019, 24, 562–572. [Google Scholar]
  18. Gustavsson, O.; Ziegler, T.; Welle, M.C.; Butepage, J.; Varava, A.; Krafic, D. Cloth manipulation based on category classification and landmark detection. Int. J. Adv. Robot. Syst. 2022, 19, 1–17. [Google Scholar]
  19. Li, D.; Wan, X.F.; Wang, J. Clothing style recognition approach using Fourier descriptors and support vector machines. J. Text. Res. 2017, 38, 122–127. [Google Scholar]
  20. Tuo, W.; Wang, X.Y.; Gao, Y.K.; Yu, Y.Y.; Hao, X.X. Clothing style identification based on improved edge detection algorithm. J. Text. Res. 2021, 42, 157–162. [Google Scholar]
  21. Wu, H.; Ding, X.J.; Li, Q.M.; Du, L.; Zou, F.Y. Classification of women’s trousers silhouette using convolution neural network CaffeNet model. J. Text. Res. 2019, 40, 117–121. [Google Scholar]
  22. Huang, C.C.; Yuan, J.; Qin, X. Research and application of Fine-Grained image classification based on small collar dataset. Front. Comput. Neurosc. 2020, 15, 766284. [Google Scholar]
  23. Yin, G.C.; Luo, R.L. Research on Recognition and Classification of Garment Collar Type based on Convolutional Neural Network. Adv. Text. Technol. 2020, 28, 48–53. [Google Scholar]
  24. Wang, Z.J.; Turko, R.; Shaikh, O.; Park, H. CNN Explainer: Learning Convolutional Neural Networks with Interactive Visualization. IEEE T. Vis. Comput. Gr. 2021, 27, 1396–1406. [Google Scholar] [CrossRef]
  25. Alirezazadeh, P.; Dornaika, F.; Moujahid, A. Deep learning with discriminative margin loss for cross-domain consumer-to-shop clothes retrieval. Sensors 2022, 7, 2660. [Google Scholar] [CrossRef]
  26. Xia, F. Research on Patterns of She Nationality Garments, 1st ed.; Zhejiang People’s Fine Arts Publishing House: Hangzhou, China, 2017; pp. 32–129. [Google Scholar]
  27. Yan, J.; Chen, L.Y. Research on the Change and Inheritance of She Costume Culture, 1st ed.; China Textile Press: Beijing, China, 2016; pp. 24–109. [Google Scholar]
  28. Hua, J.Z.; Liu, G.H.; Song, S.X. Content-Based Image Retrieval Using Color Volume Histograms. Int. J. Pattern. Recogn. 2019, 33, 1940010. [Google Scholar] [CrossRef]
  29. Porebski, A.; Hoang, V.T.; Vandenbroucke, N.; Hamad, D. Multi-color space local binary pattern-based feature selection for texture classification. J. Electron. Imaging 2018, 1, 011010. [Google Scholar]
  30. Hung, K.C.; Lin, S.F. An Adaptive Dynamic Multi-Template Correlation Filter for Robust Object Tracking. Appl. Sci. 2022, 20, 10221. [Google Scholar] [CrossRef]
  31. Kim, E.K.; Lee, H.; YongKim, J.; Kim, B.; Kim, J.; Kim, S. Color Decision System for Ambiguous Color Boundary. In Proceedings of the 2019 International Conference on Fuzzy Theory and Its Applications (iFUZZY), New Taipei City, Taiwan, 7–10 November 2019; IEEE: Piscataway, NJ, USA, 2019; pp. 1–4. [Google Scholar]
  32. Zhang, C. Research of Obiect Tracking Algorithm based on Color Space Nonuniform Quantization and Multi-Information Fusion; Changsha University of Science and Technology: Changsha, China, 2017. [Google Scholar]
  33. Khan, U.A.; Javed, A. A hybrid CBIR system using novel local tetra angle patterns and color moment features. J. King Saud. Univ.-Com. 2022, 34, 7856–7873. [Google Scholar] [CrossRef]
  34. Bansal, J.C. Particle swarm optimization. In Evolutionary and Swarm Intelligence Algorithms; Springer: Berlin/Heidelberg, Germany, 2019; pp. 11–23. [Google Scholar]
  35. Song, W.Q.; Ding, Z.W.; Mao, B.N.; Xu, B.; Gong, H.P.; Kang, J.; Zhao, C.L. Similar Signal Recognition Method for φ-OTDR System based on Multi-Scale Feature Fusion. Chin. J. Lasers 2023. Available online: https://link.cnki.net/urlid/31.1339.TN.20230808.0917.024 (accessed on 20 June 2023).
  36. Liu, X.Y.; Li, G.; Chen, W.K.; Liu, B.H.; Chen, M.; Lu, S.L. Detection of Dense Citrus Fruits by Combining Coordinated Attention and Cross-Scale Connection with Weighted Feature Fusion. Appl. Sci. 2022, 13, 6600. [Google Scholar] [CrossRef]
  37. Shahzad, F.; Huang, Z.; Memon, W.H. Process Monitoring Using Kernel PCA and Kernel Density Estimation-Based SSGLR Method for Nonlinear Fault Detection. Appl. Sci. 2022, 12, 2981. [Google Scholar] [CrossRef]
  38. Li, Z.W.; Liu, F.; Yang, W.J.; Peng, S.H.; Zhou, J. A survey of convolutional neural networks: Analysis, applications, and prospects. IEEE Trans. Neural Netw. Learn. Syst. 2021, 33, 6999–7019. [Google Scholar] [CrossRef]
  39. Ioffe, S.; Szegedy, C. Batch normalization: Accelerating deep network training by reducing internal covariate shift. In Proceedings of the 32nd International Conference on Machine Learning, Lille, France, 1 January 2015. [Google Scholar]
  40. Zafar, A.; Aamir, M.; Mohd Nawi, N.; Arshad, A.; Riaz, S.; Alruban, A.; Dutta, A.K.; Almotairi, S. A Comparison of Pooling Methods for Convolutional Neural Networks. Appl. Sci. 2022, 12, 8643. [Google Scholar] [CrossRef]
  41. Jia, J.; Cao, J.W.; Xu, P.H.; Lin, R.B.; Sun, X.W. The color composition analysis of She costumes based on the nexus network model. J. Silk. 2022, 11, 100–107. [Google Scholar]
  42. Cao, J.W.; Jia, J.; Xu, P.H.; Lin, R.B.; Sun, X.W. Coloration association rules parsing of She nationality costumes. J. Silk. 2023, 4, 100–106. [Google Scholar]
  43. Kaya, C.B.; Kaya, E. A novel approach based to neural network and flower pollination algorithm to predict number of COVID-19 cases. Balkan J. Electr. Comput. Eng. 2021, 4, 327–336. [Google Scholar]
  44. Abdel-Basset, M.; Shawky, L.A. Flower pollination algorithm: A comprehensive review. Artif. Intell. Rev. 2019, 52, 2533–2557. [Google Scholar] [CrossRef]
  45. Jain, M.; Saihjpal, V.; Singh, N.; Singh, S.B. An Overview of Variants and Advancements of PSO Algorithm. Appl. Sci. 2022, 12, 8392. [Google Scholar] [CrossRef]
  46. Priya, S.; Kumar, K. Pradeep Mohan. Binary bat algorithm based feature selection with deep reinforcement learning technique for intrusion detection system. Soft Comput. 2023, 27, 10777–10788. [Google Scholar] [CrossRef]
  47. Saadat, J.; Moallem, P.; Koofigar, H. Training echo state neural network using harmony search algorithm. Int. J. Artif. Intell. 2017, 1, 163–179. [Google Scholar]
  48. Kaya, E.; Kaya, C.B. A novel neural network training algorithm for the identification of nonlinear static systems: Artificial bee colony algorithm based on effective scout bee stage. Symmetry 2021, 13, 419. [Google Scholar] [CrossRef]
  49. Mergos, P.E.; Yang, X.S. Flower pollination algorithm parameters tuning. Soft Comput. 2021, 25, 14429–14447. [Google Scholar] [CrossRef] [PubMed]
  50. Kaya, E. Quick flower algorithm (QFPA) and its performance on neural network training. Soft Comput. 2022, 26, 9729–9750. [Google Scholar] [CrossRef]
  51. Zhou, Z.Y.; Deng, W.X.; Wang, Y.M.; Zhu, Z.F. Classification of clothing images based on a parallel convolutional neural network and random vector functional link optimized by the grasshopper optimization algorithm. Text. Res. J. 2022, 92, 1415–1428. [Google Scholar] [CrossRef]
Figure 1. Overall proposed method.
Applsci 13 09676 g001
Figure 2. Samples for the experiment. (a) Jingning; (b) Fu’an; (c) Luoyuan; (d) Xiapu; (e) Fuding.
Applsci 13 09676 g002
Figure 3. Color histograms. (a) Jingning; (b) Fu’an; (c) Luoyuan; (d) Xiapu; (e) Fuding.
Applsci 13 09676 g003
Figure 4. Color moments. (a) Jingning; (b) Fu’an; (c) Luoyuan; (d) Xiapu; (e) Fuding.
Applsci 13 09676 g004
Figure 5. Diagram of CNN.
Applsci 13 09676 g005
Figure 6. Optimization process and results. (a) Comparison of optimization processes for FPA, QFPA, PSO, BA, HS, and ABC algorithms; (b) FPA optimization results.
Applsci 13 09676 g006
Figure 7. Classification accuracy of different models.
Applsci 13 09676 g007
Figure 8. Comparison of different classification methods and visualization. (a) SVM; (b) BP; (c) RNN; (d) RBF; (e) CNN.
Applsci 13 09676 g008
Table 1. Color analysis of the She ethnic clothing in different regions.
RegionColorΔERate/%H/S/VColorΔERate/%H/S/VColorΔERate/%H/S/VColorΔERate/%H/S/V
JingningApplsci 13 09676 i0011.596.65[207, 22, 6]Applsci 13 09676 i0022.91.20[17, 38, 81]Applsci 13 09676 i0032.31.10[6, 51, 51]Applsci 13 09676 i0041.71.05[356, 55, 69]
Fu’anApplsci 13 09676 i0051.796.43[45, 49, 5]Applsci 13 09676 i0062.31.36[0, 71, 66]Applsci 13 09676 i0074.51.31[7, 45, 61]Applsci 13 09676 i0081.80.90[4, 59, 35]
LuoyuanApplsci 13 09676 i0090.555.91[239, 46, 1]Applsci 13 09676 i0103.910.76[0, 50, 88]Applsci 13 09676 i0113.48.79[358, 35, 91]Applsci 13 09676 i0123.26.79[10, 17, 88]
Applsci 13 09676 i0131.35.41[21, 13, 67]Applsci 13 09676 i0143.24.59[55, 44, 84]Applsci 13 09676 i0152.54.16[9, 75, 78]Applsci 13 09676 i0163.03.59[24, 54, 85]
XiapuApplsci 13 09676 i0172.094.23[69, 66, 3]Applsci 13 09676 i0181.82.31[8, 66, 56]Applsci 13 09676 i0192.91.82[16, 49, 57]Applsci 13 09676 i0204.00.83[230, 68, 24]
Applsci 13 09676 i0211.10.81[12, 57, 41]
FudingApplsci 13 09676 i0220.687.66[3, 71, 1]Applsci 13 09676 i0232.54.13[2, 79, 72]Applsci 13 09676 i0241.23.24[0, 84, 53]Applsci 13 09676 i0252.71.90[338, 86, 67]
Applsci 13 09676 i0263.41.76[358, 70, 32]Applsci 13 09676 i0273.11.31[5, 56, 62]
Table 2. Clothing classification of the different branches of the She ethnic group.
CategoryJingningFu’anLuoyuanXiapuFudingClassification Accuracy/%
Jingning120000100
Fu’an013000100
Luoyuan001400100
Xiapu00020193.75
Fuding000014100
Table 3. Comparison of classification effects of different features.
Color FeatureMethodTraining Time/sClassification Accuracy/%
Single-color featuret124.5686.49
t222.3781.08
Multi-color feature fusiont1 + t223.4587.83
0.9 × t1 + 0.1 × t221.6989.19
0.8 × t1 + 0.2 × t221.4290.54
0.7 × t1 + 0.3 × t221.3993.24
0.6 × t1 + 0.4 × t222.0794.59
0.5 × t1 + 0.5 × t221.5991.89
0.4 × t1 + 0.6 × t 222.1790.54
0.3 × t1 + 0.7 × t222.4986.48
0.2 × t1 + 0.8 × t221.6583.78
0.1 × t1 + 0.9 × t221.8982.43
Proposed method13.2597.29
Table 4. Comparison of different methods of classification.
MethodsTraining Time/sAverage Classification Accuracy/%Highest Classification Accuracy/%
CNN25.1491.9493.24
Proposed method12.1598.3898.65
Disclaimer/Publisher’s Note: The statements, opinions and data contained in all publications are solely those of the individual author(s) and contributor(s) and not of MDPI and/or the editor(s). MDPI and/or the editor(s) disclaim responsibility for any injury to people or property resulting from any ideas, methods, instructions or products referred to in the content.

