1. Introduction
The inspection of a human heart on a regular basis is critical aiding in the diagnosis and treatment of a wide range of heart-related conditions, such as coronary artery disease, arrhythmias, heart valve disease, and congenital heart defects. In addition, along with the examination of the heart’s structure, function, and blood flow, healthcare professionals can potentially identify abnormalities and malfunctions of the heart, as well as develop appropriate treatment plans. Furthermore, the examination of the heart is necessary for monitoring the progress of heart-related conditions and for evaluating the effectiveness of the treatment. Concerning medical and clinical research, the investigation of a human heart using cutting edge technologies is essential for understanding how the heart operates and for developing new treatments, therapies, and surgical strategies for heart-related conditions. More specifically, in recent years, researchers and clinicians have utilized advanced imaging techniques to study the heart’s anatomy and function [
1] and computational simulations to study the hemodynamics of blood flow through the heart [
2]. Moreover, artificial intelligence (AI) algorithms are applied to analyze large amounts of patient data, making more accurate predictions of disease progression, treatment outcomes, and complications [
3]. Finally, additive manufacturing (AM) procedures are employed to construct identical models of human hearts [
4].
VR technology can be employed in cardiology to simulate the human heart in an interactive and immersive manner. Hereupon, healthcare professionals and medical students can experience a detailed and realistic representation of the heart, allowing for an enhanced understanding of its structure and function [
5]. The main idea is to use medical imaging data, such as magnetic resonance imaging (MRI) or computed tomography (CT) scans, to create 3D models of the heart that can be imported into a virtual environment. Once inside the virtual environment, the users can interact with the heart model in various ways, such as zooming in on specific areas, rotating the heart to view it from different angles, as well as highlighting different structures of interest. The VR software can also provide additional information about the heart, such as its blood flow, the different parts of the heart, and how it functions [
6]. Furthermore, VR technology can also be applied in medical training to simulate demanding surgeries in such a way that medical students and healthcare professionals could practice in a safe and controlled environment improving that way their skills reducing the risk of errors during real-life procedures.
Computational fluid dynamics (CFD) composes a powerful analysis tool that can be used to evaluate the flow of blood in the human heart with the aid of numerical simulations, providing valuable insights into the hemodynamics of the heart, such as blood pressure, flow rates, and velocity profiles. In particular, CFD simulations can be applied to study the progression and development of cardiovascular diseases, such as aneurysms and atherosclerosis [
7]. Through analyzing the flow patterns in the heart, researchers can identify areas of high shear stress and turbulence, which can lead to the formation of plaque and other disease-related conditions. Another sector in which these numerical analyses are utilized is in the design and optimization of medical devices, such as heart valves and stents, where the developed CFD models are capable of identifying potential blockages or turbulences in the heart. Moreover, CFD simulations are considered prior to cardiovascular operations in order to enhance the surgical strategy in coronary artery bypass surgery and heart transplant cases [
8].
One of the most promising technologies that have been employed in recent years in the inspection of cardiovascular diseases is the AM process, which is used to create a highly detailed and accurate physical replica of a human heart [
9,
10]. AM procedures utilize a layer-by-layer approach to construct objects from digital designs; hence, a 3D model of the heart can be fabricated in order to accurately represent its shape, size, and structure. It must be noted that certain AM technologies can provide the ability to construct 3D models with tissue-like materials [
11,
12]. These physical 3D-printed models could be a valuable educational tool for medical students and healthcare professionals, allowing them to examine the heart in greater detail and gain a better understanding of its anatomy and function [
13]. However, certain challenges such as the quality of the medical imaging data derived from MRI or CT scanning procedures, as well as the duration and the expertise that is necessary for the 3D modeling of patient-specific hearts, need to be addressed.
The objective of the present study is the development of novel technological tools based on cutting-edge applied sciences such as 3D modeling, VR, numerical simulation, and the additive manufacturing of complex cardiac models. In particular, the novelty of the present research can be summarized in the next remarks:
The 3D modeling of patient–specific human hearts using a robust and fast 3D reconstruction and segmentation tool that does not require the purchase of dedicated software packages or special training on its operation;
The development of a sophisticated virtual reality environment that provides the necessary technological assets in order to inspect a human heart, providing a unique and valuable learning experience for healthcare professionals, medical students, and patients;
The visualization of complex simulations for professional clinicians, which can be a valuable tool in studying the hemodynamics of the human heart, designing medical devices, or even planning surgical procedures in the developed VR environment;
The fabrication of additively manufactured human hearts utilizing heart-like materials in order to produce a detailed replica of the real one, highlighting potential heart defects or allowing scientists and doctors to study the structure as well as the function of the heart in greater detail.
2. Materials and Methods
In the first step of the proposed methodology, the automatic reconstruction of the heart’s 3D model is conducted considering medical data that are based on the Digital Imaging and Communications in Medicine (DICOM) protocol [
14]. These data are obtained directly from CT scans and contain 2D information about the examined clinical case. In addition, clustering algorithms like spectral graphs [
15] and k-means [
16] are utilized to segment the major parts of a human heart. With the aid of the reconstructed and segmented patient-specific 3D model of the heart, clinicians can diagnose potential defects. The next section is associated with the applied methodologies of developing numerical approaches investigating the hemodynamics of the examined CoA case, applying CFD models as well as presenting the VR environment where several tools can aid the clinician in establishing optimal pre-operative strategies. Furthermore, a patient-specific physical model was 3D-printed, applying an opaque resin that possesses mechanical properties similar to the actual cardiac muscle tissue [
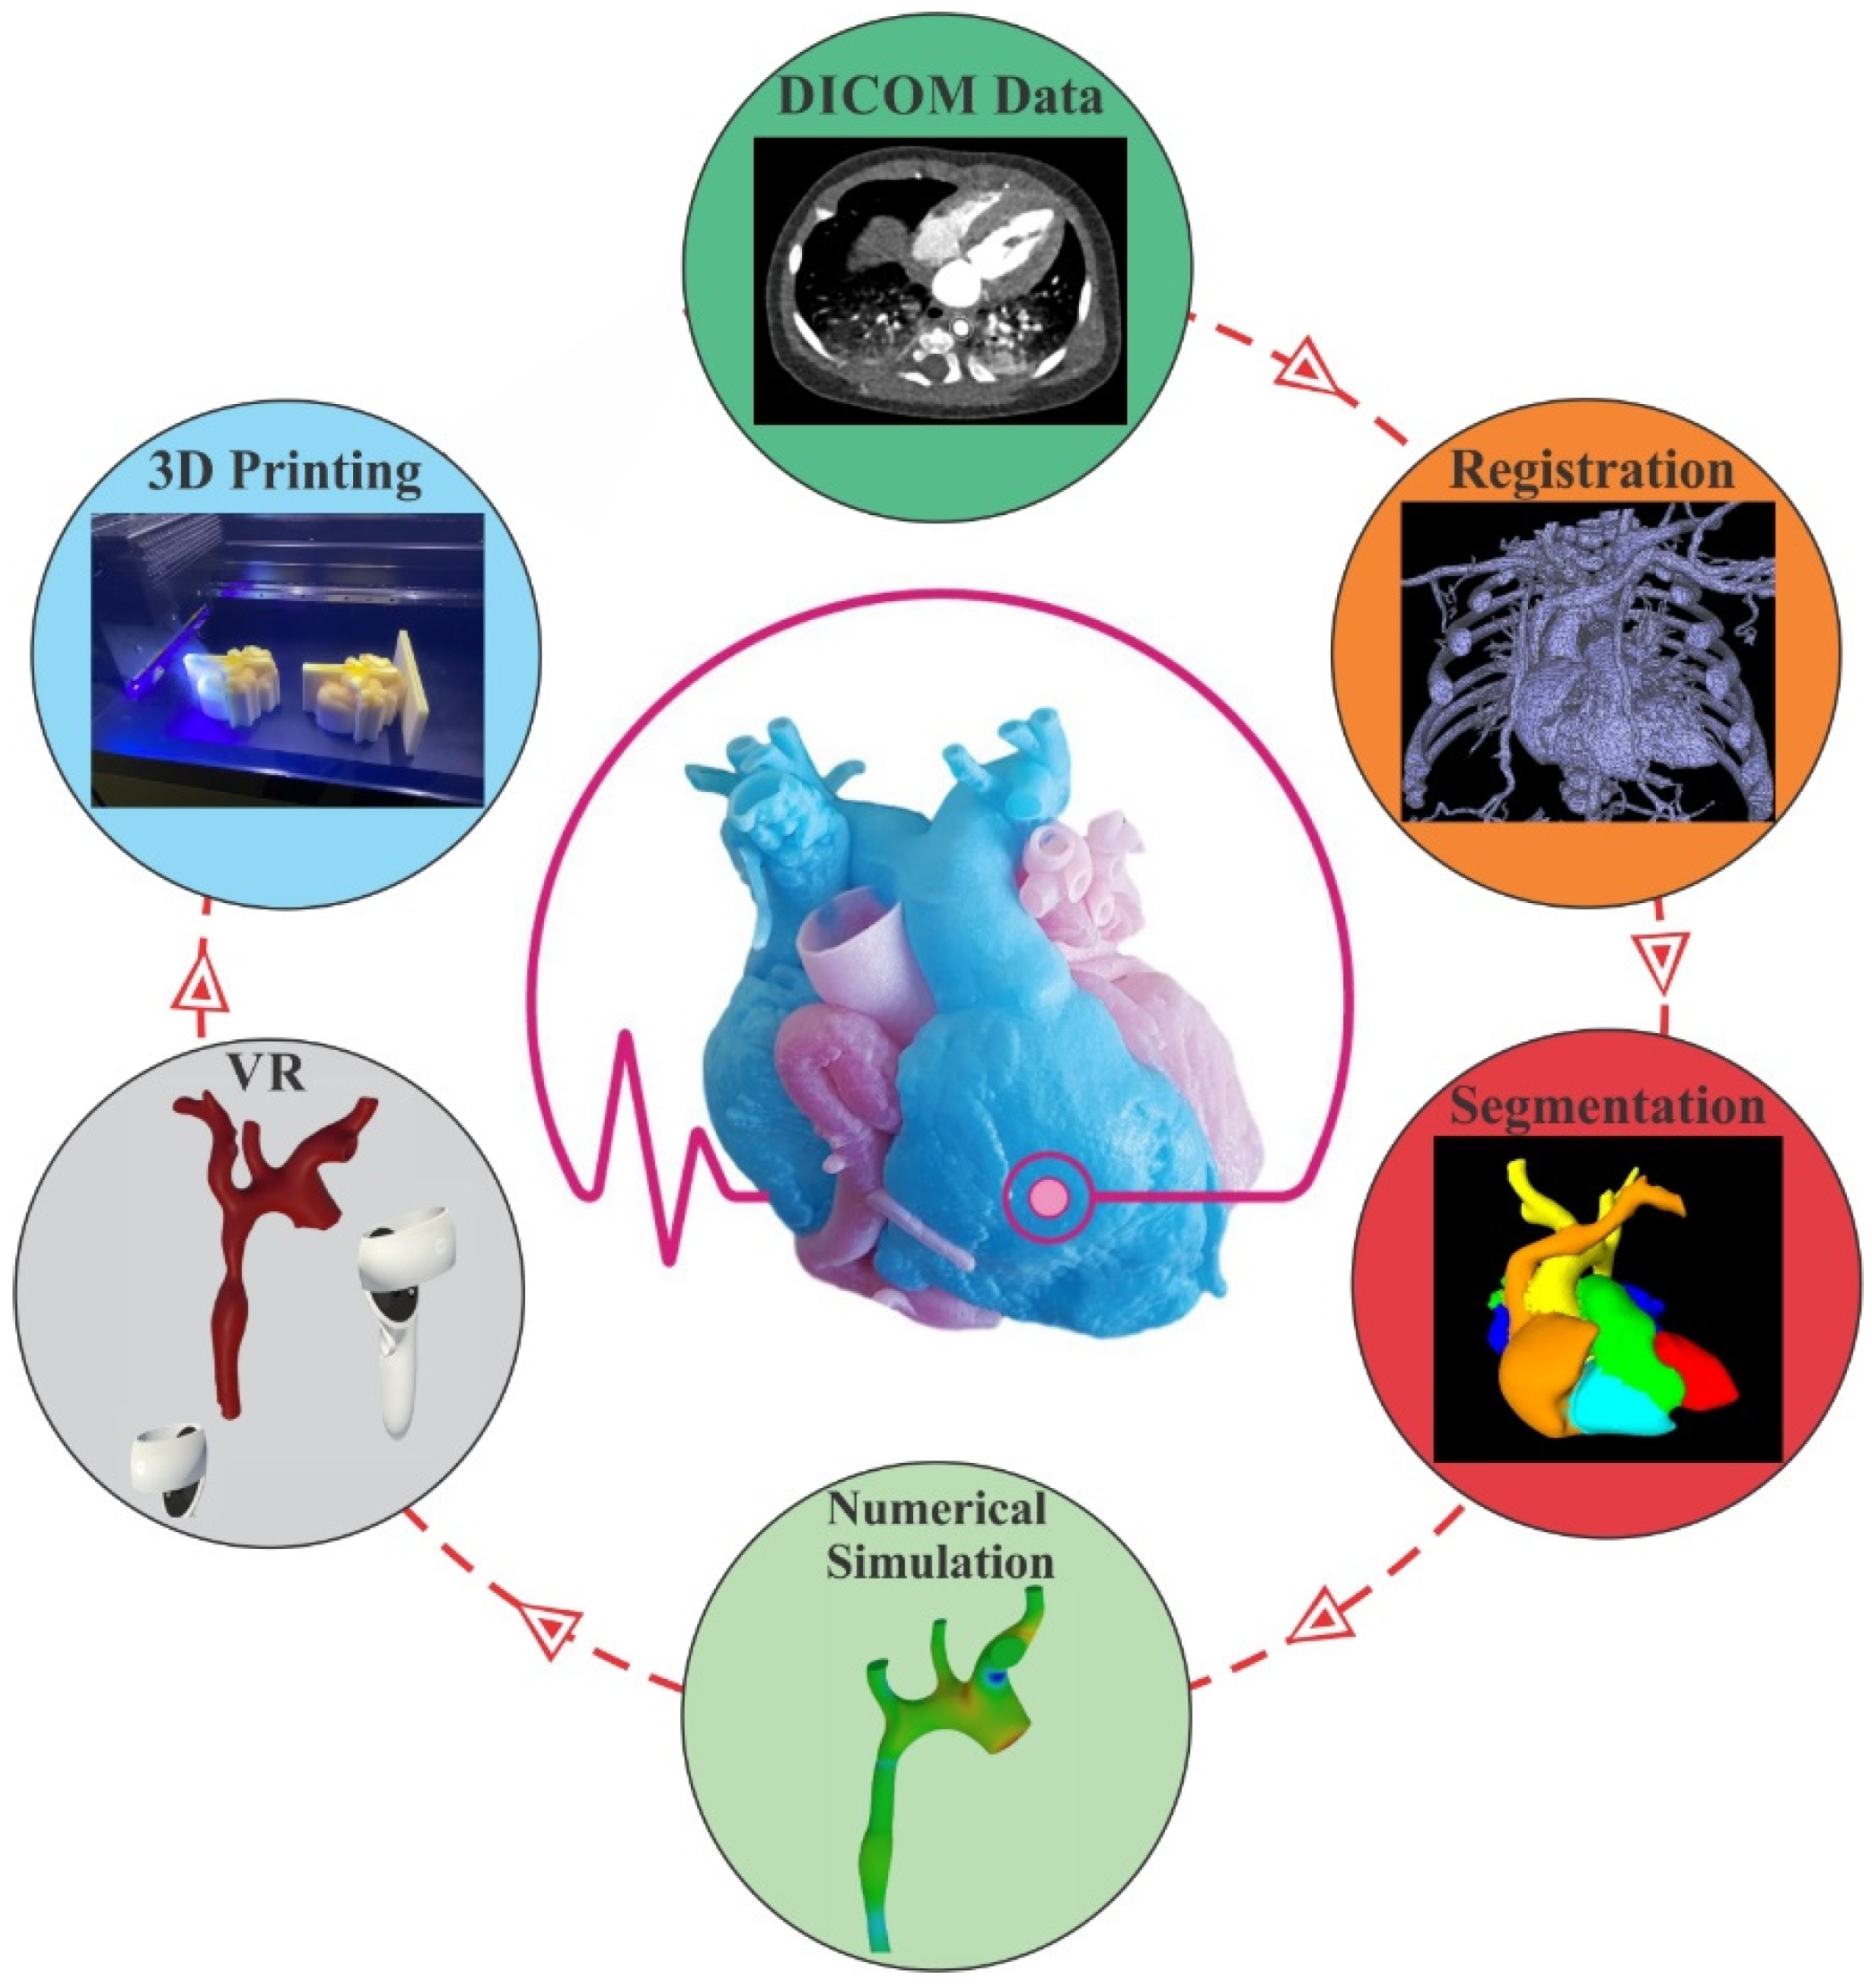
11]. The results of the introduced study highlight the uniform blood flow distribution and velocity profile in the narrowed region of the heart. Moreover, various tools, such as manipulating the 3D model of the heart, making sections, measuring distances, as well as integrating medical devices like mechanical valves in the VR environment are also documented. In addition, the dimensional accuracy of the AM process was evaluated via the employment of a 3D structural laser scanner that scanned the 3D-printed aorta and correlated it with the corresponding 3D digital model. Finally, the main conclusions of the study and some prospects for future research are outlined. The applied workflow concerning the present research paper is illustrated in
Figure 1.
2.1. Data Pre-Processing
The first step of the employed methodology is to analyze the input data stored in the DICOM format, which were collected from CT scans and utilized to model the investigated human heart. The DICOM protocol represents medical data in a specific format that are concentrated mainly in medical imaging and also contains certain metadata that are useful to compute the Hounsfield Unit (HU). The HU constitutes a relative quantitative metric of radiodensity that is implemented by radiologists and clinicians in order to enhance their interpretation of the outcome of the CT scan process [
17]. In particular, the attenuation–absorption of radiation within tissue during the CT procedure is used to create grayscale images with the aid of certain DICOM metadata, where the conversation of raw pixel data to the Hounsfield scale is feasible. In general, dense tissue absorbs significant X-rays representing brighter areas, whereas less-dense tissues lead to dark regions in the image. Considering the abovementioned information, a particular set of data could be extracted, such as bones, in situations where the proper threshold is selected.
Figure 1.
Workflow of the research study.
Figure 1.
Workflow of the research study.
2.1.1. CT Scan Reconstruction
The marching cubes algorithm was applied in the present research study; it consists in a computational method utilized to create 3D surface representations of complex data, such as medical images [
18,
19]. In the first phase of the algorithm, the space that is specified by the DICOM data is converted into a grid of voxels, which consists of 3D pixels representing the values of grayscale at each location. It must be noted that the proper selection of the intensity range of HU is essential since diverse tissues and structures in the human body possess different densities and therefore different ranges of HU. The core objective of the methodology is the determination of a potential surface that belongs to the 3D model (bone, organ, etc.) in each of these investigated voxels, taking into account an intensity range of values that are related to the gray tone of the examined voxel’s vertices. This stage could be illustrated via a marching of a theoretical cube into a scalar field, in which the absence or presence of a boundary surface in each vertex of the cube is categorized in one of the potential generated surface polygons [
18]. This process is terminated after the investigation of the whole examined scalar field (all the voxels of the scene); hence, a 3D model is constructed with a polygonal approximation of the generated surfaces through connecting the vertices of all the traversed cubes. The employed methodology is schematically illustrated in
Figure 2a, where the main functions of the automatic 3D reconstruction module considering DICOM data as input are displayed.
In the next phase, filtering methods are utilized in the generated 3D mesh, enabling the removal of parts that do not belong to the investigated heart model. In the present case, several bones that are not directly attached to the heart, like the scapula, clavicle, sternum, as well as spine bones, were removed from the scene using the open3d library [
20]. In particular, a function that clusters connected triangles was applied, i.e., triangles that are connected via edges are assigned the same cluster index in order to remove small parts that are produced and should be removed from the scene. Moreover, a reference 3D model of a heart was aligned with the examined one using the Iterative Closest Point (ICP) algorithm, which can be applied in order to minimize the differences between two point clouds [
21]. Hereupon, parts of the reconstructed model that possessed a certain distance to the reference were removed from the 3D model of the heart. In addition, algorithms concerning the removal of outliers and noise were also applied in order to isolate the examined heart. Finally, the extracted mesh was further edited with processes like hole-filling, smoothing, etc., in order to secure the correctness and continuity of the meshes. The generation of the 3D mesh as well as the influence of the filtering methods in the captured scene, coupled with the final outcome of the employed methodology, are demonstrated in
Figure 2b.
2.1.2. Human Heart Segmentation
The next step of the developed methodology is the segmentation of the human heart, which poses a challenging task due to its complex shape and variability [
22]. However, the accurate segmentation of the heart is critical for many clinical applications such as planning for cardiac interventions and treatments, the quantification of cardiac function, and the diagnosis of various cardiac diseases. Human heart segmentation refers to the process of identifying and separating the main regions of the heart. In the present study, the spectral clustering algorithm was considered [
23] to cluster six main parts of the heart such as the aorta, the right/left atrium, the right/left ventricle, and the pulmonary artery. In the first step of the segmentation process, an adjacency map is constructed, reading all the vertices and the faces of the reconstructed heart 3D model that was determined in the previous paragraph. Hereupon, knowing all the connected edges of the 3D point cloud of the reconstructed heart, a distance matrix is developed that takes into account the geodesic as well as the angular distance between all the adjacent faces of the model. In the next phase, the affinity matrix A is established, determining how similar or close two points are in the 3D space, and is defined as [
24]:
where
d (
si,
sj) is a distance metric mentioned earlier,
σ composes a scale parameter selected manually, and
S is a set of points
S = {
s1,
s2, …,
sn} that need to be clustered into
k (six in the examined case) subsets. If
A[
i][
j] = 0, this means that the vertices
si and
sj are not connected via an edge. The subsequent step is the definition of the diagonal degree matrix
D as in [
25] and the construction of the Laplacian
L (Equation (2)):
The methodology of the spectral clustering algorithm suggests the computation of the first k eigenvectors
u1,
u2, …,
uk of the Laplacian
L as well as the creation of the matrix
U = [
u1,
u2, …,
uk], redefining the input space as a k-dimensional space [
25]. It must be noted that the eigenvectors are ordered according to their corresponding eigenvalues. Finally, the clustering of this subspace can be accomplished via the utilization of a standard clustering technique like the k-means algorithm, producing
k clusters for the investigated human heart.
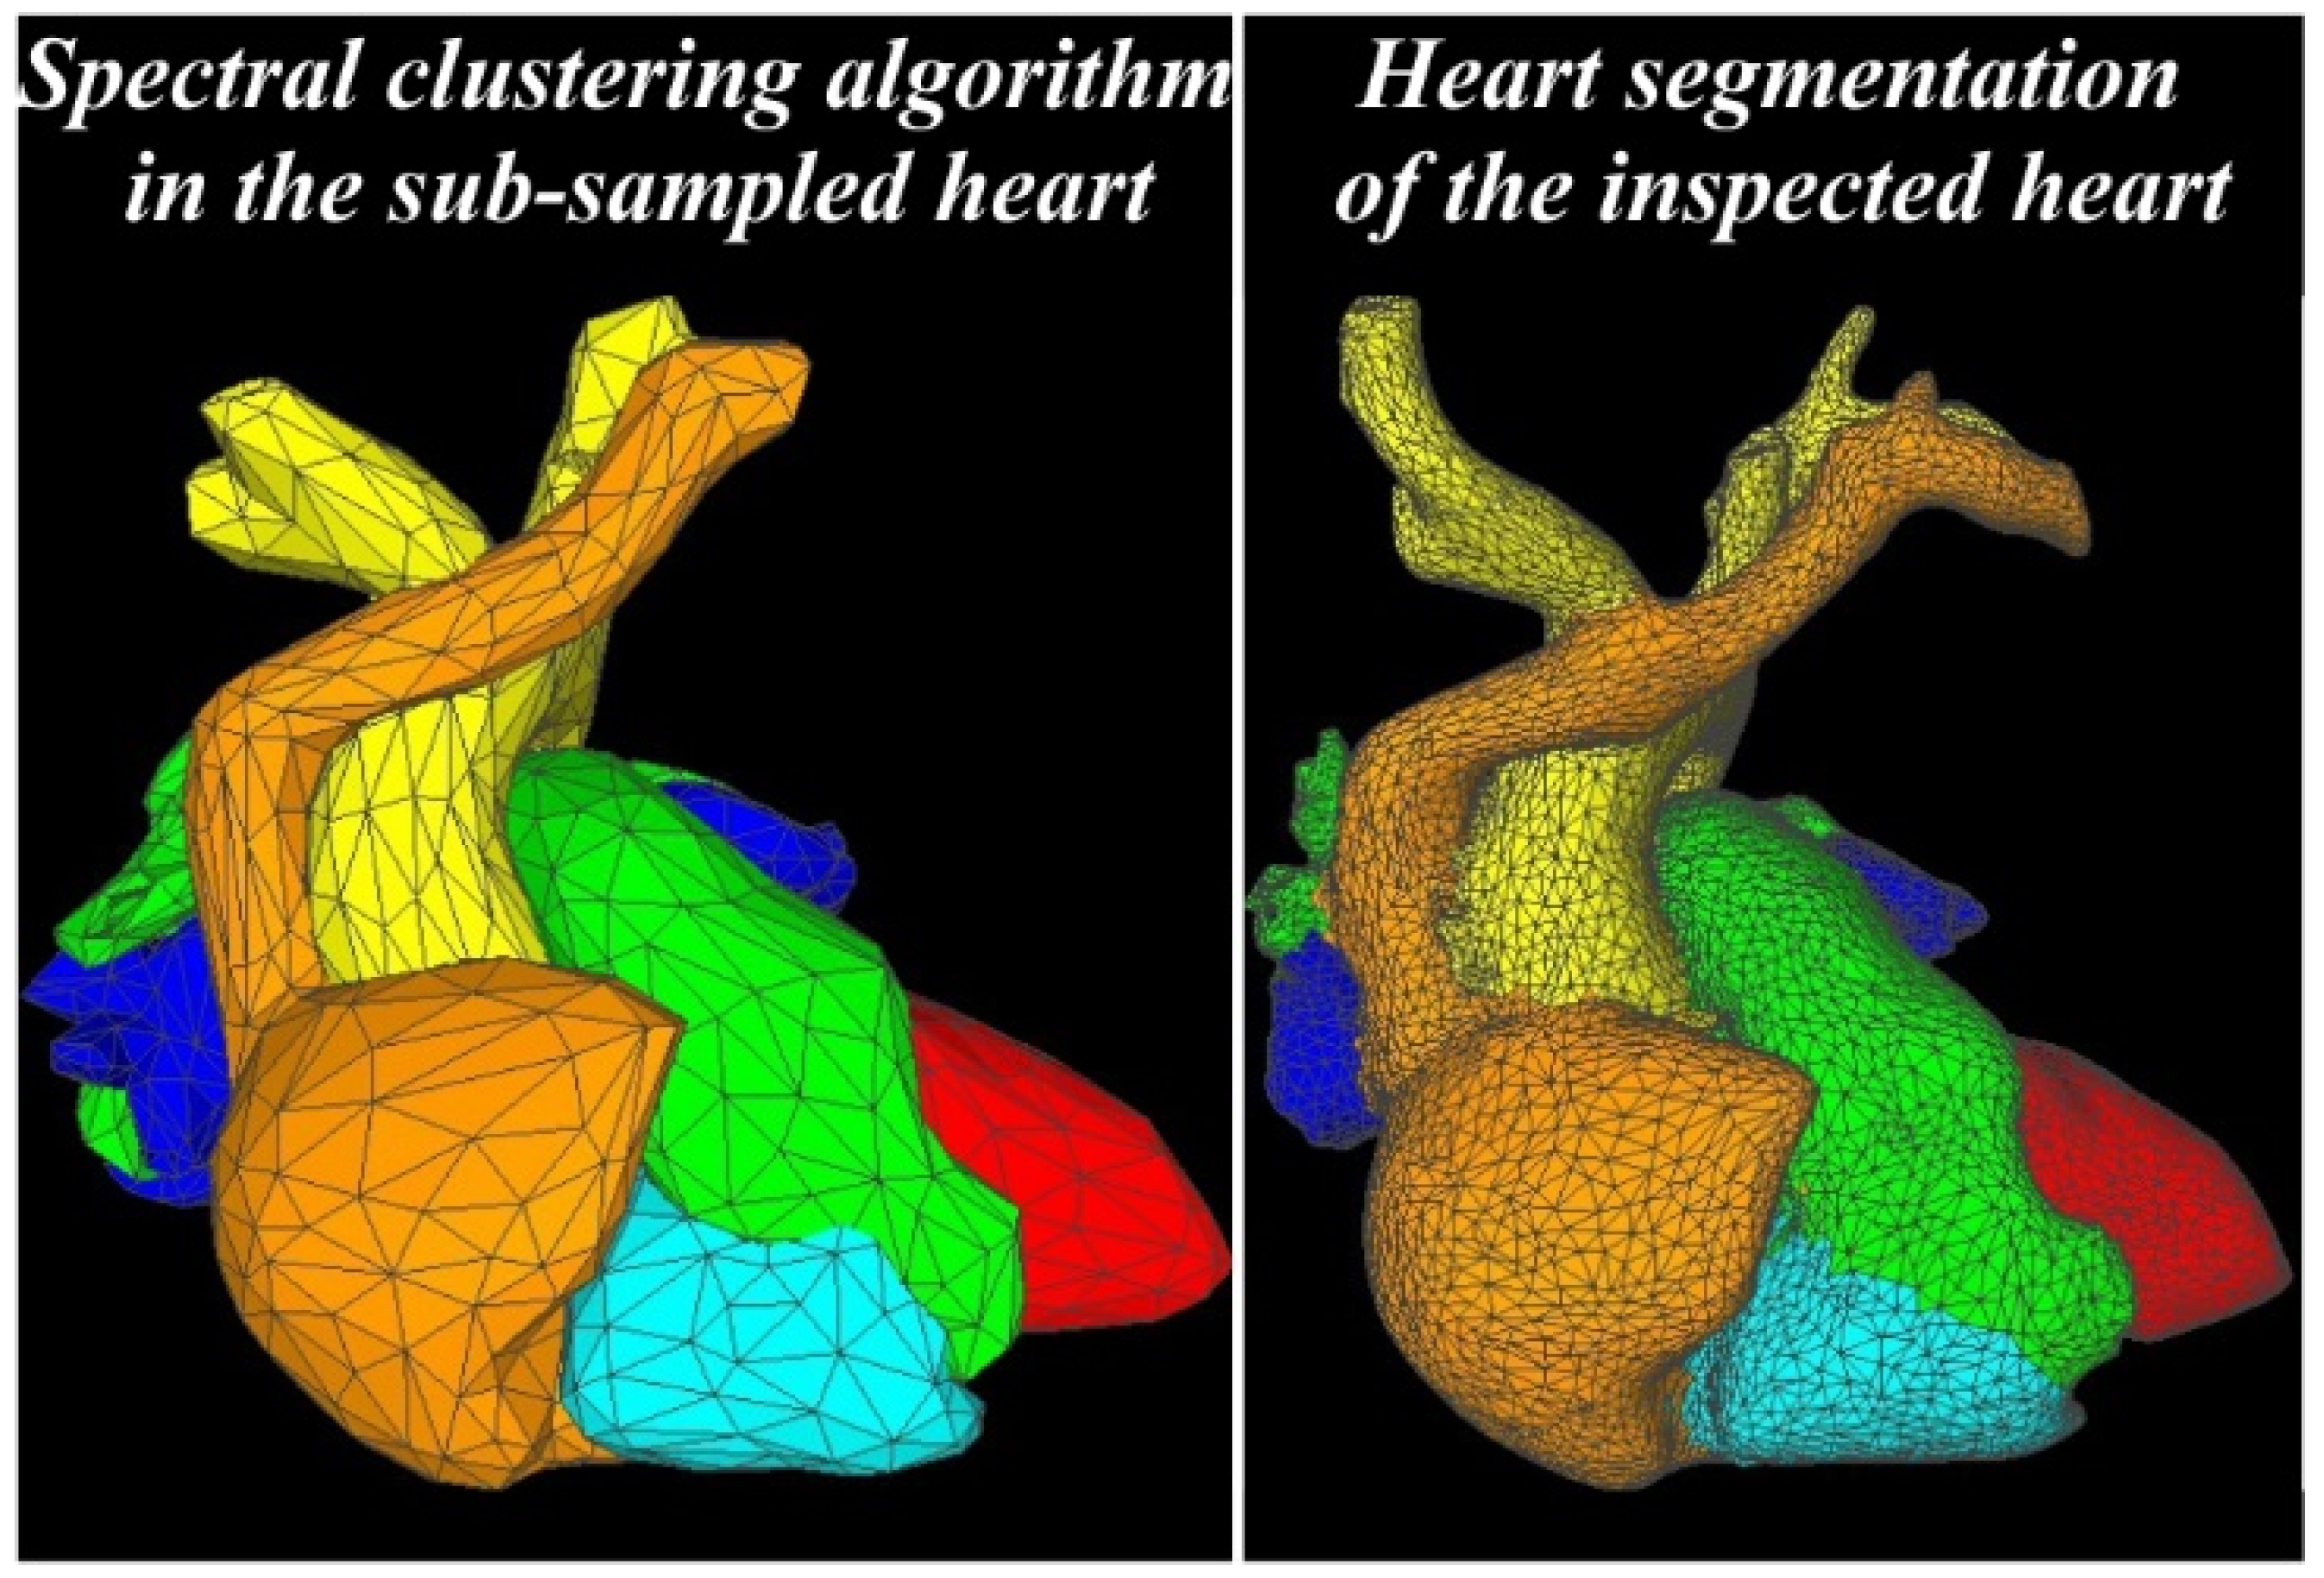
Results of the employed methodology are displayed in
Figure 3, wherein the left part a subsampled model of the reconstructed model of the heart is displayed. Due to computational time, the spectral clustering algorithm is first executed on a subsampled 3D model. Nevertheless, the segmentation of the full-heart reconstructed 3D model was also conducted via the iteration of each vertex and its calculation to the closest vertex of the subsampled model, thus reducing the computational time. Finally, depending on the cluster of the closest vertex, the corresponding vertex of the dense 3D model was assigned to a similar cluster. Even though the vertices that are located close to the borders of the clusters can potentially be placed in the wrong part of the heart, the gain in the computation time compensated the restricted number of misplaced vertices. It should be noted that manual post-processing of the segmented 3D model could lead to an ideal representation of the examined heart, repairing potential imperfections of the reconstructed heart, as shown in the next paragraphs.
In the left part of
Figure 4, the examined segmented aorta is illustrated as it was derived from the clustering process, exhibiting a typical case of coarctation of the aorta (CoA). CoA is a relatively common birth defect that accounts for 6–8% of all congenital heart defects, presenting a narrower aorta than the usual [
26]. In situations where the narrowing is very severe, that could lead to congestive heart failure or insufficient blood flow to the organs of the body [
27]. Hereupon, the diagnosis of such defects should be accurate in a timely manner in order for the patient to possess the expected opportunity for a positive health outcome, taking into account that clinical decision-making will be tailored to a correct awareness of the patient-specific health issue [
28]. It should be noted that the extracted model of the aorta was post-processed using the open-source software Meshmixer v3.5 in order to repair and finish the reconstructed model via its inspection tools like hole detection, disconnected components, and non-manifold areas. The outcome of this process is demonstrated in the right part of
Figure 4 exhibiting the 3D model of the Aorta that was considered in the upcoming numerical investigations.
2.2. Applied Methodology
2.2.1. Numerical Model
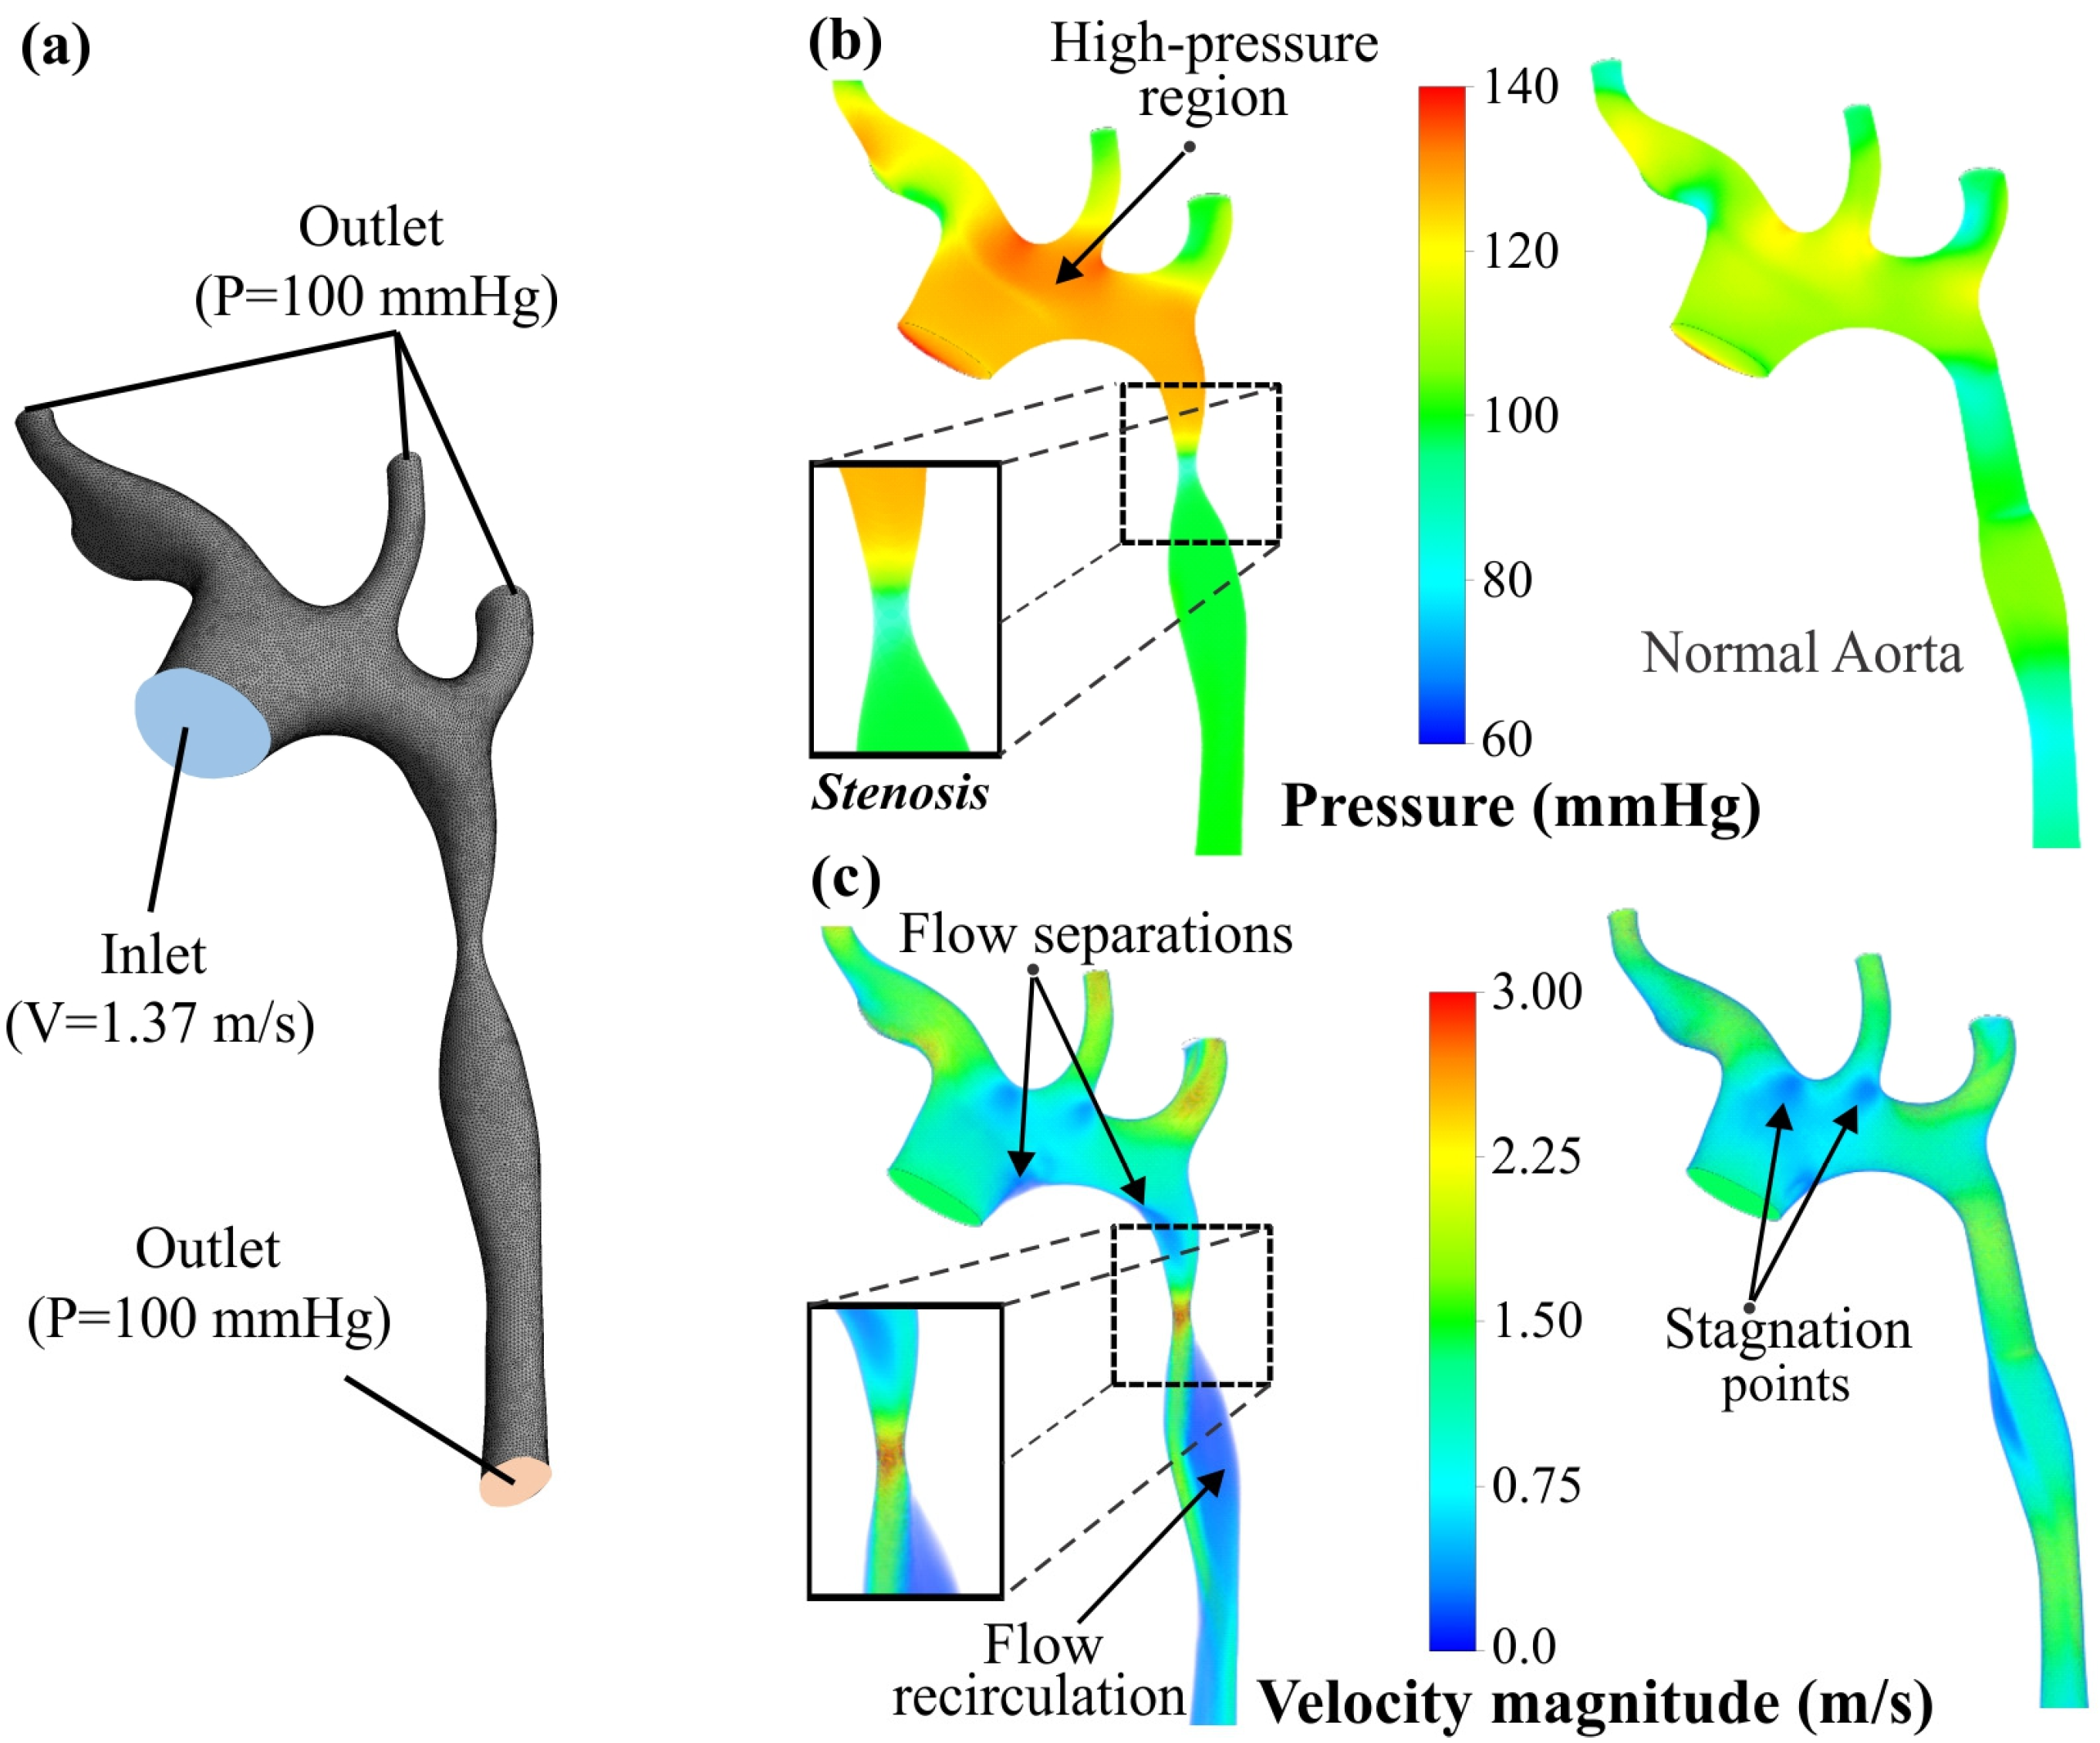
Along with the observation of the CoA on the reconstructed 3D model, a numerical evaluation of the influence of this defect in the bloodstream was investigated. For this reason, CFD analyses were performed, utilizing the ANSYS™ Fluent module, in order to extract the pressure and velocity contours that quantify the blood flow in the cardiovascular system of the examined patient. In the context of this study, two different CFD analyses were conducted; the first one takes into account the reconstructed 3D model with the CoA, and in the second case, the examined aorta was modified through eliminating the defect and normalizing the aorta’s walls correspondingly with the surfaces before and after the defect. It is worth noting that the internal volumes were used as control volumes for the bloodstream.
Taking into account the existing literature [
29], the conditions concerning the bloodstream inside the aorta were selected with the following assumptions. First, the blood was assumed to be an incompressible Newtonian fluid with a constant density (
ρ) of 1060 kg/m
3 and a constant viscosity (
μ) of 0.004 Pa∙s (4 cP) [
30,
31]. Furthermore, the boundary conditions regarding the arterial walls were set as stationary and rigid, with their elasticity and thickness set to be negligible. Regarding the initial boundary conditions, the inlet of the blood stream was applied on the ascending aorta with an initial velocity of 1.37 m/s, which is the mean blood velocity for an aorta according to published studies [
32]. In addition, at the outlets, the initial pressure gauge (vessels and descending aorta) was evaluated at 100 mmHg (13,332 Pa) [
33]. The ANSYS solver employed the Navier–Stokes formulation for the conservation of momentum of an incompressible flow in the three dimensions (
R3), as it is listed below [
31], where
u represents the velocity,
p is the pressure,
t is the time, and
μ is the viscosity.
Furthermore, the
k-ε turbulence model was utilized for the turbulence flow simulation, where
k is the turbulence kinetic energy,
ε represents the rate of dissipation,
μt is the turbulence (known as eddy) viscosity,
Gk represents the generation of turbulence kinetic energy due to the mean velocity gradients,
Gb is the generation of turbulence kinetic energy due to buoyancy, and
YM represents the contribution of the fluctuating dilatation in compressible turbulence to the overall dissipation rate. Furthermore, the flow coefficients coupled with their values are as follows:
Cμ = 0.09,
σk = 1,
σε = 1.3,
C1ε = 1.44,
C2ε = 1.92, and
C3ε = 1 [
31]. These values have been determined from experiments for fundamental turbulent shear flows including homogeneous shear flows and decaying isotropic grid turbulence according to ANSYS Fluent documentation [
34]. They have been found to work fairly well for a wide range of wall-bound and free shear flows. Below, the
k-ε formulations are presented, where
i,
j = 1, 2, 3 and
xi is the corresponding axis:
Due to the unique morphology of the examined aorta, fine meshes of tetrahedral elements were applied in order to achieve mesh-independent results. The minimum element’s size was selected at 200 μm and meshes with total elements of approximately 500,000 were utilized for the development of the numerical simulations. The aforementioned flow conditions, formulations, and meshes were utilized along with the COUPLED flow solver of ANSYS and the maximum number of solving iterations at 300. Finally, the value of 0.001 was selected for all residuals as the convergence criterion for the CFD problem, providing accurate and reliable solutions.
2.2.2. VR Environment
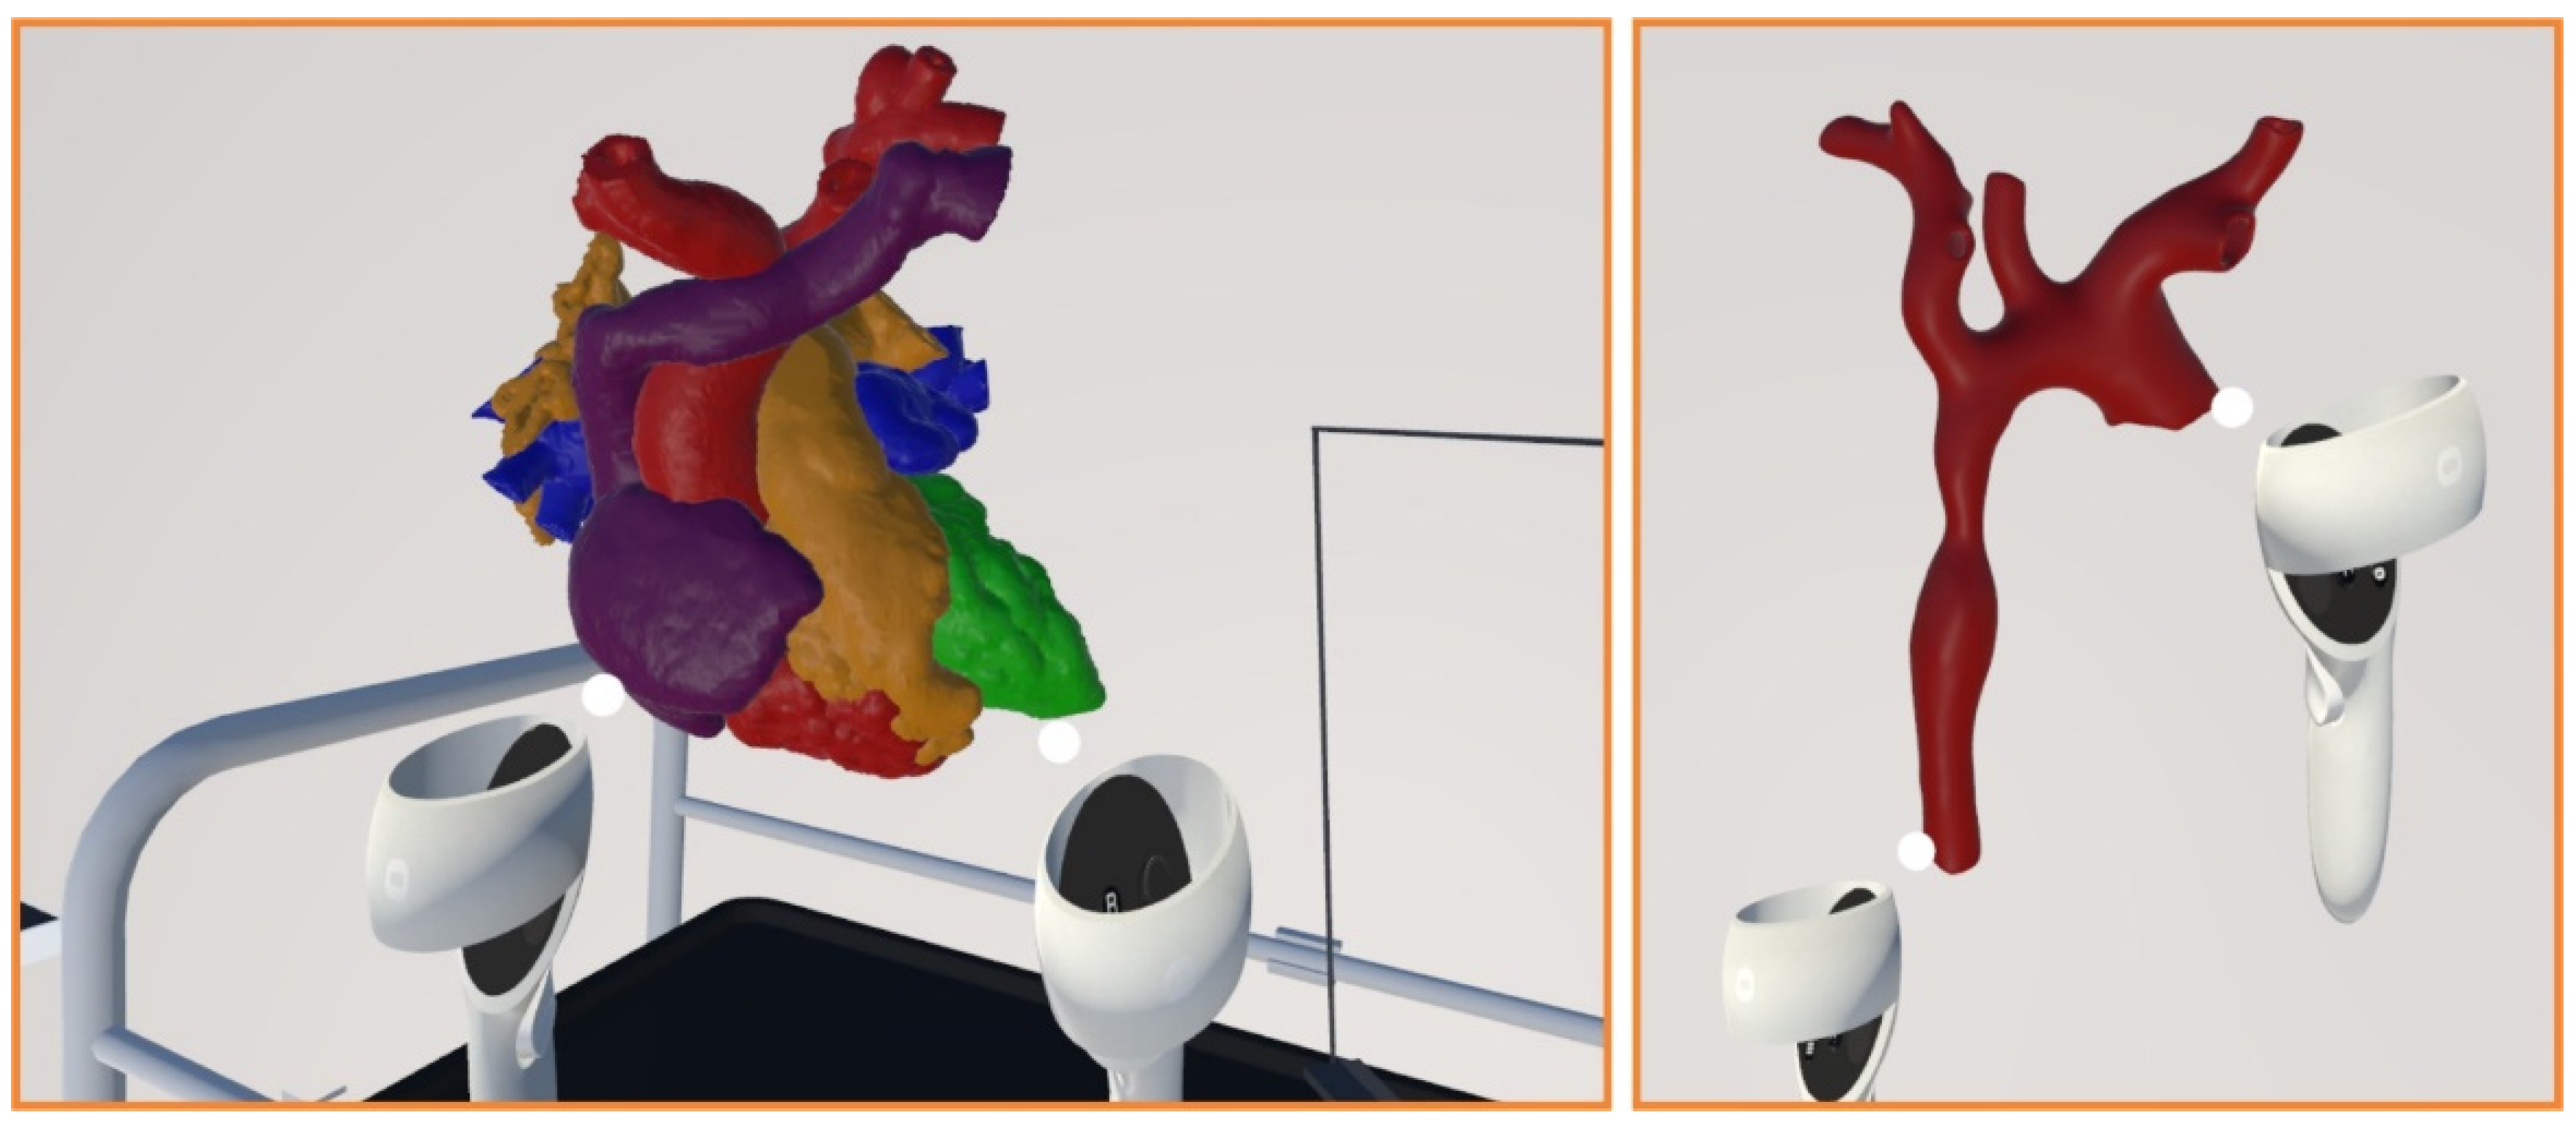
The human heart is a complex organ that requires extensive knowledge and skills to properly examine and diagnose any defects. With advancements in technology, VR has emerged as a promising tool for medical professionals, aiding in pre-operational procedures. Therefore, an approach is presented using the Oculus Quest 2 and Unity to develop a VR environment for examining the human heart. In particular, the Oculus Integration asset was imported to the Unity platform in order to enable the user to interact with the VR tool using an Oculus Quest 2. In particular, a section tool of the heart’s 3D model was developed based on [
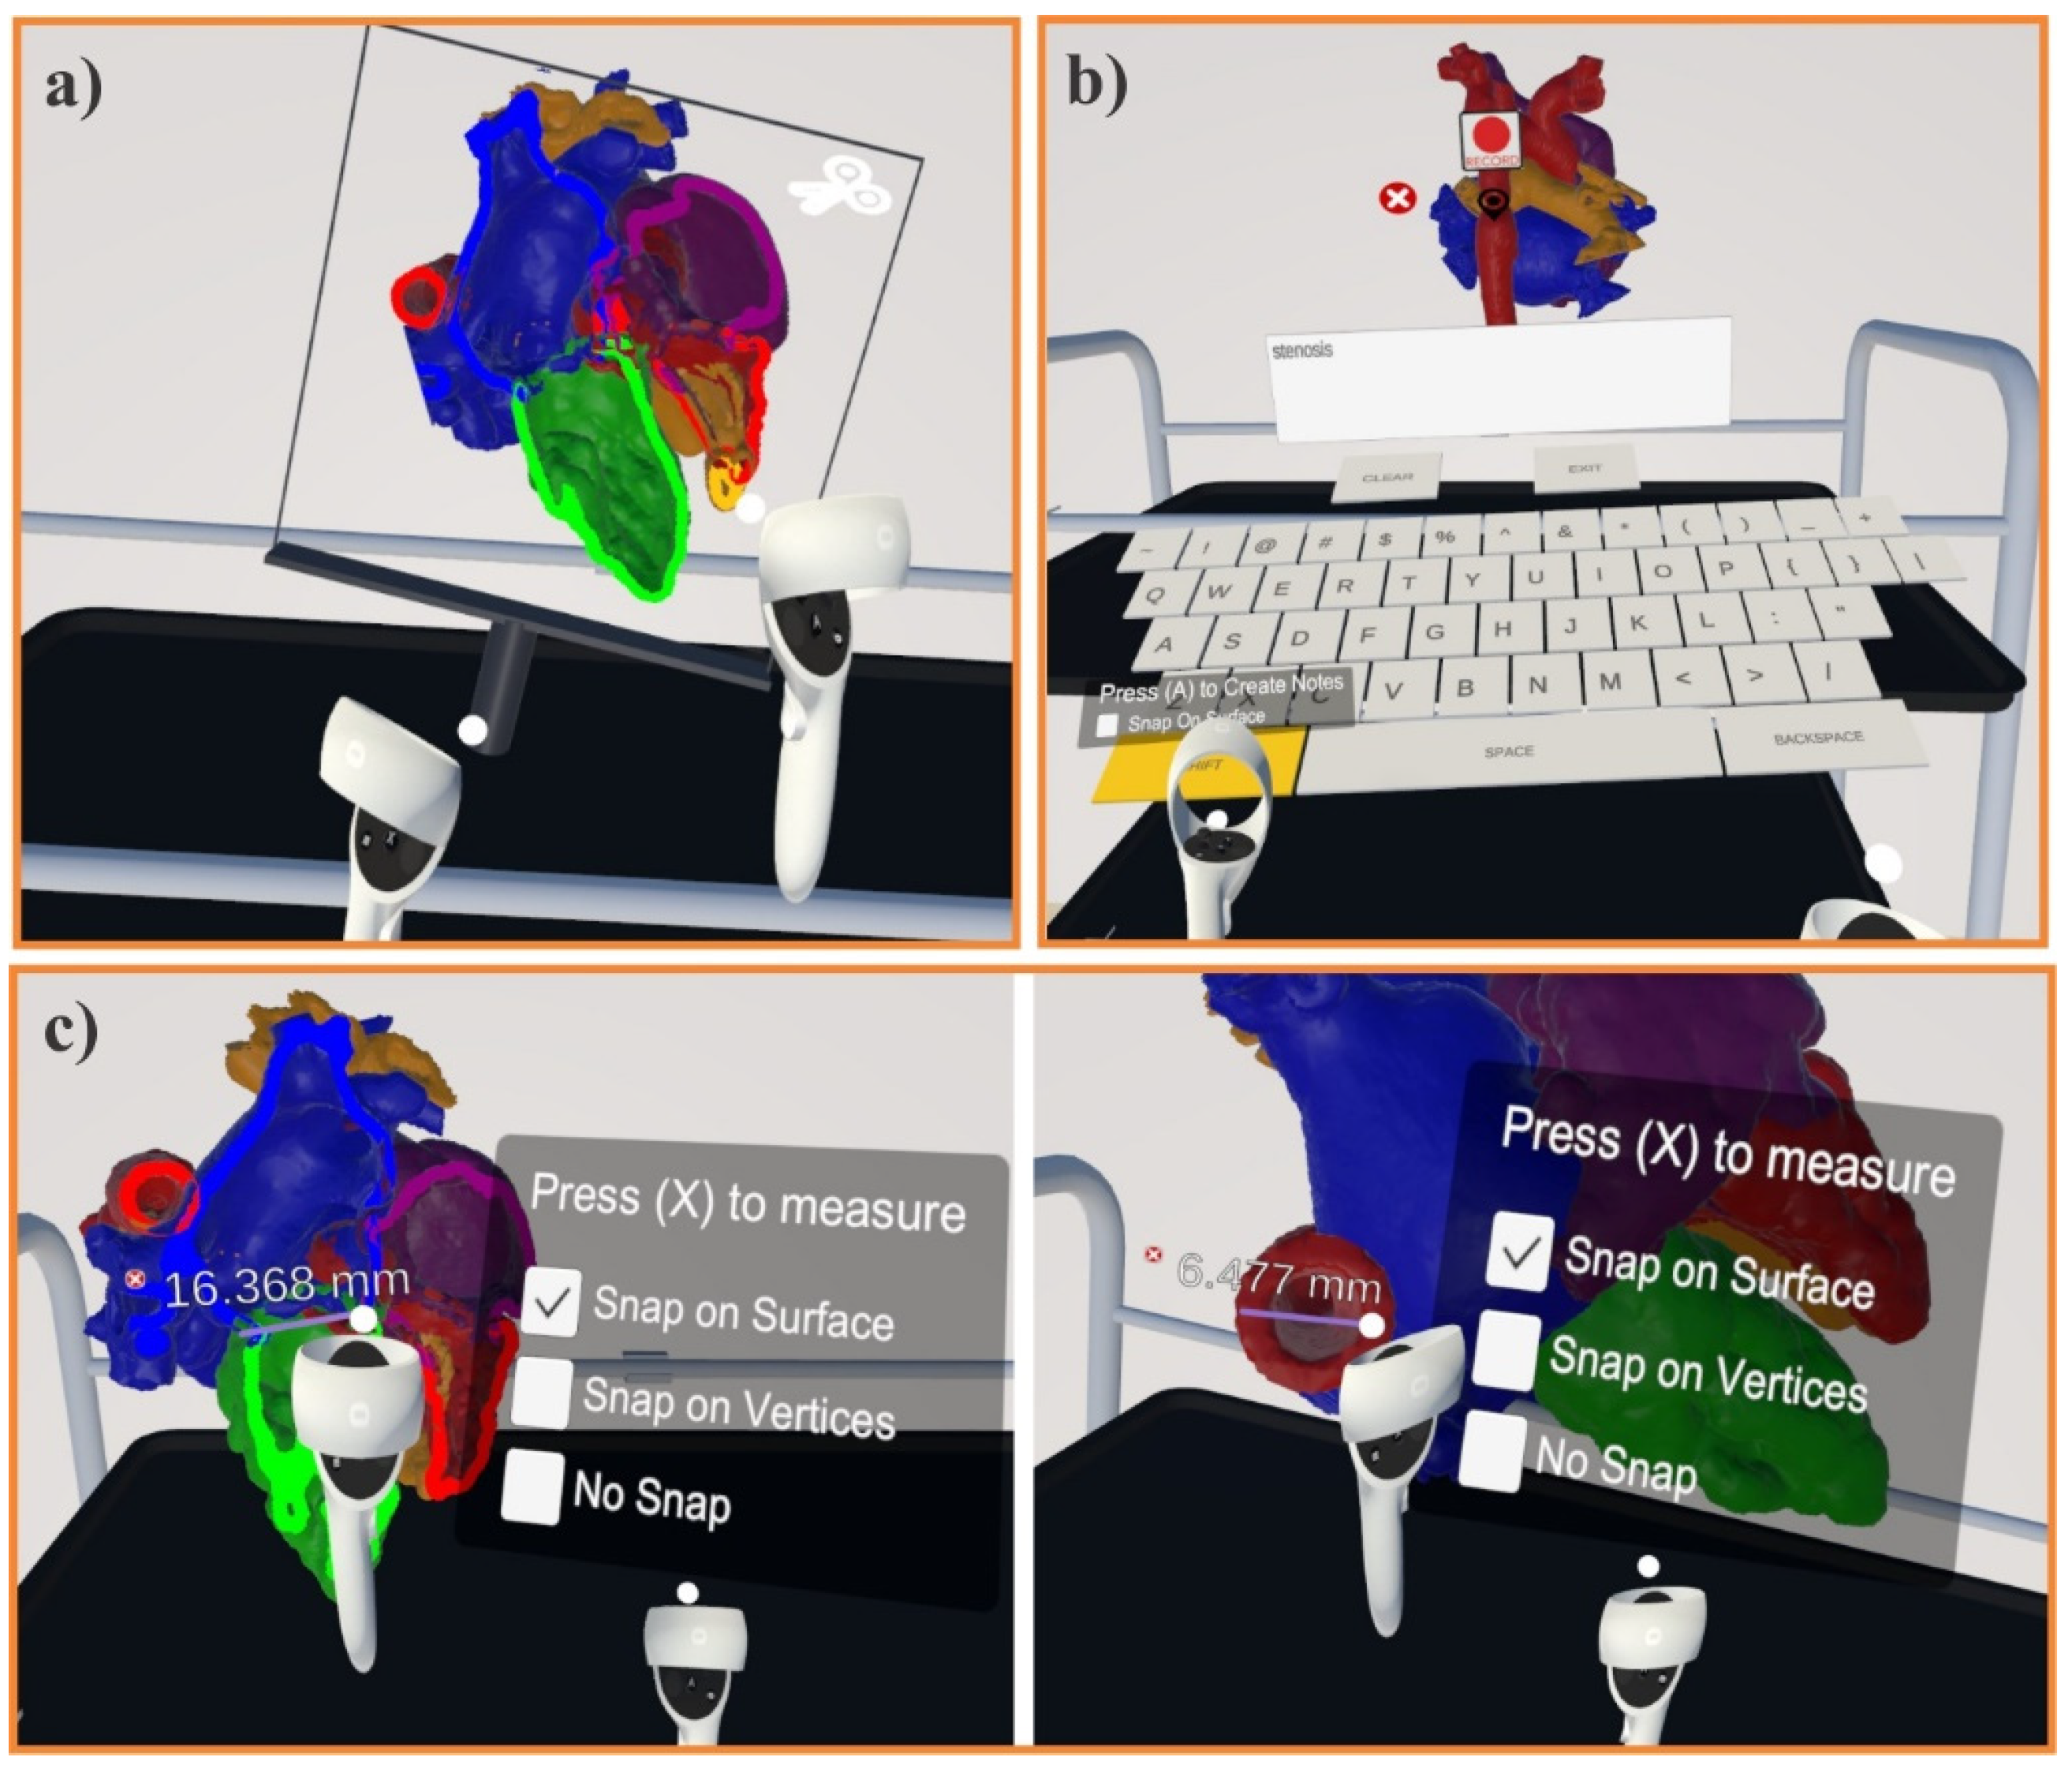
35], enriching it with several adaptations in order to allow the user to make sections throughout the heart at specific points. The introduced VR application provides a comprehensive and interactive platform for medical doctors to examine the human heart and diagnose any issues pre-operatively. With continued advancements in VR technology, this tool has the potential to significantly improve pre-operational procedures for the examination of the human heart. In addition, the VR module includes the ability to zoom in at a specific point of interest as well as to navigate internally within the investigated heart for a more detailed examination, providing better supervision of the clinical case and enabling the user to make robust decisions concerning the pre-operational procedure.
Another asset that the developed VR platform can support is recording notes at any point in the heart wherever the doctor/user deems necessary. This tool is particularly useful for annotating any abnormalities or observations generated during the examination of the patient. Moreover, the application includes a measuring feature that allows the user to measure the distance between various points of the heart. This feature can be used to assess the dimensions of several parts of the heart and identify any potential issues [
36]. Finally, the VR menu provides a visualization of the CFD results of the heart, aiding in the diagnosis and treatment of various heart-related conditions through providing a more comprehensive understanding of the heart’s function. All of the aforementioned technological tools are thoroughly described in the next section.
2.2.3. Additive Manufacturing and 3D Scanning Procedures
The main objective of the applied AM process is the construction of 3D-printed heart models that possess similar properties to the actual heart tissue, hence the material jetting AM technology was employed utilizing the ProJet MJP 5600 3D Systems™ 3D printer. The material jetting (MJ) process uses inkjet printing techniques to selectively deposit droplets (voxels) of photopolymer material through the jets of the printhead and solidify them with the aid of UV lights, resulting in the creation of the desired part [
37]. The main advantage of this process is the ability of multi-material 3D printing, i.e., the fabrication of components consisting of two or more composite materials transfusing different properties in different regions. Therefore, in order to imitate the basic properties of heart tissue, such as elasticity and strength, the MJ technique was employed in the present work. According to the manufacturer’s datasheet, the composite material with the closest properties to heart tissue [
11,
38] is RWT-ENT A50™. RWT-ENT A50™ is a composite material consisting mainly of VisiJet CE-NT™ (elastomer material) and small portions of VisiJet CR-CL 200™ (rigid material).
Table 1 lists the main properties of heart tissue measured in a passive state and the employed materials for the 3D printing process. Finally, the maximum resolution of 750 × 750 × 2000 DPI and the minimum layer height of 13 μm were applied, leading to a sufficiently fast 3D printing process of around 29 h per heart model and 12 h per aorta, achieving the maximum dimensional accuracy of the employed 3D printer.
In the context of this study, the 3D models of the heart and aorta were evaluated in terms of dimensional accuracy, utilizing the HP PRO S3 3D Structured Light Scanner (SLS). The HP PRO S3 3D SLS is a desktop 3D scanner that uses the structured light technique to capture the desired 3D geometry, and it is suitable for the scanning of relatively small objects (30–500 mm). Furthermore, this scanner is able to capture high-definition data, up to 2,300,000 vertices per scan, performing with a scan accuracy of 0.1% of the scan size. In detail, three different 360° scans were conducted with three different object orientations to ensure the total scanning of the objects. The dimensional accuracy inspection was performed with CloudCompare software, comparing the digital 3D models that were reconstructed from CT scans with the scanned 3D-printed hearts. Finally, the evaluation process was conducted via the employment of the surface distance map (SDM) methodology as well as the calculation of the mean absolute error (MAE) and root mean square error (RMSE) parameters.
4. Conclusions
In the present study, an approach for inspecting a human heart through applying state-of-the-art technologies was introduced. Computer vision algorithms coupled with a virtual environment and computational fluid dynamics simulations were employed to examine and diagnose CT scan data that are related to various heart diseases. More specifically, an automatic 3D registration method was utilized to model DICOM data, and a segmentation methodology was used to cluster the main parts of a human heart. The main advantage of clustering the human heart is the ability to improve the diagnosis, identification, and classification of cardiac diseases. In this context, an aorta of the examined clinical case was extracted using the segmented 3D model of the investigated heart. Furthermore, the inspection of the heart was enhanced via a VR application, as well as AM technologies that were implemented to create a detailed physical model of the aortic coarctation case with sufficient dimensional accuracy, obtaining acceptable values for the MAE and RMSE metrics. To conclude, the present study introduced a promising system that is capable of constructing a 3D-printed library of personalized clinical cases using appropriate materials in order to improve preoperative assessment and train new doctors. Finally, the development of a 3D VR environment coupled with a 3D digital library of real clinical models could lead to gaining surgical experience and developing pre-operative strategies without any risk.

 ,
, 


