Article

Optimization of an Innovative Hydrothermal Processing on Prebiotic Properties of Eucheuma denticulatum, a Tropical Red Seaweed

1
Faculty of Food Science and Nutrition, Universiti Malaysia Sabah, Jalan UMS, Kota Kinabalu 88400, Sabah, Malaysia
2
Seaweed Research Unit, Universiti Malaysia Sabah, Jalan UMS, Kota Kinabalu 88400, Sabah, Malaysia
*
Author to whom correspondence should be addressed.
Submission received: 20 December 2022 / Revised: 17 January 2023 / Accepted: 19 January 2023 / Published: 24 January 2023
(This article belongs to the Special Issue Innovative Food Products and Processing)

Abstract

:

Featured Application

This study provides key factors for the efficient subcritical low-acid hydrolysis of oligosaccharides from red seaweed having potential prebiotic properties, a sought-after functional food ingredient. Extraction of marine oligosaccharides from sustainable seaweed biomass with minimal loss is a green effort to cater to the huge global functional food demand.

Abstract

Seaweed is a sustainable source of marine oligosaccharides that potentially could be used as a prebiotic ingredient for functional food development. The study aims to optimize the oligosaccharide preparation through thermal hydrolysis of an under-utilized red seaweed, Eucheuma denticulatum. Response surface methodology (RSM) applying Box–Behnken design (BBD) was used on three parameters including temperature (105–135 °C), hydrolysis time (15–35 min) and sulfuric acid concentration (0.05–0.2 M). Optimized fractions with good prebiotic activity were characterized using high-performance size-exclusion chromatography (HP-SEC) and Fourier transform infrared spectroscopy (FT-IR). Eucheuma denticulatum oligosaccharides fraction 1 (ED-F1) was shown to promote the growth of beneficial gut microbiota including Lactobacillus plantarum, L. casei, L. acidophilus, Bifidobacterium animalis and B. longum with the highest prebiotic activity score of 1.64 ± 0.17. The optimization studies showed that hydrolysis time was the most significant parameter for the oligosaccharides yield. Optimal hydrolysis conditions for ED-F1 were 120 °C, 21 min, 0.12 M H2SO4 with the highest yield achieved (11.15 g/100 g of dry weight). The molecular weight of ED-F1 was determined at 1025 Da while FT-IR analysis revealed the presence of sulfated oligosaccharides with similar characteristics of i-carrageenan. These findings signify the innovative method for the efficient production of seaweed derived prebiotic oligosaccharides, which could be a promising source of functional food ingredients for the development of health foods and beverages.

1. Introduction

Seaweeds are one of the most consumed marine products, especially in Asia, where it has been cultivated and used since time immemorial. It is estimated that the global seaweed industry produced 32.7 million tonnes in volume in 2020, with revenue of about USD 13.3 billion [1,2]. About 85% of the seaweed produced is directly consumed as food. These unique marine macroalgae attract consumers due to the numerous known nutritional and health benefits containing bioactive ingredients showing properties such as anti-cancer, anti-cholesterol and anti-hypertension [3,4,5] as well as anti-inflammatory [6]. It is also reported to be a sustainable source for potential prebiotics [7,8]. Among the many components available from seaweeds, the polysaccharides and oligosaccharides from these marine biomasses are known to be unique and have gained a tremendous research interest for food and pharmaceutical applications.
The diverse number of species within the three major groups of seaweed (red, green and brown), provides a huge variation in the types and properties of their polysaccharides (carrageenan, alginate, agar) which have different applications in the food industry [9]. Polysaccharides are generally deposited in the seaweed cell matrix, mainly for structural purposes. Conventionally, polysaccharides are extracted from seaweeds through physical and chemical degradation of biomass tissues using the hydrothermal method, alkaline and acid hydrolysis, as well as enzymatic preparation, while further degradation of the extracted polysaccharide or prolonged degradation of the seaweed biomass yields low molecular weight polysaccharides and oligosaccharides [10]. Some seaweed polysaccharides are heavily sulfated and vary tremendously in their monosaccharide composition as well as polymer linkage [11]. A typical polysaccharide such as agarose has an average molecular weight of more than 100,000 Da and 0.15% sulfate content, while a low molecular weight agaropectin has a mass below 20,000 Da with up to 8% sulfate content [12].
Current studies showed that some seaweeds’ non-digestible polysaccharides and hydrolysed low molecular weight polysaccharides and oligosaccharides promote the growth of beneficial gut microbiota such as lactobacilli and bifidobacterium. These include alginate and agar polysaccharides from Grateloupia filicina, Eucheuma spinosum, Kappaphycus alvarezii [13,14] as well as commercially available laminaran (Laminaria sp.), ulvan (Ulva sp.) and porphyran (Propia sp.) [11]. Agaro-oligosaccharides derived from the hydrolysis Gracillia lemaneiformis polysaccharides also exhibit similar activity in promoting significant abundance in beneficial microbiota population while Sargassum confusum oligosaccharides display potential anti-diabetic properties through regulating the gut microbiota [15,16]. Low molecular weight oligosaccharides with such activities are much sought after not only for their physicochemical properties, but also for their bioactivity, with the potential to create huge impact in the industry [17].
Extraction of oligosaccharide is the first and most challenging step in determining the composition and properties of the compounds, in which the recovery is affected by several factors such as temperature, solvent, and extraction technique. Conventional extraction methods using high temperatures for a prolonged period is always detrimental to sample as the decomposition of polysaccharide backbone yields by-products such as hydroxymethyl furfural and furfural derivatives that can be toxic at high concentrations [18,19]. Diluted acid hydrolysis coupled with high temperature extraction by far is still the low-cost method for the recovery of oligosaccharides from lignocellulosic material. However, there is very little study of the utilization of low acid hydrolysis and its effects on the degree of recovery of oligosaccharides from seaweeds, especially for the less-cultivated varieties.
Response surface methodology (RSM) through Box–Behnken design (BBD) is a powerful tool to predict the best extraction conditions leading to optimal desired experimental responses. Recent published literatures have demonstrated this method combination for the efficient extraction of seaweed phytosterols [20], plant antioxidants [21] and mushroom peptides [22]. A minimum of three levels of each shortlisted parameter is required for the BBD to fit a second-order regression model (quadratic model) [21]. In this context, the current study aimed to investigate the effects of temperature, time and acid concentration on the oligosaccharides extraction from red seaweed Eucheuma denticulatum and optimizing the extraction parameters using RSM for higher recovery of the oligosaccharide fractions while reducing the formation of by-product 5-hydroxymethyl furfural (HMF).

2. Materials and Methods

2.1. Materials

All solvents, reagents, chemical standards and microbiological medium were purchased from Merck (Darmstadt, Germany) unless otherwise stated. Lactobacillus paracasei (LC01), bifidobacterium lactis BB12 (BB12) and Bifidobacterium longum BB46 (BB46) cultures were from Chrs. Hansen (Hørsholm, Denmark). Lactobacillus plantarum ATCC 8014 (LP8014), and Escherichia coli ATCC 11775 (EC11775) were from American Type Culture Collection (ATCC, Manassas, VA, USA). Commercial prebiotic (Fibrulose F97™) was from Cosucra (Pecq, Belgium).

2.2. Seaweed Sample Preparation

Red seaweed (Eucheuma denticulatum) was collected from Semporna, Sabah Malaysia with the assistance from the Seaweed Research Unit, Universiti Malaysia Sabah. Seaweeds were washed from impurities, dried at 50 °C until reaching approximately 10% moisture content, milled and were kept in an airtight container in −20 °C. Species verification was performed by the Seaweed Research Unit, Universiti Malaysia Sabah.

2.3. Hydrolysis and Extraction of Seaweed Oligosaccharide Fraction

The seaweed oligosaccharide fraction was extracted using the modified autoclave method (130 °C, 15 psi, 15 min) (Hirayama, Japan) [23] with low acid hydrolysis (0.2 M H2SO4). Dried and defatted seaweed powder were used (25 g, 1:20 solid–liquid ratio) and placed in 1 L blue-cap Schott™ bottles. Recovered liquor was neutralized with calcium carbonate and the supernatant was recovered through centrifugation (5000 rpm, 5 min). The supernatant was concentrated under vacuum until 10% of its initial volume at 60 °C and was deproteinized through the removal of precipitates (8000 rpm, 5 min). Sequentially, two volumes and five volumes of ethanol (95%) were added to the supernatant under constant stirring and both precipitates were removed through centrifugation. The supernatant obtained after the removal of the ethanol precipitate were concentrated again to 5% volume and were precipitated using nine volumes of pure ethanol (99.9%) to obtain low molecular weight oligosaccharides. Oligosaccharide precipitates were washed with pure ethanol twice and vacuum dried at 50 °C. Bradford’s protein assay was used to check for residual protein. Oligosaccharide precipitates were fractionated through anion exchange column (DEAE-Sepharose® Fast Flow Column, 20 mm × 100 cm) (Sigma-Aldrich, St. Louis, MO, USA) and gradient eluted with distilled water, 0.1, 0.2, 0.4 M, 0.8 M and 1.6 M NaCl solutions [24]. Each fraction was collected and the phenol–sulfuric acid assay [25] was used to determine the sulfated sugar content. Fractions which contained oligosaccharides were pooled, concentrated, desalted (Sephadex® G-10 column, 2.0 × 25 cm) (Sigma-Aldrich, St. Louis, MO, USA), vacuum dried and weighed. Fractions were subjected to size exclusion chromatography (HP-SEC) (Agilent 1200, Santa Clara, CA, USA) using BIOSEP-SEC S2000 column (Phenomenex, Torrance, CA, USA). Elution took place at 30 °C with 50 mM sodium nitrate and the elution was monitored using a refractive index detector (RID) [26]. Calibration was performed using galactose, maltose, maltotriose, and dextrans with molecular weight ranging between 1 and 25 kDa as standards.

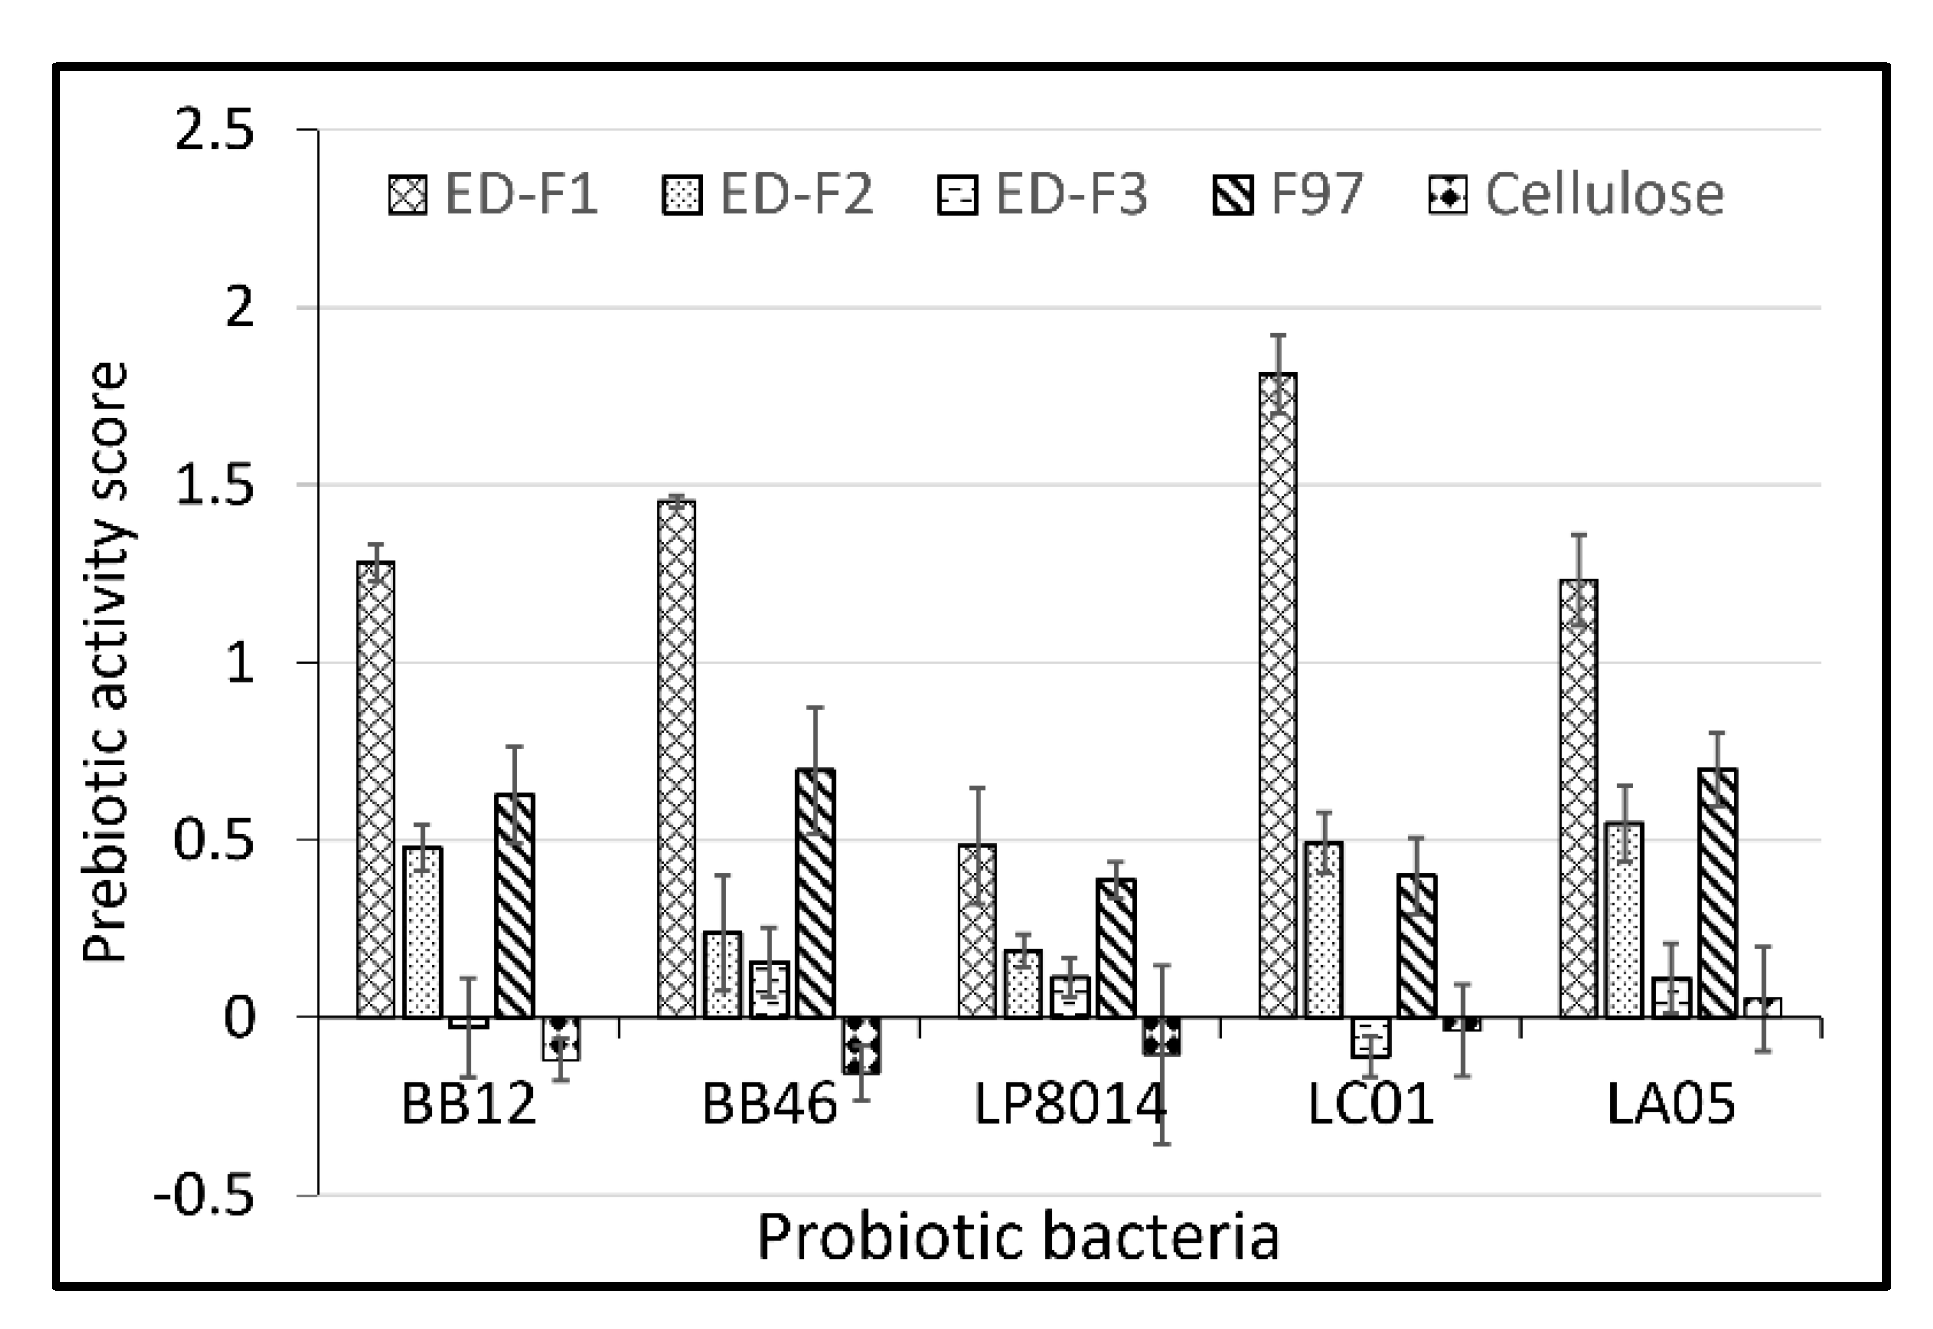
2.4. Prebiotic Activity Assay and Prebiotic Activity Score

The assay was conducted by adding bacterial suspensions (final inoculum concentrations of 6 log CFU/mL) to separate tubes containing MRS basal broth (probiotic) or M9 broth (EC) (with 1% (wt/vol) glucose or 1% (wt/vol) prebiotic. Cultures were incubated under anaerobic conditions at 37 °C. After 0 h and 24 h of incubation, bacterial samples were enumerated on MRS and TSA, respectively. Each assay was performed in triplicate. The prebiotic activity score was calculated using the Equation (1) according to Huebner et al. 2007 [27]:
Prebiotic activity score = probiotic (Δ log CFU/mL prebiotic/Δ log CFU/mL glucose) −
enteric (Δ log CFU/mL prebiotic/Δ log CFU/mL glucose)

2.5. Quantification of HMF

Briefly, the chromatographic separation was performed using an Agilent 1200 Series HPLC, equipped with a diode array detector (DAD) (Agilent, Santa Clara, CA, USA). Extraction liquor containing 5-hydroxy-2-methylfurfural (HMF) was injected through a Phenomenex column (Luna C18, 5.0 μm, 4.6 × 150 mm) at 30 °C. The mobile phase consisted of water (with 0.5% formic acid) and acetonitrile in the ratio 90:10 (vol/vol) under isocratic conditions, at a flow rate of 0.8 mL/min with an injection volume of 30.0 μL. The detection was carried out at 285 nm and the total run time was 8 min. All aqueous samples solutions were filtered on 0.45 μm nylon filters before injection on chromatographic system [28].

2.6. Selection of Three Levels of Independent Variables (X1, X2, X3)

Extraction of oligosaccharide fraction ED-F1 was done at different temperatures (95 °C to 135 °C hours) at constant time (15 min) and 0.2 M H2SO4 concentration. The best extraction temperatures were forwarded down and were used as a constant for the next extraction procedure in which the time is varied (15 min to 55 min) while applying a constant 0.2 M H2SO4 concentration. The best extraction temperatures applied with the best extraction time were forwarded down as constant variables for the next extraction procedure varying the H2SO4 concentration (0.05 M to 0.25 M). All extraction liquors were similarly purified according to the previous method to obtain fraction ED-F1. Parameters with the highest fraction yield were selected as center points.

2.7. Experimental Design and Validation of Models

The optimization approach was carried out using The Design Expert (Version 11.0.0, Stat-Ease Inc, Minneapolis, MN, USA) according to a three level, three variable Box–Behnken design with 17 design points. Three independent variables consist of hydrolysis temperature (°C, X1), time (min, X2) and sulfuric acid concentration (M H2SO4, X3). A narrowed three levels of each variable were selected based on the results from the single factor experimentation, denoted as lower level (−1), upper level (+1) and including the center point (0). Levels were assigned accordingly for X1: 115 °C(−1), 125 °C(0), to 135 °C(+1); X2: 15 min(−1), 25 min(0), 35 min(+1); X3: 0.05 M(−1), 0.125 M(0), 0.2 M(+1). Responses (Y) are based on the recovered yield of oligosaccharide fraction in grams and hydroxymethyl furfural concentration in the reaction liquor (g/L). Experimental data were fitted to the following second order polynomial equation proposed for the analysis of each response (Y) shown by Equation (2):
Y = β 0 + i = 1 3 β iXi + i = 1 3 β iiXi 2 + i j = 1 3 β ijXiXj
In the equation, Y is the yield of oligosaccharide fraction and hydroxymethyl furfural concentration, predicted response; β0, βi, βii, and βij are regression coefficients for intercept, linear, quadratic and interaction terms respectively; Xi and Xj are independent variables. The significance of the model was calculated in terms contributing to the regression sum of squares. The reduced model was then acquired through the exclusion of the non-significant coefficients from the initial model after the analysis the regression model coefficients (R2) and evaluating the model lack of fit using ANOVA (p < 0.05) and the Fisher test value (F-value). Response surface plots were developed to explain the effects of independent variables (temperature, time and H2SO4 concentration) on the response variables (ED-F1 fraction, HMF) [29].

2.8. FT-IR Spectra Acquisition

The Fourier transform infrared (FT-IR) spectrum of the ED-F1 was detected on the FT-IR spectrometer (Spectrum 100, Perkin Elmer, Waltham, MA, USA), recorded in a transmittance mode over a wavelength range between 4000 and 400 cm−1 [30]. Iota-carrageenan was used as a reference standard. Triplicates of each sample were scanned to get an average spectrum.

2.9. Statistical Analysis

All determinations were performed at least in triplicate. Data were expressed as mean values ± standard deviation. Comparison of means was performed by one-way analysis of variance (ANOVA) with a significance level of p < 0.05. The Design Expert software (ver.12) (Stat-Ease, Inc., Minneapolis, MN, USA) was used for constructing the regression model, designing the Box–Behnken and predicting the optimal parameters.

3. Results

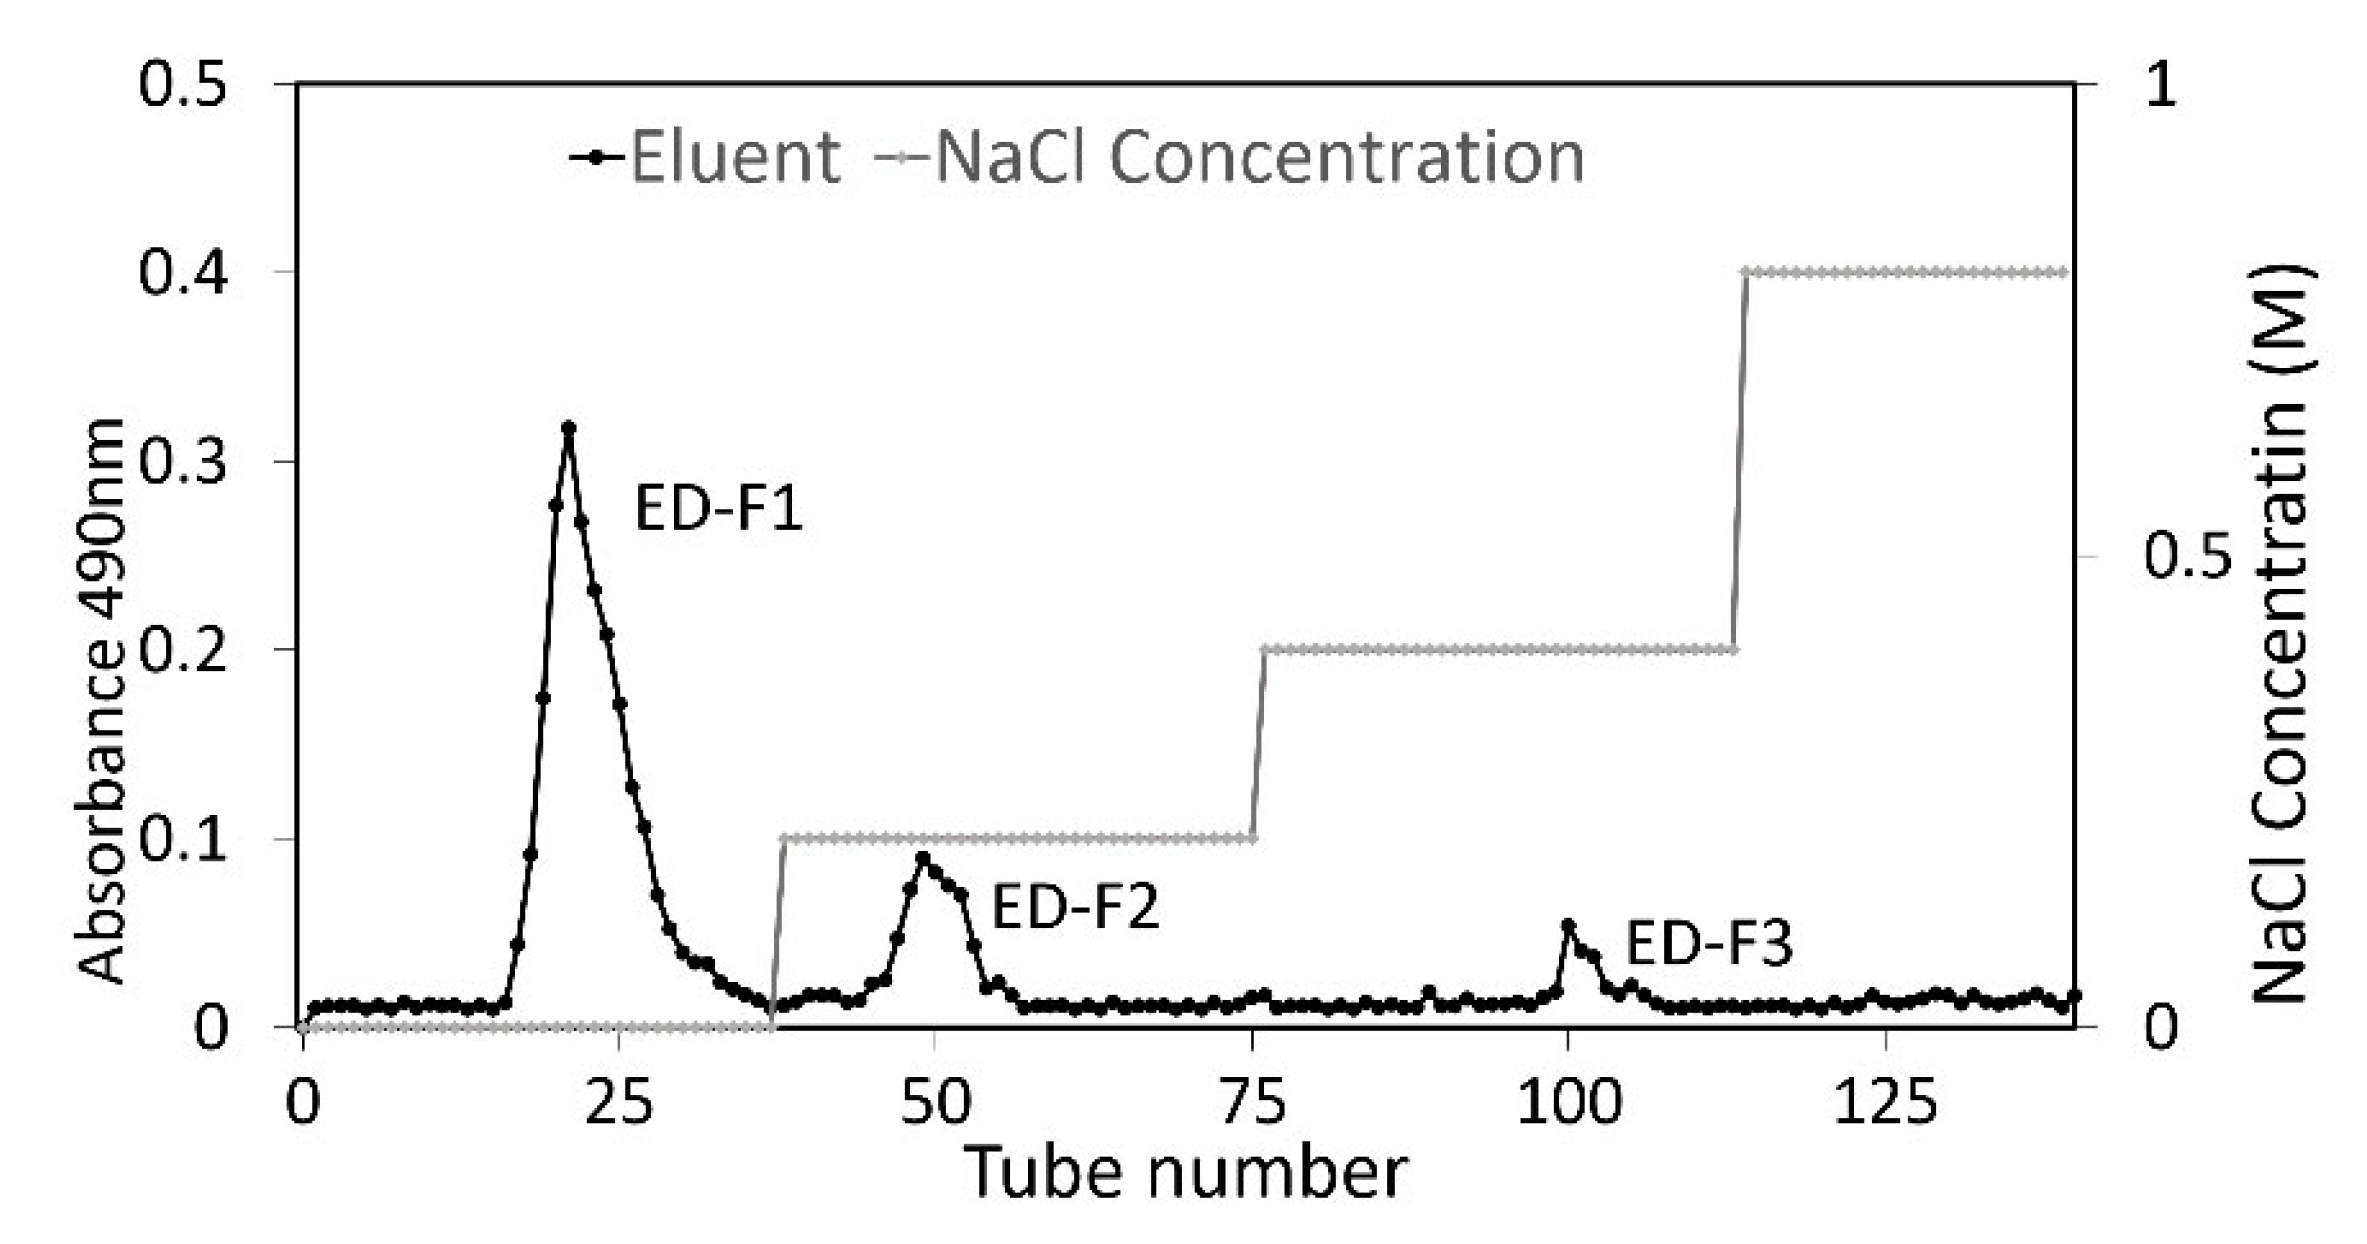
3.1. Purification and Prebiotic Activity Score of Red Seaweed Oligosaccharide Fractions

Red seaweed oligosaccharide fractions undergoing anion-exchange column yielded three distinct fractions assigned ED-F1, ED-F2 and ED-F3 (Figure 1). The first fraction eluted out with water resulted in the major peak, followed by a peak eluted using 0.2 M and 0.4 M NaCl, while no peak was detected through the elution using 0.8 M–1.6 M (results not shown). Monitoring was conducted using the phenol–sulfuric assay and similar fractions were pooled together into one single fraction. Anion-exchange chromatography was extensively used to fractionate oligosaccharides including fucooligosaccharides derived from the enzymatic hydrolysis of brown seaweed Sargassum honeri [31] as well as ulvan oligosaccharides from green seaweed Ulva sp. [32]. Gradient increase in the ionic strength of the mobile phase (Cl), competes with the binding site of the positively charged DEAE sepharose resin that will gradually enable the release of negatively charged molecules that binded earlier [33]. Ionized sulphate ester groups are the prime contributors to the natural anionic properties of the seaweed oligosaccharides [34].
The three oligosaccharide fractions subjected to prebiotic assay showed positive prebiotic activity score values against five different commercial probiotics (Figure 2). ED-F1 displayed the highest prebiotic activity score against all probiotics with the highest value against L. paracasei LC01 at 1.64 ± 0.17. The prebiotic activity score values of ED-F1 were significantly higher compared to commercial prebiotic F97 against B. animalis BB12, B. longum BB46, L. paracasei LC01 and L. acidophilus LA05. These values are higher than the reported prebiotic activity score of pectic oligosaccharide fractions from citrus peel against L. paracasei (0.17–0.38) and Bifidobacterium bifidum (0.09–0.93) [35], but comparable to the score of seaweed polysaccharides extracted from Sargassum withii (1.42) and Enteromorpha compressa (1.44) against Lactobacillus plantarum [36]. The current study displayed a slightly lower prebiotic activity score values of ED-F1 against L. plantarum LP8014. The variation observed in the prebiotic activity score of different fractions for both bifidobacteria and lactobacilli strain relates to its metabolic diversity [27] and their different preferential utilization of various oligosaccharides in the fraction [27,37,38]. Depending on the species, lactobacilli strains have been known to possess a great variety of genes involved in the metabolism of both complex oligosaccharides and simple sugars which can be switched on depending on the availability of the type of carbohydrates available [39].

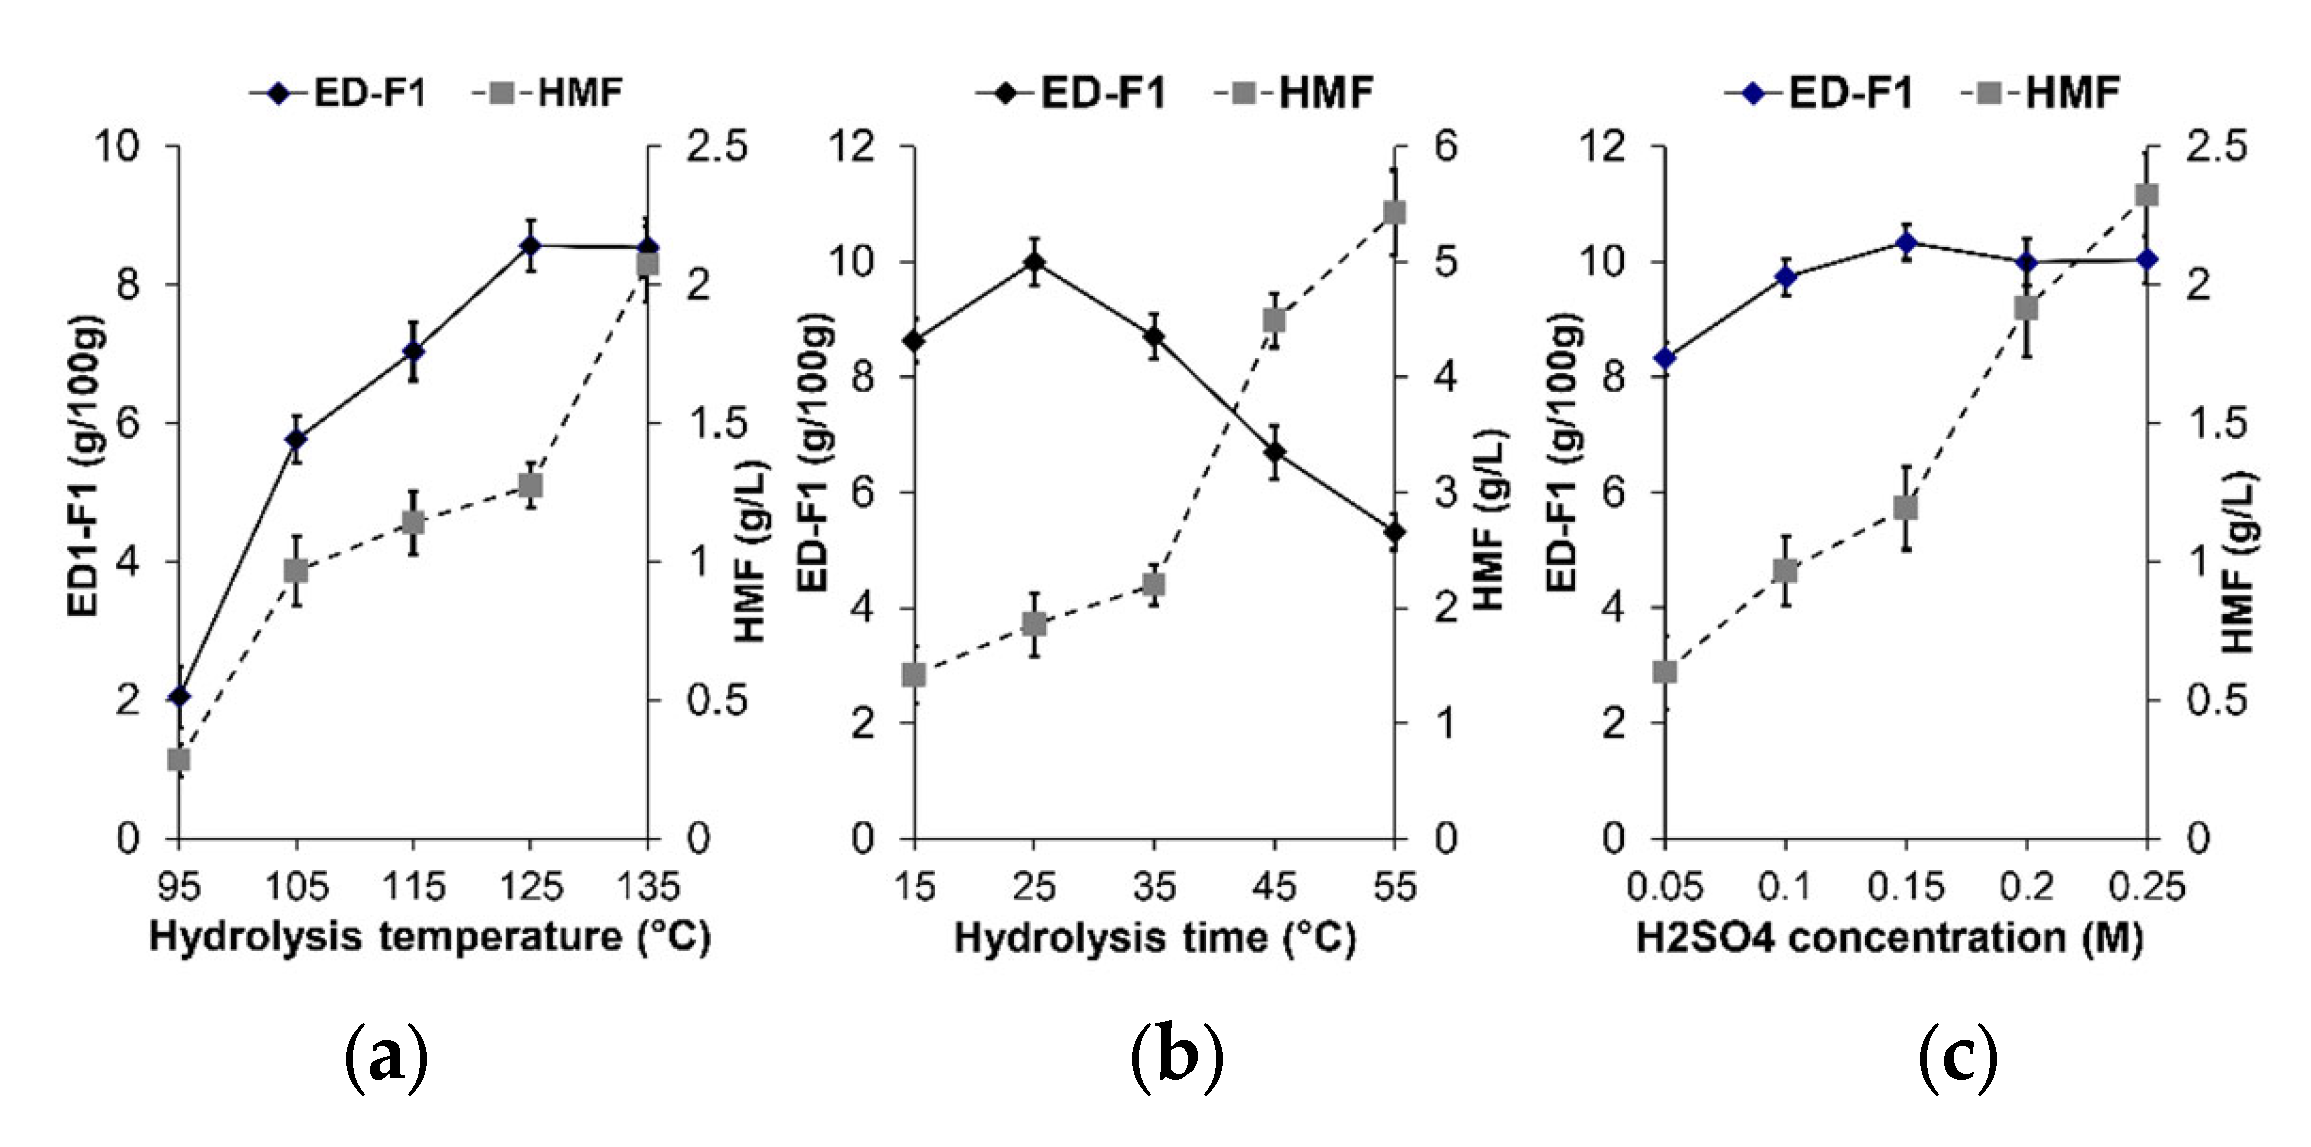
3.2. Selection of Factor Levels

Both ED-F1 fraction yield and HMF concentration in the extraction liquor showed a positive linear relationship affected by extraction temperature from 95 °C to 135 °C (Figure 3a) with the yield of ED-F1 fraction increased by 6.52 g/100 g at extraction temperature of 125 °C compared to 95 °C. It has been shown previously that water at subcritical level (>100 °C) has the tendency to produce hydronium ions (H3O+), which resulted in the rapid hydrolysis of macromolecules into smaller molecules [40]. It was observed that the increment of temperature in the hydrolysis of passion fruit peel and oat is proportionate to the gradual increase in solid loss percentage of the raw material as well as the increase in detectable smaller carbohydrates such as oligosaccharides and monosaccharides as well as acids and HMF by-products [21,40]. For optimization, a shorter temperature range from 115 °C to 135 °C was selected based on significance increase in the yield of ED-F1 fraction at temperatures 125 °C to 135 °C. The temperatures 115 °C and 135 °C were selected for the lower and upper level, respectively, to be applied in the optimization design using RSM.
When the temperature of 125 °C was brought down for further application in varying the time of hydrolysis, the results were observed showing an inverse linear relationship between the yield of ED-F1 fraction and hydrolysis time 25 to 55 min while HMF increased gradually from 15 to 55 min. Liu et al. (2020) [41], showed that the degree of hydrolysis of fucosylated glycosaminoglycan using mild acid increase exponentially against time at temperatures below 100 °C over the span from 1 to 36 h while Sophonputtanaphoca et al. (2018) [42], reported that oligosaccharides can be produced within 30 to 60 min at temperatures between 100–121 °C. In the current study, a gradual decrease of ED-F1 yield observed at temperature 125 °C against a timespan of 35 to 55 min suggested a preferable shorter hydrolysis time. The gradual decrease of ED-F1 could be due to the hydrolysis of the oligosaccharide components generating more HMF as shown in (Figure 3b). It is also important to note that time of hydrolysis may also be affected by the plant matrix itself made up of different glycan backbones between the current and previous studies. Time of hydrolysis at 15 min to 35 min was selected based on the observed peak increase of the ED-F1 fraction yield at 25 min.
Incrementing the H2SO4 concentration in the hydrolysis solvent showed an increasing trend of ED-F1 fraction yield with a plateauing trend at 0.2 M–0.25 M concentration at constant 25 min time (Figure 3c). In contrast, Wang et al. (2019) [43], demonstrated that mild sulfuric acid concentration (0.3–0.7 M) had a significantly increasing trend in the hydrolysis of press-lye waste hemicelluloses to xylo-oligosaccharides. This could be explained by the difference in the other factors used such as hydrolysis time and temperature as well as the difference in the type of carbohydrates in the raw material in the current study. It is also shown in the previous study by Sophonputtanaphoca et al. (2018), acid concentration beyond a certain range with the effect of time and temperature favours the production of monosaccharide over the oligosaccharide fraction with the oligosaccharide completely undetectable at hydrolysis using sulfuric acid concentration at 2 M for 1 h [42]. A range of 0.05 M to 0.2 M H2SO4 concentration was selected for the lower and upper level for optimization.

3.3. RSM Model and Analysis of Variance

RSM was used to investigate the effects of hydrolysis temperature (115–135 °C), extraction time (15 min–35 min) and H2SO4 concentration (0.05 M–0.2 M) on the oligosaccharides fraction ED-F1 with potential prebiotic from E. denticulatum. Several studies have successfully employed this method in optimizing hydrolysis parameters to obtain corncob xylooligosaccharides from a microwave-assisted hydrolysis [44], deriving glucomanno-oligosaccharides from copra meal hydrolysis [45] and enzymatic hydrolysis to obtain galacto (arabino)-oligosaccharide from potato rhamnogalacturonan [46]. ED-F1 fraction was selected to be optimized due to its significant and highest prebiotic activity score against five commercial probiotics. HMF was also measured as it is directly associated with the decomposition of hexoses under heat treatment and was known to be a potential carcinogen at high amounts.
Three hydrolysis parameters were selected as factors and the operating range were narrowed. These parameters have been shown to significantly affect ED-F1 fraction yield. The factors were assigned as hydrolysis temperature (X1), hydrolysis time (X2) and H2SO4 concentration (X3) (Table 1). Several researchers also have emphasized these to be vital factors that highly affect low or mild acid hydrolysis procedures to obtain oligosaccharides [44,47,48]. The Box–Behnken model was selected for the design of the experiment considering the restriction of operability in the selected factor (maximum heating temperature of the autoclave). Not only does the Box–Behnken design accommodate for a minimum number of experiments, but it also efficiently allows estimating first order and second order coefficients of the model and provides supportive analysis on the interactions between the variables [49]. The three selected factors were assigned a lower, center point and upper level designated in code of −1, 0, +1, respectively, in which the central point and the experimental points are equidistant.
From the 17 experiments, a quadratic model was adjusted to the responses (ED-F1 and HMF), and the regression coefficients for the linear, quadratic, and interaction terms were calculated and statistically evaluated using ANOVA. Table 2 shows the statistical analysis of the regression coefficients of the complete polynomial models for the yield of ED1-F1 and HMF. Based on the ANOVA (p ≤ 0.05), the linear first-order effect was significant for all factors (temperature X1, time X2, H2SO4 concentration X3), the quadratic second-order effect was significant only for temperature and H2SO4 concentration for both ED-F1 yield and HMF.
The effect of the interaction between any two factors (X 1, X2 and X 3) was significant for ED-F1 yield. Similar occurrence was observed for HMF by-product except for the non-significance between interactions of X1X3. The insignificant coefficients were removed from the second-order polynomial model.
Thus, the reduced regression equation with the coded values was established as the following:
ED-F1 yield (g) = 9.97 − 0.098X1 − 0.216X2 − 0.121X3 − 0.722X12 − 1.19X32 − 0.365X1X 2 − 0.34X 1X 3 − 0.158X2X3;
HMF by-product (g/L) = 5.88 + 0.72X 1 + 0.39X 2 + 1.37X3 + 0. 90X12 − 1.05X32 + 0.23X 1X 2 − 0.0063X2X3;
where X1 is hydrolysis temperature, X2 is hydrolysis time and X3 is H2SO4 concentration.
The reduced quadratic models were statistically significant with the p-value for both responses (ED-F1 yield and HMF) shows <0.0001, indicating the model is statistically significant at 95.0% confidence interval (p < 0.05). Furthermore, the aptness of the second-order polynomial model was confirmed by the insignificant lack of fit F-values (p > 0.05), indicating the lack of fit is not significant relative to the pure error in this experiment [50]. The regression coefficient (R2) was well adjusted for the experimental data (ED-F1 yield adjusted R2 = 0.9836, HMF adjusted R2 = 0.9616) which indicates that the quality of the models was retained even after the removal of some terms. Based on the adjusted R2 value for both models, only 1.74% and 3.94% of the total variation is not explained by both ED-F1 yield and HMF models, respectively, with the variations in the ED-F1 yield (98.36%) and HMF content (96.16%) are direct results to changes in the temperature, time and H2SO4 concentration. The difference between the predicted R2 and the adjusted R2 for both models were in reasonable agreement (less than 0.2) while the model fitting was better as R2 value observed is closest to 1 [51]. Moreover, the lower value of CV (<5) for ED-F1 implies the low deviations between the experimental data values and the predicted data values. Models with low CV values (<10) are still considered to have good reliability and reproducibility [52]. The “Adeq Precision” which implies the signal-to-noise ratio, indicates an adequate signal (>4) for all models and can be used to navigate the design space [49,50,53].

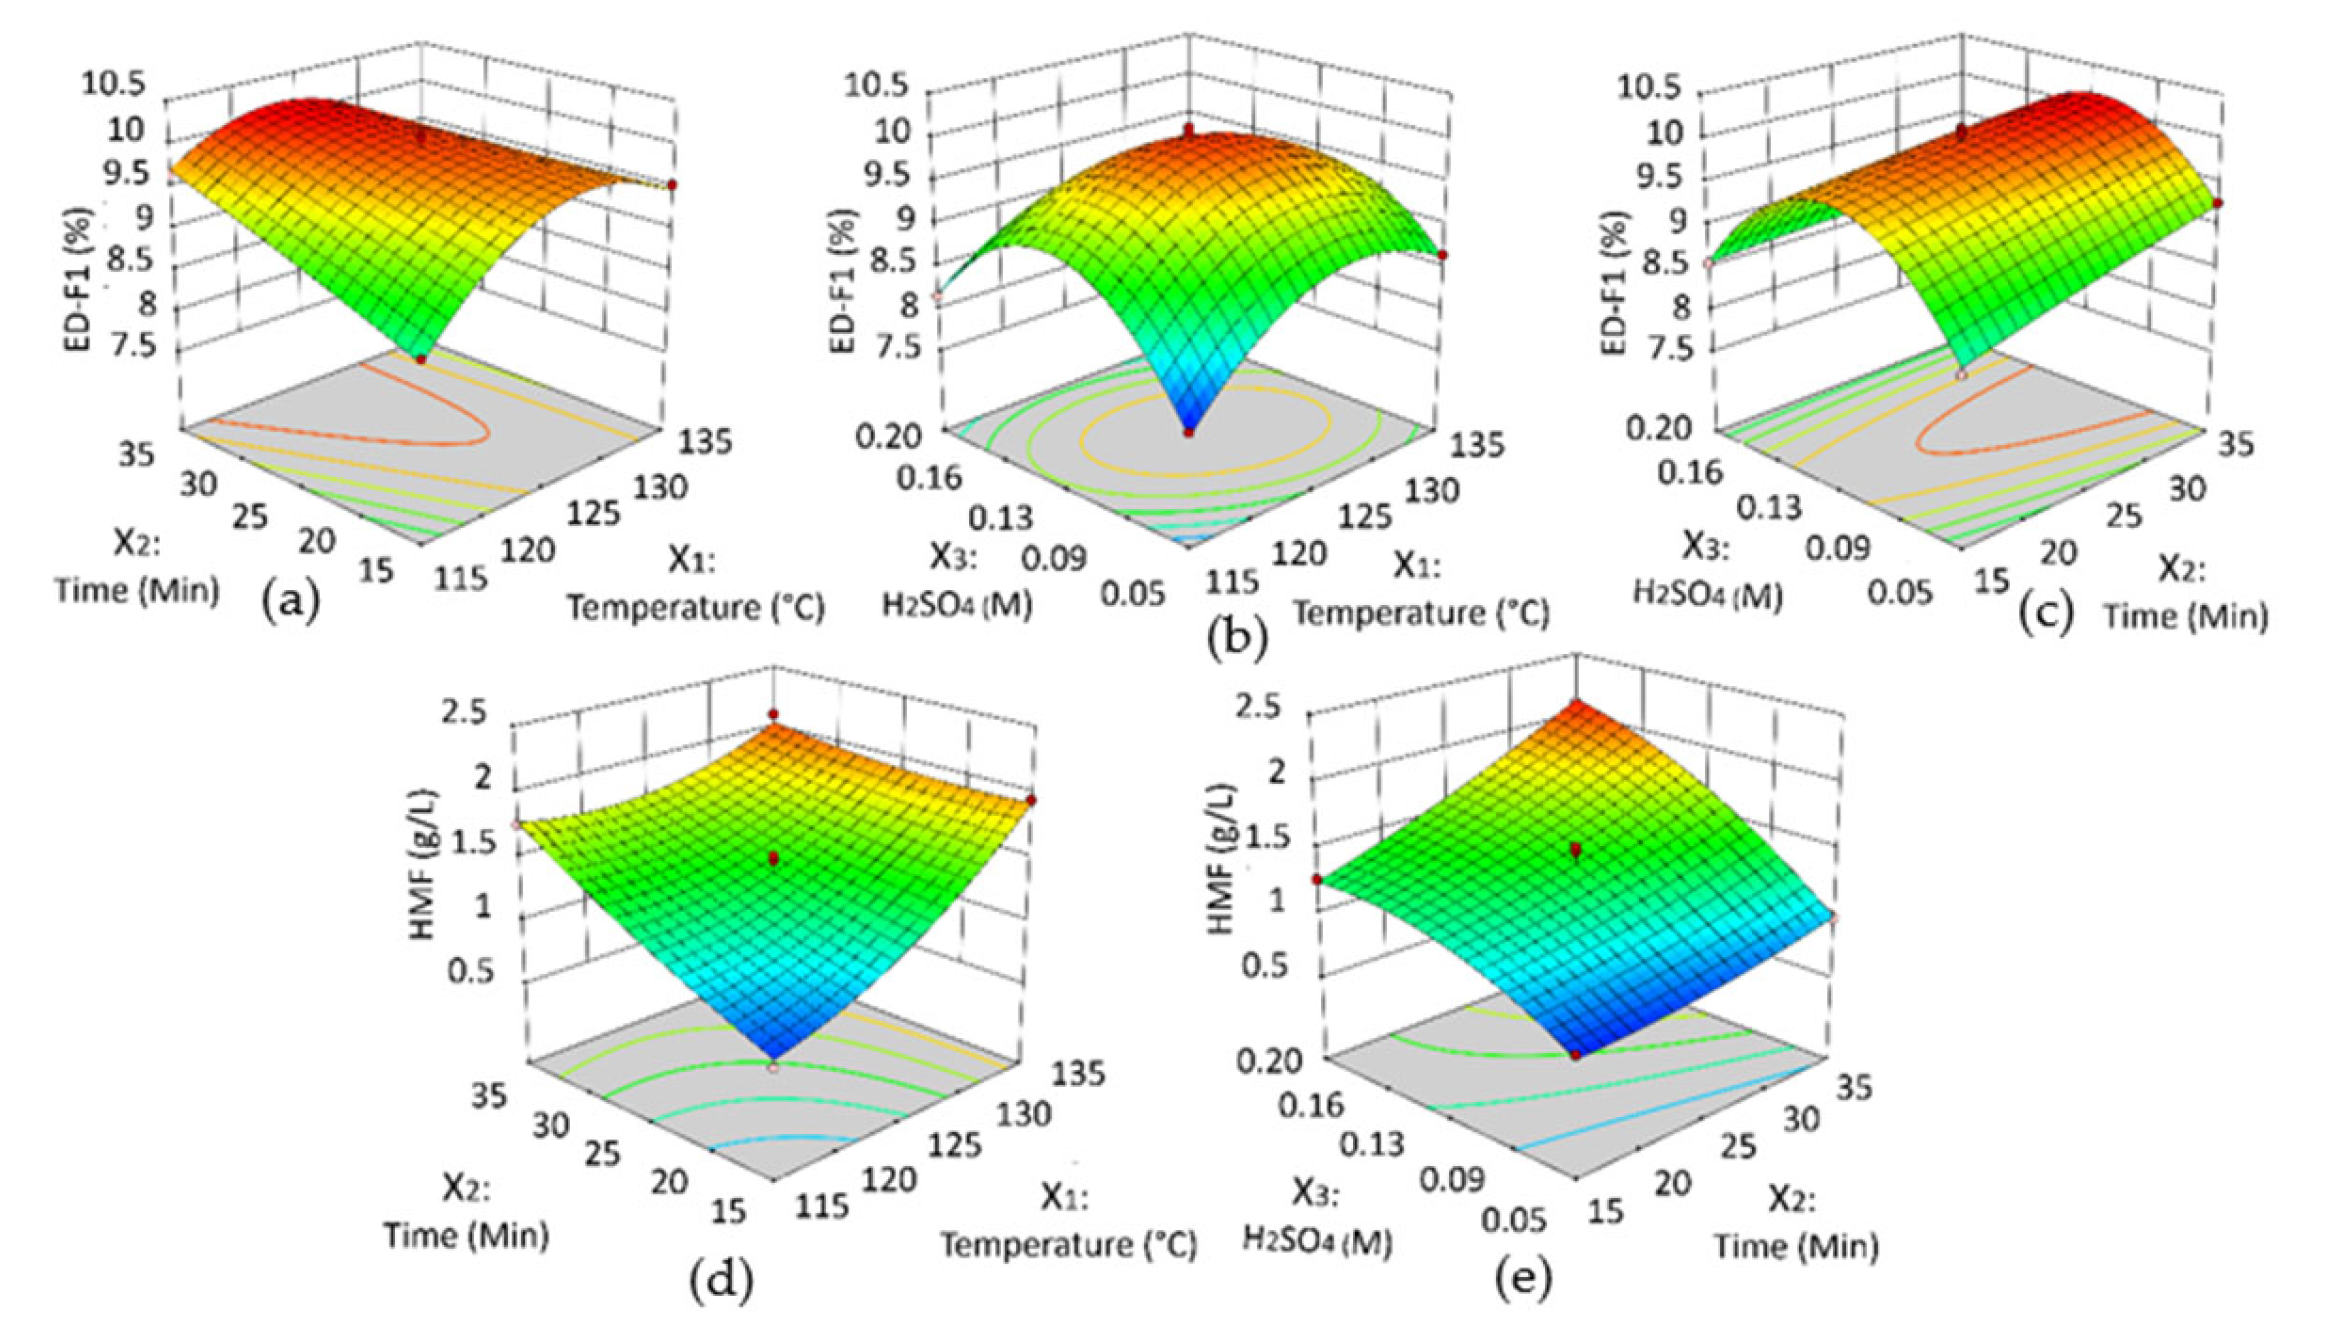
3.4. Effects of Hydrolysis Parameters on the Yield of Oligosaccharides Fraction ED-F1 and HMF By-Products

Based on Table 1, ED-F1 yield ranged from 7.65 to 10.11 g according to the changes in the levels of extraction parameters. The lowest yield was obtained under the conditions of X1: 135 °C, X2: 25 min and X3: 0.2 M H2SO4, while the highest yield was observed in X1: 125 °C, X2: 25 min and X3: 0.13 M H2SO4. Time of extraction (X2) (β: −0.216) exhibited the highest significance (p < 0.001) for the yield of ED-F1 as compared to both temperature (X1) (β: −0.098) and H2SO4 concentration (X3) (β: −0.121) (p < 0.05, respectively), while for the HMF production in the extraction liquor, all three parameters are equally significant (p < 0.001) with all positive values of the regression coefficients (Table 2). Positive regression coefficients imply that the increment of the parameter levels will have a direct proportion to the production of the product, vice-versa [54]. Interaction between any two parameters X1, X2 and X3 are highly significant to the yield of ED-F1 (p < 0.001), but on the opposite, interaction of X1-X3 is not significant for the formation of HMF. Similar occurrence was reported by [55] in optimizing the hydrolysis conditions for xylans from beech wood and corn cob. Their results indicated that temperature and time of hydrolysis plays a pivotal factor in the conversion of hemicelluloses to oligosaccharides using the minimum concentration of sulfuric acid, thus reducing the degradation of xylose monomers to furfural by-product.
Temperature and H2SO4 concentration also showed a significant effect on the hydrolysis yield of ED-F1 mainly with the temperature around 120–130 °C and H2SO4 concentration around 0.9–1.6 M (Figure 4). Temperatures below 120 °C and higher than 130 °C showed reduction in hydrolysis yield of ED-F1 which can be confirmed by the negative quadratic term of temperature in the reduced mathematical model. Similarly, H2SO4 concentration range below 0.09 M and higher than 0.16 M showed negative impact on ED-F1 yield. Subcritical temperatures beyond the boiling point of water with the addition of mild acid have been shown to efficiently reduce the hydrolysis time for a higher yield of oligosaccharide fraction. According to Wang et al. (2018), the highest yield (45.18%) of xylooligosaccharide (XOS) fraction using subcritical water with 1% (0.1 M) sulfuric acid from hemicellulose was the highest at 120 °C for 60 min [56]. Temperatures beyond 120 °C have been noted to produce more xylose monomers. This observation could be explained by the different hydrolysis rate constant of the substrate at different temperature and acid concentration that affects the scission of terminal-nonreducing bonds, interior glycosidic bonds and terminal-reducing C-O bonds; the chain length of the produced oligosaccharides and the constant have been shown to be proportionally related [57].

3.5. Validation of the Model and Optimal Extraction Condition of ED-F1 Oligosaccharide Fraction

Based on the response surfaces, the yield of ED-F1 is highly influenced by the hydrolysis parameters. Hence, it is important to get the most desirable parameter conditions to obtain the optimum ED-F1 yield. Since HMF production is directly proportional to the reduction of ED-F1, the goal is set to reduce the production of HMF in the extraction liquor. The reduced quadratic models were used to generate optimal hydrolysis conditions for ED-F1 oligosaccharide fraction yield and the values were 121 °C, 21 min and 0.12 M H2SO4 concentration (Table 3). The desirability value was close to 1 and calculated to be 0.844. All the hydrolysis parameters were set in range while the ED-F1 fraction yield and HMF concentration were both set at maximum and at minimum, respectively. The experimental validation of the mathematical model was performed in triplicate. The ED-F1 yield obtained through the optimization procedure was 11.15 ± 0.03 g/100 g dw. Both ED-F1 yield and HMF by-product produced values were close to the predicted by the mathematical model in optimal conditions with a low percentage of relative error (3.15% and 4.72%, respectively) reflects the adequacy of the developed quadratic models [52]. The optimization procedure increased the yield of ED-F1 by 31.41% compared to initial extraction and hydrolysis methods.

3.6. Characterization of ED-F1

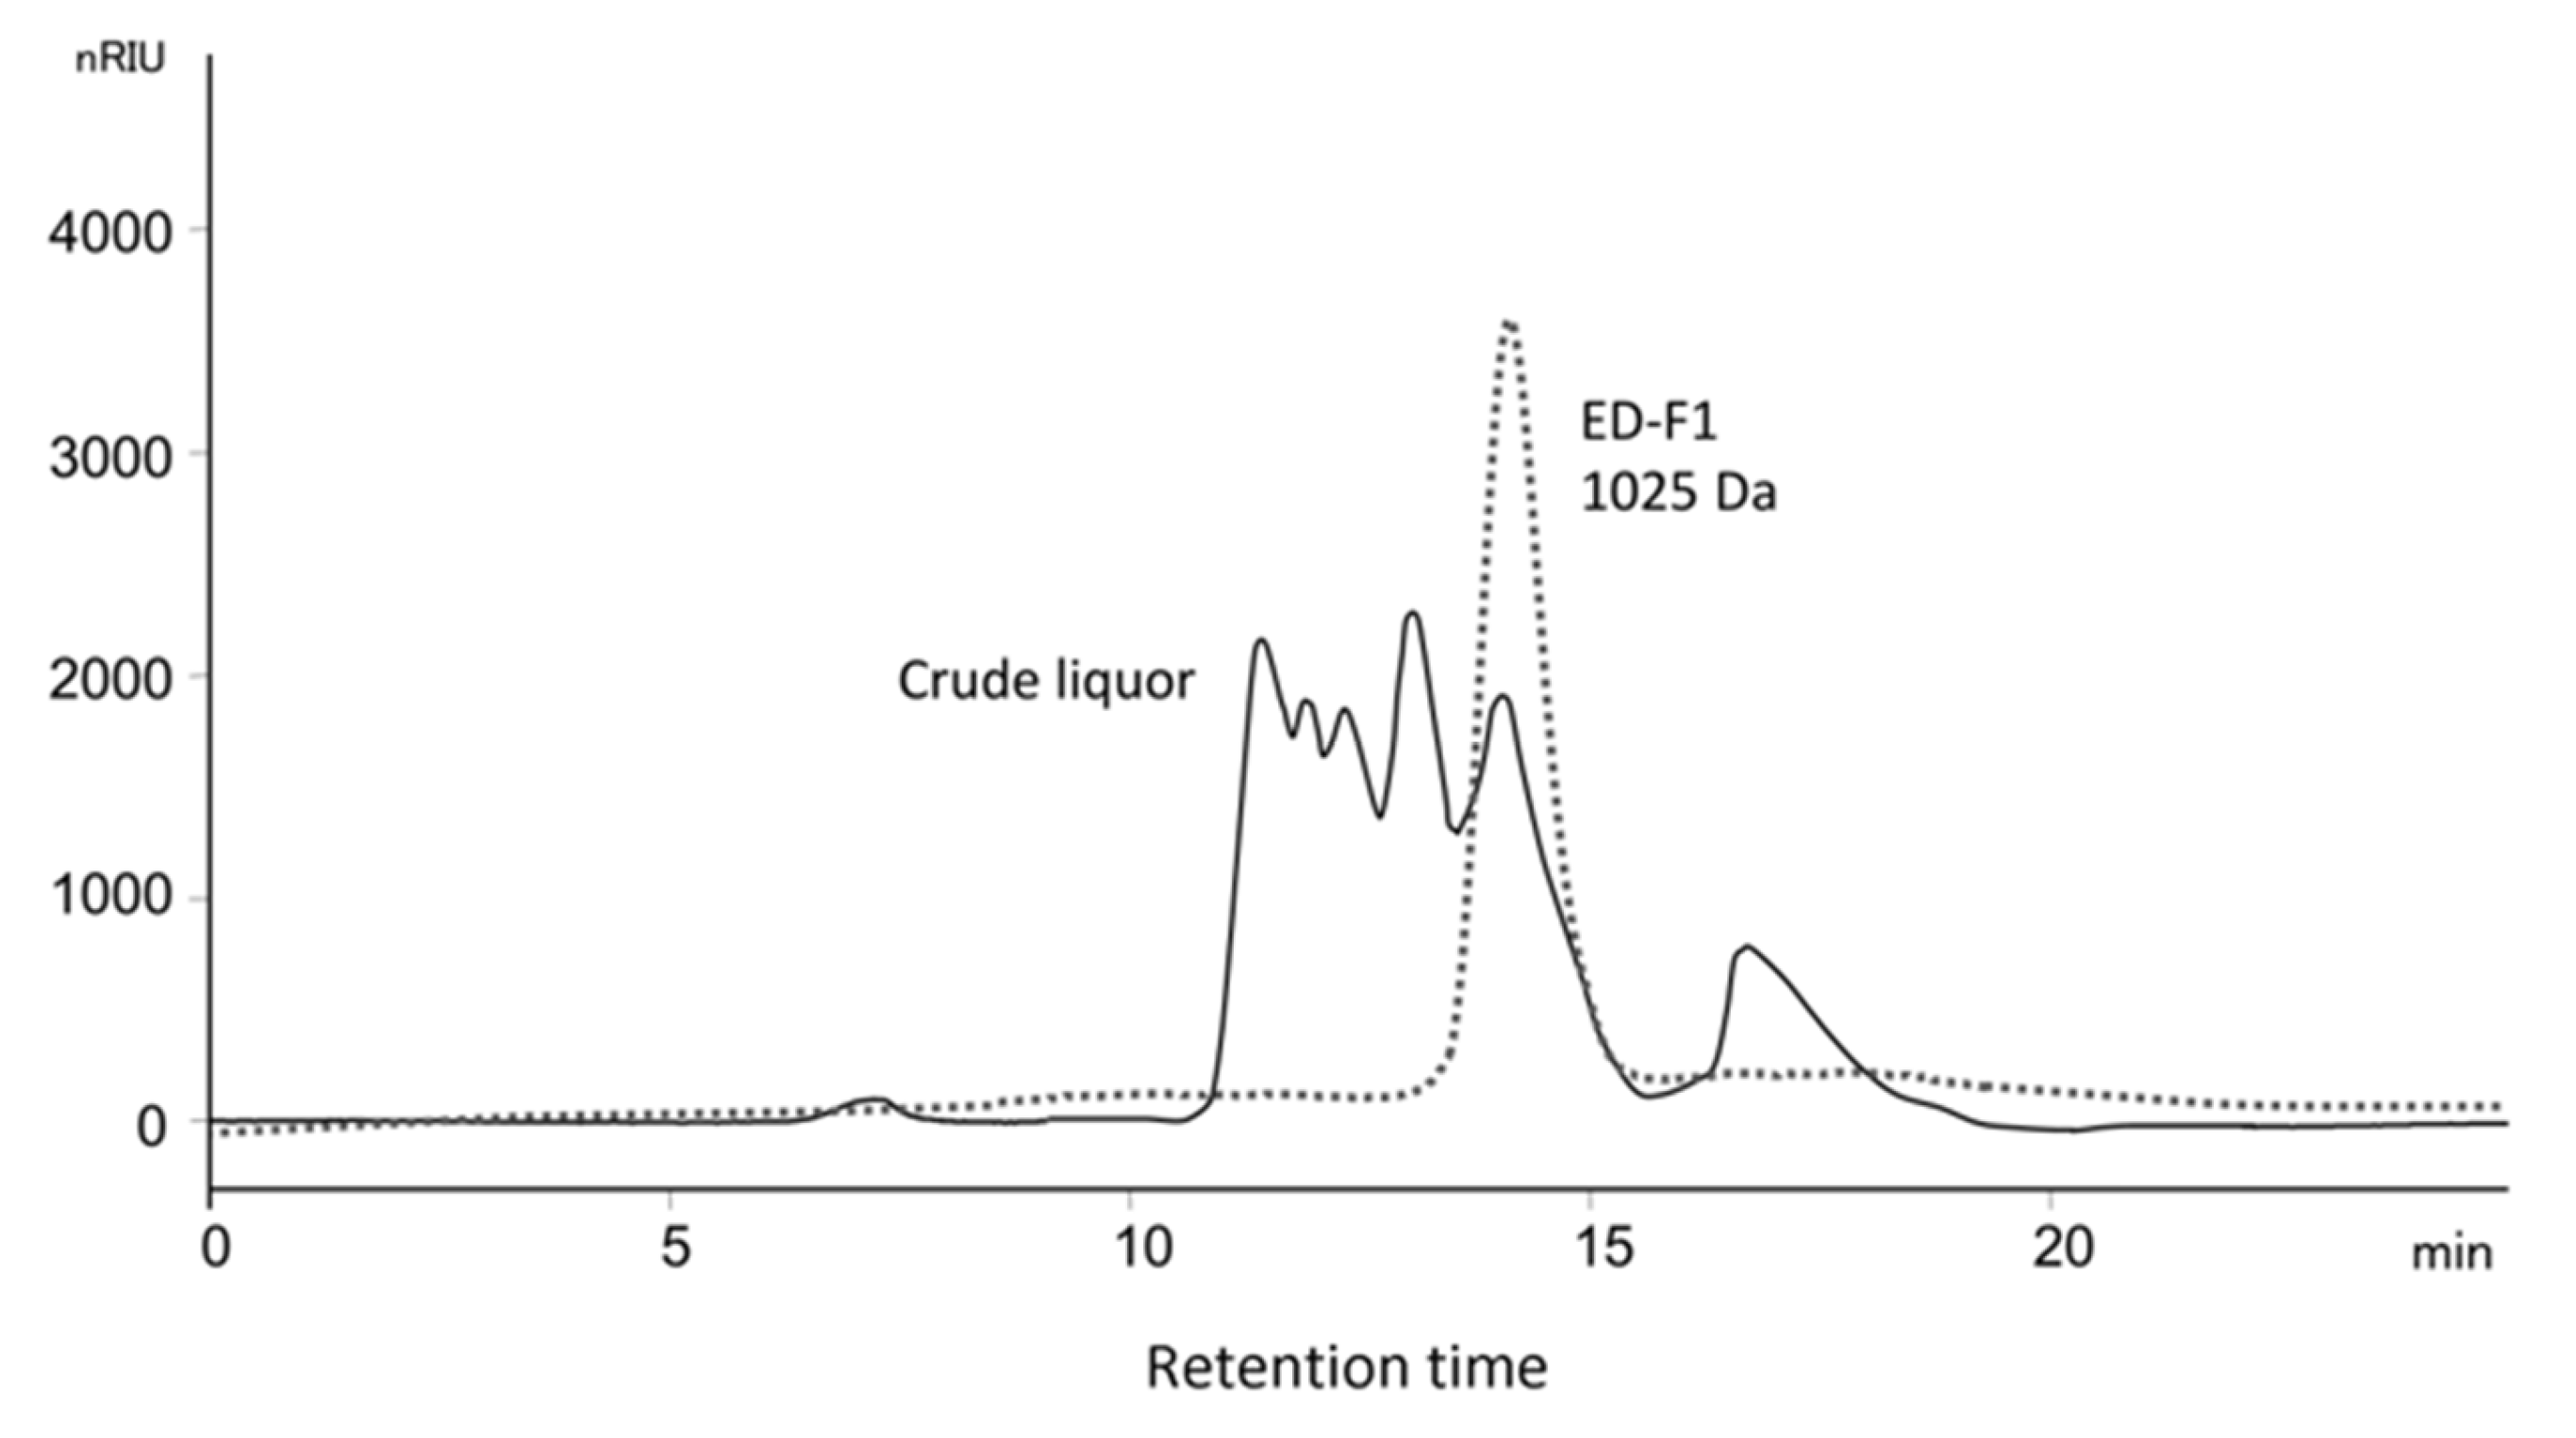
3.6.1. Size-Exclusion Chromatography

ED-F1 was subjected to HP-SEC to determine the homogeneity of the fraction as well as its molecular weight. Figure 5 shows a single symmetrical peak eluted at 13.84 min depicting that the sample is highly homogenous containing oligosaccharides of similar or close in terms of their molecular weight [58]. The regression equation obtained from the oligosaccharide and dextran standards was LogMW = −0.2252X + 6.1281 with a correlation coefficient (R2) of 0.9826. The average molecular weight was represented by Mw, and the elution time was represented by X. According to the equation, the average molecular weight of ED-F1 was calculated as 1.025 × 10³ Da. Low molecular weight manno-oligosaccharides and galacto-oligosaccharide (<1.0 KDa) was shown to promote the growth of Bifidobacteria and Lactobacilli in an in vitro fermentation [59]. Based on the earlier study, these low molecular weight oligosaccharides are easily metabolized in a pure culture study and efficiently being converted to lactate by Lactobacilli species. Oligosaccharides derived from agaran and carrageenan with the molecular weight in the range of 0.4–1.4 and 1.0–7.0 KDa has also been shown to promote the beneficial gut microflora of pigs namely Ruminococcaceae, Coprococcus, Roseburia, and Faecalibacterium [60].

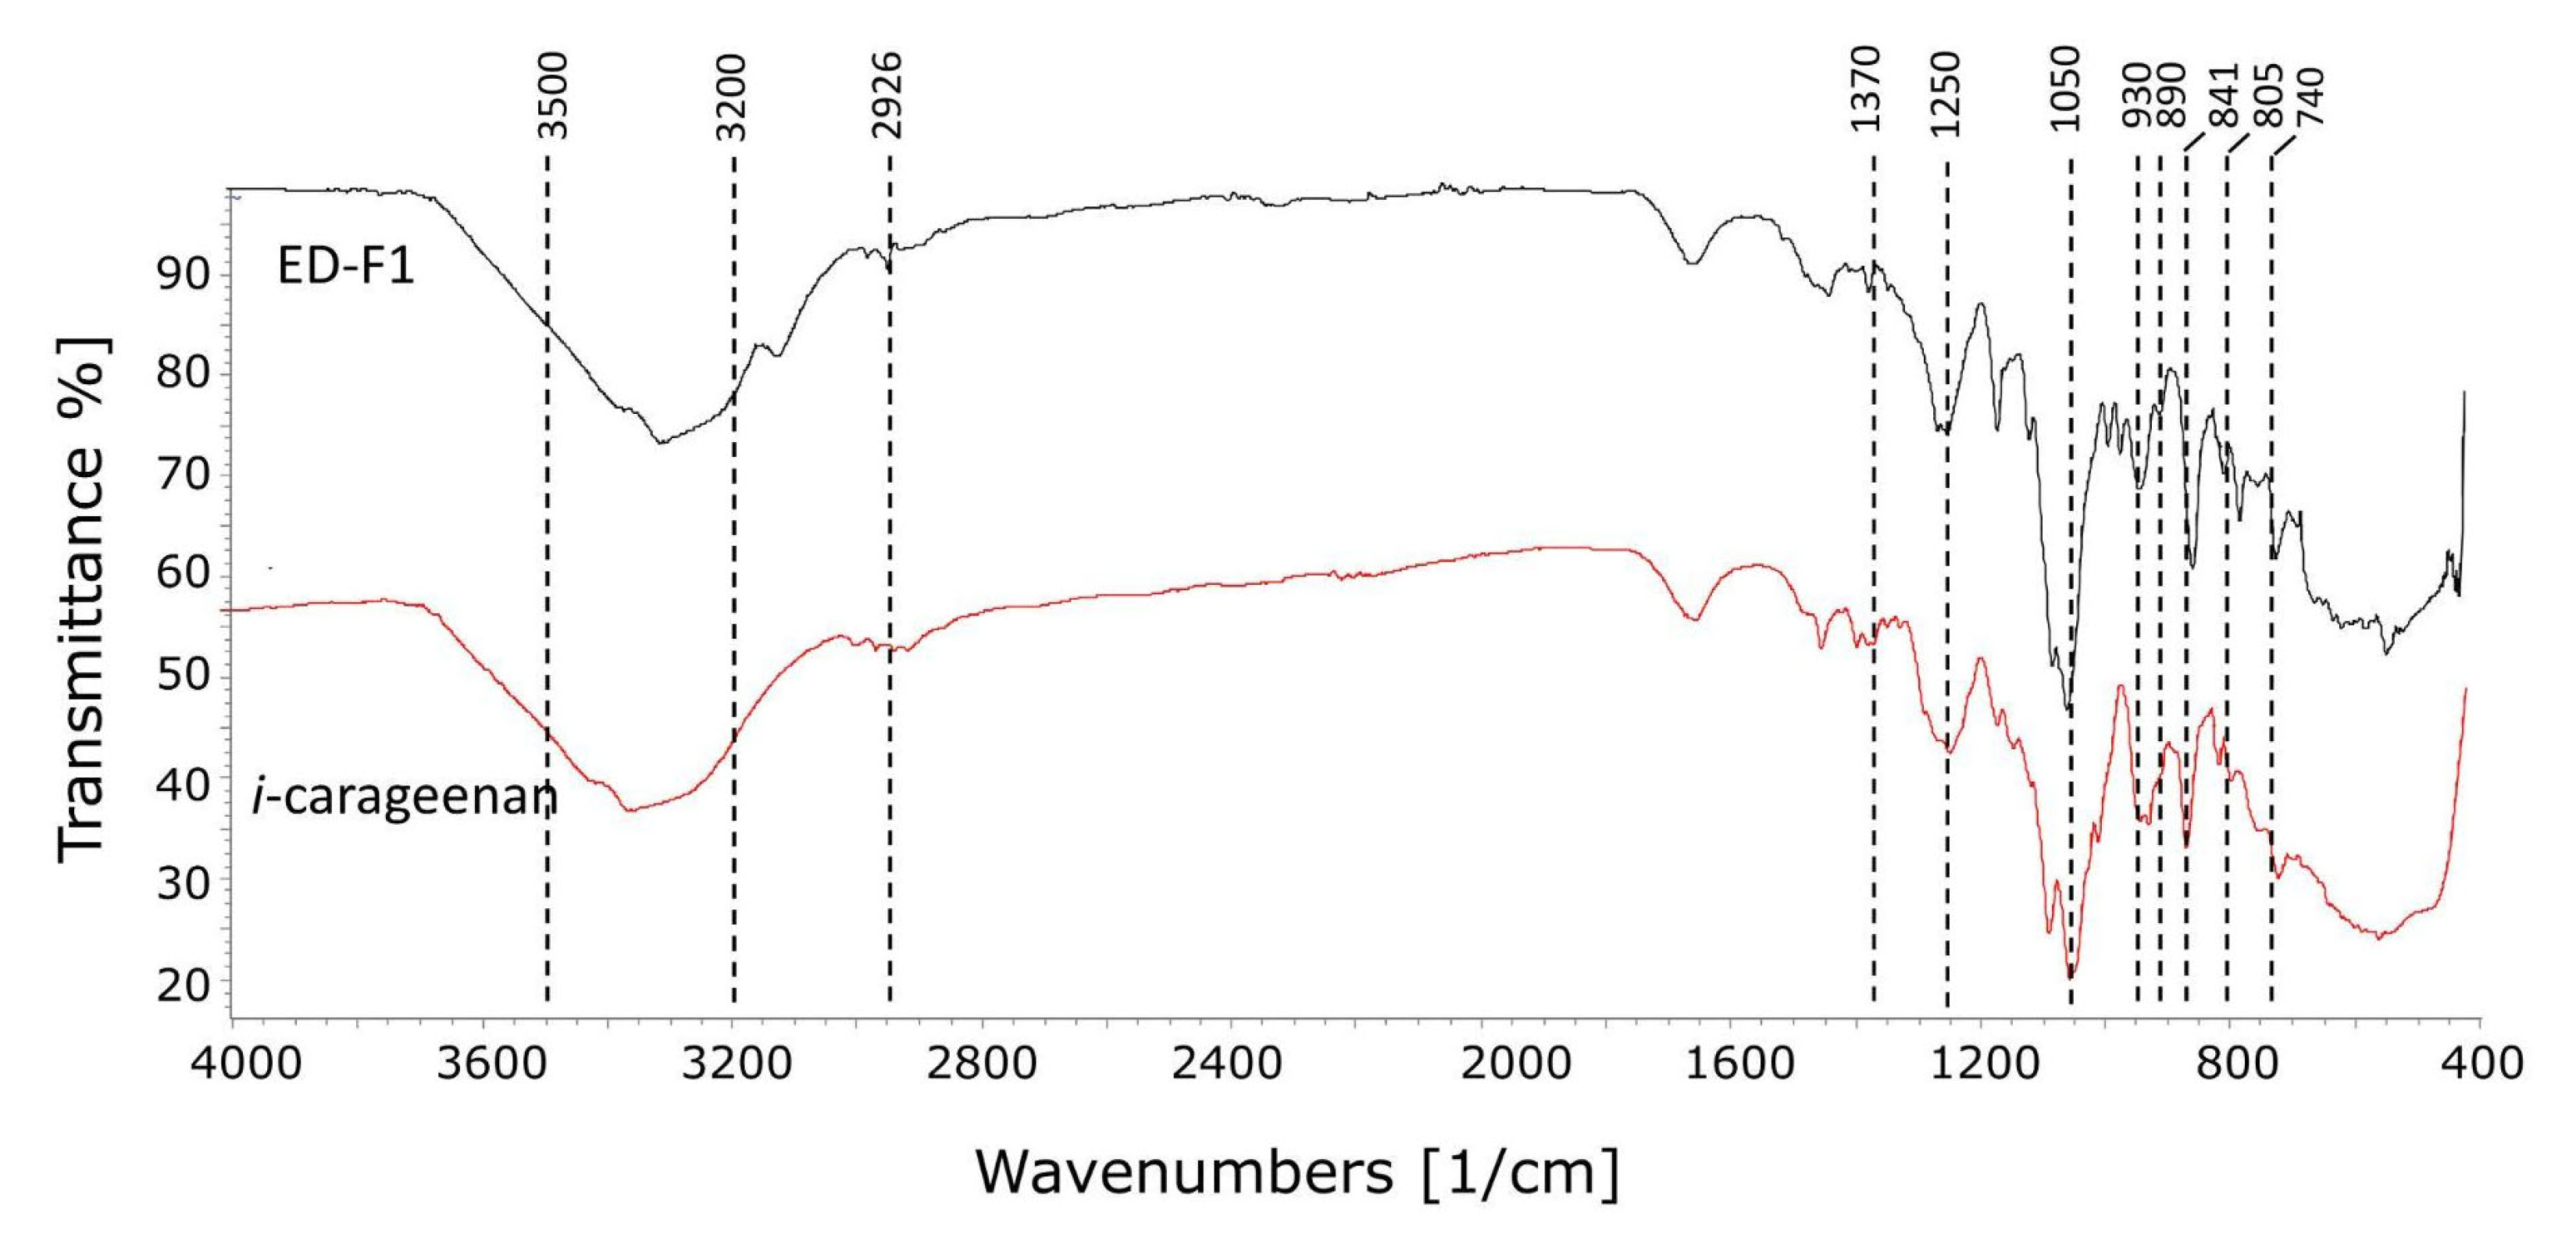
3.6.2. Fourier Transform Infrared Spectra Analysis

ED-F1 was subjected to FT-IR spectroscopy to determine the characteristic absorption bands and i-carrageenan was used as a standard. In both samples, two similar bands were observed in the 4000–2000 cm−1 region of the FT-IR spectra (Figure 6). The broad absorption appeared at 3200–3500 cm−1 represents hydrogen bonded O–H stretching vibrations while a weak signal at 2926 cm−1 is due to C–H stretching vibrations. The FT-IR absorption band observed around the region of 1075–1041 cm−1 was attributed to glycosidic linkages connecting sugar molecules and a common trait to all polysaccharides and oligosaccharides. The band around 930 cm−1 were ascribed to the vibration of C–O–C bridge of 3,6-anhydrogalactose. These bands were also observed in earlier studies in both agaro-oligosaccharides from enzymatic hydrolysis of agar [61], sulfated polysaccharides extracted from red seaweeds [62]. The 3,6-anhydrogalactose polymer unit is one of the unique features that distinguished agaran and carrageenan type oligosaccharides from other common seaweed derived polymer such as alginate type oligosaccharide [63,64]. However, the 930 cm−1 peak is known to be absent in both mu and lambda carrageenan as the C-O-C bridge is replaced by a sulfate group RO-SO3 [64].
Sulfation observed in ED-F1 was similar to the i-carrageenan standard designated at C4 of the galactose unit (841 cm−1) and C2 of the 3,6-anhydrogalactose (805 cm−1) [63]. A small peak near 1370 cm−1 also indicates the presence of sulfate groups in both samples. A broad IR peak was also observed between 1120 and 1270 cm−1 and is indicative of the S = O stretching vibration of sulfate groups on both sample [62]. A slightly higher intensity of 890 cm−1 peak was observed in ED-F1 but almost unobservable at i-carrageenan. This peak represents the stretching vibration of the anomeric C-H of unsulfated β-galactopyranosyl residues implying the presence of this residue in ED-F1 but very minimal in i-carrageenan. A previous study by [60] compared the prebiotic activity of sulfated and non-sulfated seaweed derived oligosaccharides namely alginate oligosaccharide, agaro- oligosaccharide and k-carrageenan oligosaccharides. Sulfated and non-sulfated oligosaccharides have been shown to have distinct effects on the gut microbiota in terms of the types of beneficial bacteria groups promoted, opportunistic pathogen population and production of different ratios of short chain fatty acids (SCFAs). Thus, the prebiotic efficacy of ED-F1 having both sulfated and non-sulfated β-galactopyranosyl residues in comparison with other either sulfated or non-sulfated marine oligosaccharides need further verification.

4. Conclusions

E. denticulatum seaweed has been shown to be a potential source of low molecular weight prebiotic oligosaccharides with the observed prebiotic activity scores of ED-F1 (against five different probiotic) that are significantly higher compared to a commercial prebiotic. Thermal hydrolysis with low acid concentration has been proven to be a suitable method to derive these prebiotic oligosaccharides from the macroalgae matrix. The temperature, time of hydrolysis and H2SO4 concentration significantly affected the hydrolysis of E. denticulatum cell matrix. Based on the regression coefficient and p-value of all models, time of hydrolysis (X2) was shown to be the most significant factor in determining the yield of ED-F1 oligosaccharide fraction while the further degradation towards the production of by-product HMF was equally affected all factors. Box–Behnken design and response surface methodology was successfully employed to optimize the hydrolysis procedure and the maximum yield of oligosaccharides ED-F1 fraction from E. denticulatum was derived under the following conditions: temperature 121 °C, time 21 min and 0.12 M H2SO4. The optimized parameter yielded 11.15 g of ED-F1 fraction per 100 g of dry seaweed material. Initial characterization of the fraction revealed a composition similar to a carrageenan type oligosaccharide. Results obtained from this study further support the possibility of utilizing an underutilized seaweed as a potential source of a functional ingredient in the food industry with a rapid hydrolysis and extraction process potentially applicable to other macroalgae species. However, further work needs to be done in order to identify individual oligosaccharide components within the fraction as well as their prebiotic efficacy in an animal model.

Author Contributions

Writing—original draft preparation, B.S.P.; conceptualization, methodology, supervision, F.Y.C.; writing—review and editing, C.K.S. and F.Y.C.; project administration and funding acquisition, F.Y.C. All authors have read and agreed to the published version of the manuscript.

Funding

This work was financially supported by the Ministry of Higher Education, Malaysia, Grant Number ERGS0039-STWN-1/2013.

Institutional Review Board Statement

Not applicable.

Informed Consent Statement

Not applicable.

Data Availability Statement

Not applicable.

Conflicts of Interest

The authors declare no conflict of interest.

References

  1. FAO. The State of World Fisheries and Aquaculture 2022. Towards Blue Transformation; FAO: Rome, Italy; Available online: https://www.fao.org/3/cc0461en/cc0461en.pdf (accessed on 4 July 2022).
  2. Chopin, T.; Tacon, A.G.J. Importance of seaweeds and extractive species in global aquaculture production. Rev. Fish. Sci. Aquac. 2021, 29, 139–148. [Google Scholar] [CrossRef]
  3. Gómez-Guzmán, M.; Rodríguez-Nogales, A.; Algieri, F.; Gálvez, J. Potential role of seaweed polyphenols in cardiovascular-associated disorders. Mar. Drugs 2018, 16, 250. [Google Scholar] [CrossRef] [Green Version]
  4. Shimoda, H. Seaweed fucoxanthin supplementation improves obesity parameters in mildlyobese Japanese subjects. J. Funct. Food Health Dis. 2017, 7, 246–262. [Google Scholar] [CrossRef]
  5. Lopes-Costa, E.; Abreu, M.; Gargiulo, D.; Rocha, E.; Ramos, A.A. Anticancer effects of seaweed compounds fucoxanthin and phloroglucinol, alone and in combination with 5-fluorouracil in colon cells. J. Toxicol. Environ. Health 2017, 80, 776–787. [Google Scholar] [CrossRef] [PubMed] [Green Version]
  6. Wu, S.; Zhang, X.; Liu, J.; Song, J.; Yu, P.; Chen, P.; Lio, Z.; Wu, M.; Tong, H. Physicochemical characterization of Sargassum fusiforme fucoidan fractions and their antagonistic effect against P-selectin-mediated cell adhesion. Int. J. Biol. Macromol. 2019, 15, 656–662. [Google Scholar] [CrossRef] [PubMed]
  7. Charoensiddhi, S.; Abraham, R.E.; Su, P.; Zhang, W. Chapter four-seaweed and seaweed-derived metabolites as prebiotics. In Advances in Food and Nutrition Research; Toldrá, F., Ed.; Academic Press: Cambridge, MA, USA, 2020; pp. 97–156. [Google Scholar] [CrossRef]
  8. Cherry, P.; Yadav, S.; Strain, C.R.; Allsopp, P.J.; McSorley, E.M.; Ross, P.; Stanton, C. Prebiotics from seaweeds: An ocean of opportunity? Mar. Drugs 2019, 17, 327. [Google Scholar] [CrossRef] [PubMed] [Green Version]
  9. Porse, H.; Rudolph, B. The seaweed hydrocolloid industry: 2016 updates, requirements, and outlook. J. Appl. Phycol. 2017, 29, 2187–2200. [Google Scholar] [CrossRef]
  10. Zhu, B.; Ni, F.; Xiong, Q.; Yao, Z. Marine oligosaccharides originated from seaweeds: Source, preparation, structure, physiological activity and applications. Crit. Rev. Food Sci. Nutr. 2020, 61, 60–74. [Google Scholar] [CrossRef]
  11. Seong, H.; Bae, J.-H.; Seo, J.S.; Kim, S.-A.; Kim, T.-J.; Han, N.S. Comparative analysis of prebiotic effects of seaweed polysaccharides laminaran, porphyran, and ulvan using in vitro human fecal fermentation. J. Funct. Foods 2019, 57, 408–416. [Google Scholar] [CrossRef]
  12. Antonio, M.S.; Andrea, S.; Nunziacarla, S.; Valbona, A.; Marilena, S.; Gioele, C. Gracilaria gracilis, source of agar: A short review. Curr. Org. Chem. 2017, 21, 380–386. [Google Scholar]
  13. Bajury, D.M.; Rawi, M.H.; Sazali, I.H.; Abdullah, A.; Sarbini, S.R. Prebiotic evaluation of red seaweed (Kappaphycus alvarezii) using in vitro colon model. Int. J. Food Sci. Nutr. 2017, 68, 821–828. [Google Scholar] [CrossRef]
  14. Chen, X.; Sun, Y.; Hu, L.; Liu, S.; Yu, H.; Xing, R.; Li, P. In vitro prebiotic effects of seaweed polysaccharides. J. Oceanol. Limnol. 2018, 36, 926–932. [Google Scholar] [CrossRef]
  15. Yang, C.; Lai, S.; Chen, Y.; Liu, D.; Liu, B.; Ai, C.; Wan, X.; Gao, L.; Chen, X.; Zhao, C. Anti-diabetic effect of oligosaccharides from seaweed Sargassum confusum via JNK-IRS1/PI3K signalling pathways and regulation of gut microbiota. Food Chem. Toxicol. 2019, 131, 110562. [Google Scholar] [CrossRef] [PubMed]
  16. Zhang, X.; Aweya, J.J.; Huang, Z.-X.; Kang, Z.-Y.; Bai, Z.-H.; Li, K.-H.; He, X.-T.; Liu, Y.; Chen, X.-Q.; Cheong, K.-L. In vitro fermentation of Gracilaria lemaneiformis sulfated polysaccharides and its agaro-oligosaccharides by human fecal inocula and its impact on microbiota. Carbohydr. Polym. 2020, 234, 115894. [Google Scholar] [CrossRef] [PubMed]
  17. Trincone, A. Short bioactive marine oligosaccharides: Diving into recent literature. Curr. Biotechnol. 2015, 4, 212–222. [Google Scholar] [CrossRef]
  18. Klinchongkon, K.; Khuwijitjaru, P.; Wiboonsirikul, J.; Adachi, S. Extraction of oligosaccharides from passion fruit peel by subcritical water treatment. J. Food Process Eng. 2017, 40, e12269. [Google Scholar] [CrossRef]
  19. You, Y.; Zhang, X.; Li, P.; Lei, F.; Jiang, J. Co-production of xylooligosaccharides and activated carbons from Camellia oleifera shell treated by the catalysis and activation of zinc chloride. Bioresour. Technol. 2020, 306, 123131. [Google Scholar] [CrossRef]
  20. Chen, Z.; Shen, N.; Wu, X.; Jia, J.; Wu, Y.; Chiba, H.; Hui, S. Extraction and quantitation of phytosterols from edible brown seaweeds: Optimization, validation, and application. Foods 2023, 12, 244. [Google Scholar] [CrossRef]
  21. Hosni, S.; Gani, S.S.A.; Orsat, V.; Hassan, M.; Abdullah, S. Ultrasound-assisted extraction of antioxidants from Melastoma malabathricum Linn, modeling and optimization using Box–Behnken design. Molecules 2022, 28, 487. [Google Scholar] [CrossRef]
  22. Zou, X.-G.; Chi, Y.; Cao, Y.-Q.; Zheng, M.; Deng, Z.-Y.; Cai, M.; Yang, K.; Sun, P.-L. Preparation process optimization of peptides from Agaricus blazei Murrill, and comparison of their antioxidant and immune enhancing activities separated by ultrafiltration membrane technology. Foods 2023, 12, 251. [Google Scholar] [CrossRef]
  23. Meinita, M.D.; Hong, Y.K.; Jeong, G.T. Comparison of sulfuric and hydrochloric acids as catalysts in hydrolysis of Kappaphycus alvarezii (cottonii). Bioprocess Biosyst. Eng. 2011, 35, 123–128. [Google Scholar] [CrossRef]
  24. Jiang, X.; Zhang, Z.; Chen, Y.; Zhenteng Cui, Z.; Liangen Shi, L. Structural elucidation and in vitro antitumor activity of a novel oligosaccharide from Bombyx batryticatus. Carbohydr. Polym. 2014, 103, 434–441. [Google Scholar] [CrossRef] [PubMed]
  25. Masuko, T.; Minami, A.; Iwasaki, N.; Majima, T.; Nishimura, S.; Lee, Y.C. Carbohydrate analysis by a phenol–sulfuric acid method in microplate format. Anal. Biochem. 2005, 339, 69–72. [Google Scholar] [CrossRef] [PubMed]
  26. Moniz, P.; Ho, A.L.; Duarte, L.C.; Kolida, S.; Rastall, R.A.; Pereira, H.; Carvalheiro, F. Assessment of the bifidogenic effect of substituted xylo-oligosaccharides obtained from corn straw. Carbohydr. Polym. 2016, 136, 466–473. [Google Scholar] [CrossRef]
  27. Huebner, J.; Wehling, R.L.; Hutkins, R.W. Functional activity of commercial prebiotics. Int. Dairy J. 2007, 17, 770–775. [Google Scholar] [CrossRef]
  28. De Andrade, J.K.; Komatsu, E.; Perreault, H.; Torres, Y.R.; Da Rosa, M.R.; Felsner, M.L. In house validation from direct determination of 5-hydroxymethyl-2-furfural (HMF) in Brazilian corn and cane syrups samples by HPLC–UV. Food Chem. 2016, 190, 481–486. [Google Scholar] [CrossRef] [PubMed]
  29. Altemimi, A.B.; Mohammed, M.J.; Yi-Chen, L.; Watson, D.G.; Lakhssassi, N.; Cacciola, F.; Ibrahim, S.A. Optimization of ultrasonicated kaempferol extraction from Ocimum basilicum using a box–Behnken design and its densitometric validation. Foods 2020, 9, 1379. [Google Scholar] [CrossRef]
  30. Sellimi, S.; Younes, I.; Ayed, H.B.; Maalej, H.; Montero, V.; Rinaudo, M.; Dahia, M.; Mechichi, T.; Hajji, M.; Nasri, M. Structural, physicochemical and antioxidant properties of sodium alginate isolated from a Tunisian brown seaweed. Int. J. Biol. Macromol. 2015, 72, 1358–1367. [Google Scholar] [CrossRef]
  31. Silchenko, A.S.; Rasin, A.B.; Kusaykin, M.I.; Kalinovsky, A.I.; Miansong, Z.; Changheng, L.; Malyarenko, O.; Zueva, A.O.; Zvyagintseva, T.N.; Ermakova, S.P. Structure, enzymatic transformation, anticancer activity of fucoidan and sulphated fucooligosaccharides from Sargassum horneri. Carbohydr. Polym. 2017, 175, 654–660. [Google Scholar] [CrossRef]
  32. Fournière, M.; Latire, T.; Lang, M.; Terme, N.; Bourgougnon, N.; Bedoux, G. Production of active poly- and oligosaccharidic fractions from Ulva sp. by combining enzyme-assisted extraction (eae) and depolymerization. Metabolites 2019, 9, 182. [Google Scholar] [CrossRef] [PubMed]
  33. Duong-Ly, K.C.; Gabelli, S.B. Salting out of proteins using ammonium sulfate precipitation. Methods Enzymol. 2014, 541, 85–94. [Google Scholar]
  34. Cosenza, V.A.; Navarro, D.A.; Stortz, C.A.; Ana, M.; Rojas, A.M. Rheology of partially and totally oxidized red seaweed galactans. Carbohydr. Polym. 2020, 230, 115653. [Google Scholar] [CrossRef] [PubMed]
  35. Zhang, S.; Hu, H.; Wang, L.; Liu, F.; Pan, S. Preparation and prebiotic potential of pectin oligosaccharides obtained from citrus peel pectin. Food Chem. 2018, 244, 232–237. [Google Scholar] [CrossRef] [PubMed]
  36. Praveen, M.; Karthika Parvathy, K.R.; Jayabalan, R.; Balasubramanian, P. Dietary fiber from Indian edible seaweeds and its in-vitro prebiotic effect on the gut microbiota. Food Hydrocoll. 2019, 96, 343–353. [Google Scholar] [CrossRef]
  37. Fuhren, J.; Schwalbe, M.; Peralta-Marzal, L.; Rosch, C.; Schols, H.A.; Kleerebezem, W. Phenotypic and genetic characterization of differential galacto-oligosaccharide utilization in Lactobacillus plantarum. Sci. Rep. 2020, 10, 21657. [Google Scholar] [CrossRef]
  38. Singh, B.P.; Vij, S. α-Galactosidase activity and oligosaccharides reduction pattern of indigenous lactobacilli during fermentation of soy milk. Food Biosci. 2018, 22, 32–37. [Google Scholar] [CrossRef]
  39. Zúñiga, M.; Yebra, M.J.; Monedero, V. Complex oligosaccharide utilization pathways in lactobacillus. Curr. Issues Mol. Biol. 2021, 40, 49–80. [Google Scholar] [CrossRef] [Green Version]
  40. Yoo, H.-U.; Ko, M.-J.; Chung, M.-S. Hydrolysis of beta-glucan in oat flour during subcritical-water extraction. Food Chem. 2020, 308, 125670. [Google Scholar] [CrossRef]
  41. Liu, X.; Zhang, Z.; Mao, H.; Wang, P.; Zuo, Z.; Gao, L.; Shi, X.; Yin, R.; Gao, N.; Zhao, J. Characterization of the hydrolysis kinetics of fucosylated glycosaminoglycan in mild acid and structures of the resulting oligosaccharides. Mar. Drugs 2020, 18, 286. [Google Scholar] [CrossRef]
  42. Sophonputtanaphoca, S.; Pridam, C.; Chinnak, J.; Nathong, M.; Juntipwong, P. Production of non-digestible oligosaccharides as value-added by-products from rice straw. Agric. Nat. Resour. 2018, 52, 169–175. [Google Scholar] [CrossRef]
  43. Wang, T.; Li, C.; Song, M.; Fan, R. Xylo-oligosaccharides preparation through acid hydrolysis of hemicelluloses isolated from press-lye. Grain Oil Sci. Technol. 2019, 2, 73–77. [Google Scholar] [CrossRef]
  44. Lin, Q.; Li, H.; Ren, J.; Deng, A.; Li, W.; Liu, C.; Sun, R. Production of xylooligosaccharides by microwave-induced, organic acid-catalyzed hydrolysis of different xylan-type hemicelluloses: Optimization by response surface methodology. Carbohydr. Polym. 2017, 157, 214–225. [Google Scholar] [CrossRef] [PubMed]
  45. Rungruangsaphakun, J.; Keawsompong, S. Optimization of hydrolysis conditions for the mannooligosaccharides copra meal hydrolysate production. 3 Biotech 2018, 8, 169. [Google Scholar] [CrossRef]
  46. Khodaei, N.; Karboune, S. Optimization of enzymatic production of prebiotic galacto/galacto(arabino)-oligosaccharides and oligomers from potato rhamnogalacturonan I. Carbohydr. Polym. 2018, 181, 1153–1159. [Google Scholar] [CrossRef]
  47. Xu, Y.; Shen, M.; Chen, Y.; Lou, Y.; Luo, R.; Chen, J.; Zhang, Y.; Li, J.; Wang, W. Optimization of the polysaccharide hydrolysate from Auricularia auricula with antioxidant activity by response surface methodology. Int. J. Biol. Macromol. 2018, 113, 543–549. [Google Scholar] [CrossRef] [PubMed]
  48. Yang, C.; Hu, C.; Zhang, H.; Chen, W.; Deng, Q.; Tang, H.; Huang, F. Optimation for preparation of oligosaccharides from flaxseed gum and evaluation of antioxidant and antitumor activities in vitro. Int. J. Biol. Macromol. 2020, 153, 1107–1116. [Google Scholar] [CrossRef] [PubMed]
  49. Danish, M.; Khanday, W.A.; Hashim, R.; Sulaiman, N.S.B.; Akhtar, M.N.; Nizami, M. Application of optimized large surface area date stone (Phoenix dactylifera) activated carbon for rhodamin B removal from aqueous solution: Box-Behnken design approach. Ecotoxicol. Environ. Saf. 2017, 139, 280–290. [Google Scholar] [CrossRef]
  50. Manmai, N.; Unpaprom, Y.; Ramaraj, R. Bioethanol production from sunflower stalk: Application of chemical and biological pretreatments by response surface methodology (RSM). Biomass Convers. Biorefin. 2021, 11, 1759–1773. [Google Scholar] [CrossRef]
  51. Savic-Gajic, I.M.; Savic, I.M.; Nikolic, V.D. Modelling and optimization of quercetin extraction and biological activity of quercetin-rich red onion skin extract from Southeastern Serbia. J. Food Nutr. Res. 2018, 57, 15–26. [Google Scholar]
  52. Fawzy, M.A.; Gomaa, M. Optimization of citric acid treatment for the sequential extraction of fucoidan and alginate from Sargassum latifolium and their potential antioxidant and Fe(III) chelation properties. J. Appl. Phycol. 2021, 33, 2523–2535. [Google Scholar] [CrossRef]
  53. Guo, Z.; Zhao, B.; Li, H.; Miao, S.; Zheng, B. Optimization of ultrasound-microwave synergistic extraction of prebiotic oligosaccharides from sweet potatoes (Ipomoea batatas L.). Innov. Food Sci. Emerg. Technol. 2019, 54, 51–63. [Google Scholar] [CrossRef]
  54. Prasad, S.; Malav, M.K.; Kumar, S.; Singh, A.; Pant, D.; Radhakrishnan, S. Enhancement of bio-ethanol production potential of wheat straw by reducing furfural and 5-hydroxymethylfurfural (HMF). Bioresour. Technol. Rep. 2018, 4, 50–56. [Google Scholar] [CrossRef]
  55. Beckendorff, A.; Lamp, A.; Kaltschmitt, M. Optimization of hydrolysis conditions for xylans and straw hydrolysates by HPLC analysis. Biomass Convers. Biorefin. 2021. [Google Scholar] [CrossRef]
  56. Wang, Y.; Cao, X.; Zhang, R.; Xiao, L.; Yuan, T.; Shi, Q.; Sun, R. Evaluation of xylooligosaccharide production from residual hemicelluloses of dissolving pulp by acid and enzymatic hydrolysis. RSC Adv. 2018, 8, 35211–35217. [Google Scholar] [CrossRef] [PubMed] [Green Version]
  57. Ebikade, E.; Lym, J.; Wittreich, G.; Saha, B.; Vlachos, D.G. Kinetic studies of acid hydrolysis of food waste-derived saccharides. Ind. Eng. Chem. Res. 2018, 57, 17365–17374. [Google Scholar] [CrossRef]
  58. He, B.-L.; Zheng, Q.-W.; Guo, L.-Q.; Huang, J.-Y.; Yun, F.; Huang, S.-S.; Lin, J.-F. Structural characterization and immune-enhancing activity of a novel high-molecular-weight polysaccharide from Cordyceps militaris. Int. J. Biol. Macromol. 2020, 145, 11–20. [Google Scholar] [CrossRef] [PubMed]
  59. Wei, X.; Fu, X.; Xioa, M.; Liu, Z.; Zhang, L.; Mou, H. Dietary galactosyl and mannosyl carbohydrates: In-vitro assessment of prebiotic effects. Food Chem. 2020, 329, 127179. [Google Scholar] [CrossRef]
  60. Han, Z.-L.; Yang, M.; Fu, X.-D.; Chen, M.; Su, Q.; Zhao, Y.-H.; Mou, H.-J. Evaluation of prebiotic potential of three marine algae oligosaccharides from enzymatic hydrolysis. Mar. Drugs 2019, 17, 173. [Google Scholar] [CrossRef] [PubMed] [Green Version]
  61. Kang, O.L.; Yong, P.F.; Ma’aruf, A.G.; Osman, H.; Nazaruddin, R. Physicochemical and antioxidant studies on oven-dried, freeze-dried and spray-dried agaro-oligosaccharide powders. Int. Food Res. J. 2014, 21, 2363–2367. [Google Scholar]
  62. Fernando, I.; Sanjeewa, K.; Samarakoon, K.W.; Lee, W.W.; Kim, H.S.; Kang, N.; Ranasinghe, P.; Lee, H.S.; Jeon, Y.J. A fucoidan fraction purified from Chnoospora minima; a potential inhibitor of LPS-induced inflammatory responses. Int. J. Biol. Macromol. 2017, 104, 1185–1193. [Google Scholar] [CrossRef] [PubMed]
  63. Duan, F.; Yu, Y.; Liu, Z.; Tian, L.; Mou, H. An effective method for the preparation of carrageenan oligosaccharides directly from Eucheuma cottonii using cellulase and recombinant κ-carrageenase. Algal Res. 2016, 1, 93–99. [Google Scholar] [CrossRef]
  64. Pereira, G.A.; Arruda, H.S.; Molina, G.; Pastore, G.M. Extraction optimization and profile analysis of oligosaccharides in banana pulp and peel. J. Food Process Preserv. 2017, 42, e13408. [Google Scholar] [CrossRef]
Figure 1. E. denticulatum low molecular weight oligosaccharide fractions obtained through anion exchange chromatography (DEAE-Sepharose® Fast Flow).
Applsci 13 01517 g001
Figure 2. Prebiotic activity score of E. denticulatum fractions obtained through anion exchange chromatography (ED-F1, ED-F2, ED-F3) compared against commercial prebiotic Fibrulose (F97) and a negative control (Cellulose).
Applsci 13 01517 g002
Figure 3. The yield of ED-F1 fraction and HMF by-product as affected by (a) hydrolysis temperature, (b) hydrolysis time and (c) H2SO4 concentration.
Applsci 13 01517 g003
Figure 4. Three-dimensional response surface plots showing the effects of temperature, time and H2SO4 on ED-F1 yield (ac) and HMF (d,e).
Applsci 13 01517 g004
Figure 5. E. denticulatum ED-F1 fraction observed under size-exclusion chromatography (HP-SEC).
Applsci 13 01517 g005
Figure 6. FT-IR spectroscopy of E. denticulatum ED-F1 fraction in comparison with i-carrageenan standard (4000–400 cm−1).
Applsci 13 01517 g006
Table 1. Box–Behnken experimental design layout and observed responses of oligosaccharide fraction yield (ED-F1) and HMF by-product.
Independent Variables 1Responses 2
Std.
Order
X1
Temperature (°C)
X2
Time (Min)
X3
H2SO4 (M)
ED-F1 Yield (g/100 g)HMF (g/L)
1115 (−1)15 (−1)0.13(0)8.580.67
2135 (+1)15 (−1)0.13(0)9.521.94
3115 (−1)35 (+1)0.13(0)9.641.75
4135 (+1)35 (+1)0.13(0)9.122.10
5115 (−1)25 (0)0.05 (−1)7.780.64
6135 (+1)25 (0)0.05 (−1)8.641.28
7115 (−1)25 (0)0.2 (+1)8.151.50
8135 (+1)25 (0)0.2 (+1)7.652.14
9125 (0)15 (−1)0.05 (−1)8.410.73
10125 (0)35 (+1)0.05 (−1)9.260.96
11125 (0)15(−1)0.2 (+1)8.551.26
12125 (0)35 (+1)0.2 (+1)8.772.10
13125 (0)25 (0)0.13(0)9.861.36
14125 (0)25 (0)0.13 (0)10.111.47
15125 (0)25 (0)0.13 (0)9.851.35
16125 (0)25 (0)0.13 (0)10.051.51
17125 (0)25 (0)0.13 (0)9.871.32
1 X 1 Temperature: hydrolysis temperature; X2 Time: hydrolysis time and X3 H2SO4: sulfuric acid concentration. 2 ED-F1: E. denticulatum fraction 1; HMF: 5-hydroxymethyl furfural.
Table 2. Regression coefficients for the polynomial model for oligosaccharides hydrolysis from E. denticulatum.
Regression Coefficients 1
Model ParametersED-F1 YieldHMF
Full Quadratic ModelReduced
Quadratic Model
Full Quadratic ModelReduced
Quadratic Model
Intercept9.979.985.885.88
X1-Temperature (°C)−0.098 *−0.098 *0.72 ***0.72 ***
X2-Time (Min)−0.216 ***−0.216 ***0.39 ***0.39 ***
X3-H2SO4 (M)−0.121 *−0.121 *1.37 ***1.37 ***
X1X2−0.365 ***−0.365 ***0.23 **0.23 **
X1X3−0.34 ***−0.34 ***−0.23-
X2X3−0.158 ***−0.158 ***−0.0063 *−0.0063 *
X12−0.722 *0.722 *0.90 **0.90 **
X22−0.029-−0.043-
X32−1.19 ***−1.19 ***−1.05 **−1.05 **
Polynomial model
F value
p value
98.47
0.0012
121.19
<0.0001
41.18
<0.0001
58.16
<0.0001
Lack of fit
F value
p value
0.804
0.553
0.6738
0.6443
0.472
0.718
0.464
0.789
Standard deviation0.1080.1030.10.095
R20.99220.99180.98150.9784
Mean9.059.051.411.41
Adjusted R20.98210.98360.95760.9616
Coefficient of variation (CV)(%)1.191.147.106.77
Predicted R20.94520.96070.9010.926
Adeq precision27.52230.389420.46624.02
1 ED-F1: E. denticulatum fraction 1; HMF: 5-hydroxymethyl furfural. *** p < 0.001, ** p < 0.01, * p < 0.05.
Table 3. Validation of conditions for the optimum yield of ED-F1.
Optimum Conditions 1Responses 2Desirability = 0.844
Temperature (°C)
(In range)
Time (Min)
(In range)
H2SO4 (M)
(In range)
PredictedActual% Relative error
121210.12ED-F1 Yield (g/100 g)
(Maximize)
10.8111.15
±0.03
3.15
HMF (g/L) (Minimize)1.061.11
±0.08
4.72
1 X1 Temperature: hydrolysis temperature; X2 Time: hydrolysis time and X3 H2SO4: sulfuric acid concentration. 2 ED-F1: E. denticulatum fraction 1; HMF: 5-hydroxymethyl furfural.
Disclaimer/Publisher’s Note: The statements, opinions and data contained in all publications are solely those of the individual author(s) and contributor(s) and not of MDPI and/or the editor(s). MDPI and/or the editor(s) disclaim responsibility for any injury to people or property resulting from any ideas, methods, instructions or products referred to in the content.

