
Scour Detection with Monitoring Methods and Machine Learning Algorithms—A Critical Review

1
Department of Civil Engineering, University of Minho, ISISE, 4800-058 Guimarães, Portugal
2
School of Civil Engineering, University College Dublin, D04 V1W8 Dublin, Ireland
*
Author to whom correspondence should be addressed.
Appl. Sci. 2023, 13(3), 1661; https://0-doi-org.brum.beds.ac.uk/10.3390/app13031661
Submission received: 5 December 2022
/
Revised: 20 January 2023
/
Accepted: 23 January 2023
/
Published: 28 January 2023
(This article belongs to the Special Issue Novel Approaches for Structural Health Monitoring II)
Abstract
:Foundation scour is a widespread reason for the collapse of bridges worldwide. However, assessing bridges is a complex task, which requires a comprehensive understanding of the phenomenon. This literature review first presents recent scour detection techniques and approaches. Direct and indirect monitoring and machine learning algorithm-based studies are investigated in detail in the following sections. The approaches, models, characteristics of data, and other input properties are outlined. The outcomes are given with their advantages and limitations. Finally, assessments are provided at the synthesis of the research.
1. Introduction and Background—Scour Identification Approaches
Scour is one of the most common causes of bridge collapse. Bridge collapses cause large numbers of fatalities and financial losses. Therefore, the vulnerability of bridges to scour should be assessed and adequate actions should be taken. Piers, abutments, foundations, and piles at risk of scour could be protected from scour by taking countermeasures (with backfills, sheet piles, sacrificial piles, etc.) and repairing damaged elements (using ripraps, splitter plates, etc.) before global damage occurs. However, even after the bridges are properly protected against scour, it is important to continue monitoring the scouring condition. For several reasons, scour detection is a complex task; diving inspections to identify scouring are relatively dangerous. Underwater conditions complicate the implementation and maintenance of scour depth measurement devices. Moreover, hydraulic scour models are dependent on various parameters and there are still unsolved modeling issues caused by scaling and sediment gradation [1]. Traditional empirical scour formulas do not result in very accurate predictions of scour depths. To overcome this complex task to detect and locate scour, various methods have been developed. This review paper mainly focuses on a detailed assessment of scour monitoring and machine learning (ML)-based scour identification methods with relevant recent studies. However, an introduction with brief explanations of other scour detection approaches is provided as well. This section includes underwater inspections, empirical formulas, hydraulic and representative scour modeling, experimental studies, and probabilistic scour detection methods.
To begin with, empirical studies are one of the former scour detection and scour depth estimation methods [2,3,4,5]. These former studies were based on extracting scour length formulas using laboratory experimental results or field measurements. The relationship between flow velocity and duration, depth of charge, bed material properties, sediment movement, and substructure geometric properties on maximum local scour depth of piers and abutments or stresses in the riverbed were aimed to be quantified. Some of the scour formulas used are 65-1, 65-2 (Chinese), Melville-Sheppard, MBW, Hydraulic Engineering Circular No. 18 (HEC-18), Dey and Barbhuiya [6], and Muzammil [7].
Underwater inspections could be classified as eye inspections and equipment-based ones. In the eye inspection, the divers go through a difficult and dangerous search and a detailed examination report is prepared. During underwater inspections, the human eye might fail to detect scour. Ground-penetrating radars, water-penetrating radars, SONAR, and some specific laser systems are examples of equipment-based underwater examinations. Penetrating radars in boats of floating units emit electromagnetic waves and receive echoes from the soil. In one of the latest studies in this field, the researchers mapped the bathymetric profile (water depths and sediment thicknesses) of a river bed in North Ireland and managed to detect scour holes around upstream piers using a water-penetrating radar [8]. On the other hand, another study aimed to quantify scour depths in a river in Switzerland with a gravel bed and find the relationship between the subsurface and the structure of the riverbed using a ground-penetrating radar [9]. The researchers detected a four-meter-deep scour hole that could not be detected by bathymetric (water-based) surveys. Moreover, SONAR is another technology for collecting underwater images and therefore can help detect scour holes. A recent and successful study managed to locate and measure scour depths by combining SONAR data and a deep convolutional network [10]. Furthermore, it was revealed that although it performs worse in high turbidity, green laser technology was able to detect scour around bridge piers in an economic and safe way [11].
The scour development process and how it is affected by the flow, bed material characteristics, and geometry of the scoured elements have been investigated by hydraulic model-based studies. [2] is a sample study examining the non-cohesive sediment’s movement in sloping and [12] is another study where the fundamentals of the scour development process and mathematical modeling of flows around bridge piers/piles, below pipelines, and other structures such as groins, breakwaters, and seawalls were examined. According to a former study [13] the basic idea behind scour development was believed to be the horseshoe vortex system [14]. Later, the whole turbulence scheme was shown to be the most important eroding flow process; horseshoe vortex is only an element of this scheme and the whole pattern also consists of downflow and acceleration of the discharge around the sides of the pier [10]. Experimental studies have been used to test the effects of different layouts, shapes of piers, and flow parameters on scour [3,4,15,16]. Scour in clear water and accumulations around hexagonal arrays of emergent circular cylinders for various solid portions and an orientation of cylinders that resulted in less scour than an individual large pile was proposed [15]. Another study measured the complex turbulent discharge for different fluid velocities, Reynold shear stresses, and the density of the horseshoe vortex [4]. There were also studies on perpendicular wall abutments [5] investigating how channel width, shape, sediment dimensions, flow depths, and abutment lengths affect pier and abutment scour.
Furthermore, there have been studies that simulate scour instead of building a hydraulic model that directly represents it. To identify scour, mode shape ratio, apparent profile, Eigen frequencies, and decentralized modal analysis methods were adopted by various studies, namely [17], [18], and [19]. These studies did not aim to obtain scour depth but rather to detect its presence by identifying changes in the dynamic properties of the structure as an index that reveals the existence of scour. Alternatively, to evaluate the performance of scour-critical bridges, a soil–pile–structure interaction analysis was performed [20]. Some researchers have validated their approaches with experiments, [21,22,23] and therefore gathered more trusted results. Many studies with scour indexes were explained in detail in Section 2.1.1 with their approaches, model features, and outcomes.
Finally, there are probabilistic approaches that overcome the uncertainties of deterministic approaches summarized above. Uncertainties of scour identification problems include insufficiencies of visual inspections, assumptions, and estimations of parameters (geometric properties, hydraulic parameters, etc.). Since the accuracy of the deterministic models is highly dependent on the input, these might lead to over or underestimation of scour. Probabilistic scour models investigate the probability of structural failure under scour [24,25,26,27,28]. The limit state function is defined as the residual resistance of the structure after load effects are compensated; where load, resistance, and therefore limit state function are dependent on random variables [28]. To solve the probabilistic failure problem, there are different types of reliability methods, for example risk-based, numerical, approximation, and semi-probabilistic designs [28]. Changing environmental conditions such as climate change effects might invalidate initial assumptions and cause unexpected rainfall regimes, floods, and therefore scour issues. The effects of such uncertainty, i.e., gradual change of flow properties was investigated by [24] and probabilistic scour failure analysis was performed. The researchers statistically analyzed the maximum annual flow of a UK river and aimed to predict local pier scour with Monte Carlo simulation. Simultaneous gradual increments of flow variability and the mean of the flow resulted in the greatest scour depth predictions. Another study investigated scour around a complex bridge pier and adopted a reliability analysis with an optimization method with a semi-probabilistic design [25]. Using this method, these researchers developed a safety factor to reach the desired safety level of the foundation design. Additionally, their sensitivity analysis revealed that pier width and correction factor were the most effective variables on the reliability of bridge pier against scour. A very remarkable uncertainty is caused by the memory effects, i.e., the accumulated scouring effects throughout the long service life of bridges [26]. Using a Markovian approach, scour depth changes aimed to be observed and scour depth domain was decomposed into multiple discrete states for various flood events. The research showed that after the first years of prediction, in time, the probabilistic scour depth distribution evolved and reached a stationary value [26]. The probabilistic local scour analysis of a bridge pier in a clay and sand mixture sediment was performed in five different reliability methods [27]. These simulation-based methods were line sampling, subset simulation, importance sampling, Monte Carlo simulation, and directional simulation. The most accurate results were obtained through subset simulation.
2. Conventional Monitoring-Based and Machine Learning-Based Methods to Identify Scour
Both machine learning and conventional monitoring approaches are based on measured or simulated data. However, the way of processing the input data creates the main difference between these two approaches. Conventional methods require the creation of models, whereas machine learning methods eliminate the need of knowing the relationship between input and output [29]. Even though it is possible to generate simulated signals, field (full-scale) measurements provide more realistic information. Hence, many different types of sensors have been developed to collect signals. Sensors used for signal monitoring were classified under three main categories: kinematic, ambient, and mechanical property collectors [30]. Kinematic properties are accelerations, velocities, and displacements; ambient properties include features such as temperature, wind, and soil permeability; while mechanical properties are strain, stress, and shear/bending/torsional deformations. Accelerometers, strain gauges, and displacement gauges are the most widely-used monitoring sensors. Narrowing down to sensors to monitor scour was explained under the two following main clusters [31]: the ones using devices that measure the depth and those utilizing changes in the dynamic properties of the structure. They listed depth monitoring devices as follows:
- Single-use devices;
- Pulse or radar devices;
- Fiber Bragg grating sensors;
- Buried or data-driven equipment;
- Sound wave appliances;
- Electrical conductivity devices.
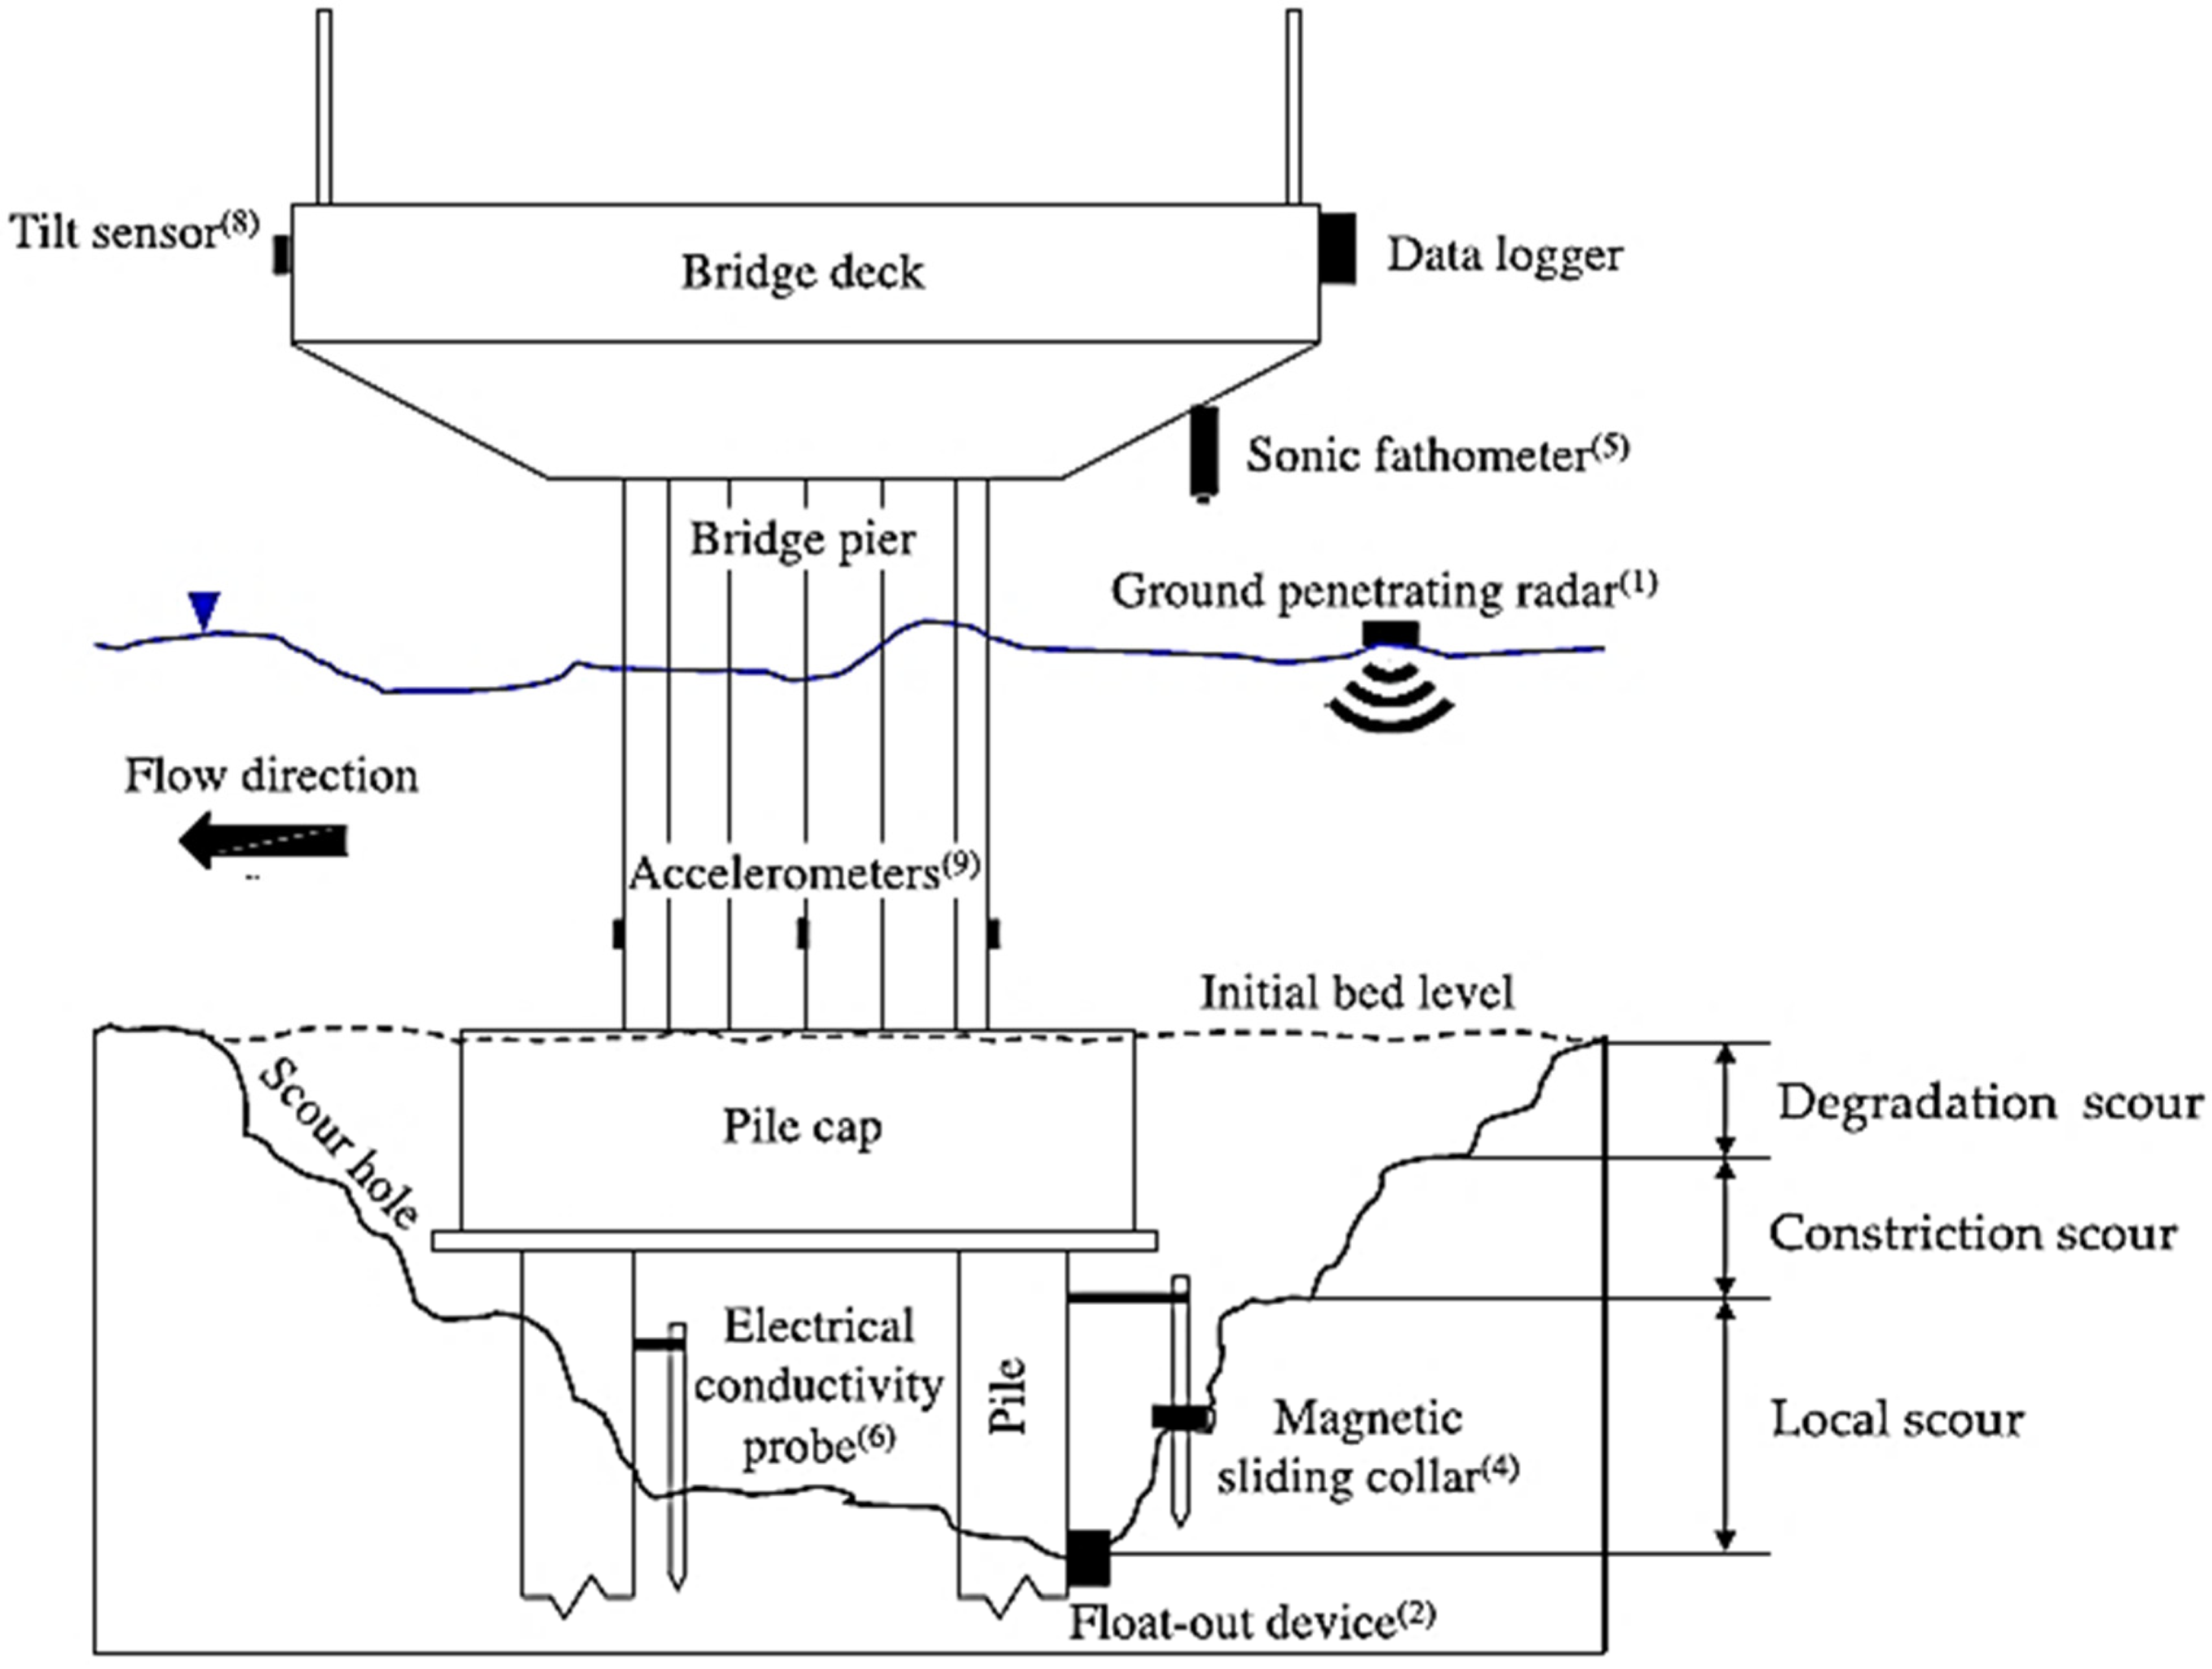
They noted that accelerometers and tiltmeters were some of the sensors that use changes in the dynamic properties of the bridge. Bridge scour monitoring devices were visualized in Figure 1 [32]. With developing technology, monitoring devices have improved and alternative systems have been generated. A Scour Monitoring Decision Framework was developed, which was based on software [33]. This framework assisted the Minnesota Department of Transportation engineers to determine the most adequate fixed scour monitoring equipment for the specific bridge they were working on. It decreased potential issues related to the sensor chosen by the user and supplied warnings on the occasion of abnormal scour activity in the field. One of the recent experimental monitoring studies investigated the consequences of scour for bridge frequencies [34]. The outcomes of the theoretical model corresponded with the laboratory outcomes. The numerical background of another study was used to decide the location of the sensors and the limitations of the railway bridge monitoring [35].
Data collection systems include several other elements rather than sensor technology. The main elements when instrumenting a data acquisition scheme were listed as [36]:
- Sensors;
- Sensor data collection topologies;
- Wireless connection;
- Power supply;
- Synchronizing the data obtained from a set of sensors;
- Environmental effects and data;
- Collection and processing systems.
The data collection system has to be adequately implemented according to the structure and service conditions. For large-scale bridges, locating, implementing, and maintaining sensors should be well planned since some parts of the structure could be inaccessible, such as the deck bottom of the suspension bridges. Although indirect monitoring techniques do not interrupt service conditions, for direct monitoring systems, service conditions are important factors to be considered. There can be time restrictions during the day or parts of the structure that cannot be closed to service for data acquisition. After obtaining data through sensors, wireless connections are used to transfer signals. Wireless sensing units were leveled up when combined with low-cost mobile devices and these units are still being developed for better software and hardware [37].
The following sections explain the methods, properties, and main outcomes of conventional monitoring-based and machine learning-based studies. For conventional monitoring-based studies, the databases searched were Google Scholar and Scopus and a total of 168 studies were screened. After applying the exclusion criteria, 22 studies remained. For machine learning-based studies, the databases searched were Web of Science and Scopus. A total of 38 elements were screened. Applying the exclusion criteria, this resulted in 14 studies.
The eligibility criteria applied were:
- Academic papers published in the recent years;
- Written in English;
- Aiming to detect bridge scour, not other types of damage;
- Scour detection methods were monitoring or ML-based.
2.1. Methods, Properties, and Main Outcomes of Studies
2.1.1. Cluster 1—Conventional Monitoring-Based Approaches to Detect Scour
Table 1 provides the type of monitoring, numerical approach, and dynamic structural property addressed, and the presence of experimental/field data in the studies. Descriptions of direct and direct monitoring systems, technical information about the sensors, and analysis methods used in the studies in Table 1 are explained in this section.
Scour monitoring could be classified under direct and indirect methods [38]. In direct monitoring, structural parts of the bridge are equipped with sensors. The sensors are fixed while in indirect monitoring, the vehicle passing over the structure is instrumented with measurement devices, i.e., sensors are moving. Indirect or so-called drive-by monitoring utilizes the responses of the sensors on the vehicles to extrapolate the condition of the bridge [38]. These responses (measurements) could be accelerations, displacements, or speed. There are some challenges of direct monitoring as well as its major advantages of ensuring improvement in public safety early risk detection and minimizing downtime [39]. There are some disadvantages. Direct monitoring is not suitable for all applications, the whole scheme is costly, and there are some undesired implications such as high maintenance costs. This was where indirect monitoring became more advantageous since it was found to be more economical, independent from the features of the structural system to be assessed, and provided maintenance-friendly measurements. The indirect monitoring technique is also known as drive-by monitoring and enables scour identification without any traffic interruptions to the railway or highway operations on the bridge. In direct monitoring, signals are obtained from structure form input data, while signals of single run or multiple vehicle batches are products of indirect monitoring. To extract the dynamic properties of the bridge, data were processed with numerical approaches. Utilizing displacements of a beam which were found from a vehicle–bridge interaction finite element model was aimed to calculate the distribution of the flexural rigidities throughout the length retrospectively [40]. They also sought to estimate the damage level of the bridge. For detecting damage, it is also possible to eliminate the dependence on reference signals from a healthy bridge. Another study focused on monitoring analyzed the difference between right and left accelerations of the train (i.e., roll component) which occurred in the presence of deformation, to prove the imbalance in the bridge behavior [41].

Table 1.
List of monitoring-based scour detection studies.
| Monitoring Type | Study Reference | Numerical Method and Sensor Technology | Presence of Experimental Cases /Field Tests |
|---|---|---|---|
| Direct | [42] | Mode Shape Ratio | None |
| [43] | Vibration energy harvesting device | Yes | |
| [44] | Hilbert Huang Transform | Yes | |
| [45] | Fiber Optic Sensors | Yes | |
| [46] | Eigen frequency | None | |
| [47] | Frequency Domain Decomposition | None | |
| [17] | |||
| [23] | Decentralized modal analysis | Yes | |
| [48] | Frequency analysis of piezoelectric rod sensors | ||
| [49] | Yes | ||
| [50] | |||
| [51] | Unmanned Aerial Vehicle using smart rocks | Yes | |
| [31] | Smart probes instrumented with electromagnetic sensors | ||
| [52] | Yes | ||
| [53] | Micro energy harvesters | None | |
| [54] | Horizontally-displaced mode shapes and changes in dynamic flexibility | Yes | |
| [55] | Unmanned Aerial Vehicle-based smart rock | Yes | |
| Indirect | [56] | Wavelet transformation | None |
| [37] | |||
| [57] | |||
| [18] | Eigen frequency | None | |
| [19] | Closed-form mode shape derivation | Yes |
The studies listed in Table 1 use numerous sensors. Accelerometers were located at the mid-spans and piers of the bridges. Signals from the superstructure of the bridge were collected using velocity sensors to reveal the dynamic features of scour [55]. Their experimental setup consisted of inclinometers, a camera, a level transmitter, and a wireless transmitter as well. As the flow continued, the velocity sensors sensed vibrations and the inclinometer showed the angle of tilt during scour. Besides accelerometers and velocity sensors, piezoelectric rods, electromagnetic sensors, micro-electro-mechanical systems (MEMS), vibrational power generators, optic sensors (image tracking), and permittivity change of the soil were utilized for the detection of scour. When the water flowed, the buried piezoelectric rods were subjected to hydrodynamic effects resulting in vibrations that created voltage in the rods [48]. A frequency domain analysis of the voltage–time history of the rod will result in the length. As sediment moves away, the length of the rod increases and this is felt through the change in the frequency. The difference between the initial and instantaneous length will give scour depth. Moreover, unconstrained distributed fiber optic sensors are one of the recent technologies used for investigating scour. In the research of [45], fibers deform freely under water flow. Deformation changes are detected by ultra-weak fiber Bragg grating which is written in the optical fiber. Since temperature changes at pier at an elevation of around 10 meters below water are slow and small, the central wavelength of the fiber is only affected by the altered strains, i.e., deformations of the fiber. Differences in central wavelength changes give scour length. Some innovative researchers used innovative technology, i.e., smart rocks for scour monitoring. [51,55]. Based on the theory of the magnetic field, developed algorithms were able to find the locations of the rocks, which were rolled down into scour holes. The proposed system for scour monitoring of other studies [31,52] had a probe with an integrated electromagnetic sensor that identifies different dielectric permittivity values of the soil that surround the foundation of the bridge. Using the frequency of the oscillators implemented in the sensors, measuring the capacitance which only changes with the dialectic property of the soil around them was proven possible [33]. The monitoring system of [53] on the other hand, consisted of MEMS harvesters to detect pier scour, which gathered energy from environmental energy sources to produce electricity. Further expiation of the authors about these micro energy harvesters revealed that depending on the frequency change induced by the oscillation of the electrode, having the rent as output was possible and the frequency was detected via a small wireless apparatus.
There are many various transformation methods to decompose signals gathered from different sensors. Fourier transform is one of the most common signals processing methods in a frequency domain analysis. Fourier integrals containing the Fourier transform represent non-periodic (arbitrarily changing) excitations [58]. Direct Fourier transform equals the o multiplication of the Fourier transform and complex frequency response function. To obtain a response in the time domain, inverse Fourier transform is applied. Fourier transform is best applied to stationary and transient signals since it results in average frequency [59]. Hilbert spectrum is also an amplitude in the frequency–time domain; however, it is used for processing non-stationary signals as well. [50]. [60] indicates one of the most significant features of the Hilbert transform—it could detect frequency response nonlinear effects. Since applying the Hilbert transform to the frequency response of a linear structure regenerates the original frequency response, any distortion could be an indicator of non-linearity. The Frequency Domain Decomposition method [61] identifies very close and repeated modes. [47] stated that the approach also makes the extrapolation of dynamic parameters possible with no information about excitation in the beginning. After calculating the continuous wavelet transform matrix from raw data, singular values and singular vectors are the products of the singular value decomposition used to find damping ratios, frequencies, and mode shapes [62]. Wavelet transformations were defined as visual tools to assess signals more easily and the computation of these transformations is a prerequisite when a signal will be modified selectively or its pattern will be sought [63]. A wavelet function has zero mean, changes with a dimensionless time parameter, and is located in both time and frequency domains, while the convolution of discrete sequence with the translated and scaled status of the wavelet transformation was defined as continuous wavelet transformation [64]. The selection of the wavelet transformation is important. A decentralized modal analysis is engaging the sectors of mode shapes which are computed at distinct sensor locations [65,66,67]. The sensors were accelerometers in the research of [23] and mode shape amplitudes were computed using Frequency Domain Decomposition explained above. Eigenvalue analysis is performed to obtain mode shapes, amplitudes, and frequencies of the system. [58] noted that since this method includes a large computational volume in a large number of degrees of freedom systems, efficient algorithms were generated in time. Solutions for the eigenvalue problem were categorized under vector iteration, transformation, and polynomial iteration methods.
All the studies listed in Table 1 have numerical models except for [49]. There were a lot of studies focused on using accelerations of the bridge to identify scour. They adopted different frequency analysis methods to interpret acceleration signals to obtain mode shapes or frequencies and finally set a scour index to identify scoured cases. In [42], the Mode Shape Ratio was applied to acceleration signals and utilized as an indicator of scour. Acceleration signals of two points on the bridge were used to gather amplitudes of mode shapes. Mode shape ratio was the ratio of these amplitudes. Energy harvesting devices were used in [43], which produce electricity from piezoelectric material’s strain changes. These were used to identify scour-based frequency shifts of the bridge. [46] and [18] investigated the influence of scour at different points on eigen frequencies. To obtain mode shapes from acceleration signals of the structure, [47] and [17] used the Frequency Domain Decomposition method. Without information on the input motion, it was possible to evaluate the dynamic parameters in this method. Decentralized modal analysis enabled [23] to derive the modal amplitudes of sensors at different locations. To detect bridge pile scour, [54] utilized the change of the shape of horizontally-displaced modes and flexibility deformations of a frame-type bridge. Continuous wavelet transformation of a signal was utilized to process acceleration signals in the research of [56], [57], and [37]. By comparing responses to the features of a base wavelet, this method could detect transient changes in frequency signals [68]. To process acceleration signals, [19] proposed a closed-form model derivation. Based on instantaneous amplitudes calculated for a target bridge frequency, mode-shape squares were obtained and a damage index was computed.
Direct Monitoring-Based Studies
This section includes main properties and outcomes only direct monitoring-based studies listed in Table 1. In Table 2, devices, sensing mechanisms, the methods of sensor signal processing, and the target property of the direct monitoring studies. Additionally, scour validation tests, and experiments on real bridges are tabulated here. The assessments, outcomes of the studies, performance, and efficiencies are provided at the end of this section.
The research listed in Table 2 mainly focused on the monitoring device they used. [49], [50], [48], [44], and [45] aimed to measure scour depth with the sensors they used. [52] monitored sediment deposition processes. On the other hand, [44] searched for the rigid body motions of the piles and piers, using velocity sensors. [51] and [55] tried to locate and track the movement of smart rocks they deployed along the scour hole. Vertical displacement of the rock into the hole revealed the depth of scour. Direction known and unknown smart rocks induced the distribution of the electromagnetic field and their locations were detected through an unmanned aerial vehicle, equipped with a locating algorithm. [45] preferred a spiral shape since this geometry brings the sensing points of the fiber optic sensor closer and to obtain a higher spatial resolution. Adjusting the number of rings around the piers changes the scour monitoring range along the length. Fibers are supported by the pier only in two points so that they can freely deform and so central wavelength differences can be obtained clearly.
Studies that are not tabulated in Table 2 are those having a finite element model to represent the bridge and piers. [43], [47], [17] [46], [31], [53], and [54] represented the bridge superstructure (deck and beams) with Euler-Bernoulli beams. Springs were assumed for the piers and the foundations beneath them. Different spring stiffnesses corresponded to different stages of scour. In their studies, [23] and [42] also included vehicles in their finite element models, i.e., vehicle–bridge interaction models. Vehicles were modeled as rigid masses and were connected with springs and dampers. [31], [43], [54], and [23] also verified their numerical approaches with experiments.
The scour indicators in the research of [43], [42] and [14], and [53] were the frequency shifts of the bridge. While [63] used differences in the first mode shape amplitudes at pier locations, [17] and [54] chose mode shape changes. [54] specifically focused on horizontally-displaced mode shapes of a frame-type bridge. [23] set fitting curves to the mode shapes and used root mean square (RMS) differences between healthy and damaged mode shapes to indicate scour. [48], [49], and [50] detected scour through changes in the fundamental frequencies of the polymer rods. [52] used the increasing permittivity of the soil to identify scour; as scour developed, the sensors’ permittivity suddenly increased. Higher apparent permittivity was related to the reduced soil density of the re-deposited sediment around the sensor.
The outcomes of the direct monitoring studies were summarized here. [43] numerically proved that the frequencies decreased due to a reduction in foundation stiffness in two piers (mimicking 24.5% and 44.9% scour cases). In their experimental setup, cantilever-based piezoelectric energy harvesting devices were used and three scour scenarios were adopted. One device attached to the pier was successfully the detecting frequency shift in that pier. When the device was attached to a healthy pier, it could detect the scour of another damaged pier. For a better performance of the method, they suggested performing an initial modal analysis of the bridge with accelerometers since this way it would be possible to monitor obtained modal frequencies in the frequency domain of the device’s voltage. In the research of [17], the normalized mode shape of a two-span integral-type concrete bridge changed by around 50%, with a 20% frequency difference for scour depth of 5 m. They noted that their approach might alleviate the known frequency-associated problems because the method is based on using the same sensors as the ones used for gathering the frequency. According to [46], abutments and piers had local vibration modes and the corresponding frequencies were only sensitive to scour related with the adjacent element. In their experiment, sensors were represented by virtual node points and located on two abutments and one pier. The method successfully identified the local frequencies and the location of the scour. However, they indicated that experimental validation through a field study was needed. [42] generated research for a two-span integral-type bridge. For 5 m of scour depth, due to central pier scour, the mode shape ratios of two points on the pier and deck changed by around 50% over the center of the foundation. The loading sensitivity to vehicle bridge interaction responses, random errors of ambient loading were main limitations of the study. Moreover, applying the developed approach to abutment by using the first mode was not possible. The approach was extended to a three-span bridge but a steady trend could not be obtained. In another study of the author, [46] noted that as the scour got more severe, the mean-normalized mode shape values at piers decrease. For example, pier 1 changed from 0.62 to 0.35 when 30% scour was simulated at pier 3. The experimental setup of the study had accelerometers located at two of the piers and the midspan of the bridge model, and 24.5% and 44.9% scour were observed. Compared with the healthy case, mean-normalized mode shape increased at the scoured pier while it decreased in the other piers. Their work eliminated the need for knowledge of vehicle excitation forces, material, and geometrical information of the bridge. However, when multiple piers had scour at the same time, the approach was not successful. Another numerical study by [31] showed that the permittivity and porosity of the soil increased when scour was present. The sensors were installed along four-meter-long scour probes in the experimental setup. One probe was for measuring the total scour at one pier while the other one was measuring constriction scour at the middle of the channel. A length of 30 cm scour was measured by the probe in the middle of the channel after a peak flood. When the empirical scour formulas and the experimental scour depth were compared, overestimation of formulas was revealed. Additionally, if the scour hole was not uniform or located at a very specific point, they suggested that sensor response and the effects of suspended sediments on the values of dielectric permittivity should be examined in a laboratory. In the research of [53], a 30% reduction in the values of the first three natural frequencies was observed compared to the scoured case. The renewable energy sources of the monitoring devices (wind, heat, electromagnetic field, and light) were a virtue of this study. However, the approach was only validated for particular structural types.
Furthermore, [54] showed that vertical mode shapes were not sensitive to scour, and increasing pile heights resulted in a decrease in flexural stiffness and horizontally-displaced mode frequencies for four scour cases relative to the healthy case. The experimental model had 11 uniformly distributed unidirectional Integrated Electronics Piezoelectric accelerometers. The authors concluded that in theory, the modal curvature changes and bending deflections could be used to detect scour because of their low sensitivity to the irregularity of the obtained mode shapes. However, the method was not reliable enough to locate the scour in practice. [23] found that 25% and 45% of scour decreased the stiffness of the foundation at the central and the right-side piers and reduced mode amplitudes locally and globally. Additionally, the average change in the central pier was 7.2% and 16.8%, respectively. They used seven re-deployable accelerometers: four at the midspan and three at the piers in their laboratory test setup. They found reductions in the mode amplitudes at pier locations and an increase in the amplitudes of non-scoured piers. As foundation stiffness decreased, the difference in the root means square between healthy and scoured modes increased linearly. Their study did not require previous information about the structural behavior and used only two sensors that were sequentially moved along a bridge to detect mode shapes. However, the study was limited to one-dimensional models and simplified experiments. [45] managed to locate and measure scour by adopting the UWFBG technique that was able to sense changes in the wavelength of 0.05–0.06 nm. This change is related to strain changes of the fibers using an empirical formula. The effects of water buoyancy and loosening sand on signals were easily excluded. A value of 0.002 for the standard deviation indicated scour and the accuracy was ± 2.5 cm. Instability index developed by [44] was able to rapidly evaluate bridge safety conditions. A caisson-type experiment with 10 sensors was performed. These sensors were located at the center of every deck panel and the cap beam of a pier, as well as 14 velocity sensors for the pile group. Pier 1 was always in a state of instability. Before the pile started to incline too much, the instability index changed significantly relative to its original state. Their study could be used as an early warning system but was limited to the specific types of foundations tested, i.e., caissons.
Moreover, [48] and [49] calculated scour height, i.e., the exposed length of the rod calculated via a time history analysis in the frequency domain voltage induced by the hydrodynamic effect. Sensors were tested in the sand surrounding each pier, in a laboratory. They observed that as exposed length increased, natural frequencies diminished. The measurements could last throughout the scour duration, and the sensors had a low cost. To improve the accuracy, [48] emphasized the need for full-scale tests and [49] pointed out the requirements for more realistic simulations in a flume. Later research by [50] compared measured and observed scour depths and showed that the sensor results were accurate. At the same time, they revealed difficulties in the implementation of sensors in real-life applications, and the debris effect could be a challenge for the proposed system. Magnetic field-based algorithms were developed for locating and tracking smart rocks moving around scour holes by [51] and [55]. [51] conducted two smart rocks—one direction-unknown and one direction-known at a bridge pier (upstream). Tracing the vertical displacements of the smart rock and monitoring the process of the peak scour depth was possible. Compared to former studies, higher accuracy, validation that considered a geomagnetic field, and calibration tests were supplied. Nevertheless, the measurement error was enhanced because of the instability of the direction-known rock during the field test. The reason was due to the effects of changing ambient magnetic field, caused by environmental factors. Picking the measurement points and stations (to locate the smart rock) close to the pier was suggested to diminish errors because the location had an intense magnetic field due to steel reinforcement. In the study of [55], real-time monitoring was performed for more accurate results. Before implementing the smart rock, magnetic field and coordinates were measured by an Unmanned Aerial Vehicle. The Unmanned Aerial Vehicle could detect the location with an error of less than 36 cm (verified by total station measurements). In the study of [52], different permittivity values corresponded to pre- and post-scour conditions. To test the application, six instrumented probes were installed in the bed segment and fixed on the flume floor. As scour developed, sensors’ permittivity increased. The higher apparent permittivity is believed to be related to the reduced soil density of the re-deposited sediment around the sensor. It was an economical, realistic, and real-time monitoring method, but was not efficient in saline water.
Overall, a lot of direct monitoring-based scour detection studies were focused on developing monitoring systems such as smart rocks, piezoelectric rod sensors, image-recognizing micro cameras, or smart probes instrumented with electromagnetic sensors. Sensor-based studies were advantageous since they provide direct information on scour depth. Some researchers compared their results with empirical scour formulas and showed that the formulas overestimated scour, which made the proposed sensors more economical solutions. Despite being more economical alternatives to traditional monitoring devices, a couple of issues narrowed down the application fields of newly developed sensors. The implementation of the developed sensors was problematic; some devices could not be used after a major flood or regular maintenance was required. This might prevent the device from being an economical solution in the long-term. Durability problems might be overcome by improving the mechanical properties of the materials used to build the sensor. Another issue was that some devices were proven not to be effective in taking accurate measurements. The studies using the latest technology like unmanned aerial vehicles equipped with three-axis high-resolution GPS units were promising. However, the location errors need to be reduced. Developed sensors should be tested in the field to provide more robust information about their outcomes.
Indirect Monitoring-Based Studies
This section includes only indirect-monitoring-based studies listed in Table 1. Vehicle/bridge dynamic interaction models were used to test the drive-by or indirect monitoring concept. Vehicles were generally modeled as half or quarter cars, representing one or two axles of a vehicle. The quarter car was particularly unrealistic but its simplicity had value in that it kept the focus on the bridge structure and did not require assumptions on axle spacing and other vehicle properties. It should be noted that the half-car was also simplistic but did serve to introduce some inter-axle effects that have a significant influence.
The studies addressed in the scope of this section processed the acceleration signals due to multiple train passes. [56] used a dynamic model that considered vehicle bridge interactions; a quarter car model of the train and two simple supported bridges with a shared pier. Zero mean base wavelet was chosen as “Mexican Hat” and a set of wavelets were derived from this base by modifying it with position and scale parameters. Coefficients are results of continuous wavelet transformation and these relate the analyzing wavelet with the specific region in the signal—they give signs of specific frequencies that are valid in the signal for a given time point. The existence of scour was proven by finding the difference in wavelet coefficients between healthy and scoured cases. The dynamic model of [19] consisted of a simple vehicle and a simple supported Euler-Bernoulli beam representing the bridge. Acceleration of the vehicle was obtained using equations of motion and Hilbert transform was applied to accelerations to find bridge mode shapes that were already known to be sensitive to the damping of the structure. [19] investigated the effect of damping on the mode shape and degree and rearranged the formula that calculates mode shape squares using the amplitude of the Hilbert transform. The difference between scoured and healthy cases’ mode shapes was the scour indicator. The researchers also verified their algorithm numerically with two laboratory experiments. [37] and [57] also used wavelet coefficients. The dynamic model of [37] first analyzed the vehicle and then computed beam local and global mass and stiffness matrices using finite element method. The forces were distributed to the degree of freedoms using shape functions which considered the location of the vehicle that changed every time step. The chosen base was Morlet wavelet. Scoured case was simulated in the model by reducing the stiffness of the bridge pier. For each of the 10, 20, and 30% of scour cases, 200 vehicle runs were generated in the dynamic model. Continuous wavelet transformation was applied to accelerations of both healthy and scoured cases and the differences of the coefficients indicated scour. [18] generated a vehicle–bridge–soil interaction model. The horizontal accelerations due to passing vehicle were recorded from the top of the pier. They extracted mode shapes out of acceleration measurements through an Eigen value analysis of a highway bridge. Three different levels of soil stiffness were considered to represent dense, medium-dense, and loose sand. For all types of soil, lateral frequencies were calculated for zero and 10-m scour.
The results of the study by [63] showed that bogie accelerations decreased due to a 30% scour case. Identifying a scoured pier was possible by using the difference between the wavelet coefficients of the scoured case and the healthy case. Vehicle properties such as mass and speed were considered stable. [37] detected and located scour by showing the difference between the wavelet coefficients of the scoured case and the healthy case. Vehicle signals were generated by an external numerical party. Batches of 20, 50, 100, and 200 vehicle crossings were tested for comprehending the reaction of the method. However, in a low number of batches, false-positive scour indications were seen to increase. [57] measured instant accelerations at every support and the mean value was obtained and converted into the frequency–spatial domain using 1000 vehicle passages, and operating deflection shapes were evaluated for 25 and 45% scour cases. [19] extracted mode shapes from drive-by data, using the Hilbert transform. In their experimental setup, one of eight accelerometers was located on the vehicle and seven were fixed to the bridge to gather modal parameters. Foundation scour was able to be identified only for the fifth bridge mode shape. They noted that high vehicle speed decreased the accuracy of the mode shape. Near the damage location, the damage index reached a maximum value. Nevertheless, an edge effect limited the ability to find the exact location with this approach. The effects of operational and environmental parameters were not in their scope. Finally, taking the arithmetical average of multiple runs was suggested. [18] investigated the response of lateral acceleration at the top level of a pier and a 40% frequency change was obtained due to scour. The results were only validated for the two-axle truck case.
Overall, all the studies successfully detected scour by processing acceleration signals from batches of vehicle passes. Since the results of continuous wavelet transformation were in both spatial and frequency domains, locating scour and having detailed structural modal information was possible. Both wavelet transformation and operating deflection shapes methods were proven to be more reliable in locating the scour than modal analyses. It should be highlighted that when working with the continuous wavelet transformation, a low number of vehicles per batch leads to an increase in the false-positive scour indications. Generally, these types of research required fewer sensors, had a lower power requirement compared to direct monitoring, and did not require underwater inspections. These features make this type of monitoring more economical than the direct type. The possibility of monitoring the bridge under regular service conditions without special monitoring devices and causing no service interruptions were additional advantages. All these properties suggest that indirect monitoring is a highly promising approach for scour investigations of bridges. Having more field tests will help verify studies with real-life applications. Studies can be expanded by considering variable vehicle properties such as speed and mass, different types of vehicles, and sensitivities to environmental conditions, and performing more detailed numerical analyses.
2.1.2. Cluster 2—Machine Learning-Based Research
This section briefly introduces commonly used machine learning algorithms. The introduction is followed by detailed information about the research noted in Table 3; characteristics of the input data used for training or validating, main and assisting algorithms used, and the scour property sought. Studies were mainly focused on estimation of the scour depth around the piers using machine learning algorithms. The characteristics of black-box models and their prediction capabilities enabled machine learning algorithms very handy tools for scour –damage formed by various parameters which require detailed investigations. Introducing the basics of some of the commonly-used machine learning algorithms and the optimization algorithms for hyperparameter selection might ease understanding the studies given in this section.
Before training the main algorithm, the majority of the machine learning algorithms specify a group of hyperparameters, whose determination could remarkably affect the efficiency of the resultant model [69]. Optimization algorithms are also used for assisting the search for the value of a parameter that is involved in two different predictions/calculations for the same structure or for searching the optimal hidden neuron number. Gradient-based and heuristic methods are two main structural optimization techniques [70]; in gradient-based ones, the direction of the search, i.e., the gradient, has to be described before seeking the best solution. However, gradient-based approaches might get stuck the in local optimum before they access the global optimum, execute insufficient in coping with the structures with nonlinear, hidden, and impermanent constraints, and a few of them include detailed optimization constraints [71,72]. Therefore, for overcoming such limitations in complex problems, heuristic methods were introduced. By solving actual problems of life simply, quickly, and in an applicable and efficient way, the utilization, requirement, and prestige of heuristic techniques have quickly boosted [70]. Some of the well-known heuristic optimization methods applied to civil engineering problems are the genetic algorithm, ant colony algorithm, particle swarm optimization, and simulated annealing [73]. First, because of being simple and easy to work with and having minimum requirements, genetic algorithms have been preferred extensively to solve numerous problems by imitating basic rules of evolution and natural genetic science [74]. These algorithms can solve the problem quickly and are handy for extensive problems, nevertheless there is no guarantee for the best solution in the end of the analysis [75]. Secondly, art colony algorithms are the most frequently utilized to solve NP-hard problems: for these kinds of problems, well-known algorithms assuring to detect an optimal result contain worst case scenario case convolution [76]. Art colony algorithms are used to optimize construction time and cost [77], task scheduling [78], and design problems [79]. Furthermore, in particle swarm optimization, the current location of every particle is updated by a vector of velocity, according to the social attitudes of individuals; when the swarm readjusts itself to the ambient by reappearing in the advantageous areas that were explored before [80].
An artificial neural network includes a couple of units of neurons (or layers, joints), one to three inexplicit (hidden) neuron layers, and a last unit of resultant neurons [81]. These algorithms do not need to go through lots of statistical training; however, they have some limitations such as a high volume of network training calculation, and the necessity of a preprocess for independent variables or predictor [82]. Still, they can help reduce the uncertainties of the problem. They eliminate the need for a clear description of the physical links between bridge scour and numerous affects and they provide better results than empirical formulations owing to small errors and correlation coefficients [22]. Back propagation neural network is defined as a method that regularly modifies the weights of the connections of the network to make the difference between the absolute output vector and requested output vector minimum [83]. It is a monitor-learning technique which uses gradient descent and multivariate linear regression for recognition of change with the weight of connection in the network [84]. In many studies that adopted back propagation neural network, the accuracy levels of empirical scour formulas were increased [85]. Multivariate linear regression seeks for the relationship between the variable to be analyzed and its independent variables, and applied for prediction purposes [86]. Trial-error method [87] and beetle antennae search [87,88] are generally preferred when the hyperparameters of back propagation neural network models are tuned. Support Vector Machines by Vladimir Vapnik navigate input vectors from primary feature space to a feature space which is multi-dimensional via a Kernel function [89]. Support Vector Machines were derived from statistical learning theory and are considerably new and encourage learning to sort functions to recognize the pattern or to operate an evaluation for a function within a regression problem [90]. Variations of cross-validation such as Leave One Out and k-Fold, Xi-Alpha bound, generalized comparative Generalized Kullback–Liebler Distance, approximate span bound, and Radius-margin bounds are some of the successful performance measures to pick hyperparameters of a Support Vector Machine model; except for Vapnik Chervonenkis (VC) bound, which failed to provide and efficiently estimate the parameters [91]. Support Vector Machines can deal with various feature spaces and can categorize the data with no structure or semi-structure (i.e., image and texts) very well; nevertheless, they require high computation of complicated data, are bad at processing noisy input, and comprehending the resulting model, the effect, and weights of the variables is not easy [82]. Compared with the conventional algorithms based on gradient, extreme learning machines learn more quickly and eliminate some challenges of stating a criterion to stop, rate of learning, duration of learning, and local minima [88]. Their fundamental benefit is reducing the volume of calculation, which is particularly related to working with the templates within a high dimensional space [89]. Differential evolution algorithms [92], statistical learning theory [93], and particle swarm optimization [94] are proven to be effective in optimizing hyperparameters of the extreme learning machines. Gradient tree boosting aims to find a link which is capable of navigating the input to output to minimize the difference between the loss function for the pre-defined and anticipated value [95]. Although the process is time-consuming, Bayesian hyperparameter optimization is a method to set the parameters of a gradient tree boosting model and grid search; while GPU acceleration provided more speed in the selection process [96]. Another algorithm providing successful applications for scour estimation [97,98] is group method of data handling, a procedure which organizes itself through models created step-by-step, based on their performance assessment on a group of multi-input–single-output data couples [99]. Grid search is one of the most common methods to set parameters of group method of data handling models. [100,101,102]. Finally, ANFIS is a composite neuro-fuzzy system [103] and is the combination of neural networks and fuzzy logic methods; internal parameters are learnt off-line, such as neural network does and acts fuzzy logic system when it is operated [104]. Grasshopper optimization algorithm [105] and cultural algorithm [106] are utilized to set parameters of ANFIS models.
Table 3.
Properties of Machine Learning studies—Cluster 2.
| Study Reference | Quantity of Data | Training/Validation Percentages | Base Algorithm | Assisting Approach/Algorithm | Compared Algorithms/Existing Formulas | Most Significant Parameters Considered | Target |
|---|---|---|---|---|---|---|---|
| [107] | Not provided | Not provided | Convolutional Neural Network | Not provided | Empirical Formulas: - 65-1, 65-2 of China - Melville-Sheppard -MBW - HEC-18 | Velocity of flow Depth of water Diameter of the sediment Pier width | Local scour depths around piers |
| [108] | 11 sets of field and laboratory data (scour depth measurement-bathymetric data measured with point laser sensors) | Multiple linear regression method | The cost function for determination of the accuracy of the model | ||||
| [109] | 99 examples of relative scour depths of a 0.7 m deep flume | 70% Training 30% Validation | Kstar model with five hybrid algorithms: - Weighted Instance Handler Wrapper-Kstar | Pearson correlation coefficient (to pick the most relevant input parameters) | Empirical equations of Dey and Barbhuiya, [6] and Muzammil [7]. | Relative Flow Depth Excess Abutment Froude number Relative Sediment Size Relative Submergence | Relative scour depth around abutments |
| [110] | 122 laboratory datasets of scour depths. An experiment in a sand bed flume and measured with a vertical point gauge. | Reduced Error Pruning Tree base classifier | - Mean Absolute Error - Root Mean Squared Error - R (Correlation Coefficient) - Taylor diagram (For fitting and performance optimization) | - Artificial Neural Networks - Support Vector Machine - M5P - Reduced Error Pruning Tree algorithms and 2 empirical formulas of the Florida Department of Transportation and Hydraulic Engineering Circular No. 18 (HEC-18). | Pile cap width Thickness Column width | Local scour depth at complex piers | |
| [111] | 476 field pier scour depth measurements for 4 different geometric shapes of piers. | 80% Training 20% Testing | - The Extreme Learning Machines regression method - The self-adaptive version of Differential Evolution | - Root Mean Squared Error - Mean Absolute Relative Error - Support Vector Machine - Artificial Neural Networks | Not provided | Pier dimensions Sediment mean diameter | Scour depth around piers |
| [112] | 321 experimental datasets of flumes, scour depths measured with a point gauge | 75% Training 25% Testing | Extreme Learning Machines | Different sets of input combinations were used to find the most effective variables. | - Support Vector Machine - Artificial Neural Networks | Critical and avarage flow velocity Flow depth Median diameter of particles Pile diameter Number of piles normal to the flow Distance between adjacent piles in line with the flow | Scour depth around piers |
| [113] | 476 field pier scour depth measurements | 80% Training 20% Testing | Extreme Learning Machines | Dimensional analysis to detect effective dimensionless parameters | Existing regression based models Richardson & Davis [114] Johnson [115] Shen [116] Laursen and Toch [13] | Ratio of pier width to flow depth Ratio of pier length to flow depth | |
| [117] | 104 sets of experiments to measure scour depths with an electronic total station device | Not provided | - Gradient Tree Boosting - Group Method of Data Handling technique. | Coefficient of Determination as to the performance index | Support Vector Machine ANFIS Particle Swarm Optimization-Based Support Vector Machine. | For clear water scour: Sediment size and quantity Velocity Flow time | The scour depth of circular, rectangular round-nosed, and sharp-nosed piers |
| [118] | 237 pier scour depth measurement datasets taken with echo sounder | Not provided | Evolutionary Radial Basis Function Neural Network model = Radial Basis Function Neural Network and Artificial Bee Colony | Not provided | Genetic Programming Back-propagation neural network Regression Tree Support Vector Machine - HEC18 -Mississippi’s method Van Wilson [119] Laursen and Toch [13] Froehlich [120] | Pier shape factor Pier width Skew of the pier to approach the flow Velocity of the flow Depth of flow Grain Size of The Bed Material (d50) Gradation of bed material | Scour depth |
| [121] | 170 data samples of clear-water scour depths | Not provided | Support Vector Regression-based model | Filter and wrapper feature selection strategies (for performance improvement) | HEC18 Richardson & Davis [114] Melville & Coleman [122] Ataie-Ashtiani [123] | Under three groups: Pier geometry Flow property Material characteristic of the riverbed | Local scour around complex piers |
| [124] | 403 sets of upstream and 61 sets of field downstream scour depth measurements | 80% Training 20% Validation | Nondominated Sorting Genetic Algorithm | Support Vector Machine for increasing the pool of field data | HEC18 Froehlich [120] Gene expression programming model | Pier width Approaching flow depth Median grain size, Sediment gradation coefficient Gradation of bed material | Critical scour depth |
| [85] | 232 field data | 66% Training 34% Testing | Deep Neural Network | Back-Propagation Neural Network | Froehlich Equation [120] Froehlich Design HEC-18 HEC-18/Mueller Equation (1996) Back-Propagation Neural Network | - Not provided | Local scour around bridge piers |
| [125] | 175 experimental datasets for scour depth | Not provided | Sequential quadratic programming optimization Least Square Support Vector Machine | Sequential quadratic programming to seek the optimal coefficients | - HEC18 - Melville and Coleman [122] - Ataie-Ashtiani [123] | Flow direction Pile-cap width Covering soil height Pier length Critical velocity of sediment movement Flow velocity Median grain size Flow depth River bed material Standard deviation | Scour depth of a Bridge with a complex pier |
One of the most important features of the studies is the characteristics of the data such as the quality, source, and properties. Details of the input data of the studies in Table 3 were noted here. [107] only noted that the training data source was both field and laboratory measurements without providing further details. They also indicated that the verification data belonged to Hangzhou Bay Bridge in China. The input data for the model training and validation of [108] was scour depth measurements of bridge piers. Data were gathered from the two following sources: the field data were collected from three bridges in China—Mingchu, Silo, and Houfeng bridges; while the second source was laboratory experiments—two sets of laboratory tests were obtained from J. Sterling Jones Water Conservancy Laboratory of Turner-Fairbank Highway Research Center and the Colorado State University. Additional laboratory tests were also used from related studies. In the end, they obtained a total of 12 sets of measurements. Four sets of parameters were used for training the model. These parameters (data labels) included flow velocity, water depth, sediment size, and pier width. Relative scour depth data that [109] used was obtained from flume experiments. At the technology institute of India, 295 runs were performed in the hydraulic laboratory for three different abutment shapes. The dimensions of the flume were 20m (longitudinal), 0.7m (depth), and 0.9m (width). [110] obtained experimental local scour depth measurements of complex piers from National Hydraulic Research Institute of Malaysia and Sharif University of Technology in Iran. The laboratory models scaled existing bridges of Malesia. The tests were performed under clean water conditions on various complex piers with different geometric parameters such as plan dimensions of the pier and the piles, water depth, distance of the pile to the edge of the pile cap, flow direction, the distance between piles, and pile cap elevation [126]. Experimental setups were such adjusted that the effects of flow depth, sediment size, and contraction on piers were eliminated. Data sources of [111] were from field measurements of 14 distinct bridges in Canada, Pakistan, and India. Four different data labels were available—sharp, round, cylindrical, and square-shaped bridge piers’ scour depth measurements. There were also sub-labels of this scour depth data—narrow, wide, and intermediate-sized piers’ measurements. Finally, the sub-labels were grouped under five dimensionless categories of scour depth to flow depth ratio, Froude number, median diameter to flow depth ratio, pier length to flow depth ratio, standard deviation of bed size grain diameter, and pier diameter to flow depth ratio. Later in another study, [112] collected the input data from three different studies. Two of the studies performed the experiments in a four-meter-long flume and controlled the mean sediment size (0.98 mm) and pipe diameters (0.016m). The measurements were taken for various pile plan layouts (1:2, 4:1 etc.). The third study of data resource used a smaller sediment size (0.80 mm) and pipe diameters (0.06m and 0.041m) but a longer flume (46m). In another study, [109] used the same data as they used in 2017 [113].
Moreover, the data set of [117] included both scour conditions of clear-water and live-bed. The effect of the independent parameters flow depth, velocity of approach, duration of flow, median sediment size was investigated on predicting scour. There were also four different data labels of sharp-nosed, round-nosed, rectangular, and circular piers’ scour depth measurements. [118] adopted field scour depth measurements gathered from 79 sites in 17 states of USA for prediction of equilibrium scour depth. They excluded scour in group-type bridges and cohesive bed material, moderate, and substantial debris effects. The parameters considered were the width and the shape factor of the pier, skew of the pier to approach flow, size of the grain in the bed, gradation of bed material, and depth and velocity of the flow. [121] used laboratory data which includes four datasets from the Hydrotech Research Institute of National Taiwan University. Complex pier foundation scour measurements were taken in a sand bed. Parameters considered were soil-covering height, median grain size, standard deviation of river bed material, radio of the mean velocity of the sediment to the critical velocity, flow depth, pier width which is perpendicular to the flow direction, the width of the pile cap, and pile cap-pier face to face distance. [124] combined two sets of field data—from bridge scour data management system (BSDMS) and FHWA documentation by USGS. Departing from the information of different direction of vortices (and therefore scour developments) in upstream and downstream, their first data label was location. Velocity and flow depth of approach, median grain size, gradation of sediment, and scour depth were other data labels. To improve the overall quality of the input, data with missing location or other properties listed above were excluded. [85] picked 232 upstream scour length measurements from another study [127] that collected scour observations in 79 different rivers several states of USA. Data included skew of the pier to approach flow, pier shape factor, pier dimensions, flow velocity and depth, grain size, and gradation of bed material. Only raw data were used to obtain a better performance. In testing the dataset, root mean square values of both neural networks in the scope of the research were compared to obtain the ideal values for various parameters defined by user.
In terms of the accuracy level of predictions made, [107] and [108] stated that their predictions are in good agreement with the measurements, with only one dataset outside the 50% error line. They stated that their approach was more effective in terms of accuracy when compared to empirical formulas such as M/S, MBW, HEC-18, 65-1, and 65-2. According to their sensitivity analysis, [108] stated that the most effective parameter in predicting scour was pier width. They also suggested an increase in the quantity of training data to predict scour depths more accurately. [109] investigated scour occurrence for different shapes of the abutment. They noted that, for all shapes of the abutment, the most effective parameter was the Excess Abutment Froude number (Fe). Moreover, for vertical-wall-shaped abutments, the most effective parameter combination contained Excess Abutment Froude number, relative sediment size (d50/l, where “d50” is the sediment size and “l” is the dimension of the abutment which is perpendicular to the flow), and relative flow depth (h/l). Finally, for semicircular and 45° wing shape abutments, the combination of Excess Abutment Froude number and relative sediment size was the most effective parameter combination in scour prediction. The weighted instance handler wrapper-Kstar for vertical-wall abutments, random committee-Kstar for semicircular walls, and 45° wing wall were the best algorithms among five novel hybrid algorithms studied. Their algorithms outperformed the empirical formulas of Dey and Barbhuiya [6] and Muzzammil [7]. The hybrid approach of [107], based on a random subspace meta classifier, resulted in the pile cap level being the most sensitive factor in the prediction of complex piers’ local scour depths. The reduced error pruning tree base classifier resulted in similar root mean square errors to artificial neural networks, support vector machines, and M5P. The predictions obtained through reduced error pruning tree and other machine learning algorithms were significantly better than the scour depths computed with the empirical models of FDOT and HEC-18. Both [109] and [110] were able to increase the prediction power of standalone algorithms with the hybrid algorithms they proposed. [111] proposed a self-adaptive evolutionary extreme learning machine to predict scour around bridge piers. They indicated that the ratio of the median diameter of particle size to flow depth, the ratio of pier length to flow depth, and the ratio of pier width to flow depth were the most effective parameters. Self-adaptive evolutionary extreme learning machines outperformed artificial neural networks and support vector machines. In 2018, [112] proposed 25 models to predict scour around coastal and hydraulic pile groups. The extreme learning machine model generated had the most optimal input parameter combination and provided better results than the artificial neural networks and support vector machines considered. They also identified that pier diameter affected the predictions the most. Later in 2019, it was shown that extreme learning machines were one of the most effective heuristic optimization algorithms for non-linear systems [113]. The sensitivity analysis included 31 models with different input combinations [113]. Their approach outperformed the empirical equations of Richardson and Davis [114], Johnson [115], Shen [116], and Laursen and Toch [13]. They recommended that the proposed methodology be improved by utilizing other artificial intelligence methods such as gene expression programming, and the group method of data handling.
Furthermore, [117] generated a model based on gradient tree boosting to predict scour depth around piers with different geometries: rectangular, circular, sharp-nosed, and round-nosed. In conclusion, gradient tree boosting was more accurate and effective than the group method of data handling for all shapes. It was noted that the model worked best with the rectangular form. [118] proposed a model using an evolutionary radial basis function neural network and it outperformed not only empirical HEC-18, Mississippi’s, Laursen and Toch’s (1956), and Froehlich’s methods, but also other algorithms being compared (back-propagation neural network, genetic programming, M5 regression tree, and support vector machine). They suggested future studies consider the efficiency, duration required for computation, stability of artificial intelligence methods, and techniques in between complements. In their research based on support vector regression, [121] obtained better predictions when support vector regressions are used together with algorithms for selecting features. The variable neighborhood search algorithm had the best performance when compared with sequential forward selection and sequential backward selection for parameter selection. The proposed method also made more accurate scour depth predictions compared to HEC18, Melville and Coleman [122], and Ataie-Ashtiani [123]. They recommended a future study of the support vector regression and other Kernel Functions together. Nondominated sorting genetic algorithm-based method of [124] outperformed both hydraulic engineering circular no. 18 and Froehlich equations and gene expression programming. The authors highlighted that their approach was as simple as empirical formulas. They noted that the failure rates should be decreased. They also suggested modifying the function and picking field data and other independent parameter combinations more explicitly. [85] found out that ignoring randomly selected neurons (dropout layers) on deep neural networks could not level up accuracy level significantly. When the prediction values were compared with the measurements, it was seen that both deep neural networks and back-propagation neural networks performed equally well in predicting the scour depth. Additionally, predictions of deep neural networks outperformed four empirical formulas listed in Table 3; root mean square errors were 2-4 times better. [125] proposed an algorithm of sequential quadratic programming optimization and managed to increase the accuracy of the existing formulas of HEC18, Melville and Coleman [122], and Ataie-Ashtiani [123] up to 2–4 times.
Overall, the majority of the data used in the studies reviewed under the machine learning-based cluster were used for training (to feed machine learning algorithms) and the rest was kept for validation. Selecting the training data correctly by pre-processing before applying the algorithm-based models helped the models approach accurate predictions more quickly. The studies provided root mean squared error, mean square error, coefficient of determination (R2), or cumulative sums of orthogonal distance indexes to compare their approaches with frequently used machine learning algorithms and/or empirical scour formulas. The main objective was to generate a new model which provides more robust scour depths than empirical scour formulas and/or some frequently used machine learning algorithms. These models adopt one or more (hybrid) algorithms and heuristic parameter selection algorithms for better predictions and computation time. [74] stated that the usage, demand, and reliability of heuristic techniques have quickly boosted their use because these solve actual problems of life simply, quickly, efficiently, and in an applicable way. Of the studies summarized here in this review, it can be seen that those with sensitivity analysis, i.e., following an optimization method for hyperparameter selection, resulted in faster and more accurate predictions of scour depth. Particle swarm optimization and artificial bee colony were two of the methods used in the studies presented here. With such optimization methods, it was easier to identify the most effective parameter or combination of parameters influencing the prediction. One should highlight that this parameter was not fixed: studies resulted in different conclusions about “the most effective parameter” because their training data, i.e., input was different from each other. Since all the studies claimed to make better predictions than empirical formulas, a comparison in terms of outperforming frequently used, (i.e., reference) algorithms can be meaningful. Specifically, the researchers adopting extreme learning machines, gradient tree boosting, radial basis function neural networks, and reduced error pruning tree algorithms, were successful in performing better than reference algorithms such as artificial neural networks and support vector machines.
2.2. Synthesis of the Results
This review consists of the detail investigation of 36 studies, represented in two clusters (one cluster contains both direct and indirect conventional monitoring-based studies) which were effective in detecting scour damage either by processing vehicle signals, signals directly gathered from the bridge, or estimating scour depth using machine learning algorithms. The synthesis of their results was provided below.
2.2.1. Cluster 1—Synthesis of Conventional Monitoring-Based Studies to Detect Scour
First, sensors used for direct monitoring have been improved with developing technology. The device types were not only limited to inclinometers and velocity sensors, but also micro cameras, wireless transmitters, fiber-optic sensors, and even Unmanned Aerial Vehicle-deployed smart rocks. Studies with alternative sensing mechanism sensors in this review processed the signals gathered via bed-level image recognition, instantaneous frequencies, distribution of magnetic field, and porosity of the soil. Although these types of devices provided direct information, and real-time monitoring of scour and eliminated the need for underwater inspections, monitoring also involved some challenges. These were implementation difficulties and maintenance requirements that might be overcome through the better design of the devices. Additionally, debris and saline water were challenges in some cases. Direct monitoring-based studies which use traditional sensors such as accelerometers and global positioning system devices were able to detect the presence of scour through changes in frequency and mode shape. These occurred due to the decrement in the foundation stiffness, as a consequence of scour. Direct monitoring-based studies were advantageous since they did not require knowledge of vehicle forces, or detailed geometrical and mechanical information about the bridge. Alternatively, energy harvesting devices are being increasingly utilized as monitoring sensors. They can detect frequency changes and produce energy out of this vibration at the same time. They have clear advantages over regular accelerometers in terms of the source of the energy. However, there were limitations of loading sensitivities and possible errors in the presence of multiple scoured piers.
Second, it was possible to identify and locate different percentages of scour by processing the vehicle signals. In these studies, (i.e., indirect monitoring-based research) signals due to multiple vehicle passages were processed to obtain mode shapes or frequencies, or scour was indicated by the differences between operating deflection shapes or continuous wavelet transform coefficients between healthy and scoured cases. Mode shape ratio methods were used in many studies and were able to detect scour successfully. Very significant changes in the mode shape ratios were observed for the scoured stages. Yet, the sensitivities due to vehicle load and random errors due to the variability of the ambient loading are issues that needed to be resolved. Specifically, the mean normalized mode shape method of [63] was successful in detecting scour at a single pier. However, it was not an efficient solution when multiple piers were scoured at the same time. Investigating multiple scours of bridge piers through numerical methods could be a future study. Furthermore, frequency domain decomposition was a frequently applied method to process acceleration signals and can be applied to gather modal properties and frequencies of the bridge. Hilbert Huang transform was another signal analysis method proven to be efficient in decomposing acceleration signals to mode functions. However, due to the very short duration of the data segment, there is insufficient data. Scour detection based on mode shape methods appeared to be more robust. Some of the leading advantages of these indirect monitoring are the need for fewer sensors, eliminating the need for special monitoring devices, underwater examinations, and the occasional challenges of placing sensors. Furthermore, the service conditions of the infrastructure were not interrupted and the instrumenting vehicle was a more economical option than direct monitoring. On the other hand, the most common limitations were changing vehicle parameters (such as mass and speed) and the need for large numbers of vehicle runs.
It was highly recommended for all studies with numerical models and algorithms developed needed to be applied in full-scale bridge tests to be deemed fully effective. Another improvement for the studies could be upgrading the mathematical models to two- or three-dimensional ones. Both applying more field tests and replicating mathematical models could address the limitations of the studies to specific types of structures. The future studies then can be better and more clearly defined.
2.2.2. Cluster 2—Synthesis of Machine Learning-Based Studies
Machine Learning-based studies reviewed in the scope of this study aimed to find local or total scour around bridge piers or abutments. The models of the studies were trained with laboratory or field data. The newly proposed algorithms include convolutional neural network, multiple linear regression method, K-Star model, reduced error pruning tree base classifier, extreme learning machines, gradient tree boosting, group method of data handling, ERBNN model, support vector regression-based model, non-dominated sorting genetic algorithm, Gaussian processes regression, relevance vector machines, deep neural network, and LS-support vector machine. The studies either compared their approach with other algorithms or with existing empirical formulas. The most frequently used reference algorithms for comparison with the newly proposed algorithms were artificial neural networks, support vector machine, gradient tree boosting, group method of data handling, and extreme learning machines. Most of the time, the proposed algorithms outperformed these well-known ones, which is the main target of designing new models. The reference empirical formulas were 65-1, 65-2, Melville-Sheppard, MBW, HEC-18, Laursen & Toch [13], and Froehlich [120], Mississippi’s method Van Wilson [119], and Ataie-Ashtiani [123]. All the proposed algorithms performed better in predicting scour than the traditional equations mentioned above. The proposed models either improved the empirical formulas’ accuracy levels (one study) or developed a model adapting one algorithm (four studies) or hybrid models (nine studies) for a more successful prediction of scour depth around the piers.
Some of the challenges faced were the need to decrease the duration of computation, picking the field data, and the combination of independent parameters more explicitly. It was usually stated in the discussions that more training data would improve the accuracy levels of the studies in future work. Another work to improve the accuracy level could be the contributions of different algorithms to the hybrid models. Improving the accuracy of the scour height estimations will result in more economical solutions by preventing overdesigns.
Author Contributions
Conceptualization, S.T., J.T. and E.O.; methodology, S.T.; software, not applied; validation, S.T., J.T., E.O. and J.C.M.; formal analysis, S.T.; investigation, S.T.; resources, S.T.; writing—original draft preparation, S.T.; writing—review and editing, E.O. and J.T.; visualization, S.T., supervision, J.T. and E.O.; project administration, not applied; funding acquisition, J.T., J.C.M. and E.O. All authors have read and agreed to the published version of the manuscript.
Funding
This research was funded by FCT (Portuguese national funding agency for science, research, and technology)/MCTES through national funds (PIDDAC) under the R&D Unit Institute for Sustainability and Innovation in Structural Engineering (ISISE), under reference UIDB/04029/2020 and trough the doctoral Grant 2021.06162.BD. This work has also been partly financed within the European Horizon 2020 Joint Technology Initiative Shift2Rail through contract no. 101012456 (IN2TRACK3).
Conflicts of Interest
The authors declare no conflict of interest.
References
- Zhao, M. A Review on Recent Development of Numerical Modelling of Local Scour around Hydraulic and Marine Structures. J. Mar. Sci. Eng. 2022, 10, 1139. [Google Scholar] [CrossRef]
- Bihs, H.; Olsen, N.R.B. Numerical modeling of abutment scour with the focus on the incipient motion on sloping beds. J. Hydraul. Eng. 2011, 137, 1287–1292. [Google Scholar] [CrossRef]
- Nordila, A.; Ali, T.; Faisal, A.; Badrunnisa, Y. Local scour at wide bridge Piers. Int. J. Eng. Res. Technol. (IJERT) 2014, 3, 742–754. [Google Scholar]
- Guan, D.; Chiew, Y.M.; Wei, M.; Hsieh, S.C. Characterization of horseshoe vortex in a developing scour hole at a cylindrical bridge pier. Int. J. Sediment Res. 2019, 34, 118–124. [Google Scholar] [CrossRef]
- Oliveto, G.; Hager, W.H. Temporal evolution of clear-water pier and abutment scour. J. Hydraul. Eng. 2002, 128, 811–820. [Google Scholar] [CrossRef]
- Dey, S.; Barbhuiya, A.K. Time variation of scour at abutments. J. Hydraul. Eng. 2005, 131, 11–23. [Google Scholar] [CrossRef]
- Muzzammil, M. ANFIS approach to the scour depth prediction at a bridge abutment. J. Hydroinform. 2010, 12, 474–485. [Google Scholar] [CrossRef] [Green Version]
- Campbell, K.E.; Ruffell, A.; Pringle, J.; Hughes, D.; Taylor, S.; Devlin, B. Bridge Foundation River Scour and Infill Characterisation Using Water-Penetrating Radar. Remote Sens. 2021, 13, 2542. [Google Scholar] [CrossRef]
- Huber, E.; Anders, B.; Huggenberger, P. Quantifying scour depth in a straightened gravel-bed river with ground-penetrating radar. In Proceedings of the 17th International Conference on Ground Penetrating Radar (GPR) IEEE, Rapperswil, Switzerland, 18–21 June 2018; pp. 1–4. [Google Scholar]
- Hou, S.; Jiao, D.; Dong, B.; Wang, H.; Wu, G. Underwater inspection of bridge substructures using sonar and deep convolutional network. Adv. Eng. Inform. 2022, 52, 101545. [Google Scholar] [CrossRef]
- Raju, R.D.; Nagarajan, S.; Arockiasamy, M.; Castillo, S. Feasibility of Using Green Laser in Monitoring Local Scour around Bridge Pier. Geomatics 2022, 2, 355–369. [Google Scholar] [CrossRef]
- Mutlu Sumer, B. Mathematical modeling of scour: A review. J. Hydraul. Res. 2007, 45, 723–735. [Google Scholar] [CrossRef]
- Laursen, E.M.; Toch, A. Scour around Bridge Piers and Abutments; Ames, I.A., Ed.; Iowa Highway Research Board: Iowa City, IA, USA, 1956; Volume 4.
- Kirkil, G.; Constantinescu, G.; Ettema, R. Detached eddy simulation investigation of turbulence at a circular pier with scour hole. J. Hydraul. Eng. 2009, 135, 888–901. [Google Scholar] [CrossRef]
- Yagci, O.; Yildirim, I.; Celik, M.F.; Kitsikoudis, V.; Duran, Z.; Kirca, V.O. Clearwater scour around a finite array of cylinders. Appl. Ocean Res. 2017, 68, 114–129. [Google Scholar] [CrossRef]
- Oben-Nyarko, K.; Ettema, R. Pier and abutment scour interaction. J. Hydraul. Eng. 2011, 137, 1598–1605. [Google Scholar] [CrossRef]
- Malekjafarian, A.; Prendergast, L.J.; OBrien, E.J. Detecting bridge scour using mode shapes derived from time-domain data. In Proceedings of the Civil Engineering Research in Ireland 2018 (CERI2018) Conference, Dublin, Ireland, 29–30 August 2018. [Google Scholar]
- Prendergast, L.J.; Hester, D.; Gavin, K. Determining the presence of scour around bridge foundations using vehicle-induced vibrations. J. Bridge Eng. 2016, 21, 04016065. [Google Scholar] [CrossRef] [Green Version]
- Tan, C.; Zhao, H.; OBrien, E.J.; Uddin, N.; Fitzgerald, P.C.; McGetrick, P.J.; Kim, C.W. Extracting mode shapes from drive-by measurements to detect global and local damage in bridges. Struct. Infrastruct. Eng. 2020, 17, 1–8,11,13. [Google Scholar] [CrossRef]
- Klinga, J.V.; Alipour, A. Assessment of structural integrity of bridges under extreme scour conditions. Eng. Structures 2015, 82, 55–71. [Google Scholar] [CrossRef]
- Prendergast, L.J.; Gavin, K.; O’Sullivan, J.J. Non-intrusive bridge scour analysis technique using laboratory test apparatus. In Proceedings of the Bridge and Concrete Research in Ireland, Dublin, Ireland, 6–7 September 2012. [Google Scholar]
- Ahmad, N.; Bihs, H.; Kamath, A.; Arntsen, Ø.A. Three-dimensional CFD modeling of wave scour around a side-by-side and triangular arrangement of piles with REEF3D. Procedia Eng. 2015, 116, 683–690. [Google Scholar] [CrossRef] [Green Version]
- Khan, M.A.; McCrum, D.P.; Prendergast, L.J.; OBrien, E.J.; Fitzgerald, P.C.; Kim, C.W. Laboratory investigation of a bridge scour monitoring method using decentralized modal analysis. Struct. Health Monit. 2021, 20, 3327–3341. [Google Scholar] [CrossRef]
- Kallias, A.N.; Imam, B. Probabilistic assessment of local scour in bridge piers under changing environmental conditions. Struct. Infrastruct. Eng. 2016, 12, 1228–1241. [Google Scholar] [CrossRef]
- Muzzammil, M.; Alam, J.; Kumar, K.; Khalid, M. Reliability Analysis of a Complex Pier Against Local Scour. J. Inst. Eng. Ser. A 2022, 103, 1237–1245. [Google Scholar] [CrossRef]
- Tubaldi, E.; Macorini, L.; Izzuddin, B.A.; Manes, C.; Laio, F. A framework for probabilistic assessment of clear-water scour around bridge piers. Struct. Saf. 2017, 69, 11–22. [Google Scholar] [CrossRef] [Green Version]
- Jafari-Asl, J.; Ben Seghier, M.; Ohadi, S.; Dong, Y.; Plevris, V. A comparative study on the efficiency of reliability methods for the probabilistic analysis of local scour at a bridge pier in clay-sand-mixed sediments. Modelling 2021, 2, 63–77. [Google Scholar] [CrossRef]
- Jonkman, S.N.; Steenbergen, R.D.J.M.; Morales-Napoles, O.; Vrouwenvelder, A.C.W.M.; Vrijling, J.K. Probabilistic Design: Risk and Reliability Analysis in Civil Engineering; Collegedictaat CIE4130; TU Delft, Department Hydraulic Engineering: Delft, The Netherlands, 2015; p. 103. Available online: http://resolver.tudelft.nl/uuid:e53b8dca-a0db-4433-b9f9-e190a507f99f (accessed on 22 January 2023).
- Ley, C.; Martin, R.K.; Pareek, A.; Groll, A.; Seil, R.; Tischer, T. Machine learning and conventional statistics: Making sense of the differences. Knee Surgery, Sports Traumatology. Arthroscopy 2022, 30, 1–5. [Google Scholar]
- Gattulli, V.; Lepidi, M.; Potenza, F. Dynamic testing and health monitoring of historic and modern civil structures in Italy. Struct. Monit. Maint. 2016, 3, 71–90. [Google Scholar] [CrossRef]
- Prendergast, L.J.; Gavin, K. A review of bridge scour monitoring techniques. J. Rock Mech. Geotech. Eng. 2014, 6, 138–149. [Google Scholar] [CrossRef]
- Maroni, A.; Tubaldi, E.; Ferguson, N.; Tarantino, A.; McDonald, H.; Zonta, D. Electromagnetic sensors for underwater scour monitoring. Sensors 2020, 20, 4096. [Google Scholar] [CrossRef] [PubMed]
- Marr, J. Bridge Scour Monitoring Technologies: Development of Evaluation and Selection Protocols for Application on River Bridges in Minnesota; (No. MN/RC 2010-14); Minnesota. Dept. of Transportation, Research Services Section: Saint Paul, MN, USA, 2010. [Google Scholar]
- Boujia, N.; Schmidt, F.; Chevalier, C.; Siegert, D.; Pham Van Bang, D. Using rocking frequencies of bridge piers for scour monitoring. Struct. Eng. Int. 2021, 31, 286–294. [Google Scholar] [CrossRef]
- Purnomo, D.A.; Aspar, W.A.N.; Barasa, W.; Harjono, S.M.; Sukamdo, P.; Fiantika, T. Initial Implementation of Structural Health Monitoring System of a Railway Bridge. In IOP Conference Series: Materials Science and Engineering; IOP Publishing: Bristol, UK, 2021; Volume 1200, No. 1; p. 012019. [Google Scholar]
- Van der Auweraer, H.; Peeters, B. Sensors and systems for structural health monitoring. J. Struct. Control 2003, 10, 117–125. [Google Scholar] [CrossRef]
- Lynch, J.P. An overview of wireless structural health monitoring for civil structures. Philos. Trans. R. Soc. A Math. Phys. Eng. Sci. 2007, 365, 345–372. [Google Scholar] [CrossRef]
- Fitzgerald, P.C.; Malekjafarian, A.; Cantero, D.; OBrien, E.J.; Prendergast, L.J. Drive-by scour monitoring of railway bridges using a wavelet-based approach. Eng. Struct. 2019, 191, 1–11. [Google Scholar] [CrossRef]
- Chandrasekaran, S. Structural Health Monitoring. In Structural Health Monitoring with Application to Offshore Structures; Indian Institute of Technology Madras: Toh Tuck Link, Singapore, 2019; pp. 24–26. [Google Scholar] [CrossRef]
- Martinez, D.; Malekjafarian, A.; OBrien, E. Bridge flexural rigidity calculation using measured drive-by deflections. J. Civ. Struct. Health Monit. 2020, 10, 833–844. [Google Scholar] [CrossRef]
- Bernardini, L.; Carnevale, M.; Somaschini, C.; Matsuoka, K.; Collina, A. A Numerical Investigation of New Algorithms for The Drive-by Method in Railway Bridge Monitoring. In Proceedings of the EURODYN 2020, XI. International Conference on Structural Dynamics, Athens, Greece, 23–26 November 2020; pp. 1033–1043. [Google Scholar]
- Malekjafarian, A.; Prendergast, L.J.; OBrien, E. Use of mode shape ratios for pier scour monitoring in two-span integral bridges under changing environmental conditions. Can. J. Civ. Eng. 2020, 47, 962–973. [Google Scholar] [CrossRef]
- Fitzgerald, P.C.; Malekjafarian, A.; Bhowmik, B.; Prendergast, L.J.; Cahill, P.; Kim, C.W.; OBrien, E.J. Scour damage detection and structural health monitoring of a laboratory-scaled bridge using a vibration energy harvesting device. Sensors 2019, 19, 2572. [Google Scholar] [CrossRef] [PubMed] [Green Version]
- Lin, T.K.; Chang, Y.S. Development of a real-time scour monitoring system for bridge safety evaluation. Mech. Syst. Signal Process. 2017, 82, 503–518. [Google Scholar] [CrossRef]
- Liu, W.; Zhou, W.; Li, H. Bridge scour estimation using unconstrained distributed fiber optic sensors. J. Civ. Struct. Health Monit. 2022, 12, 775–784. [Google Scholar] [CrossRef]
- Prendergast, L.J.; Gavin, K.; Hester, D. Isolating the location of scour-induced stiffness loss in bridges using local modal behavior. J. Civ. Struct. Health Monit. 2017, 7, 483–503. [Google Scholar] [CrossRef] [Green Version]
- Malekjafarian, A.; Kim, C.W.; OBrien, E.J.; Prendergast, L.J.; Fitzgerald, P.C.; Nakajima, S. Experimental Demonstration of a Mode Shape-Based Scour-Monitoring Method for Multispan Bridges with Shallow Foundations. J. Bridge Eng. 2020, 25, 04020050. [Google Scholar] [CrossRef]
- Funderburk, M.L.; Huang, S.K.; Loh, C.H.; Loh, K.J. Densely distributed and real-time scour hole monitoring using piezoelectric rod sensors. Adv. Struct. Eng. 2019, 22, 3395–3411. [Google Scholar] [CrossRef]
- Azhari, F.; Tom, C.; Benassini, J.; Loh, K.J.; Bombardelli, F.A. Design and characterization of a piezoelectric sensor for monitoring scour hole evolution. Sens. Smart Struct. Technol. Civ. Mech. Aerosp. Syst. 2014, 9061, 301–309. [Google Scholar]
- Azhari, F.; Loh, K.J. Laboratory validation of buried piezoelectric scour sensing rods. Struct. Control Health Monit. 2017, 24, e1969. [Google Scholar] [CrossRef]
- Chen, Y.; Tang, F.; Li, Z.; Chen, G.; Tang, Y. Bridge scour monitoring using smart rocks based on magnetic field interference. Smart Mater. Struct. 2018, 27, 085012. [Google Scholar] [CrossRef]
- Michalis, P.; Tarantino, A.; Tachtatzis, C.; Judd, M.D. Wireless monitoring of scour and re-deposited sediment evolution at bridge foundations based on soil electromagnetic properties. Smart Mater. Struct. 2015, 24, 125029. [Google Scholar] [CrossRef] [Green Version]
- Hashimoto, K.; Shiotani, T.; Mitsuya, H.; Chang, K.C. MEMS Vibrational Power Generator for Bridge Slab and Pier Health Monitoring. Appl. Sci. 2020, 10, 8258. [Google Scholar] [CrossRef]
- Elsaid, A.; Seracino, R. Rapid assessment of foundation scour using the dynamic features of the bridge superstructure. Constr. Build. Mater. 2014, 50, 42–49. [Google Scholar] [CrossRef]
- Zhang, H.; Li, Z.; Reven, A.; Scharfenberg, B.; Chen, G.; Ou, J. UAV-Based Smart Rock Positioning for Determination of Bridge Scour Depth. In Proceedings of the 9th International Conference on Structural Health Monitoring of Intelligent Infrastructure (SHMII-9), St. Louis, MO, USA, 4–7 August 2019. [Google Scholar]
- OBrien, E.J.; Malekjafarian, A.; Fitzgerald, P.C. Bridge Scour Detection using Vehicle Acceleration Measurements. In Proceedings of the Civil Engineering Research in Ireland 2018 Conference (CERI 2018), Dublin, Ireland, 29–30 August 2018. [Google Scholar]
- OBrien, E.J.; McCrum, D.P.; Khan, M.A.; Prendergast, L.J. Wavelet-based operating deflection shapes for locating scour-related stiffness losses in multi-span bridges. Struct. Infrastruct. Eng. 2021, 19, 238–253. [Google Scholar] [CrossRef]
- Chopra, A.K. Dynamics of Structures, 4th ed.; Prentice-Hall International Series; Civil Engineering and Engineering Mechanics: Delhi, India, 2007; pp. 428–441, 883–904. [Google Scholar]
- Cerna, M.; Harvey, A.F. The Fundamentals of FFT-Based Signal Analysis and Measurement. In Application Note 041; National Instruments: Austin, TX, USA, 2000. [Google Scholar]
- Feldman, M. Hilbert transform in vibration analysis. Mech. Syst. Signal Process. 2011, 25, 735–802. [Google Scholar] [CrossRef]
- Brincker, R.; Zhang, L.; Andersen, P. Modal identification of output-only systems using frequency domain decomposition. Smart Mater. Struct. 2001, 10, 441. [Google Scholar] [CrossRef] [Green Version]
- Le, T.P.; Paultre, P. Modal identification based on the time–frequency domain decomposition of unknown-input dynamic tests. Int. J. Mech. Sci. 2013, 71, 41–50. [Google Scholar] [CrossRef]
- Grossmann, A.; Kronland-Martinet, R.; Morlet, J. Reading and understanding continuous wavelet transforms. In Wavelets; Springer: Berlin/Heidelberg, Germany, 1990; pp. 2–20. [Google Scholar]
- Torrence, C.; Compo, G.P. A practical guide to wavelet analysis. Bull. Am. Meteorol. Soc. 1998, 79, 61–78. [Google Scholar] [CrossRef]
- Gao, Y. Structural Health Monitoring Strategies for Smart Sensor Networks, Microform Edition; University of Illinois at Urbana-Champaig: Champaign, IL, USA, 2005. [Google Scholar]
- Nagayama, T.; Spencer Jr, B.F.; Rice, J.A. Autonomous decentralized structural health monitoring using smart sensors. Struct. Control Health Monit Off. J. Int. Assoc. Struct. Control Monit. Eur. Assoc. Control Struct. 2009, 16, 842–859. [Google Scholar] [CrossRef]
- Sim, S.H.; Spencer, B.F., Jr.; Zhang, M.; Xie, H. Automated decentralized modal analysis using smart sensors. Struct. Control Health Monit. 2010, 17, 872–894. [Google Scholar] [CrossRef]
- Teolis, A.; Benedetto, J.J. Computational Signal Processing with Wavelets; Springer: Boston, MA, USA, 1998. [Google Scholar]
- Claesen, M.; De Moor, B. Hyperparameter Search in Machine Learning. arXiv 2015, arXiv:1502.02127. [Google Scholar]
- Zanakis, S.H.; Evans, J.R. Heuristic “optimization”: Why, when, and how to use it. Interfaces 1981, 11, 84–91. [Google Scholar] [CrossRef]
- Aldwaik, M.; Adeli, H. Advances in optimization of highrise building structures. Struct. Multidiscip. Optim. 2014, 50, 899–919. [Google Scholar] [CrossRef]
- Topping, B.H.V. Shape optimization of skeletal structures: A review. J. Struct. Eng. 1998, 109, 1933–1951. [Google Scholar] [CrossRef]
- Cong, S.; Jia, Y.; Deng, K. Particle Swarm and Ant Colony Algorithms and Their Applications in Chinese Traveling Salesman Problem. In New Achievements in Evolutionary Computation; Korosec, P., Ed.; IntechOpen: Rijeka, Croatia, 2010; pp. 298–302. [Google Scholar]
- Sivanandam, S.N.; Deepa, S.N. Genetic algorithm optimization problems. In An Introduction to Genetic Algorithms; Springer: Berlin/Heidelberg, Germany, 2008; pp. 165–209. [Google Scholar]
- Hare, W.; Nutini, J.; Tesfamariam, S. A survey of non-gradient optimization methods in structural engineering. Adv. Eng. Softw. 2013, 59, 19–28. [Google Scholar] [CrossRef]
- Dorigo, M.; Birattari, M.; Stutzle, T. Ant colony optimization. IEEE Comput. Intell. Mag. 2006, 1, 28–39. [Google Scholar] [CrossRef]
- Ng, S.T.; Zhang, Y. Optimizing construction time and cost using an ant colony optimization approach. J. Constr. Eng. Manag. 2008, 134, 721–728. [Google Scholar] [CrossRef]
- Christodoulou, S. Ant colony optimization in construction scheduling. In Proceedings of the International Conference on Computing in Civil Engineering, Cancun, Mexico, 12–15 July 2005; pp. 1–11. [Google Scholar]
- Kaveh, A.; Talatahari, S. An improved ant colony optimization for constrained engineering design problems. Eng. Comput. 2010, 27, 155–182. [Google Scholar] [CrossRef]
- Venter, G.; Sobieszczanski-Sobieski, J. Particle swarm optimization. AIAA J. 2003, 41, 1583–1589. [Google Scholar] [CrossRef] [Green Version]
- Wang, S.C. Artificial neural network. In Interdisciplinary Computing in Java Programming; Springer: Boston, MA, USA, 2003; pp. 81–100. [Google Scholar]
- Uddin, S.; Khan, A.; Hossain, M.E.; Moni, M.A. Comparing different supervised machine learning algorithms for disease prediction. BMC Med. Inform. Decis. Mak. 2019, 19, 1–16. [Google Scholar] [CrossRef] [PubMed]
- Rumelhart, D.E.; Hinton, G.E.; Williams, R.J. Learning representations by back-propagating errors. Nature 1986, 323, 533–536. [Google Scholar] [CrossRef]
- Li, J.; Cheng, J.H.; Shi, J.Y.; Huang, F. Brief introduction of back propagation (BP) neural network algorithm and its improvement. In Advances in Computer Science and Information Engineering; Springer: Berlin/Heidelberg, Germany, 2012; pp. 553–558. [Google Scholar]
- Pal, M. Deep neural network-based pier scour modeling. ISH J. Hydraul. Eng. 2019, 28, 80–85. [Google Scholar] [CrossRef]
- Maulud, D.; Abdulazeez, A.M. A review on linear regression comprehensive in machine learning. J. Appl. Sci. Technol. Trends 2020, 1, 140–147. [Google Scholar] [CrossRef]
- Sun, Y.; Zhang, J.; Li, G.; Wang, Y.; Sun, J.; Jiang, C. Optimized neural network using beetle antennae search for predicting the unconfined compressive strength of jet grouting coalcretes. Int. J. Numer. Anal. Methods Géoméch. 2019, 43, 801–813. [Google Scholar] [CrossRef]
- Sun, J.; Wang, J.; Zhu, Z.; He, R.; Peng, C.; Zhang, C.; Huang, J.; Wang, Y.; Wang, X. Mechanical Performance Prediction for Sustainable High-Strength Concrete Using Bio-Inspired Neural Network. Buildings 2022, 12, 65. [Google Scholar] [CrossRef]
- Charfi, I.; Miteran, J.; Dubois, J.; Atri, M.; Tourki, R. Definition and performance evaluation of a robust SVM based fall detection solution. In Proceedings of the 2012 Eighth International Conference on Signal Image Technology and Internet-Based Systems IEEE, Sorrento, Italy, 25–29 November 2012; pp. 218–224. [Google Scholar]
- Ukil, A. Support vector machine. In Intelligent Systems and Signal Processing in Power Engineering; Springer: Berlin/Heidelberg, Germany, 2007; pp. 161–226. [Google Scholar]
- Duan, K.; Keerthi, S.S.; Poo, A.N. Evaluation of simple performance measures for tuning SVM hyperparameters. Neurocomputing 2003, 51, 41–59. [Google Scholar] [CrossRef]
- Dong, S.; Yang, J. On computing the hyperparameter of extreme learning machines: Algorithm and application to computational PDEs, and comparison with classical and high-order finite elements. J. Comput. Phys. 2021, 463, 111290. [Google Scholar] [CrossRef]
- Oneto, L.; Bisio, F.; Cambria, E.; Anguita, D. Slt-based elm for big social data analysis. Cogn. Comput. 2017, 9, 259–274. [Google Scholar] [CrossRef]
- Bao, X.; Li, Y.; Li, J.; Shi, R.; Ding, X. Prediction of train arrival delay using hybrid ELM-PSO approach. J. Adv. Transp. 2021, 2021, 7763126. [Google Scholar] [CrossRef]
- Truong, V.H.; Vu, Q.V.; Thai, H.T.; Ha, M.H. A robust method for safety evaluation of steel trusses using Gradient Tree Boosting algorithm. Adv. Eng. Softw. 2020, 147, 102825. [Google Scholar] [CrossRef]
- Anghel, A.; Papandreou, N.; Parnell, T.; De Palma, A.; Pozidis, H. Benchmarking and optimization of gradient boosting decision tree algorithms. arXiv 2018, arXiv:1809.04559. [Google Scholar]
- Ghodsi, H.; Khanjani, M.J. Application of improved GMDH models to predict local scour depth at complex bridge piers. Civil Eng. J. 2020, 6, 69–84. [Google Scholar] [CrossRef]
- Najafzadeh, M.; Azamathulla, H.M. Neuro-fuzzy GMDH to predict the scour pile groups due to waves. J. Comput. Civ. Eng. 2015, 29, 04014068. [Google Scholar] [CrossRef]
- Madandoust, R.; Bungey, J.H.; Ghavidel, R. Prediction of the concrete compressive strength by means of core testing using GMDH-type neural network and ANFIS models. Comput. Mater. Sci. 2012, 51, 261–272. [Google Scholar] [CrossRef]
- Xu, L.; Wang, X.; Bai, L.; Xiao, J.; Liu, Q.; Chen, E.; Jiang, X.; Luo, B. Probabilistic SVM classifier ensemble selection based on GMDH-type neural network. Pattern Recognit. 2020, 106, 107373. [Google Scholar] [CrossRef]
- Stefenon, S.F.; Ribeiro, M.H.D.M.; Nied, A.; Mariani, V.C.; dos Santos Coelho, L.; da Rocha, D.F.M.; Grebogi, R.B.; de Barros Ruano, A.E. Wavelet group method of data handling for fault prediction in electrical power insulators. Int. J. Electrical Power Energy Syst. 2020, 123, 106269. [Google Scholar] [CrossRef]
- Samsudin, R.; Saad, P.; Shabri, A. River flow time series using least squares support vector machines. Hydrol. Earth Syst. Sci. 2011, 15, 1835–1852. [Google Scholar] [CrossRef] [Green Version]
- Martinek, R.; Zidek, J. The real implementation of ANFIS channel equalizer on the system of software-defined radio. IETE J. Res. 2014, 60, 183–193. [Google Scholar] [CrossRef]
- Vieira, J.; Dias, F.M.; Mota, A. Neuro-fuzzy systems: A survey. In Proceedings of the 5th WSEAS NNA International Conference on Neural Networks and Applications, Udine, Italia, 25–27 March 2004; pp. 1–6. [Google Scholar]
- Han, M.; Zhao, Y. Dynamic control model of BOF steelmaking process based on ANFIS and robust relevance vector machine. Expert Syst. Appl. 2011, 38, 14786–14798. [Google Scholar] [CrossRef]
- Fattahi, H.; Hasanipanah, M. An integrated approach of ANFIS-grasshopper optimization algorithm to approximate flyrock distance in mine blasting. Eng. Comput. 2021, 38, 2619–2631. [Google Scholar] [CrossRef]
- Zhang, J.; Zhao, H. A Prediction Model for Local Scour Depth around Piers Based on CNN. In Proceedings of the 2020 International Conference on Information Science, Parallel and Distributed Systems (ISPDS) IEEE, Xi’an, China, 14–16 August 2020; pp. 318–320. [Google Scholar]
- Dong, H.; Chen, F.; Zhou, H.; Guo, C.; Sun, Z. A Prediction Model for Local Scour Depth around Piers Based on Machine Learning. In IOP Conference Series: Earth and Environmental Science; IOP Publishing: Bristol, UK, 2020; Volume 525, No. 1; p. 012080. [Google Scholar]
- Khosravi, K.; Khozani, Z.S.; Mao, L. A comparison between advanced hybrid machine learning algorithms and empirical equations applied to abutment scour depth prediction. J. Hydrol. 2021, 596, 126100. [Google Scholar] [CrossRef]
- Tien Bui, D.; Shirzadi, A.; Amini, A.; Shahabi, H.; Al-Ansari, N.; Hamidi, S.; Singh, S.K.; Thai Pham, B.; Ahmad, B.B.; Ghazvinei, P.T. A Hybrid Intelligence Approach to Enhance the Prediction Accuracy of Local Scour Depth at Complex Bridge Piers. Sustainability 2020, 12, 1063. [Google Scholar]
- Ebtehaj, I.; Sattar, A.M.; Bonakdari, H.; Zaji, A.H. Prediction of scour depth around bridge piers using self-adaptive extreme learning machine. J. Hydroinform. 2017, 19, 207–224. [Google Scholar] [CrossRef]
- Ebtehaj, I.; Bonakdari, H.; Moradi, F.; Gharabaghi, B.; Khozani, Z.S. An integrated framework of Extreme Learning Machines for predicting scour at pile groups in clearwater conditions. Coast. Eng. 2018, 135, 1–15. [Google Scholar] [CrossRef]
- Ebtehaj, I.; Bonakdari, H.; Zaji, A.H.; Sharafi, H. Sensitivity analysis of parameters affecting scour depth around bridge piers based on the non-tuned, rapid extreme learning machine method. Neural Comput. Appl. 2019, 31, 9145–9156. [Google Scholar]
- Richardson, E.V.; Davis, S.R. Evaluating Scour at Bridges; (No. FHWA-NHI-01-001); The United States. Federal Highway Administration, Office of Bridge Technology: Lakewood, CO, USA, 2001.
- Johnson, P.A. Reliability-based pier scour engineering. J. Hydraul. Eng. 1992, 118, 1344–1358. [Google Scholar] [CrossRef]
- Shen, H.W.; Schneider, V.R.; Karaki, S. Local scour around bridge piers. J. Hydraul. Div. 1969, 95, 1919–1940. [Google Scholar] [CrossRef]
- Sreedhara, B.M.; Patil, A.P.; Pushparaj, J.; Kuntoji, G.; Naganna, S.R. Application of gradient tree boosting regressor for the prediction of scour depth around bridge piers. J. Hydroinform. 2021, 23, 849–863. [Google Scholar] [CrossRef]
- Cheng, M.Y.; Cao, M.T.; Wu, Y.W. Predicting equilibrium scour depth at bridge piers using evolutionary radial basis function neural network. J. Comput. Civ. Eng. 2015, 29, 04014070. [Google Scholar]
- Van Wilson, K. Scour at Selected Bridge Sites in Mississippi; US Department of the Interior: Washington DC, USA; US Geological Survey: Denver, CO, USA, 1995; Volume 94, No. 4241.
- Froehlich, D.C. Analysis of onsite measurements of scour at piers. In Hydraulic Engineering: Proceedings of the 1988 National Conference on Hydraulic Engineering; American Society of Civil Engineers: New York, NY, USA, 1988; pp. 534–539. [Google Scholar]
- Hoang, N.D.; Liao, K.W.; Tran, X.L. Estimation of scour depth at bridges with complex pier foundations using support vector regression integrated with feature selection. J. Civ. Struct. Health Monit. 2018, 8, 431–442. [Google Scholar]
- Melville, B.W.; Coleman, S.E. Bridge Scour; Water Resources Publication: Littleton, CO, USA, 2000. [Google Scholar]
- Ataie-Ashtiani, B.; Baratian-Ghorghi, Z.; Beheshti, A.A. Experimental investigation of clear-water local scour of compound piers. J. Hydraul. Eng. 2010, 136, 343–351. [Google Scholar] [CrossRef]
- Kim, I.; Fard, M.Y.; Chattopadhyay, A. Investigation of a bridge pier scour prediction model for safe design and inspection. J. Bridge Eng. 2015, 20, 04014088. [Google Scholar] [CrossRef]
- Liao, K.W.; Muto, Y.; Lin, J.Y. Scour depth evaluation of a bridge with a complex pier foundation. KSCE J. Civ. Eng. 2018, 22, 2241–2255. [Google Scholar]
- Amini, A.; Mohammad, T.A. Local scour prediction around piers with complex geometry. Mar. Georesources Geotechnol. 2017, 35, 857–864. [Google Scholar] [CrossRef]
- Mueller, D.S.; Wagner, C.R. Field Observations and Evaluations of Streambed Scour at Bridges; (No. FHWA-RD-03-052); United States, Federal Highway Administration, Office of Research, Development, and Technology: Richmond, VA, USA, 2005.
Figure 1.
Scour monitoring devices - copied from [32].
Figure 1.
Scour monitoring devices - copied from [32].

Table 2.
Properties of devices used in direct monitoring studies.
| Study Ref. | Device Type | Sensing Mechanism | Signal Processing Method | The Target Property of Signal Processing | Scour Validation Tests | Laboratory or Field Tests | Target Property |
|---|---|---|---|---|---|---|---|
| [45] | Unconstrained distributed fiber optic sensors | Ultra-weak fiber Bragg grating | Empirical formula | Central wavelengths | Detecting different signals of set of fibers embedded in sand and other fibers freely in water | Standard deviation value higher than zero for several minutes | Scour depth and location |
| [44] | Velocity sensors, inclinometer, wireless transmitter, and camera | 2 Velocity sensors | Hilbert transform and empirical mode decomp. | Individual instant frequencies | Single-pier laboratory scour test | Caisson-type and pile-group foundation scour tests | Rigid body motion |
| [48] | Rod sensor | Piezoelectric Polymer Film | Wavelet packet transform and Hilbert transform | Instant the natural frequency of the rod | Flume test | Test with different pier cross-sections | Scour depth |
| [49] | Piezoelectric Polymer Film | Fast fourier transform | Instant natural frequency of the rod | Clamped to a laboratory bench | None | ||
| Planted in sand | |||||||
| Implemented in the sand | |||||||
| [50] | Flume test | Tested on 1 pier | |||||
| [51] | 1 Direction-Unknown and 1 Direction-Known smart rocks | Ambient magnetic field | Theory of magnetic field | Distribution of the magnetic field induced by smart rocks | Field validation tests | Tests on the upstream side of a pier | Localize the position or track the move of the smart rock |
| [52] | E.magnetic sensors | Changes in the dielectric permittivity of the soil | The reflection feature of e.magnetic waves | The porosity of the soil | ‘Static’ scour simulations | Not provided | Scour depth variation |
| Real-time open channel flume tests | |||||||
| [55] | Unmanned Aerial Vehicle -based smart rock positioning system | 3-axis magnetometer and global positioning system on Unmanned Aerial Vehicle | Algorithm to locate smart rocks using measured magnetic intensities | Magnetometer measuring magnetic fields before and after the smart rock has been deployed | Not provided | I-44W Roubidoux Creek Bridge Pier | Depth of scour, i.e., vertical move of the rock |
Disclaimer/Publisher’s Note: The statements, opinions and data contained in all publications are solely those of the individual author(s) and contributor(s) and not of MDPI and/or the editor(s). MDPI and/or the editor(s) disclaim responsibility for any injury to people or property resulting from any ideas, methods, instructions or products referred to in the content. |
© 2023 by the authors. Licensee MDPI, Basel, Switzerland. This article is an open access article distributed under the terms and conditions of the Creative Commons Attribution (CC BY) license (https://creativecommons.org/licenses/by/4.0/).
Share and Cite
MDPI and ACS Style
Tola, S.; Tinoco, J.; Matos, J.C.; Obrien, E. Scour Detection with Monitoring Methods and Machine Learning Algorithms—A Critical Review. Appl. Sci. 2023, 13, 1661. https://0-doi-org.brum.beds.ac.uk/10.3390/app13031661
AMA Style
Tola S, Tinoco J, Matos JC, Obrien E. Scour Detection with Monitoring Methods and Machine Learning Algorithms—A Critical Review. Applied Sciences. 2023; 13(3):1661. https://0-doi-org.brum.beds.ac.uk/10.3390/app13031661
Chicago/Turabian StyleTola, Sinem, Joaquim Tinoco, José C. Matos, and Eugene Obrien. 2023. "Scour Detection with Monitoring Methods and Machine Learning Algorithms—A Critical Review" Applied Sciences 13, no. 3: 1661. https://0-doi-org.brum.beds.ac.uk/10.3390/app13031661
Note that from the first issue of 2016, this journal uses article numbers instead of page numbers. See further details here.