

A System Dynamics Approach to Optimize Milk Production in an Industrial Ranch

1
Department of Industrial Management, Vali-e-Asr University, Rafsanjan 7718897111, Iran
2
Department of Management, Vali-e-Asr University, Rafsanjan 7718897111, Iran
3
Department of Astronautics, Electrical and Energetic Engineering (DIAEE) Sapienza University, 00184 Rome, Italy
4
Department of Electrical and Computer Engineering, University of Louisiana at Lafayette, Lafayette, LA 70504, USA
*
Author to whom correspondence should be addressed.
Appl. Sci. 2023, 13(3), 1662; https://0-doi-org.brum.beds.ac.uk/10.3390/app13031662
Submission received: 13 December 2022
/
Revised: 21 January 2023
/
Accepted: 25 January 2023
/
Published: 28 January 2023
(This article belongs to the Special Issue Evolutionary Algorithms and Large-Scale Real-World Applications)
Abstract
:The milk production process on an industrial ranch consists of various and regular activities, with each requiring a proper management approach. Different variables also affect the milk production process, and the maximum milk production is achieved by identifying critical variables. This work was motivated by the Fereidan Ahrar ranch management in Isfahan, Iran, which seeks to identify and optimize important variables to increase milk production. This unit also considers livestock omission due to disease and losses as one of the important issues. This kind of omission is followed by the increased medical costs of the ranch. This paper investigated a system dynamics approach and Vensim software to simulate the milk production process considering the combination of demographic livestock and medical costs. System sensitivity was analyzed using the design of experiment (DOE) technique and some scenarios were proposed to maximize milk production by identifying and tuning important variables affecting milk production. The simulation results of the designed model showed five important variables affecting milk production. These variables include the production cycle rate, voluntary omission rate, change rates of female calves per year that are entered into the life cycle of the ranch, pregnant heifers that become dairy herds after calving, and finally, the effect of the medical costs.
1. Introduction
Research into increasing milk production has motivated several studies covering different aspects such as studies carried out in vitro and through different experiments on livestock race and nutrition with the aim of increasing milk production [1,2,3]. According to a report by Baldini et al. [4], milk production is associated with environmental effects such as climate change and or loss of environmental variety. Hence, studies aiming at the life cycle assessment (LCA) define the maximum milk production considering the environmental effects. The milk production model of dairy cows that is related to the energy and nitrogen dynamics is an animal growth and metabolism model that investigates livestock conditions in terms of fat, water, energy dynamic, etc. [1,5,6]. In addition to milk production, some issues such as livestock demographic trends, the estimation of economic loss caused by livestock mortality, and the study of major livestock diseases causing losses are related to the analysis and dynamics of the livestock population that was investigated [7,8,9,10,11].
A potentially valuable technique for research on ranches and milk production is the development of an accurate model that takes into consideration what occurs in reality and not what the researchers develop in vitro. The simulated model is able to predict successful production under different scenarios [12,13]. The system dynamics method studies the knowledge system related to the real world [14]. This latter is a computer-based modeling technique that can be used as a decision support system (DSS) to analyze management policies and can dynamically analyze the complicated economic, social, and managerial problems associated with the problem at hand.
One of the subdivisions of the Ahrar Sepahan Corporation in Isfahan, Iran, is the Ahrar Fereidan ranch, whose management is faced with an increasing cost of milk production resulting from elevated medical costs and a reduction in the number of livestock in different classifications in recent years. It also suffers omissions resulting from livestock losses and diseases. In this paper, casual loop and stock-flow diagrams of the Fereidan Ahrar ranch were first simulated using a system dynamics approach. Then, the sensitive variables were identified and their optimal value was obtained through the design of experiment (DOE) technique. Different scenarios are defined to maximize milk production according to the optimized values resulting from the DOE technique. Such scenarios will help the management of this ranch to optimize the medical costs in order to properly concentrate these costs on sections that will improve milk production.
2. Literature Review
A this research aimed to maximize milk production at the Ahrar Sepahan ranch using a dynamic system approach, the literature review was divided into two parts. In the first part, since animal production systems are generally complicated and management decision-making problems are often developed in light of this complexity [12], we focused on research efforts geared toward understanding the milk production process. In the second part, we considered scenario definitions in the form of the system dynamics model. These scenarios were defined after the identification of sensitive variables and their optimization through the DOE technique. DOE is among the statistical methods for determining key variables affecting the qualitative specification in question. Based on his studies in the 1950s and 1960s, Genichi Taguchi authenticated the DOE. Statistical design for empirical experiments is a principle in laboratory and industrial research. These designs lead to more reliable results, saving time, and significantly reducing the number of experiments, ultimately leading to process optimization. The DOE is a useful method by which the data are analyzed for objective validity and deduction before the experiments. By performing pilot studies and experimental plans, one can determine the optimal value of the measurement results (responses) or the conditions in which the conflicting responses have proper adaptation.
An important issue in industrial ranching is coping with different diseases in order to increase the production and milk quality. The first goal of animal health economics is to provide knowledge of the costs related to different livestock diseases and the second goal is to support decision-making on the most cost-efficient techniques to reduce these diseases [9]. One critical disease is the mastitis disorder in dairy cows, which is related to the rate of milk production [9,15]. The study reported by Fusi et al. [7] recognizes metabolic/digestive disorder, mastitis/udder problems, and calving problems as the major causes of livestock death. In addition to disease, determination of the age at first calving (AFC), which indicates the growth rate of heifers, is considered as one of the main parameters in herd health programs. The suitable development of replacement heifers as an important calving program and the continuation of the production process in the herd was considered by Salazar-Carranza et al. [16].
Proper management techniques improve the milk production status. Research carried out by Khanal et al. [17] recommends that in order to maximize productivity in the U.S. milk production industry, it is necessary to use technologies with an integrated systematic approach on one hand, and implement a proper technique considering the size of the farm on the other hand. One of these technologies is the automatic milking system (AMS), which is used regarding the conditions and environment. For example, Tremblay et al. [2] divided 529 dairy farms in North America into six categories in terms of using an automatic milking system and proposed some recommendations for each category to increase productivity. Steeneveld et al. [18] proposed the use of sensor systems that led to the improved management of different health care activities as well as production in lactating cattle. These systems could measure the physiological, behavioral, and production indicators of each cow. In research carried out on Kentucky Holstein herds, the respondents recognized four management techniques as factors influencing the improvement of milk production including attention to detail, nutrition, cow comfort, and nutrition quality [19].
The majority of animal husbandry studies (a branch of science dealing with farming, breeding and care of farm animals) including laboratory, hygiene, and management studies consider livestock population as an important factor. The dynamics of livestock population are critical to understanding the characteristics and developing the capacity of production systems [7,12]. Existing studies investigated a target population. Khanal et al. [17] noted the increase in the average size of each cattle in the U.S. from 19 cows in 1970 to 120 cows in 2006. The analyzed data in the study reported by Salazar-Carranza et al. [16] were on pure Holstein cows in the Costa Rican specialized dairy industry. Fusi et al. [7] dealt with the study of the main mortality cause of 251 cows in 137 Italian farms. The average size of 130 herds investigated in the study reported by Reyes et al. [20] was composed of 32 cows.
In the above-mentioned studies, the importance of the identification of different livestock diseases, demographic trends in livestock, use of management techniques, and even new technologies in milk production and the maintenance of livestock health was identified. However, as mentioned earlier, one useful technique in the field of livestock studies is to use a dynamic system [12]. Bastan presented an integrated and systemic model to analyze the existent dynamics in the sustainable development of Iran’s farming industry [21]. The dynamic systems portray the simulation of what is being done in the real world [14]; therefore using this management technique, an industrial ranch will be able to concentrate on important variables to increase milk production. After modeling the livestock population dynamics and considering the effect of disease and losses, along with the costs spent to reduce them, the management can then focus on the use of technologies, appropriate management techniques, optimization of the costs, and even the implementation of medical and animal tests on important variables to increase milk production.
3. Research Model
System dynamics modeling was used in this research. System dynamics is a widely used technique for the conceptualization and analysis of many issues in science [14,22,23] and can analyze the issues related to system dynamics behavior under different conditions over time [24,25,26]. The systematic approach of system dynamics (SD) modeling in this article consisted of the following steps:
- Describe the system at Fereidan Ahrar ranch through a causal loop diagram;
- Describe the system at Fereidan Ahrar ranch through the stock and flow diagram;
- Develop and formulate the model structure and develop the related mathematical models that indicate different interactions in the system;
- Identify the critical variables and determine their optimal values through the DOE technique;
- Show the model’s output based on optimal values;
- Define different scenarios to maximize milk production based on the optimized values.
3.1. Causal Loop Diagram
The causal loop and stock-flow diagrams were used to model the system dynamics. The causal loop diagram consists of two balance loops and a reinforcing loop. Every arc in the causal loop is marked by (−) or (+). The mark (+) indicates that if the first variable is changed, then the second variable will be changed in the same direction. The mark (−) indicates that if the first variable is changed, the second variable will be changed in the opposite direction [14,27]. In this paper, the causal diagram of Fereidan Ahrar ranch consisted of five loops. The causal diagram of Fereidan Ahrar ranch was formed from a total of five loops, two reinforcing loops and three balance loops, as shown in Figure 1.
The different balance loops and reinforcing loops are described separately.
The central loop in the causal diagram as shown in Figure 2 is recognized as the ranch’s life loop. A part of the dairy herd is to breed, which consists of pregnant dairy cows and pregnant dry cows. Of the newborn calves, the female calves are considered as a heifer. The heifers, after calving, are considered as dairy milk. The flashes in this loop have been labeled as (+) indicating that with the increase and decrease of livestock in a group (dairy herd, calf, and heifer), another group also increases or decreases.
Of the different livestock classes, some livestock is removed due to different diseases and losses. This kind of loss not only affects the survival of the stockyard, but also results in increased medical costs. In each class, the common disease that causes the omission is related to infectious diseases as well as metabolic and digestive diseases. In Figure 1, the loops B1, B2, and B3, named as the control, protection, and development loops, respectively, indicate the relationship between the medical cost, obligatory omission, and the number of healthy livestock in its certain loop. Loop B1 is described as the sample. In Figure 3, with an increase in the number of calves, on one hand, the medical cost is increased for each calf, and obligatory omission takes place on the other hand. However, what causes the balance in this loop is the effect of medical costs on the decrease in obligatory omission, and thus they help to preserve healthy calves.
The last loop in the causal diagram of Fereidan Ahrar ranch is called the production loop, as shown in Figure 4. The components of this loop consist of the percentage of the dairy herd that carries out milk production. This percentage includes pregnant and non-pregnant dairy cows. On the other hand, the birth rate of calves is determined based on the percent of the dairy herd that has calved, and therefore, it is also an indicator of pregnant dry cows. With the increase in the number of calves, the internal milk consumption is increased and it can also be said that with an increase in milk production and calves from the dairy herd, the flashes labeled as positive (+) affect the internal consumption loop from two directions.
3.2. Stock–Flow Diagram
The causal diagram was used to draw and make the stock–flow diagram. The most appropriate way to convert a causal diagram to a stock–flow diagram is to use Vensim software [14,28]. In this article, Vensim software version 6.4E was used to draw the stock–flow diagram. The stock–flow diagram consists of the stock, flow, and auxiliary variables. The stock variables are those variables by which the model’s state is shown. The flow variable is defined as a function of time that increases and decreases the stock variable, and finally, the auxiliary variables are those variables that help to better visualize the behavior of the flow variables [14]. The description of variables used in the stock–flow diagram of Fereidan Ahrar ranch is shown in Table 1. In each stock–flow diagram, the stock variables are shown with a rectangular box indicating the flow accumulated in that stock [22]. In the stock–flow diagram of Fereidan Ahrar ranch, as shown in Figure 5, there were four stock variables, 12 flow variables, and 18 auxiliary variables. The description of each of these variables along with the measurement unit is shown in Table 1.
3.3. Developing and Formulating the Model Structure and Mathematical Models
There are four stock variables in the stock–flow diagram of the Fereidan Ahrar ranch. Equation (1) indicates the input and output flow diagrams from the calf stock variable. This stock variable shows the number of female and male calves. The initial amount of this stock variable is the number of female and male calves at the beginning of 2013 at Ahrar ranch.
Equation (2) is the input flow variable to a stock variable, and finally to the whole ranch’s system, which is obtained by multiplying 0.72% of the dairy herd including pregnant dairy cows and pregnant dry cows to the production rate, as shown in Equation (3).
Three flow variables are removed from the calf’s stock variable. The first removed flow variable is a voluntary omission. The voluntary omission indicates the male calves that are removed from the whole ranch system. The rate of this omission is shown in Equation (4), which t is obtained by multiplying the calf to voluntary omission rate, as shown in Equation (5).
The second output flow variable is an obligatory omission from this stock variable due to disease and losses. Equations (6)–(9) are respectively related to the calculation of this flow variable. The flow variable of obligatory omission from the calf is obtained by multiplying the obligatory omission rate, Equation (7), minus the medical costs for the calf, Equation (8), divided by the effect of medical costs, Equation (9).
The last output flow variable is from the number of female calves that are recognized as a heifer after a year. All medical costs, type of nutrition, and maintenance costs will vary for heifers after entering this period. Equation (10), which is obtained from the multiplication of the auxiliary variable of input rate 1, as shown in Equation (11), to the calf’s stock variable, identifies this amount. This given amount is considered as the heifer’s input flow variable.
The formulation of the heifer stock variable, Equation (12), is similar to the calf stock variable with the difference in that there is not a voluntary omission in a heifer. As mentioned, Equations (10) and (11) are the input flow variable to the heifer stock variable. Equations (13)–(16) are the flow variable of obligatory omission from a heifer. Equations (17) and (18) also calculate the number of pregnant heifers that are recognized as the dairy herd after calving.
The last stock variable related to the existing population system at Fereidan Ahrar ranch is a stock variable of the dairy herd. The input flow variable to this stock variable is similar to the calculated value through Equations (17) and (18). Equation (19) shows the mathematical equation of this stock variable. The output flow variables of obligatory omission and voluntary omission reduce the number of this stock variable. There is no difference between the formulation of these two output flow variables from the dairy herd with output flow variables from the heifer and calf. The only difference is in the number of auxiliary variables. Equations (20)–(23) show the calculated amount of the flow variable of obligatory omission, and Equations (23) and (24) show the flow variable of voluntary omission, respectively.
Equation (26) indicates the flow variable of the production cycle. The production cycle is the number of dairy cows entered into the milk production cycle from the dairy herd. The formulation of this amount is obtained by multiplying 0.74% of the dairy herd, Equation (27), to the dairy herd.
Three flow variables and five auxiliary variables are used in the formulation of the milk stock variable (Equation (28)). The variable of input flow is called production. Equation (29) shows the rate of the annual milk production of the ranch. The milk production rate is obtained from the multiplication of the production rate of dairy cows per year, Equation (30), to the number of dairy cows. The output flow variable is from the internal milk consumption box and sale rate. To calculate the internal consumption rate according to Equation (29), the number of calves is multiplied by the birth rate and then to the milk consumption rate, as shown in Equation (30). The sale rate was obtained from the multiplication of remaining milk from internal consumption, which was equal to 0.9763%, and it has been shown in Equation (34), to the milk stock variable in Equation (33).
3.4. Identification of Important Variables and Their Optimization through DOE Technique
Although the modeling approach of system dynamics is applicable to identify the system’s behavior over time, the determination of the rate of the effect of different factors in problem-solving is also important. Therefore, the DOE technique is used to determine the interaction of all factors together and the adjustment of different factors. The DOE technique, as a statistical tool, is widely used to systematically analyze the identification of the effect of different factors as well as the interactions they have with each other [24]. In this article, the DOE technique was used to identify important variables and to optimize the response variable. The used software was Minitab software version 17.1. To obtain the optimal results, the important variables must first be recognized in order to maximize milk production. The DEO technique route in Minitab software to identify important variables is as follows:
Stat→ DOE→ Factorial→ Create Factorial Design…→ Plackett–Burman design
The number of auxiliary variables of the designed stock–flow diagram is equal to 18. These variables indicate the effective factors in milk production. To identify the important variables in the DOE technique, it is necessary to consider the high level and low level of each factor. These levels have been considered by collecting the ideas of five experts from different sections of the Fereidan Ahrar ranch and investigating the previous statistics. The given low and high levels are shown in Table 2. Figure 6 and Figure 7 show the results obtained from 40 experiments on the response variable of production in year 12. As can be seen in these diagrams, among the 18 auxiliary variables, the variables that were the most important in milk production were production cycle rate, voluntary omission rate 2, input rate 1, input rate 2, and finally the effect of medical costs 3, respectively. From these experiments, it can also be concluded that the obligatory omission was controlled in two classes of heifer and calf, and there was no need to spend more costs to control it. Therefore, it is important to control obligatory and voluntary omissions from the dairy herd.
After the identification of important variables, three levels were considered including two high and low levels and the real rate of the important variable, and then the full tests were carried out to gain the optimal value of each variable. The route for conducting tests in software Minitab is as follows:
Stat→ DOE→ Factorial→ Create Factorial Design … → General Full Factorial Design
Figure 8 and Figure 9 show the results obtained from 243 experiments. Figure 8 shows the effect of the identified important variables on the production response variable. The interaction diagram shows the mutual effect of the variables on production. For example, with an increase in the production cycle rate from 0.72% to 0.76%, the average production also increased. The mutual effect of this variable aligned with input variable 1. This means that with an increase in the production cycle rate and input rate 1, the production rate increases. Figure 9 shows the optimal level of each variable for the maximum milk production. If these values are added, then the milk production rate as the response variable is equal to 249,220 kg in year 12. Different scenarios were defined according to these values. To define scenarios, the optimal values were entered into the stock–flow diagram and then their effect on the related flow variable and production response variable were compared. Figure 10 shows the effect of all of the optimal values compared to the initial values of the rate variables.
4. Results and Discussion
According to the optimal value obtained from Figure 9, the comparison before and after adding the optimal value of the production cycle rate to the variable of the production cycle is shown in Figure 10. Figure 11 shows the effect of the optimal amount on milk production. In this Figure, curve 1 indicates the rate of the production cycle and milk production with the current rate of the production cycle, and curve 2 indicates the optimal amount.
In order to obtain the optimal amount, the ranch needs to concentrate on reducing the calving to milking distance as well as the length of the dry period in the dairy cow. This was specified considering the biological factors of dairy cows such as sex, nutrition, etc. Therefore, the savings resulting from the medical costs in two classes of calf and heifer should be of focus in the expansion of this variable. Figure 12 and Figure 13 respectively show the effect of the current and optimal amounts of input rate 1 on the input flow variable 1 and variable of milk production response. Additionally, Figure 14 and Figure 15 are the effects of the current and optimal amounts of input rate 2 on the input flow variable 2 and milk production response variable, respectively. The optimal amounts of these four diagrams indicate the importance of heifers in the continuing process of ranch activity. Therefore, considering this class of livestock guarantees the future maximum milk production at Fereidan Ahrar ranch. As mentioned before, the results obtained from the analysis of the stock–flow diagram through the DOE technique in the first step shows the status control of the obligatory omission from this class. Therefore, the management should focus on reducing the time interval of exploitation from this class. On the other hand, policies such as purchasing new heifers will help to improve the input and output variables of this class of livestock.
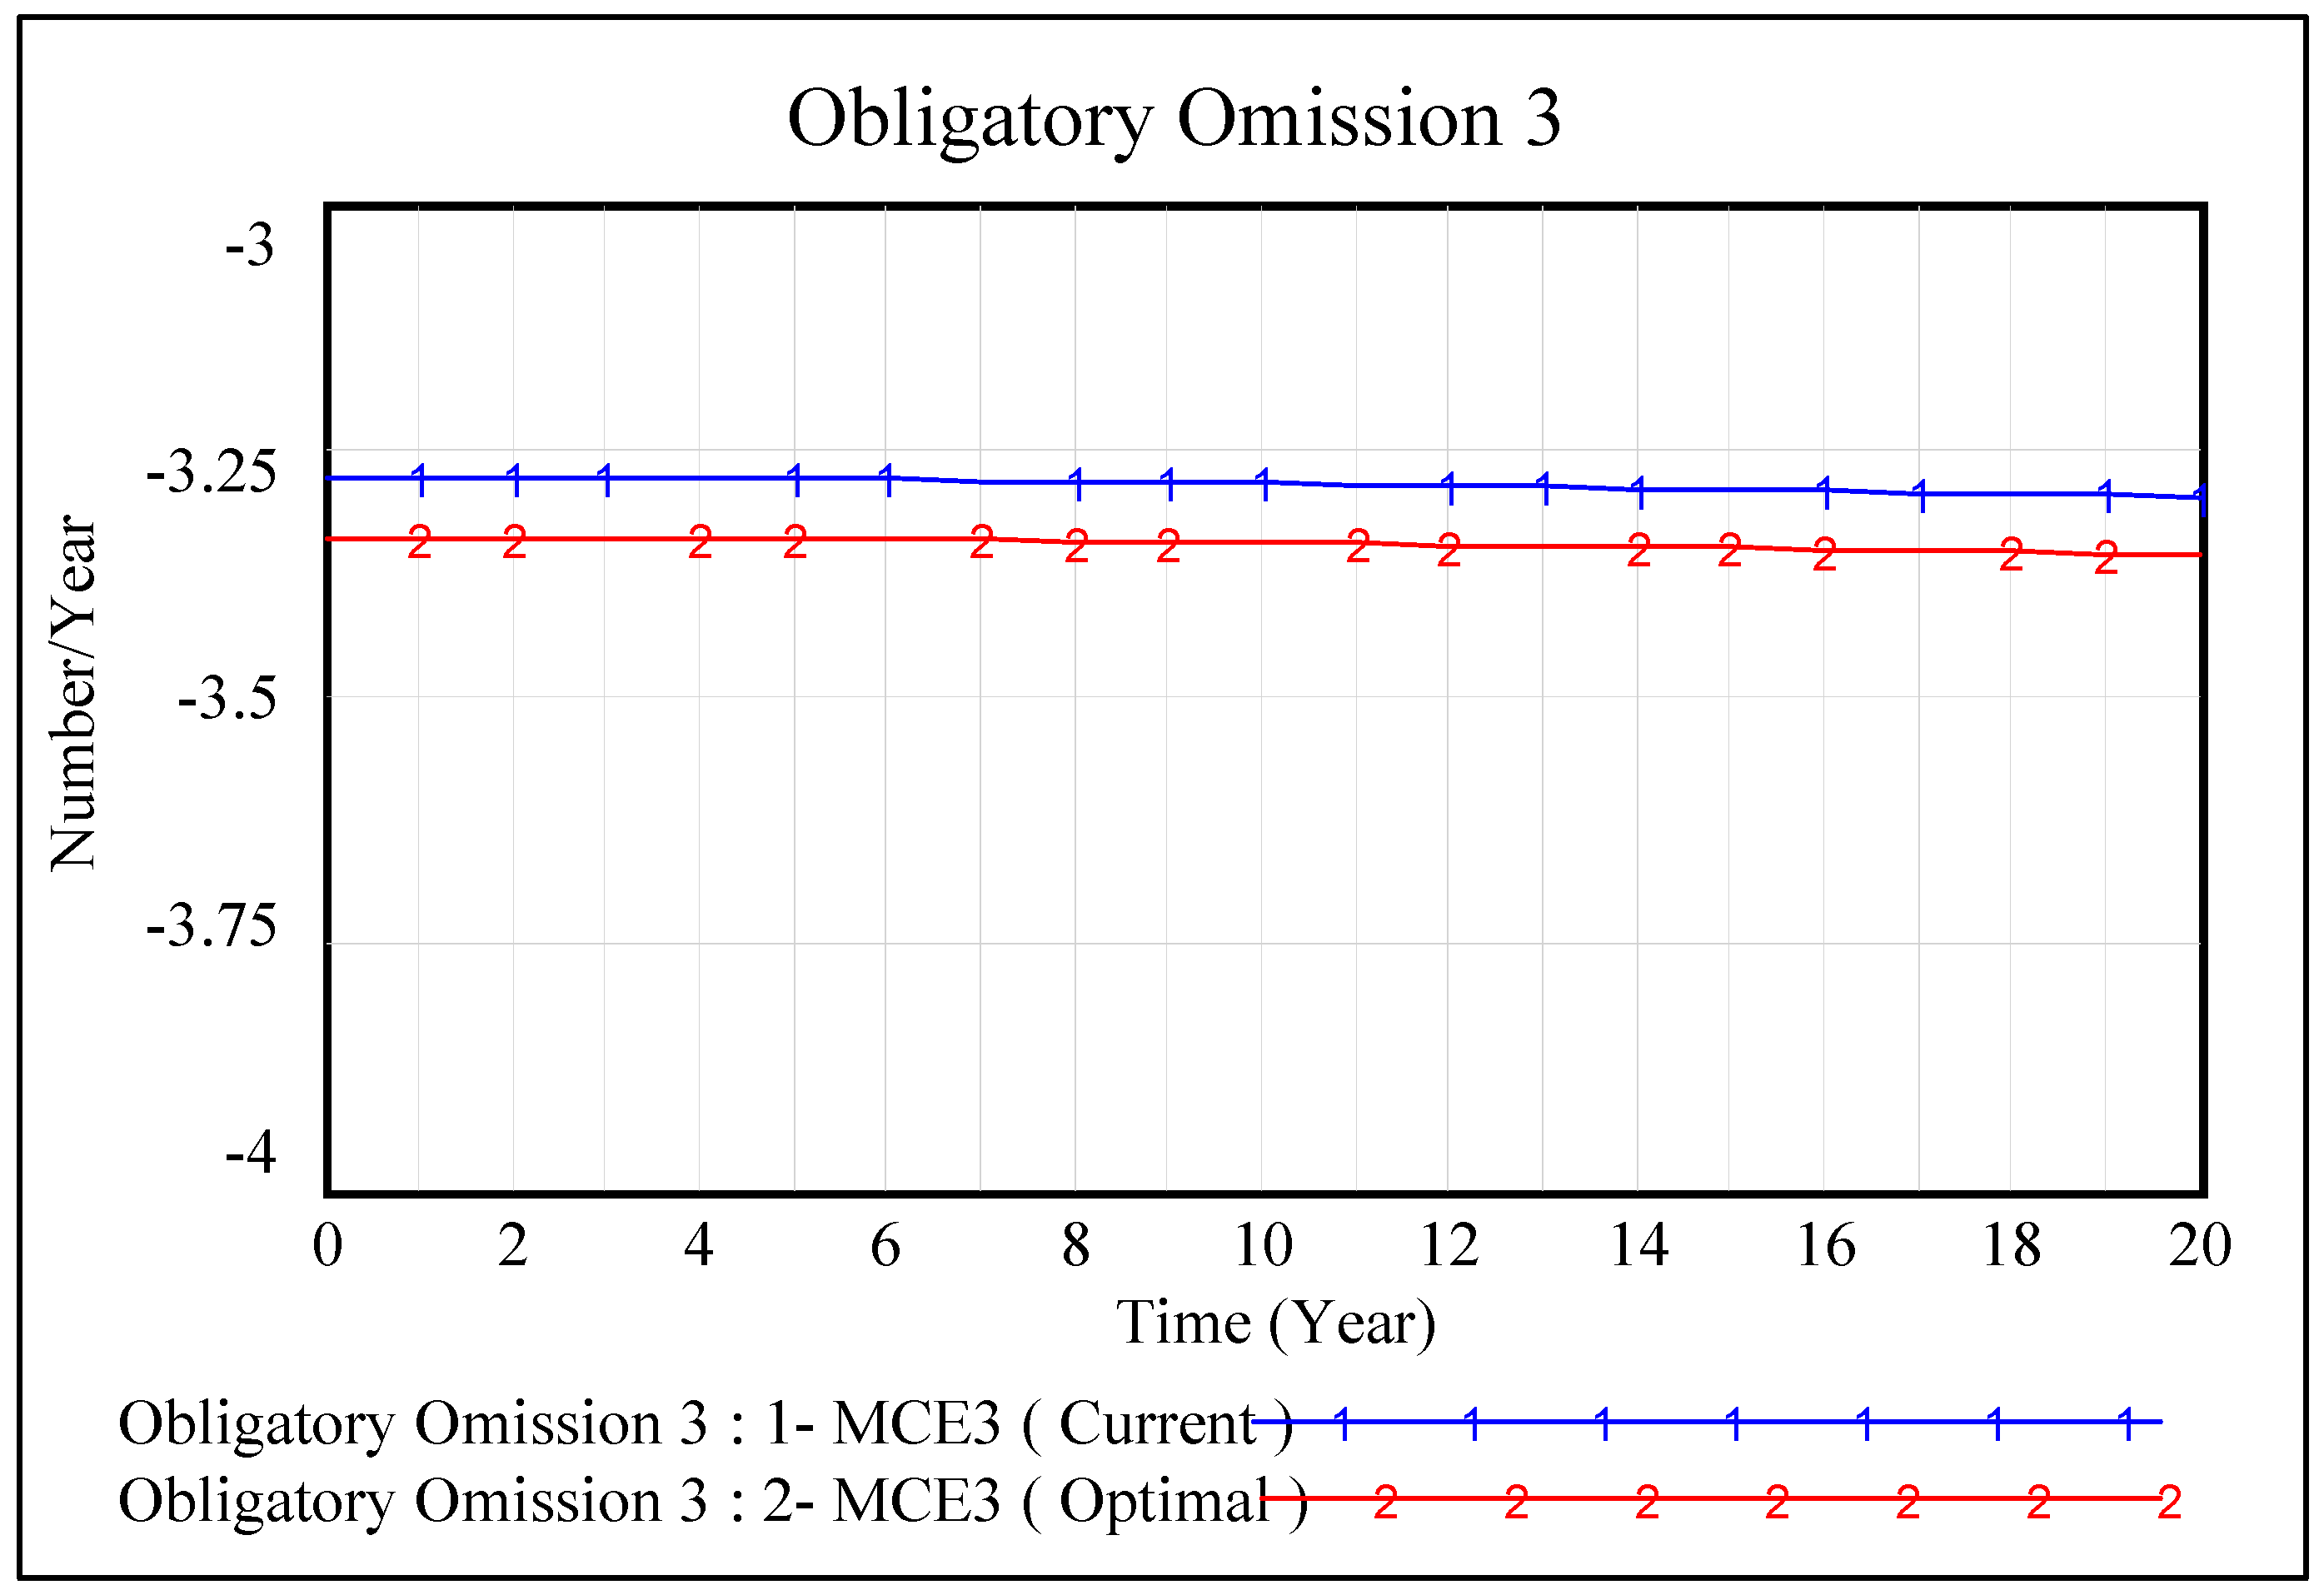
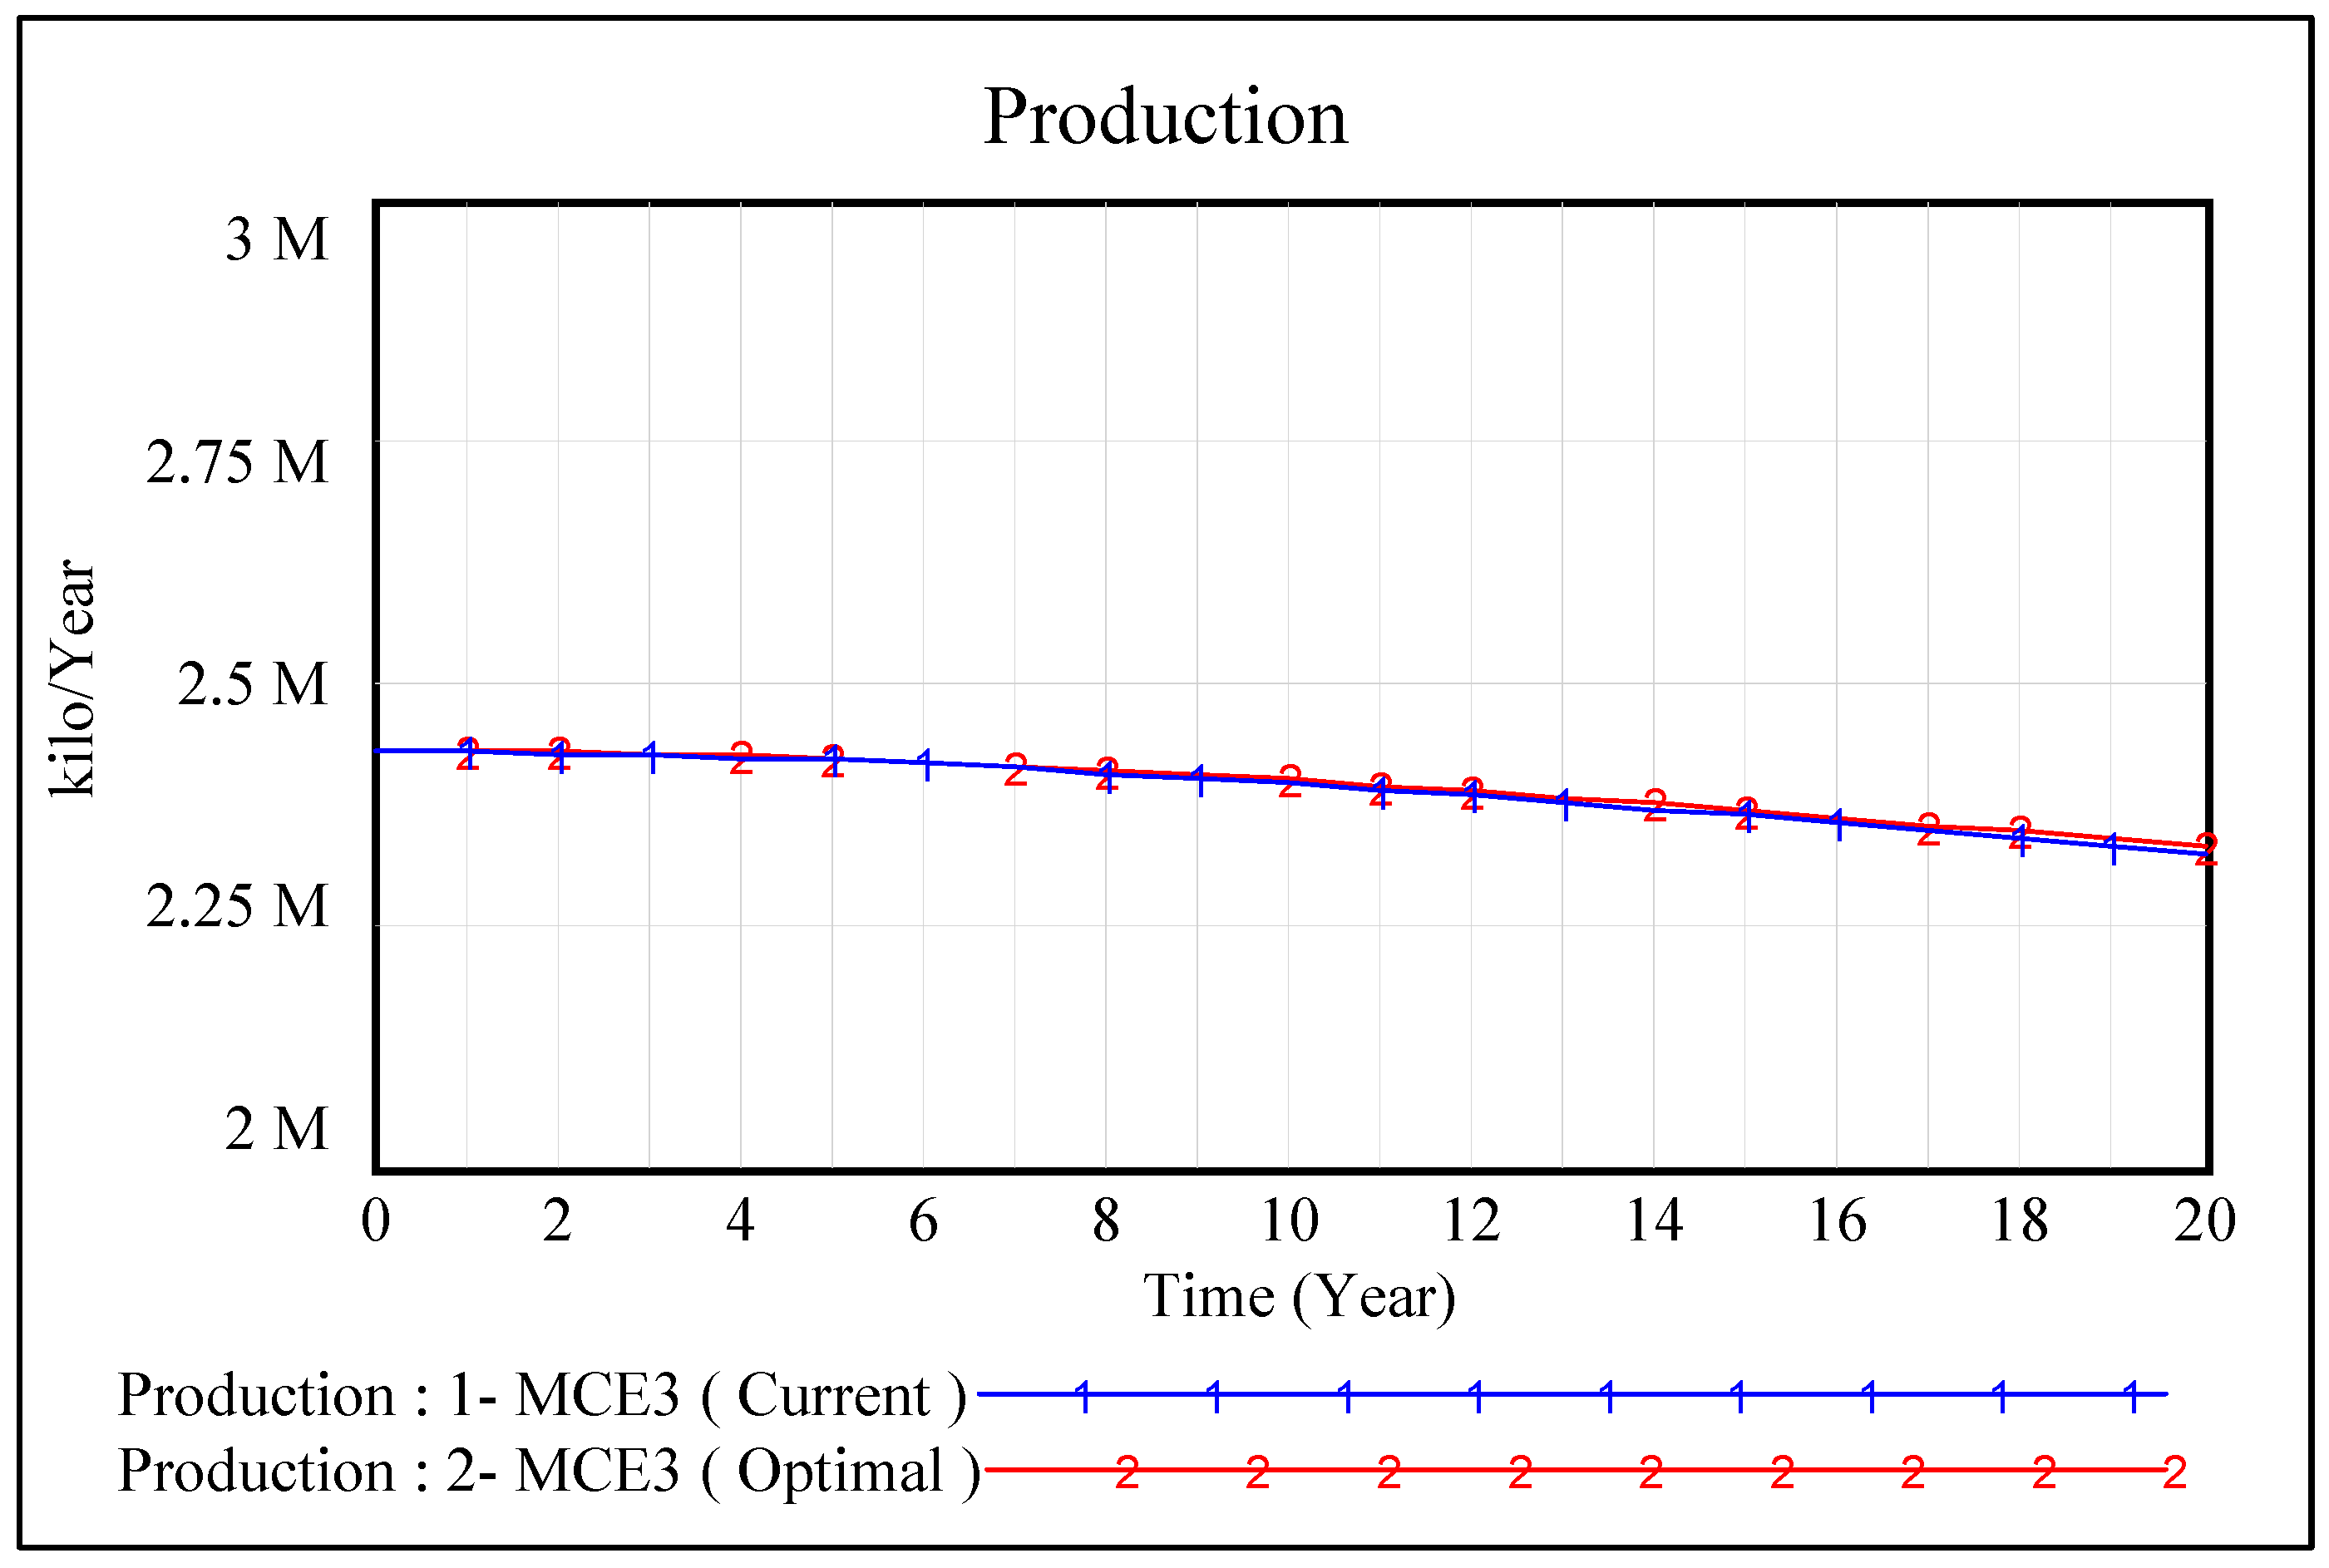
Figure 16 and Figure 17 depict the effect of the current and optimal amounts of the effect of medical costs 2 on the current variable of the obligatory omission 3 and response variable of milk production, respectively. The only class that its obligatory omission does not control is dairy herd. Therefore, the, Fereidan Ahrar ranch needs to focus on increasing the medical costs of this class in order to reduce losses and disease.
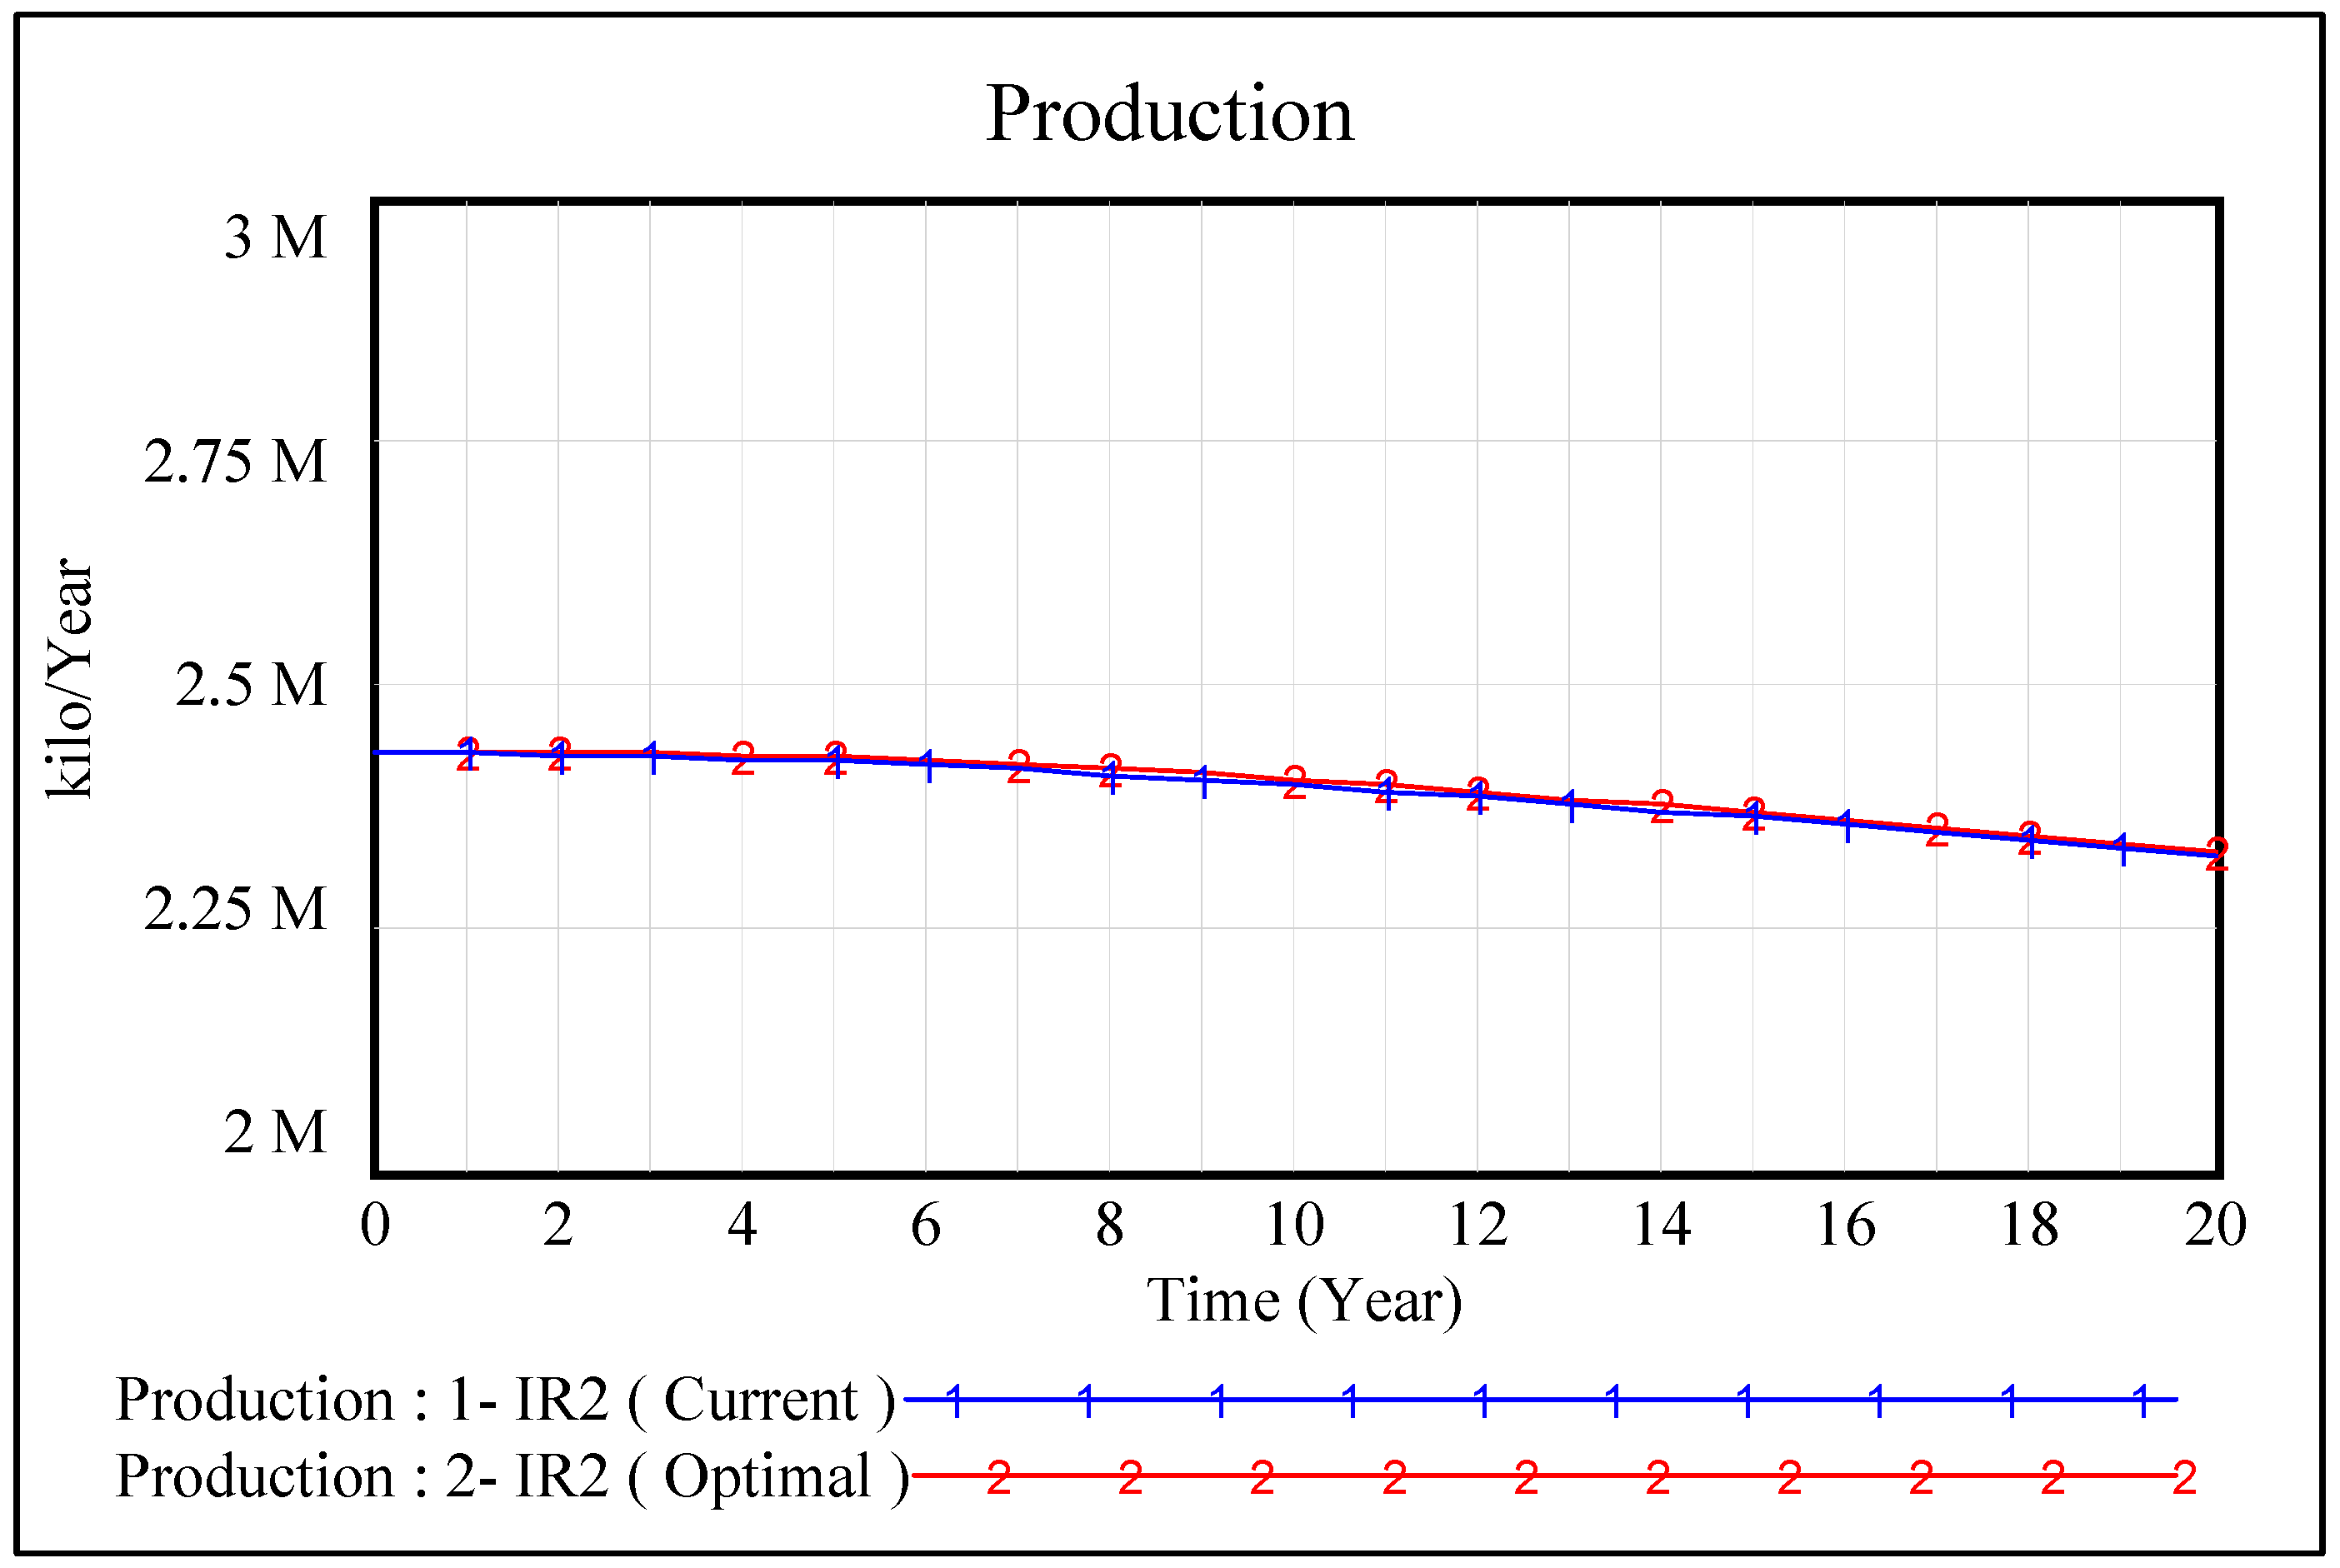
Figure 18 and Figure 19 depict the effect of the current and optimal amounts of voluntary omission 2 on the current variable of voluntary omission 2 and milk response variable, respectively.
Finally, if the optimal values of all mentioned variables are included in the simulated model, then the comparison of milk production in the current state and the optimal state will be as shown in Figure 20.
At present, the economic life of livestock at Fereidan Ahrar ranch is considered between 7 to 8 in procreation. In other words, the number of procreation is the only influencing factor in the voluntary omission from the dairy herd. It is necessary for the ranch to concentrate on the biological and incremental factors and to revise the policy of livestock omission in order to improve milk production in the future, and not to merely focus on the number of procreation Other factors such as the milk production rate, nutrition rate, and medical costs need to be considered together, so that the results obtained from different factors become the determinant of voluntary omission from the dairy herd.
5. Conclusions
This paper proposed a system dynamics approach to maximize milk production by identifying and analyzing the systemic behavior at the Fereidan Ahrar ranch. The approach takes into consideration the livestock population trends at an industrial ranch, along with the effects of the losses and diseases impacting them. The system was designed considering the population combination of livestock and the medical costs affecting it. In the causal diagram, different loops helped to better understand the systemic state of Fereidan Ahrar ranch. These loops were considered as the basis of designing a stock–flow diagram. The stock–flow diagram was analyzed through the design of experiment technique. The results obtained from this analysis showed five important variables affecting milk production with the goal of increasing it in a certain future. These variables include the production cycle rate, voluntary omission rate, changes rates of female calves per year that are entered into the life cycle of ranch, pregnant heifers that become as dairy herd after calving, and finally, the effect of medical costs was again specified through tests designed with the optimal amounts of these values. Different scenarios of milk production were determined based on the optimal amounts. It is suggested that future research consider variables such as cow comfort, nutrition quality, service period length, and technology for each group of livestock (calf, heifer, dairy herd) to maximize milk production.
Author Contributions
Conceptualization, N.S.-P., S.R.-A. and A.H.; Methodology, N.S.-P. and S.R.-A.; Investigation, N.S.-P. and S.R.-A.; Visualization, N.S.-P. and S.R.-A.; Writing—original draft, N.S.-P. and S.R.-A.; Writing—review and editing, N.S.-P., S.R.-A., A.H. and A.F.; Supervision, N.S.-P. and A.F. All authors have read and agreed to the published version of the manuscript.
Funding
This research received no external funding.
Institutional Review Board Statement
Not applicable.
Informed Consent Statement
Not applicable.
Conflicts of Interest
The authors declare no conflict of interest.
References
- Johnson, I.R.; France, J.; Cullen, B.R. A model of milk production in lactating dairy cows in relation to energy and nitrogen dynamics. J. Dairy Sci. 2016, 99, 1605–1618. [Google Scholar] [CrossRef] [PubMed] [Green Version]
- Tremblay, M.; Hess, J.P.; Christenson, B.M.; McIntyre, K.K.; Smink, B.; van der Kamp, A.J.; de Jong, L.G.; Döpfer, D. Customized recommendations for production management clusters of North American automatic milking systems. J. Dairy Sci. 2016, 99, 5671–5680. [Google Scholar] [CrossRef] [PubMed] [Green Version]
- Tilahun, M.; Zhao, L.; Guo, Z.; Shen, Y.; Ma, L.; Callaway, T.R.; Xu, J.; Bu, D. Amla (Phyllanthus emblica) fresh fruit as new feed source to enhance ruminal fermentation and milk production in lactating dairy cows. Anim. Feed. Sci. Technol. 2022, 283, 115160. [Google Scholar] [CrossRef]
- Baldini, C.; Gardoni, D.; Guarino, M. A critical review of the recent evolution of Life Cycle Assessment applied to milk production. J. Clean. Prod. 2017, 140, 421–435. [Google Scholar] [CrossRef]
- Kumar, M.; Choubey, V.K.; Deepak, A.; Gedam, V.V.; Raut, R.D. Life cycle assessment (LCA) of dairy processing industry: A case study of North India. J. Clean. Prod. 2021, 326, 129331. [Google Scholar] [CrossRef]
- Winans, K.S.; Macadam-Somer, I.; Kendall, A.; Geyer, R.; Marvinney, E. Life cycle assessment of California unsweetened almond milk. Int. J. Life Cycle Assess. 2020, 25, 577–587. [Google Scholar] [CrossRef] [Green Version]
- Fusi, F.; Angelucci, A.; Lorenzi, V.; Bolzoni, L.; Bertocchi, L. Assessing circumstances and causes of dairy cow death in Italian dairy farms through a veterinary practice survey (2013–2014). Prev. Vet. Med. 2017, 137, 105–108. [Google Scholar] [CrossRef] [PubMed]
- Hirano, T.; Nishimura, S.; Hara, H.; Sugimoto, Y.; Hanzawa, K. Mapping of calf death in Japanese black cattle. Anim. Biotechnol. 2017, 28, 242–247. [Google Scholar] [CrossRef]
- Hogeveen, H.; Huijps, K.; Lam, T.J.G.M. Economic aspects of mastitis: New developments. N. Z. Vet. J. 2011, 59, 16–23. [Google Scholar] [CrossRef]
- Mangla, S.K.; Kazancoglu, Y.; Ekinci, E.; Liu, M.; Özbiltekin, M.; Sezer, M.D. Using system dynamics to analyze the societal impacts of blockchain technology in milk supply chainsrefer. Transp. Res. Part E Logist. Transp. Rev. 2021, 149, 102289. [Google Scholar] [CrossRef]
- Deka, R.P.; Magnusson, U.; Grace, D.; Randolph, T.F.; Shome, R.; Lindahl, J.F. Estimates of the economic cost caused by five major reproductive problems in dairy animals in Assam and Bihar, India. Animals 2021, 11, 3116. [Google Scholar] [CrossRef] [PubMed]
- Tedeschi, L.O.; Nicholson, C.F.; Rich, E. Using System Dynamics modelling approach to develop management tools for animal production with emphasis on small ruminants. Small Rumin. Res. 2011, 98, 102–110. [Google Scholar] [CrossRef] [Green Version]
- Wang, L.; Setoguchi, A.; Oishi, K.; Sonoda, Y.; Kumagai, H.; Irbis, C.; Inamura, T.; Hirooka, H. Life cycle assessment of 36 dairy farms with by-product feeding in Southwestern China. Sci. Total Env. 2019, 696, 133985. [Google Scholar] [CrossRef]
- Babader, A.; Ren, J.; Jones, K.O.; Wang, J. A system dynamics approach for enhancing social behaviours regarding the reuse of packaging. Expert Syst. Appl. 2016, 46, 417–425. [Google Scholar] [CrossRef] [Green Version]
- Bochniarz, M.; Dzięgiel, B.; Nowaczek, A.; Wawron, W.; Dąbrowski, R.; Szczubiał, M.; Winiarczyk, S. Factors responsible for subclinical mastitis in cows caused by Staphylococcus chromogenes and its susceptibility to antibiotics based on bap, fnbA, eno, mecA, tetK, and ermA genes. J. Dairy Sci. 2016, 99, 9514–9520. [Google Scholar] [CrossRef] [Green Version]
- Salazar-Carranza, M.; Castillo-Badilla, G.; Murillo-Herrera, J.; Hueckmann-Voss, F.; Romero-Zúñiga, J.J. Effect of age at first calving on first lactation milk yield in Holstein cows from Costa Rican specialized dairy herds. Open J. Vet. Med. 2014, 4, 197–203. [Google Scholar] [CrossRef] [Green Version]
- Khanal, A.R.; Gillespie, J.; MacDonald, J. Adoption of technology, management practices, and production systems in US milk production. J. Dairy Sci. 2010, 93, 6012–6022. [Google Scholar] [CrossRef]
- Steeneveld, W.; Vernooij, J.C.M.; Hogeveen, H. Effect of sensor systems for cow management on milk production, somatic cell count, and reproduction. J. Dairy Sci. 2015, 98, 3896–3905. [Google Scholar] [CrossRef] [Green Version]
- Smith, A.C.; Coombs, C.O.; Bewley, J.M. Management practices adopted by top Kentucky milk-production herds. Prof. Anim. Sci. 2013, 29, 367–371. [Google Scholar] [CrossRef]
- Reyes, J.; Sanchez, J.; Stryhn, H.; Ortiz, T.; Olivera, M.; Keefe, G.P. Influence of milking method, disinfection and herd management practices on bulk tank milk somatic cell counts in tropical dairy herds in Colombia. Vet. J. 2017, 220, 34–39. [Google Scholar] [CrossRef]
- Bastan, M.; Khorshid-Doust, R.R.; Sisi, S.D.; Ahmadvand, A. Sustainable development of agriculture: A system dynamics model. Kybernetes 2018, 47, 142–162. [Google Scholar] [CrossRef]
- Langroodi, R.R.P.; Amiri, M. A system dynamics modeling approach for a multi-level, multi-product, multi-region supply chain under demand uncertainty. Expert Syst. Appl. 2016, 51, 231–244. [Google Scholar] [CrossRef]
- Nunes, S.A.; Ferreira, F.A.; Govindan, K.; Pereira, L.F. “Cities go smart!”: A system dynamics-based approach to smart city conceptualization. J. Clean. Prod. 2021, 313, 127683. [Google Scholar] [CrossRef]
- Jaipuria, S.; Mahapatra, S.S. A system dynamic approach to study the behaviour of serial supply chain under uncertain environment. Int. J. Serv. Oper. Manag. 2016, 24, 208–234. [Google Scholar] [CrossRef]
- Corral, E.; Moreno, R.G.; García, M.J.; Castejón, C. Nonlinear phenomena of contact in multibody systems dynamics: A review. Nonlinear Dyn. 2021, 104, 1269–1295. [Google Scholar] [CrossRef]
- Xiao, B.; Chankong, V. A system dynamics model for predicting supply and demand of medical education talents in China. Eurasia J. Math. Sci. Technol. Educ. 2017, 13, 5033–5047. [Google Scholar] [CrossRef]
- Schiuma, G.; Carlucci, D.; Sole, F. Applying a systems thinking framework to assess knowledge assets dynamics for business performance improvement. Expert Syst. Appl. 2012, 39, 8044–8050. [Google Scholar] [CrossRef]
- Abdi-Dehkordi, M.; Bozorg-Haddad, O.; Salavitabar, A.; Goharian, E. Developing a sustainability assessment framework for integrated management of water resources systems using distributed zoning and system dynamics approaches. Environ. Dev. Sustain. 2021, 23, 16246–16282. [Google Scholar] [CrossRef]
Figure 1.
Causal diagram of Fereidan Ahrar ranch.

Figure 2.
The ranch’s life loop.

Figure 3.
Control, protection, and development loop of the calf.

Figure 4.
Production loop.

Figure 5.
Stock–flow diagram of the Fereidan Ahrar ranch.

Figure 6.
Pareto chart for the identification of important variables in production.

Figure 7.
Normal diagram to identify the important variables in production.

Figure 8.
Interaction diagram of the effect of every identified important variable and their effect on the production.
Figure 8.
Interaction diagram of the effect of every identified important variable and their effect on the production.

Figure 9.
Diagram of the optimal values to maximize production.

Figure 10.
Comparison of the effect of the current and optimal rate of the production cycle on the current variable of the production cycle.
Figure 10.
Comparison of the effect of the current and optimal rate of the production cycle on the current variable of the production cycle.

Figure 11.
Comparison of the effect of the current and optimal rate of the production cycle on the milk production.
Figure 11.
Comparison of the effect of the current and optimal rate of the production cycle on the milk production.

Figure 12.
Comparison of the effect of the current and optimal input rate 1 on the input current variable 1.
Figure 12.
Comparison of the effect of the current and optimal input rate 1 on the input current variable 1.

Figure 13.
Comparison of the effect of the current and optimal input rate 1 on milk production.

Figure 14.
The comparison diagram of the effect of the current and optimal input rate 2 on the input current variable 2.
Figure 14.
The comparison diagram of the effect of the current and optimal input rate 2 on the input current variable 2.

Figure 15.
The comparison diagram of the effect of the current and optimal input rate 2 on milk production.
Figure 15.
The comparison diagram of the effect of the current and optimal input rate 2 on milk production.

Figure 16.
Comparison of the effect of the current and optimal amount of the obligatory omission rate 3 on the current variable of obligatory omission 3.
Figure 16.
Comparison of the effect of the current and optimal amount of the obligatory omission rate 3 on the current variable of obligatory omission 3.

Figure 17.
Comparison of the effect of the current and optimal amount of the obligatory omission rate 3 on milk production.
Figure 17.
Comparison of the effect of the current and optimal amount of the obligatory omission rate 3 on milk production.

Figure 18.
Comparison of the effect of the current and optimal amounts of the voluntary omission rate 2 on the current variable of voluntary omission 2.
Figure 18.
Comparison of the effect of the current and optimal amounts of the voluntary omission rate 2 on the current variable of voluntary omission 2.

Figure 19.
Comparison of the effect of the current and optimal amounts of the voluntary omission rate 2 on milk production.
Figure 19.
Comparison of the effect of the current and optimal amounts of the voluntary omission rate 2 on milk production.

Figure 20.
The comparison of the effect of the optimal amounts on milk production.


Table 1.
Variables of the stock–flow diagram of the Fereidan Ahrar ranch.
| Name of Variable | Description |
|---|---|
| BR: Birth Rate | Rate of birth changes in year (1/year) |
| B: Birth | Male and female calf birth (number/year) |
| OO 1, 2, 3: Obligatory Omission 1, 2, 3 | Obligatory omission of ranch due to disease and losses in every livestock class (calf, heifer, dairy herd) (number/year) |
| OOR1,2,3: Obligatory Omission Rate 1, 2, 3 | Change rates in omission beyond the control of the ranch from each livestock class (calf, heifer, dairy herd) due to disease and losses per year (1/year) |
| MC 1, 2, 3: Medical Cost 1, 2, 3 | The overall average of medical costs compared to the total remaining population from each livestock class at the end of a year (calf, heifer, dairy herd) (rial/year) |
| MCE 1,2,3: Medical Cost Effect 1, 2, 3 | Difference of annual cost for each livestock to the total number of remaining livestock at the end of the year divided by the difference of the number of obligatory omission in the first year to the number of obligatory omissions in the last year of calculation period (rial/number) |
| VO 1: Voluntary Omission 1 | Sale of male calves that are removed from the production cycle (number/year) |
| VOR 1: Voluntary Omission Rate 1 | Rate of sale changes of male calves per year that are removed from the milk production cycle (1/year) |
| C: Calf | Number of male and female calves (number) |
| I 1: Input 1 | Female calves that are entered into the ranch’s life cycle (number/year) |
| IR 1: Input Rate 1 | Change rates of female calves per year that are entered into the life cycle of ranch (1/year) |
| H: Heifer | Number of pregnant and non-pregnant heifers (number) |
| I 2: Input 2 | Change rates in pregnant heifers in a year that become part of the dairy herd after calving (number/year) |
| IR 2: Input Rate 2 | Pregnant heifers that become part of the dairy herd after calving (1/year) |
| DH: Dairy Herd | Number of pregnant, non-pregnant, and pregnant dry cows (number) |
| PC: Production Cycle | Number of dairy cows that are in the milk production cycle (number/year) |
| PCR: Production Cycle Rate | Percentage of dairy herd that indicates the number of dairy cows entered into the production cycle (1/year) |
| VO 2: Voluntary Omission 2 | Controlled omission from dairy herd after seventh or eighth calving (number/year) |
| VOR 2: Voluntary Omission Rate 2 | Controlled omission rate from dairy herd in year after the seventh to eighth calving (1/year) |
| PA: Production Amount | Milk production rate from cows entered into the production cycle (kilo/number) |
| P: Production | Total rate of milk production from cows entered into the production cycle per year (kilo/year) |
| M: Milk | Total rate of milk production (kilo) |
| S: Sale | Sale rate from total produced milk (kilo/year) |
| SR: Sale Rate | Sale percentage of sold milk (1/year) |
| IU: Internal Use | Milk consumption rate for calves at born the ranch (kilo/year) |
| IUA: Internal Use Amount | Milk consumption rate for each calf born per year (kilo/number) |
Table 2.
High and low levels of auxiliary variables.
| Variable Name | Low Level | High Level |
|---|---|---|
| BR: Birth Rate | 0.014 | 0.016 |
| OOR 1: Obligatory Omission Rate 1 | −0.005 | −0.0044 |
| MC 1: Medical Cost 1 | 860,000 | 900,000 |
| MCE 1: Medical Cost Effect 1 | 418,000 | 420,000 |
| VOR 1: Voluntary Omission Rate 1 | 0.012 | 0.014 |
| IR 1: Input Rate 1 | 0.026 | 0.03 |
| OOR 2: Obligatory Omission Rate 2 | −0.029 | −0.0278 |
| MC 2: Medical Cost 2 | 609,000 | 631,000 |
| MCE 2: Medical Cost Effect 2 | 1,031,000 | 1,049,000 |
| IR 2: Input Rate 2 | 0.078 | 0.08 |
| OOR 3: Obligatory Omission Rate 3 | 0.0016 | 0.0017 |
| MC 3: Medical Cost 3 | 1,368,000 | 1,392,000 |
| MCE 3: Medical Cost Effect 3 | 365,000 | 377,000 |
| VOR 2: Voluntary Omission Rate 2 | 0.049 | 0.051 |
| PCR: Production Cycle Rate | 0.72 | 0.76 |
| PA: Production Amount | 12,240 | 12,250 |
| SR: Sale Rate | 0.97 | 0.98 |
| IUA: Internal Use Amount | 55,700 | 55,712 |
Disclaimer/Publisher’s Note: The statements, opinions and data contained in all publications are solely those of the individual author(s) and contributor(s) and not of MDPI and/or the editor(s). MDPI and/or the editor(s) disclaim responsibility for any injury to people or property resulting from any ideas, methods, instructions or products referred to in the content. |
© 2023 by the authors. Licensee MDPI, Basel, Switzerland. This article is an open access article distributed under the terms and conditions of the Creative Commons Attribution (CC BY) license (https://creativecommons.org/licenses/by/4.0/).
Share and Cite
MDPI and ACS Style
Shahsavari-Pour, N.; Rahimi-Ashjerdi, S.; Heydari, A.; Fekih, A. A System Dynamics Approach to Optimize Milk Production in an Industrial Ranch. Appl. Sci. 2023, 13, 1662. https://0-doi-org.brum.beds.ac.uk/10.3390/app13031662
AMA Style
Shahsavari-Pour N, Rahimi-Ashjerdi S, Heydari A, Fekih A. A System Dynamics Approach to Optimize Milk Production in an Industrial Ranch. Applied Sciences. 2023; 13(3):1662. https://0-doi-org.brum.beds.ac.uk/10.3390/app13031662
Chicago/Turabian StyleShahsavari-Pour, Nasser, Sajad Rahimi-Ashjerdi, Azim Heydari, and Afef Fekih. 2023. "A System Dynamics Approach to Optimize Milk Production in an Industrial Ranch" Applied Sciences 13, no. 3: 1662. https://0-doi-org.brum.beds.ac.uk/10.3390/app13031662
Note that from the first issue of 2016, this journal uses article numbers instead of page numbers. See further details here.