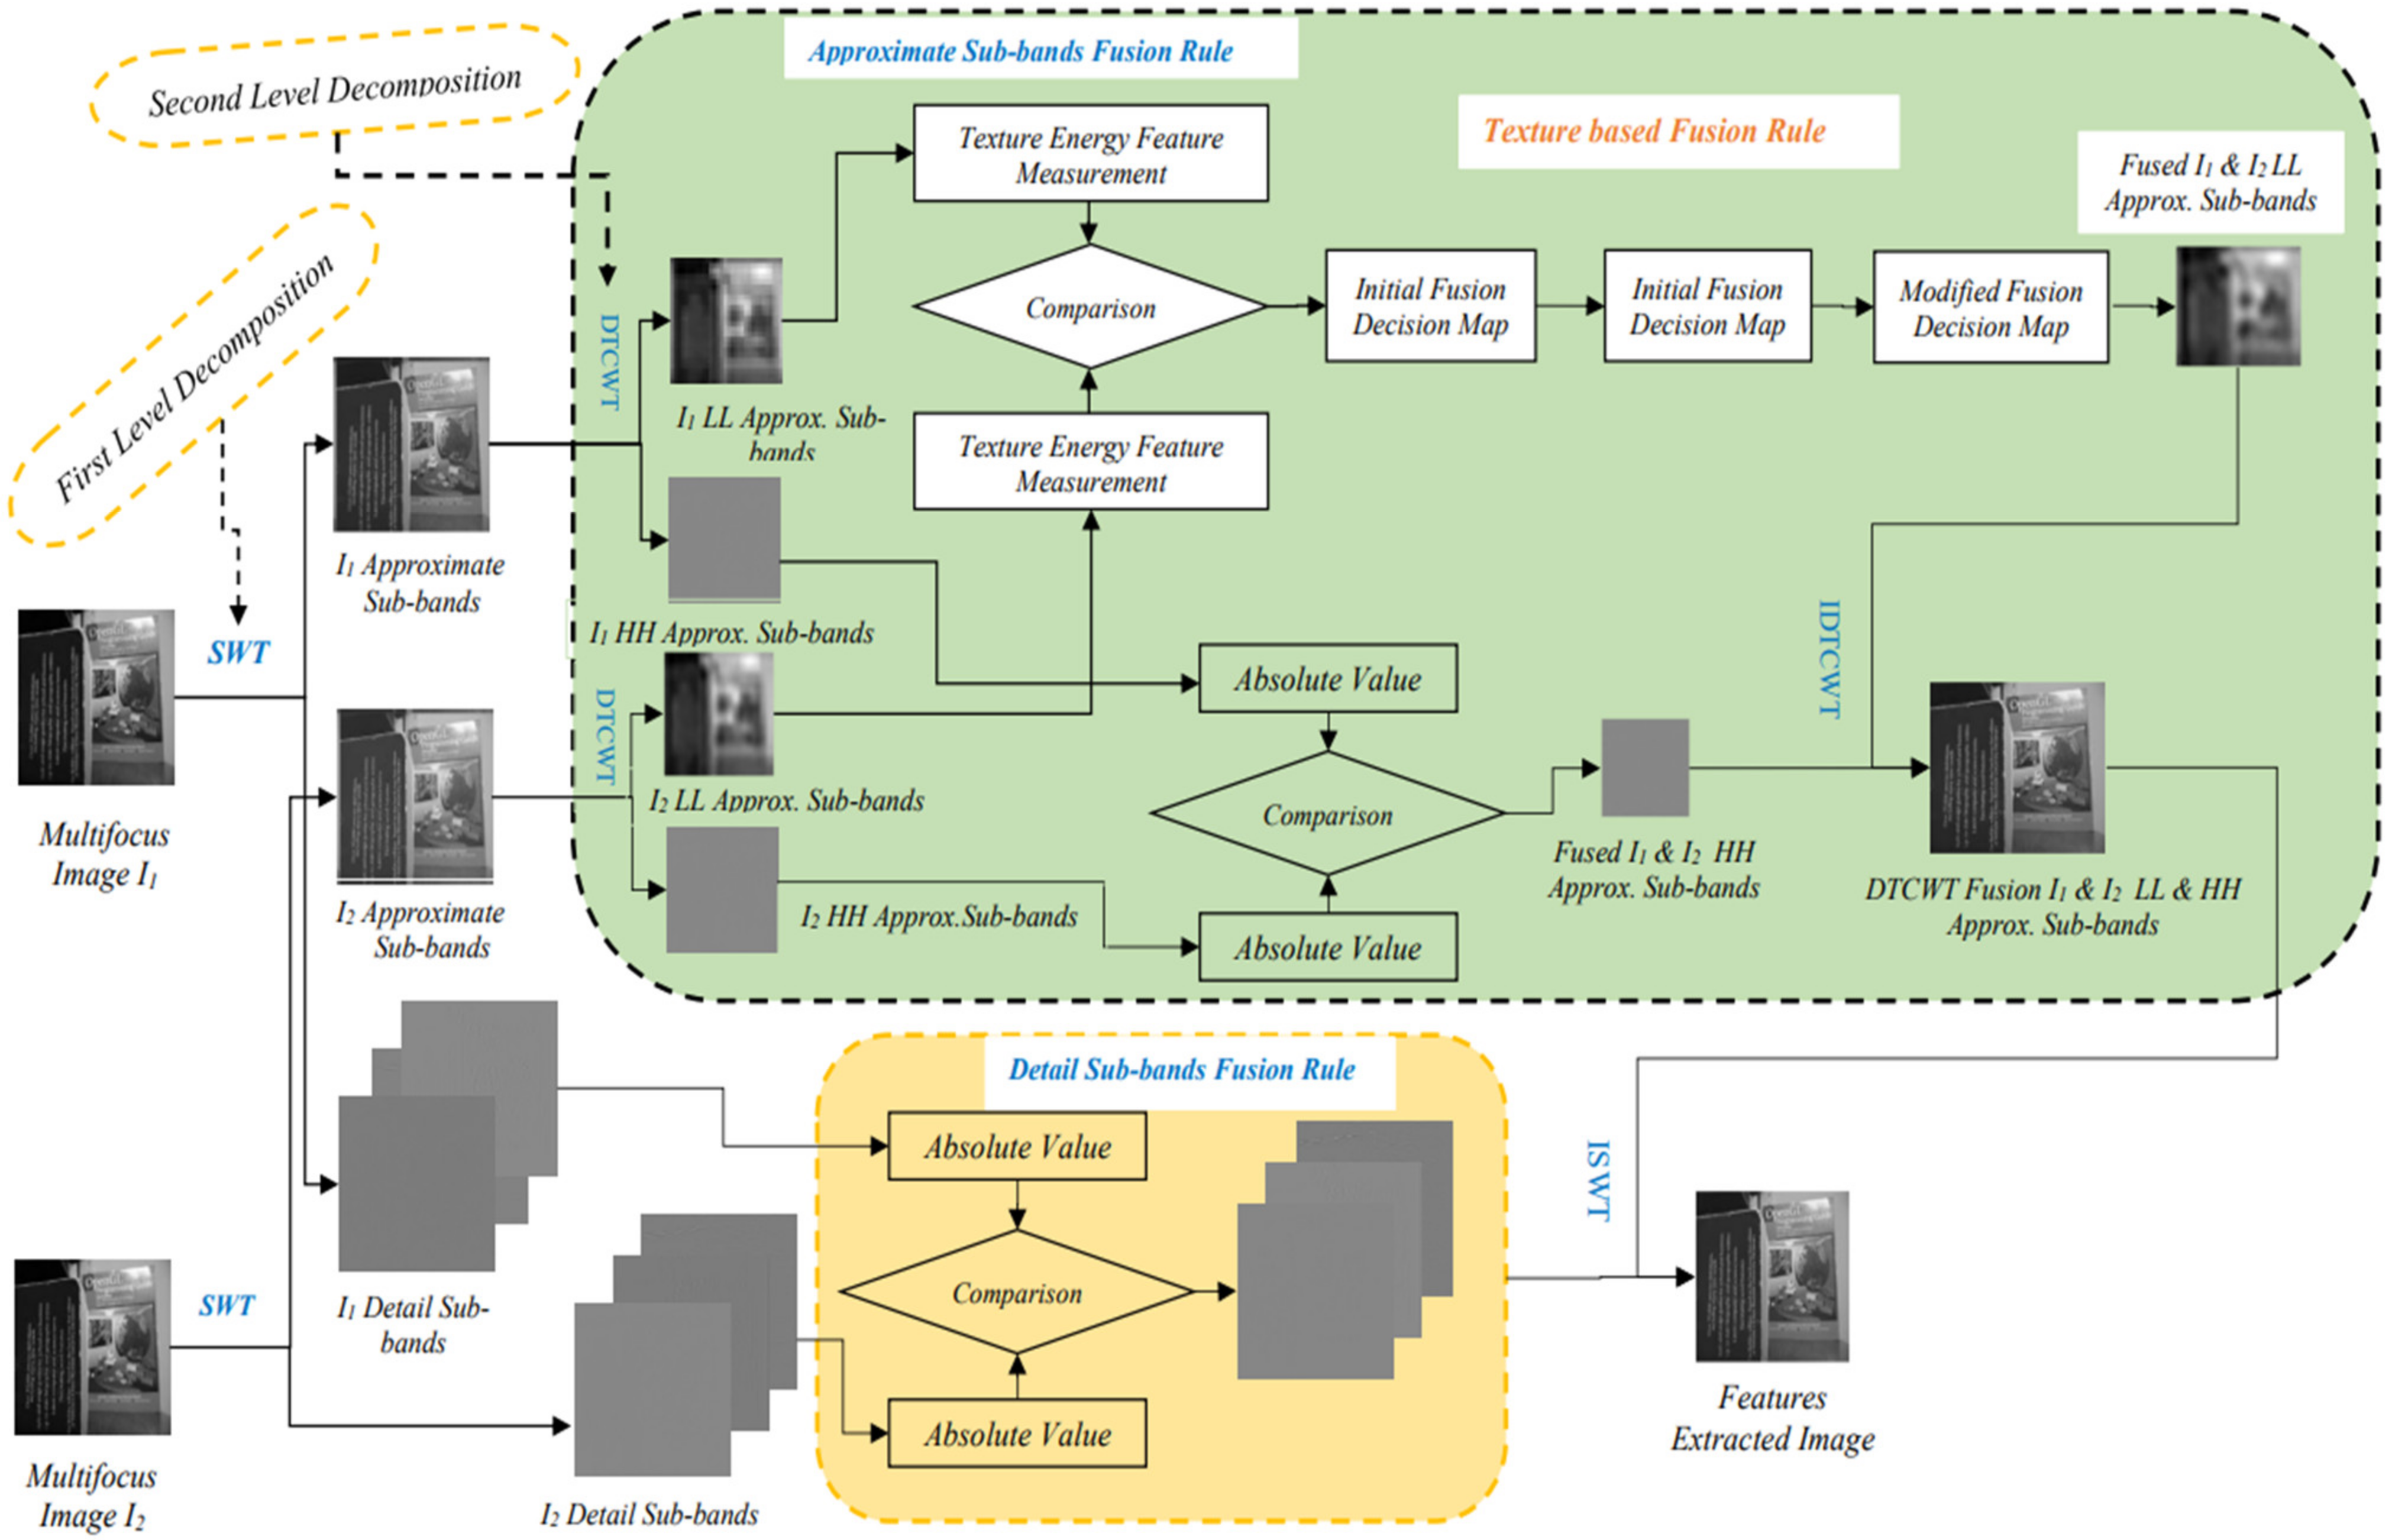
Figure 1.
Hypothesized SWT and D-TCWT with TEM-based image fusion.
Figure 1.
Hypothesized SWT and D-TCWT with TEM-based image fusion.
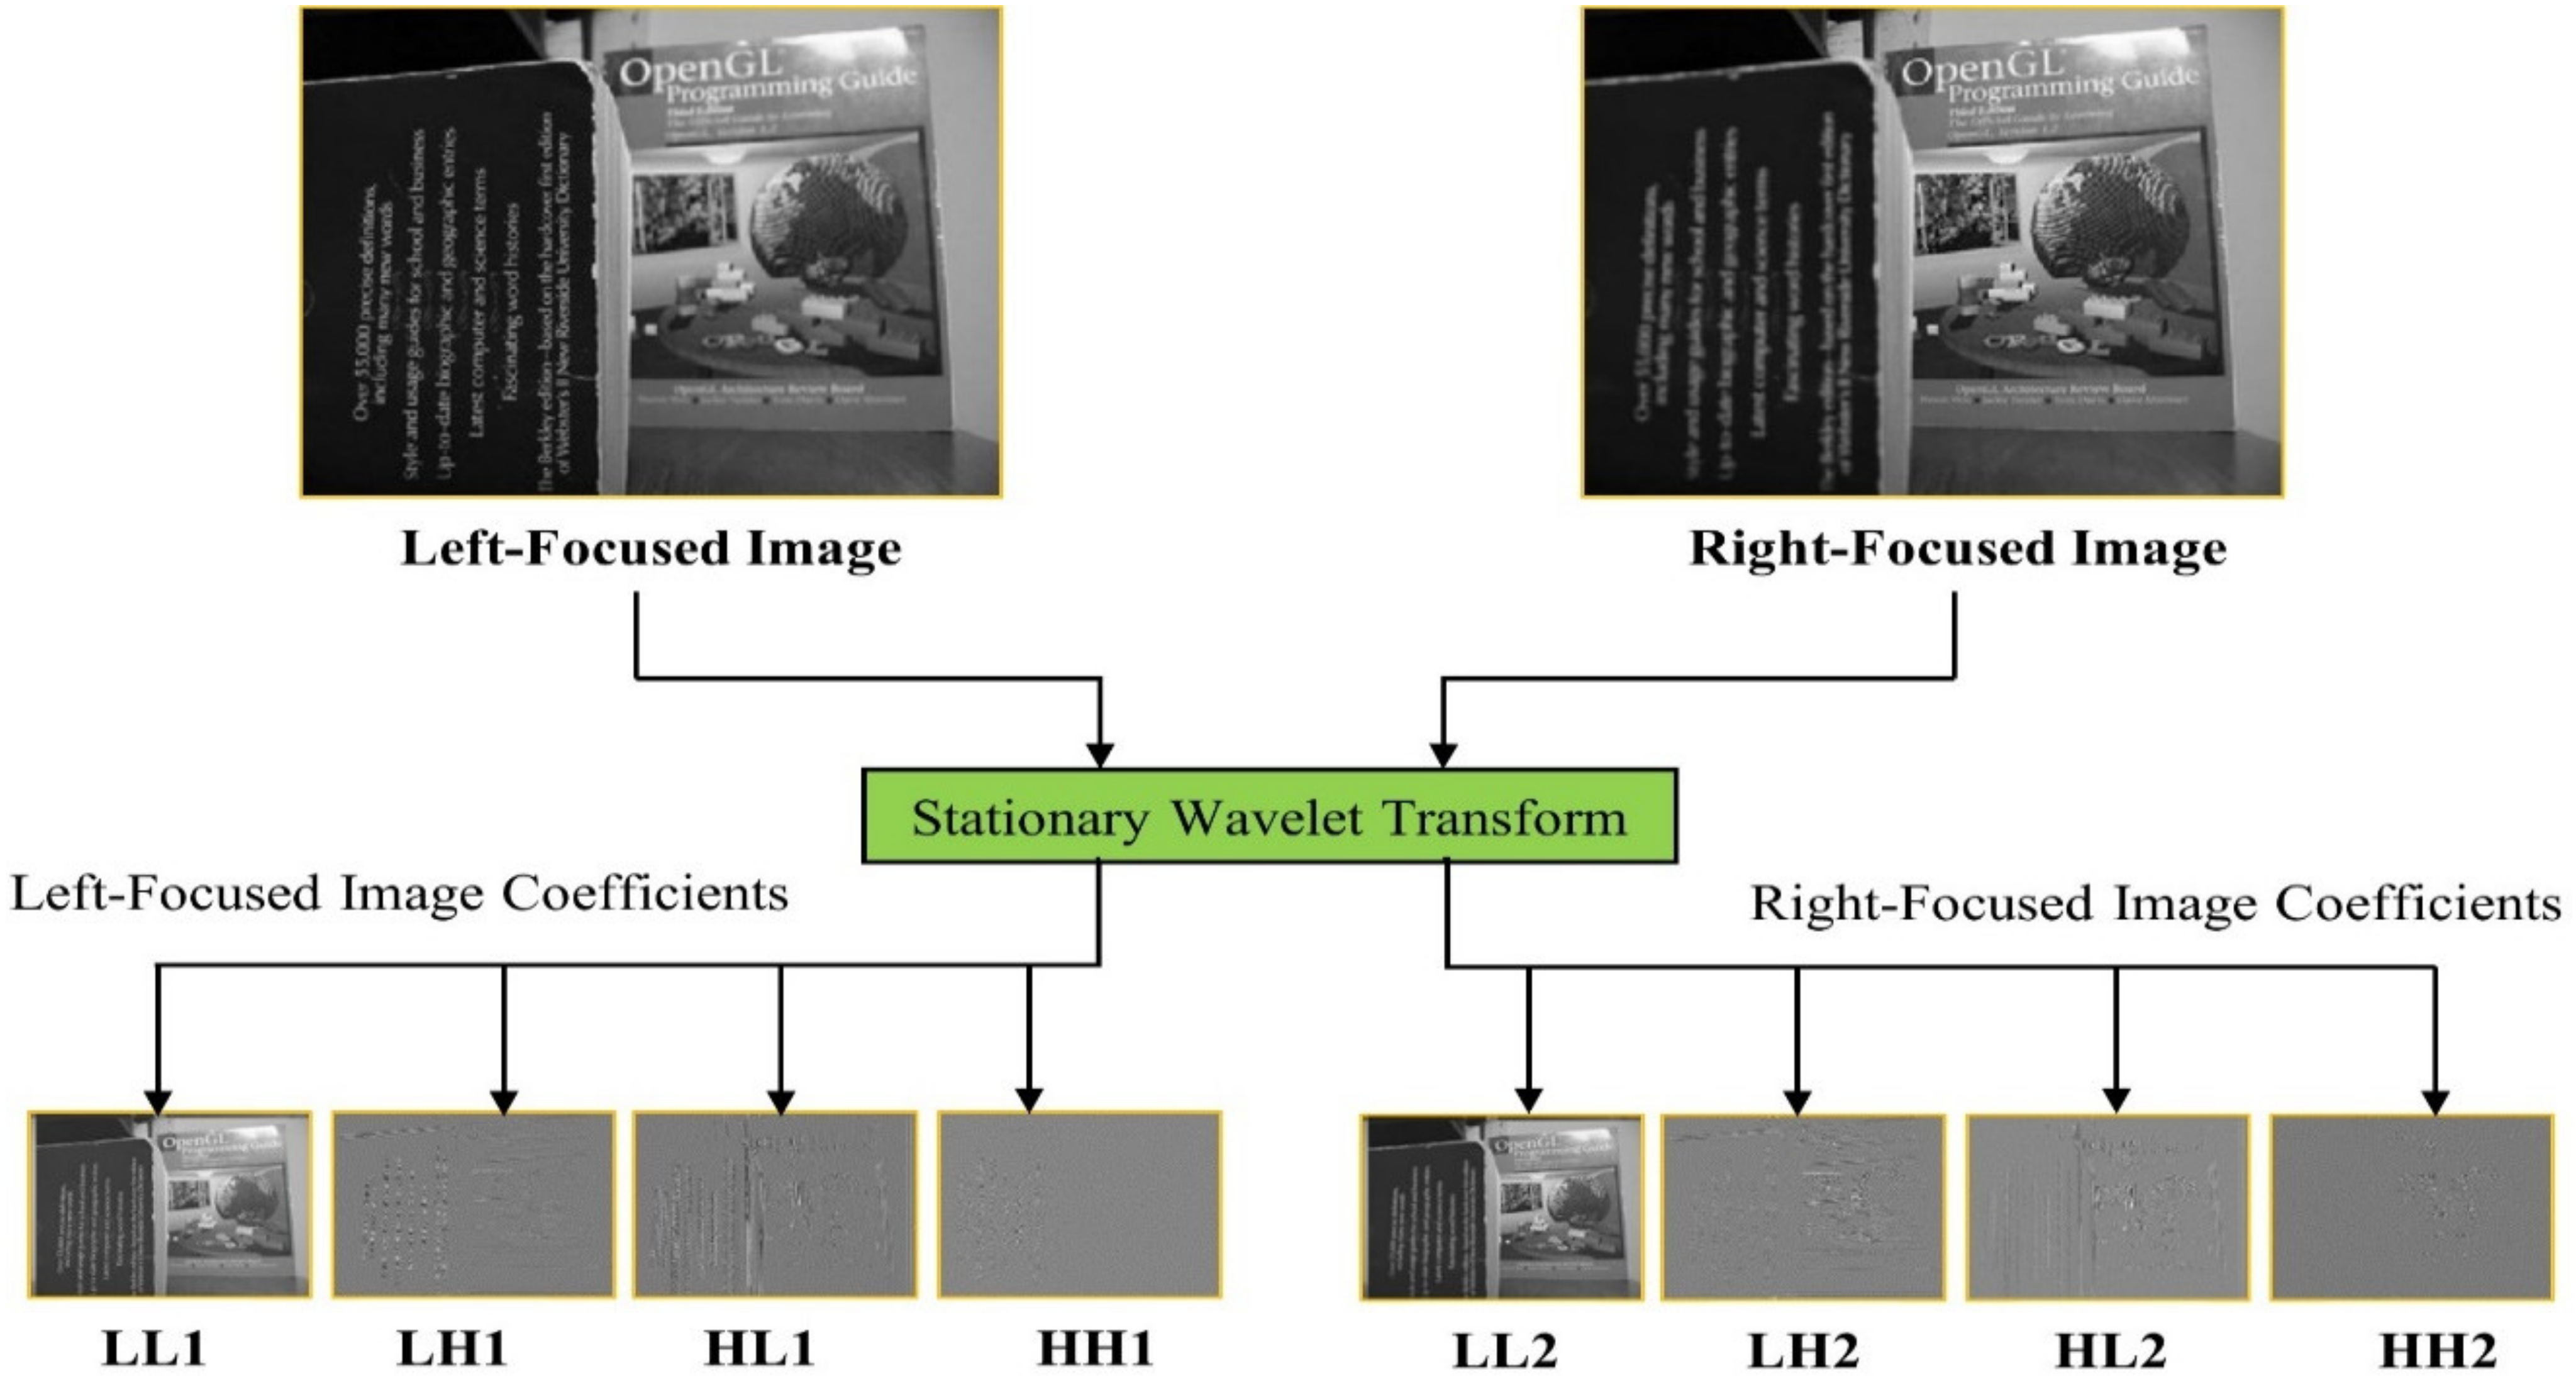
Figure 2.
SWT decomposition structure.
Figure 2.
SWT decomposition structure.
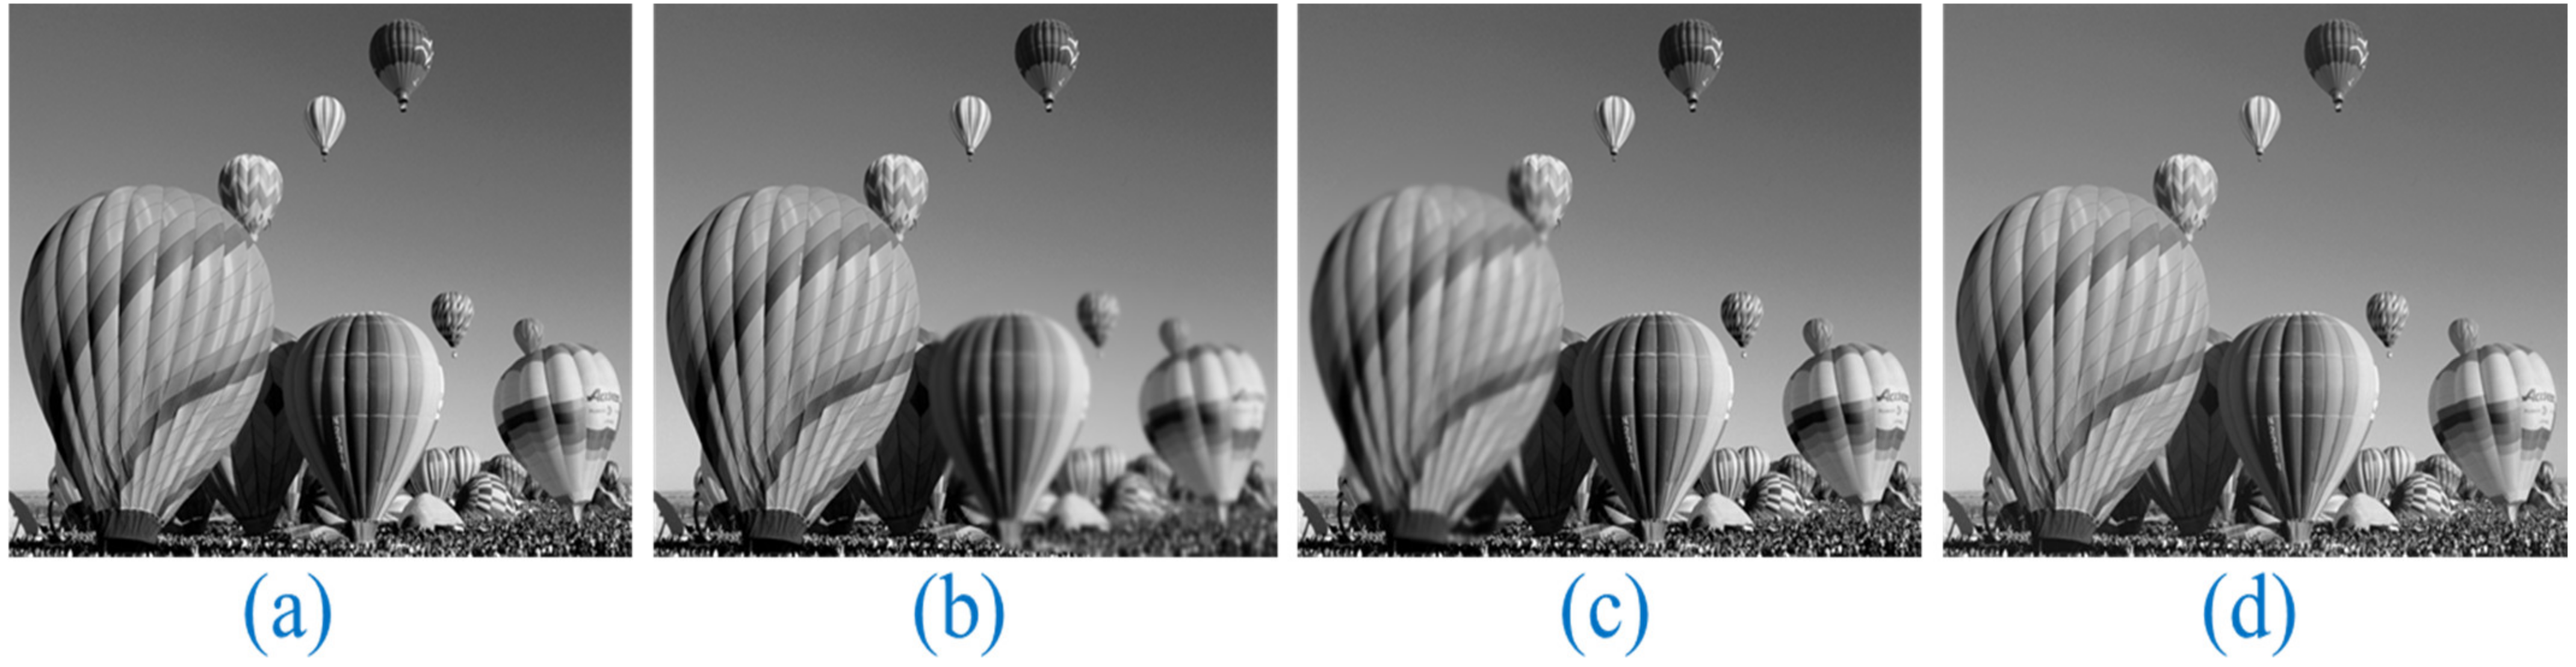
Figure 3.
Multi-focus image of a balloon from various perspectives. Original Image: (a), Multi-focus Input Images: (b,c), and Proposed Fusion: (d).
Figure 3.
Multi-focus image of a balloon from various perspectives. Original Image: (a), Multi-focus Input Images: (b,c), and Proposed Fusion: (d).
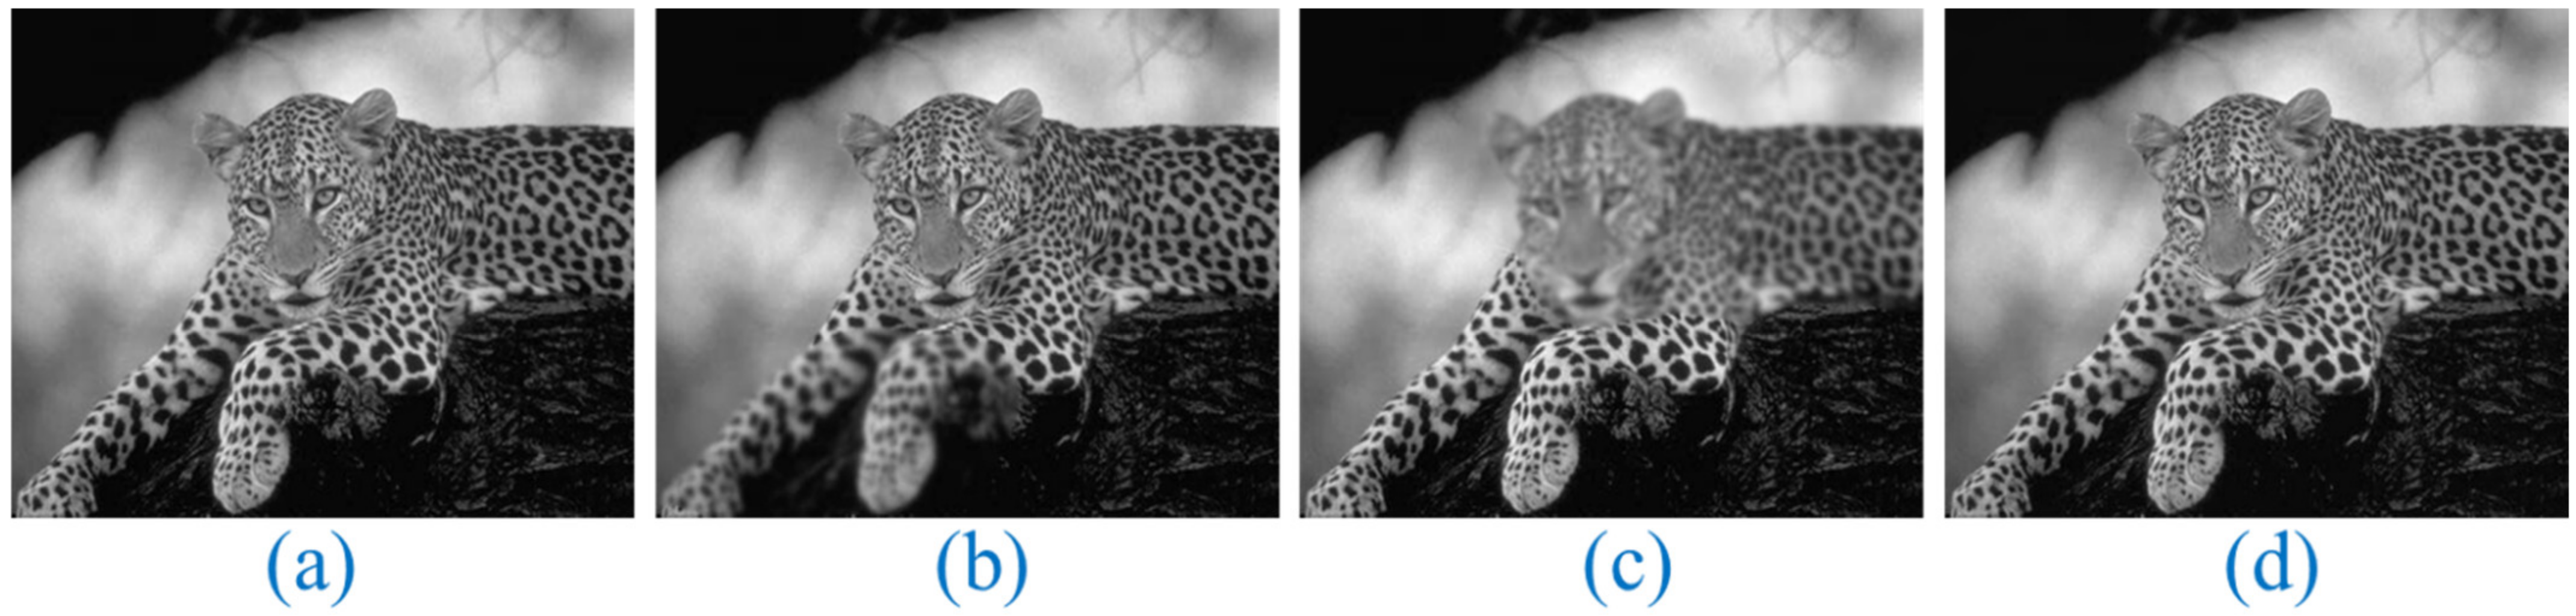
Figure 4.
Multi-focus image of a leopard from various perspectives. Original Image: (a), Multi-focus Input Images: (b,c), and Proposed Fusion: (d).
Figure 4.
Multi-focus image of a leopard from various perspectives. Original Image: (a), Multi-focus Input Images: (b,c), and Proposed Fusion: (d).
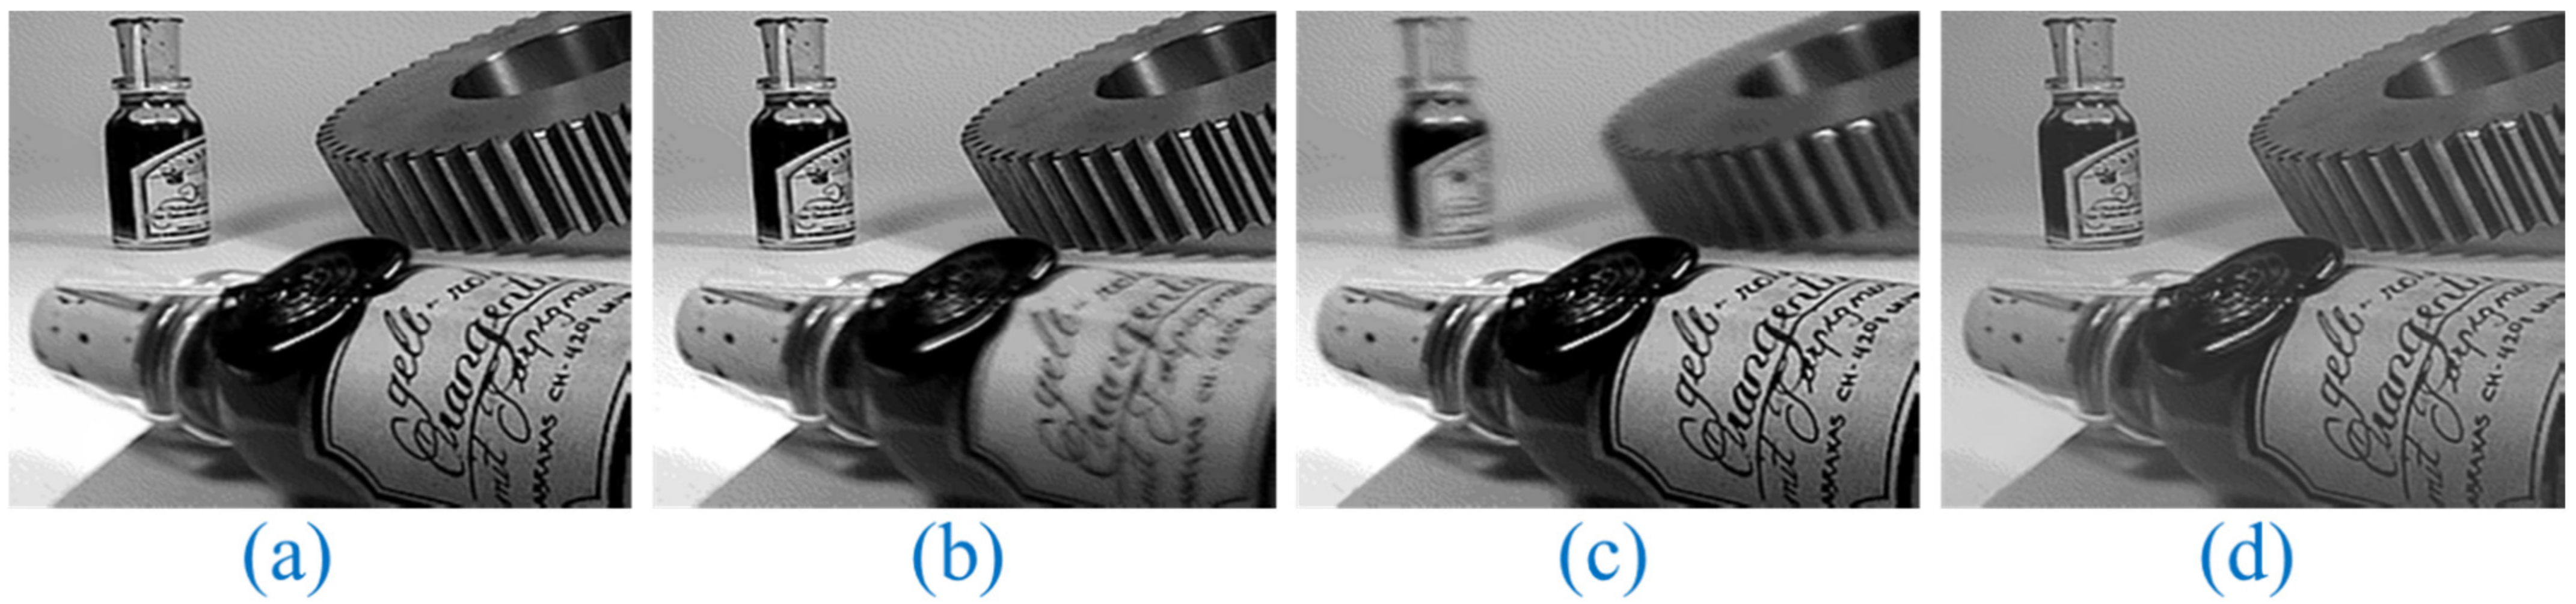
Figure 5.
Multi-focus image of a wine bottle from various perspectives. Original Image: (a), Multi-focus Input Images: (b,c), and Proposed Fusion: (d).
Figure 5.
Multi-focus image of a wine bottle from various perspectives. Original Image: (a), Multi-focus Input Images: (b,c), and Proposed Fusion: (d).
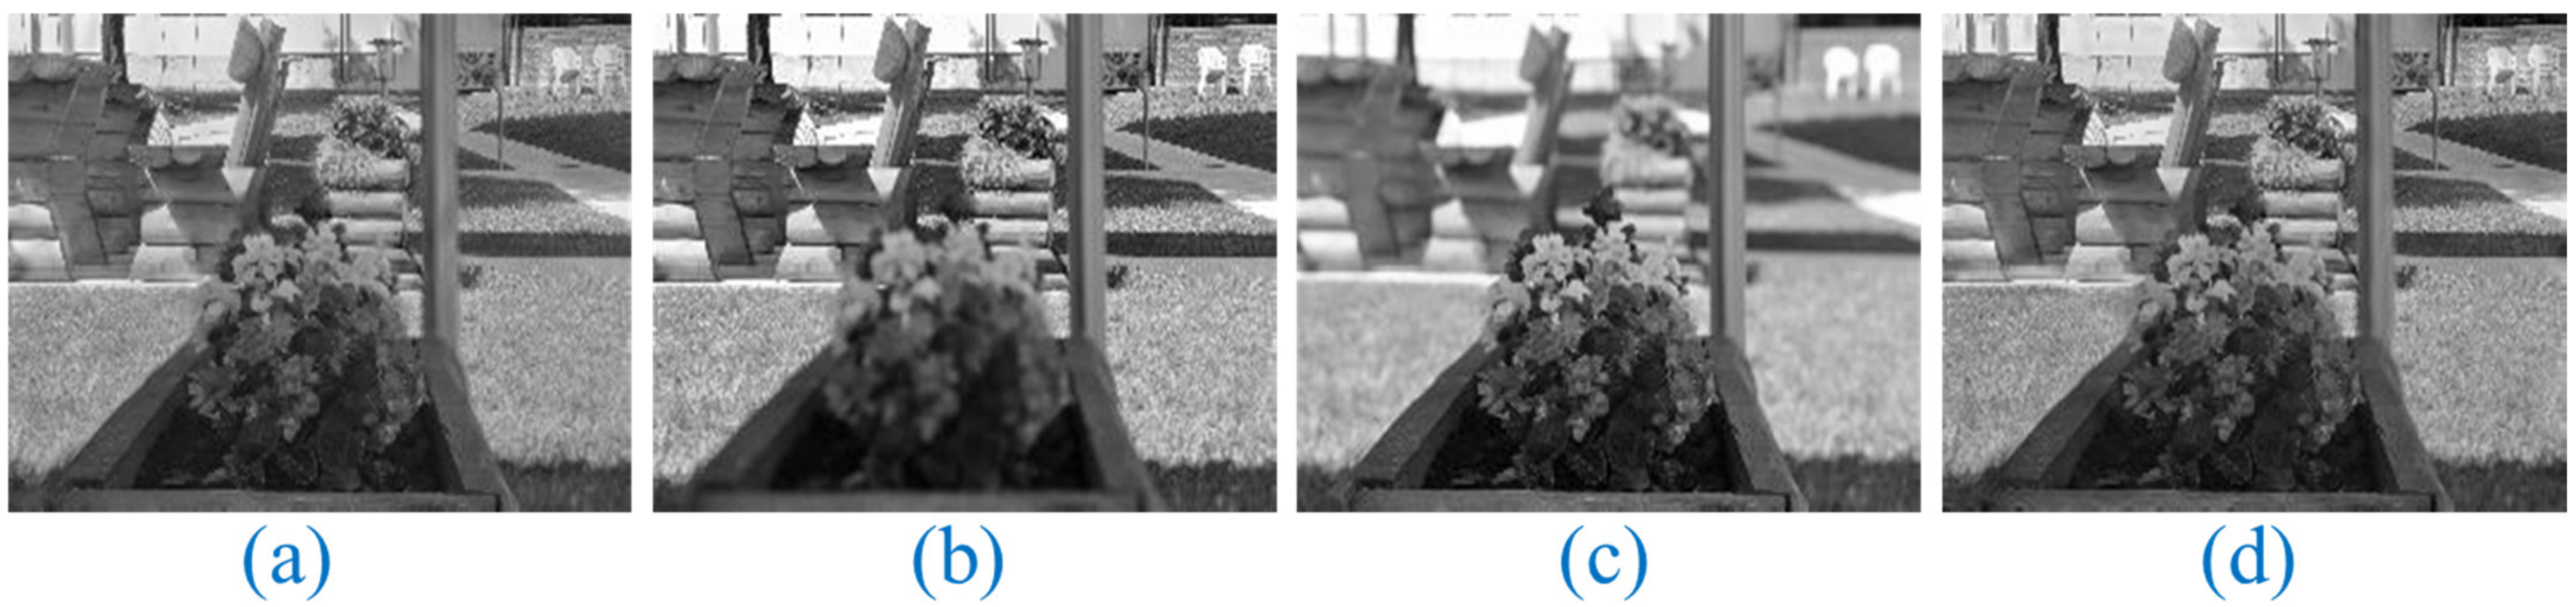
Figure 6.
Multi-focus image of a grass from various perspectives. Original Image: (a), Multi-focus Input Images: (b,c), and Proposed Fusion: (d).
Figure 6.
Multi-focus image of a grass from various perspectives. Original Image: (a), Multi-focus Input Images: (b,c), and Proposed Fusion: (d).
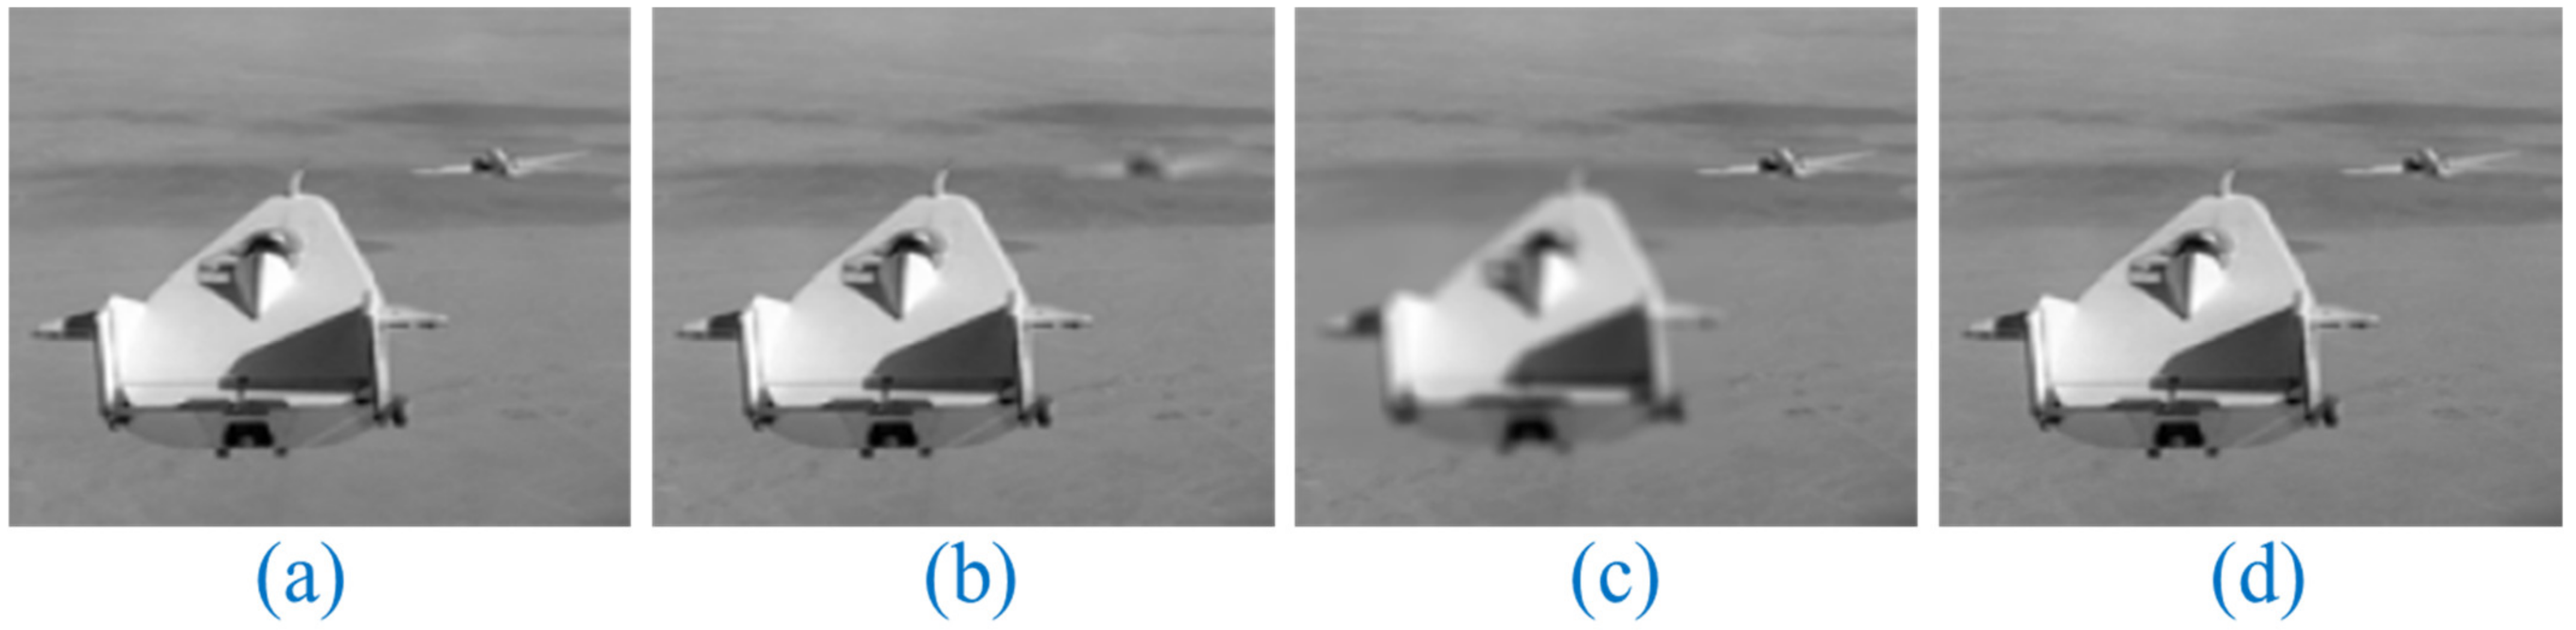
Figure 7.
Multi-focus image of a craft from various perspectives. Original Image: (a), Multi-focus Input Images: (b,c), and Proposed Fusion: (d).
Figure 7.
Multi-focus image of a craft from various perspectives. Original Image: (a), Multi-focus Input Images: (b,c), and Proposed Fusion: (d).
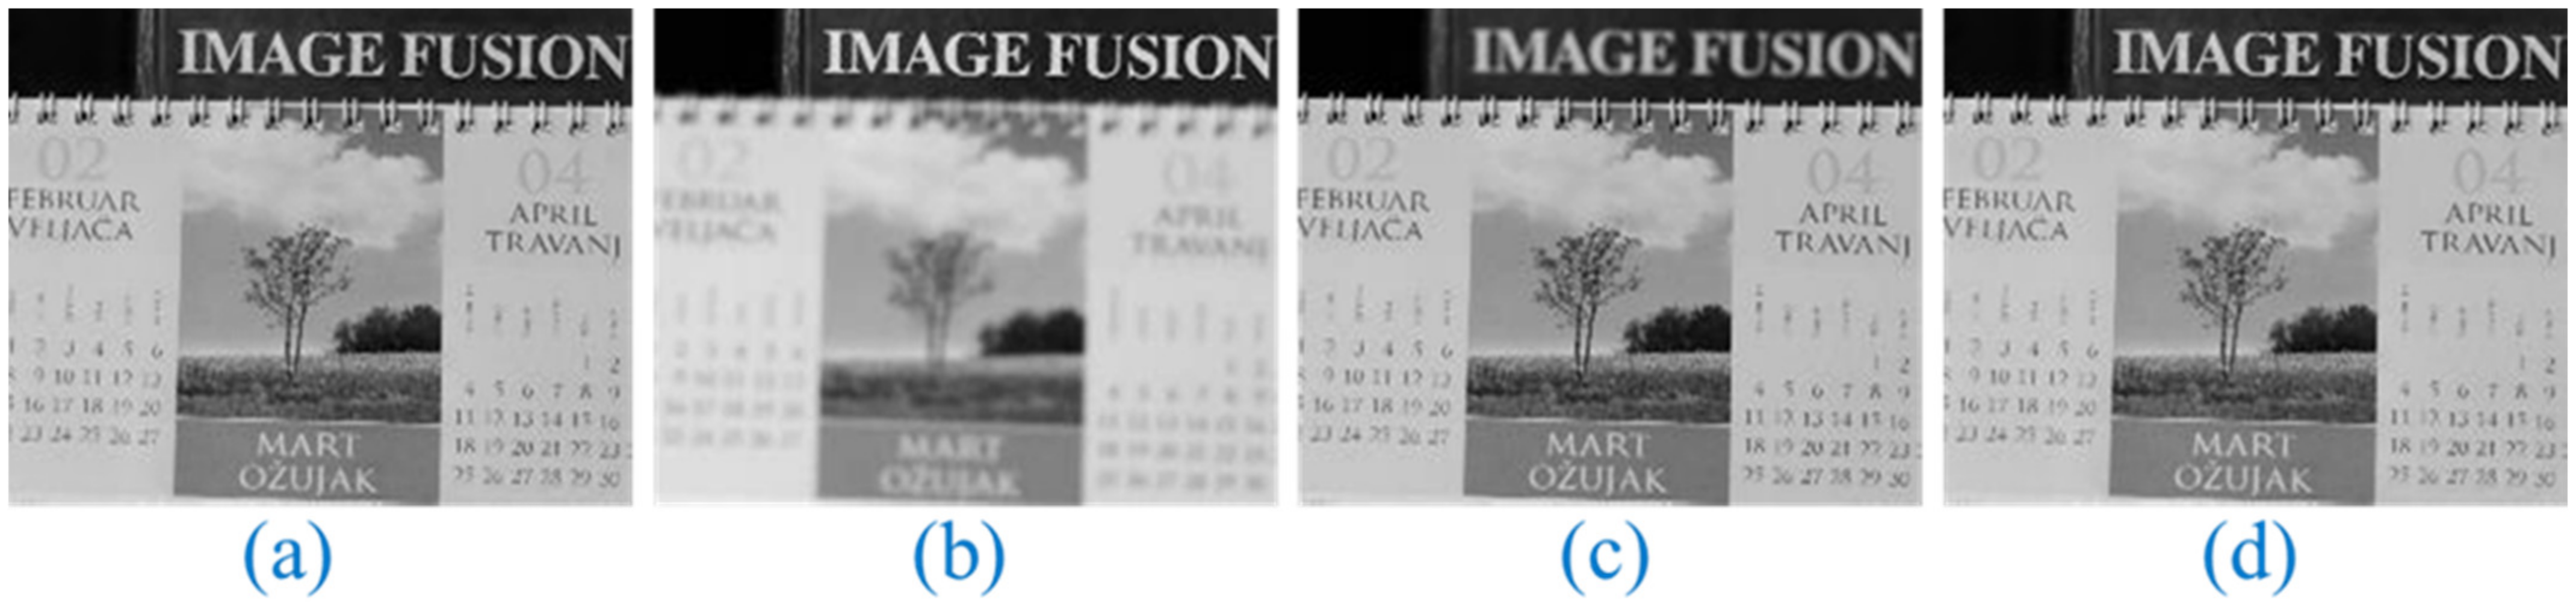
Figure 8.
Multi-focus image of a calendar from various perspectives. Original Image: (a), Multi-focus Input Images: (b,c), and Proposed Fusion: (d).
Figure 8.
Multi-focus image of a calendar from various perspectives. Original Image: (a), Multi-focus Input Images: (b,c), and Proposed Fusion: (d).
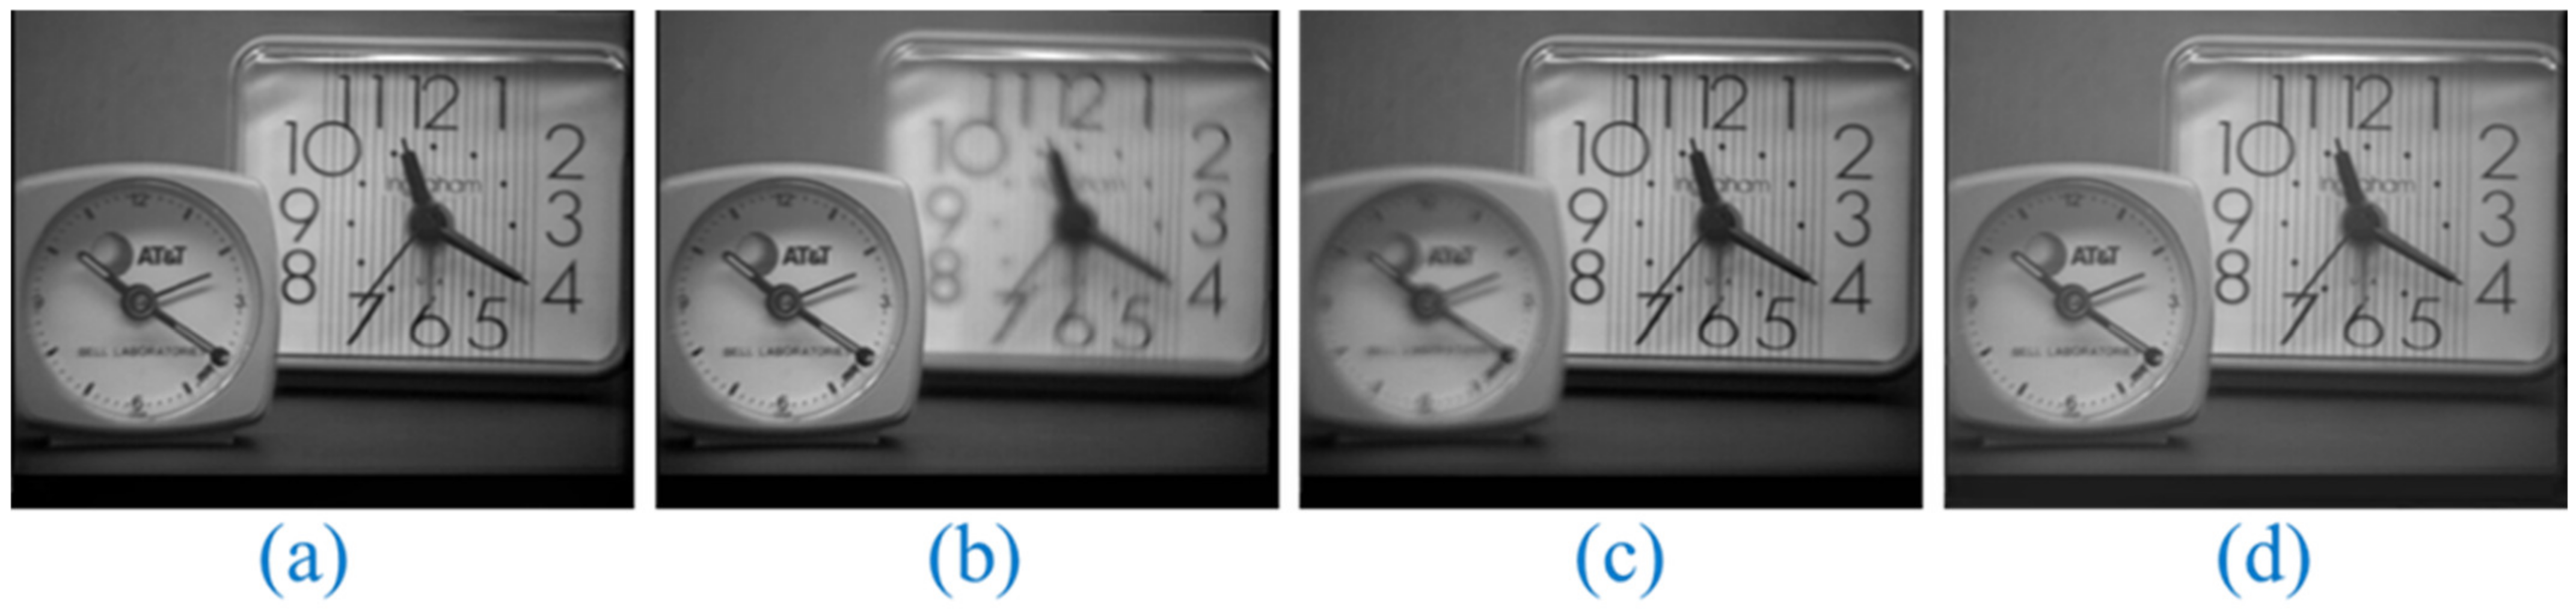
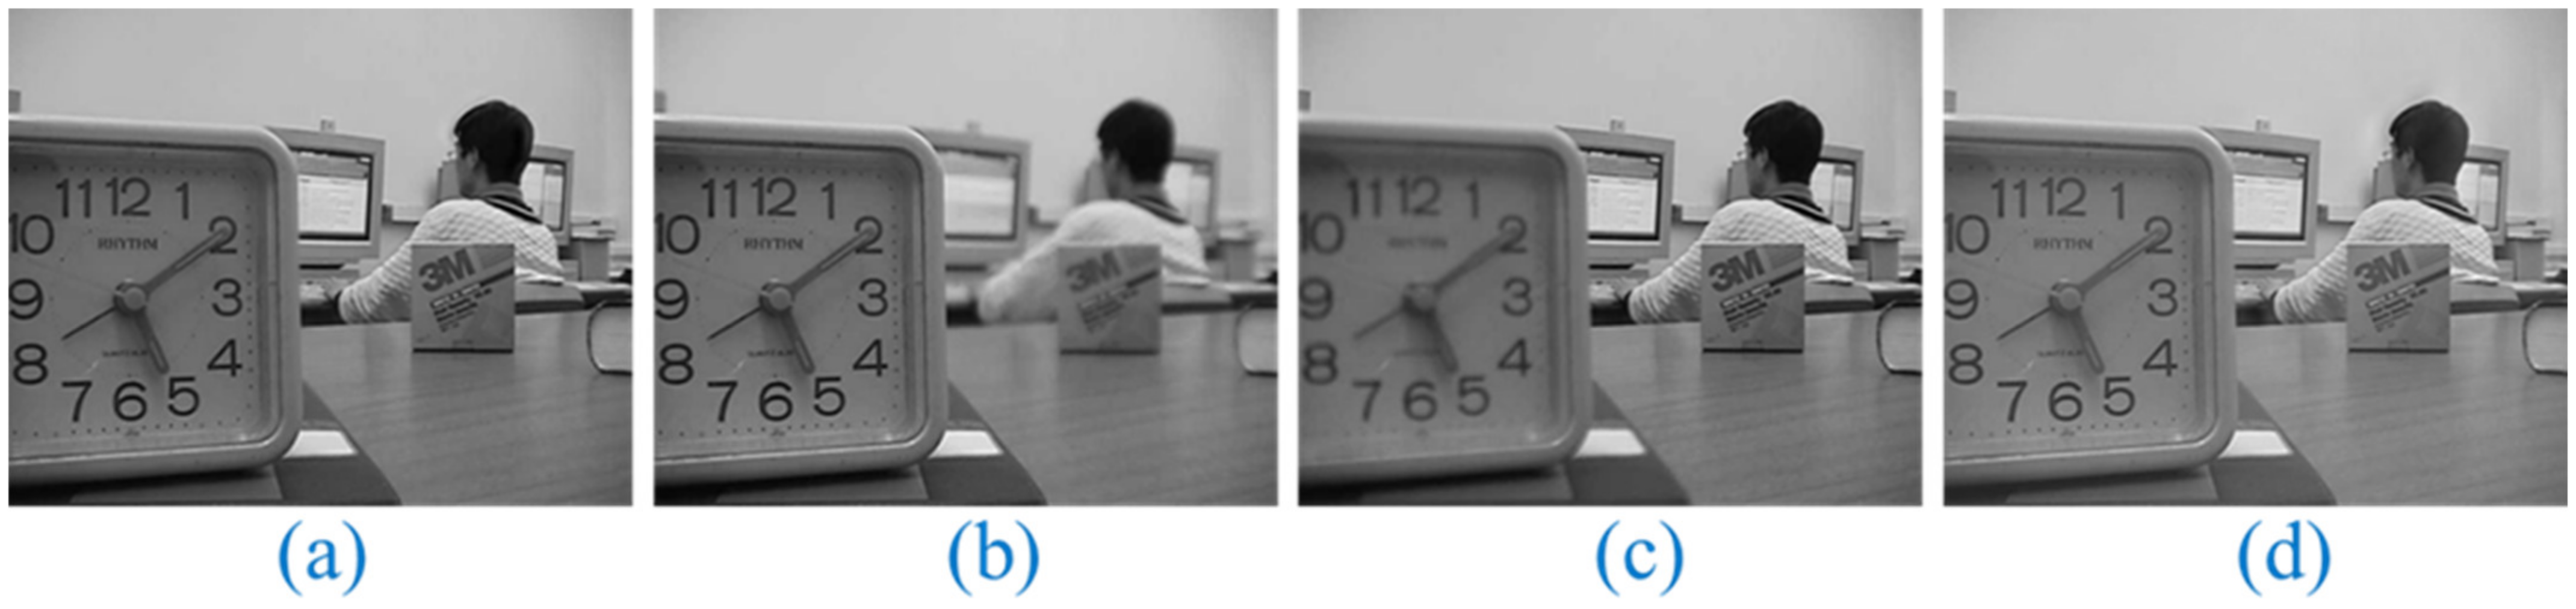
Figure 9.
Multi-focus image of a clock from various perspectives. Original Image: (a), Multi-focus Input Images: (b,c), and Proposed Fusion: (d).
Figure 9.
Multi-focus image of a clock from various perspectives. Original Image: (a), Multi-focus Input Images: (b,c), and Proposed Fusion: (d).
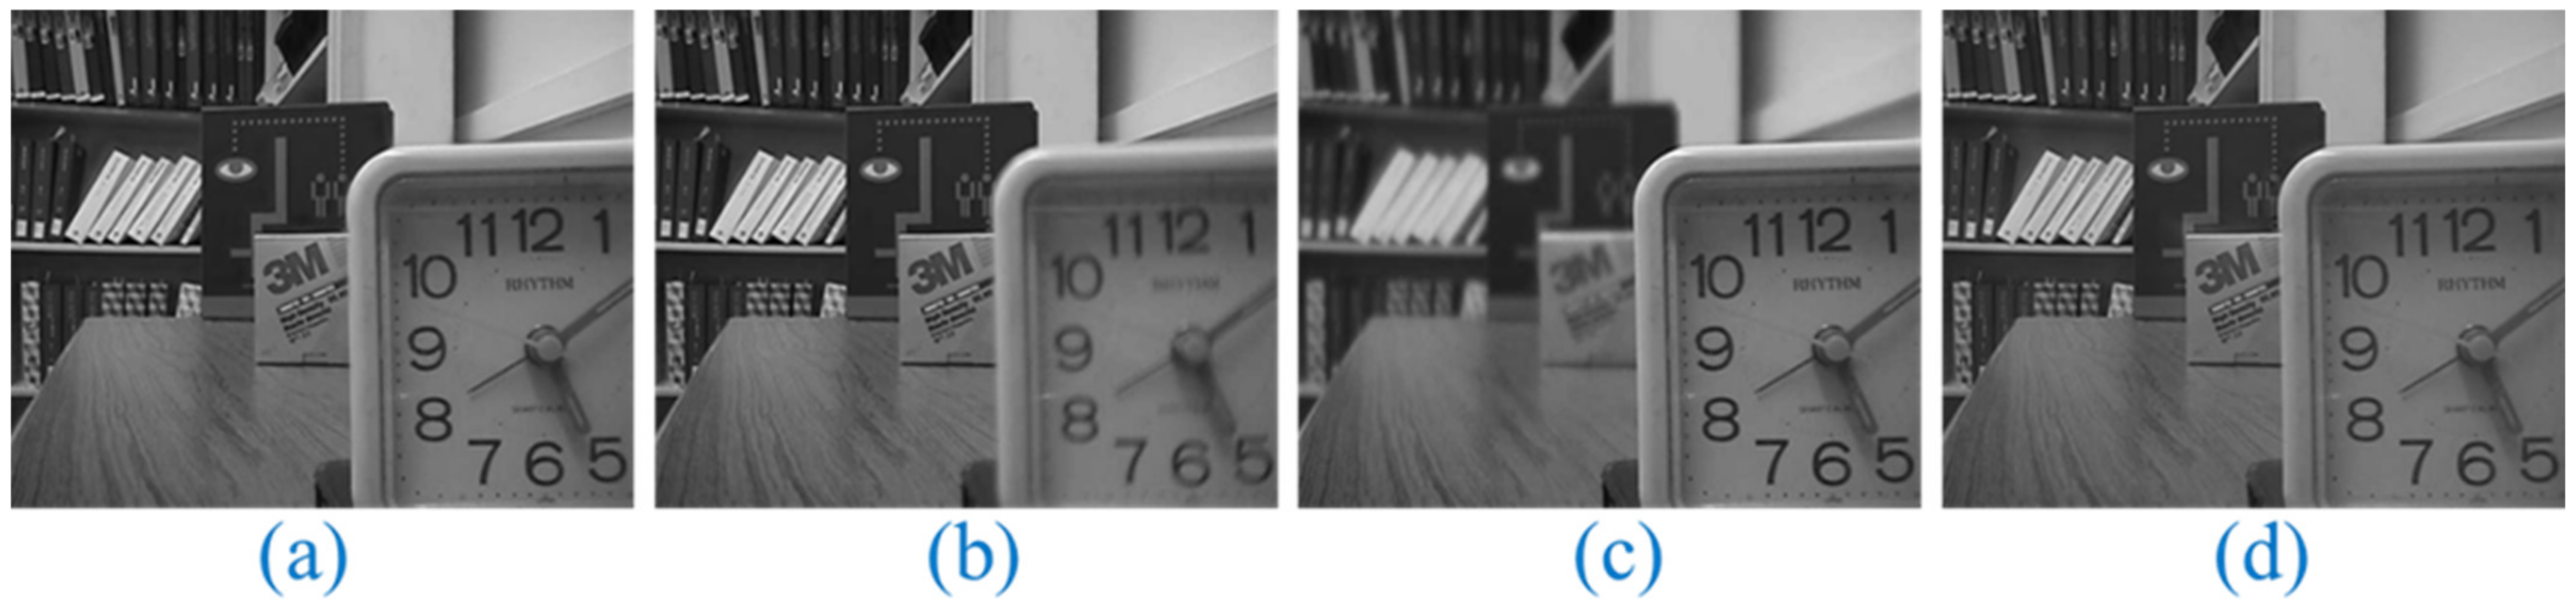
Figure 10.
Multi-focus image of a desk from various perspectives. Original Image: (a), Multi-focus Input Images: (b,c), and Proposed Fusion: (d).
Figure 10.
Multi-focus image of a desk from various perspectives. Original Image: (a), Multi-focus Input Images: (b,c), and Proposed Fusion: (d).
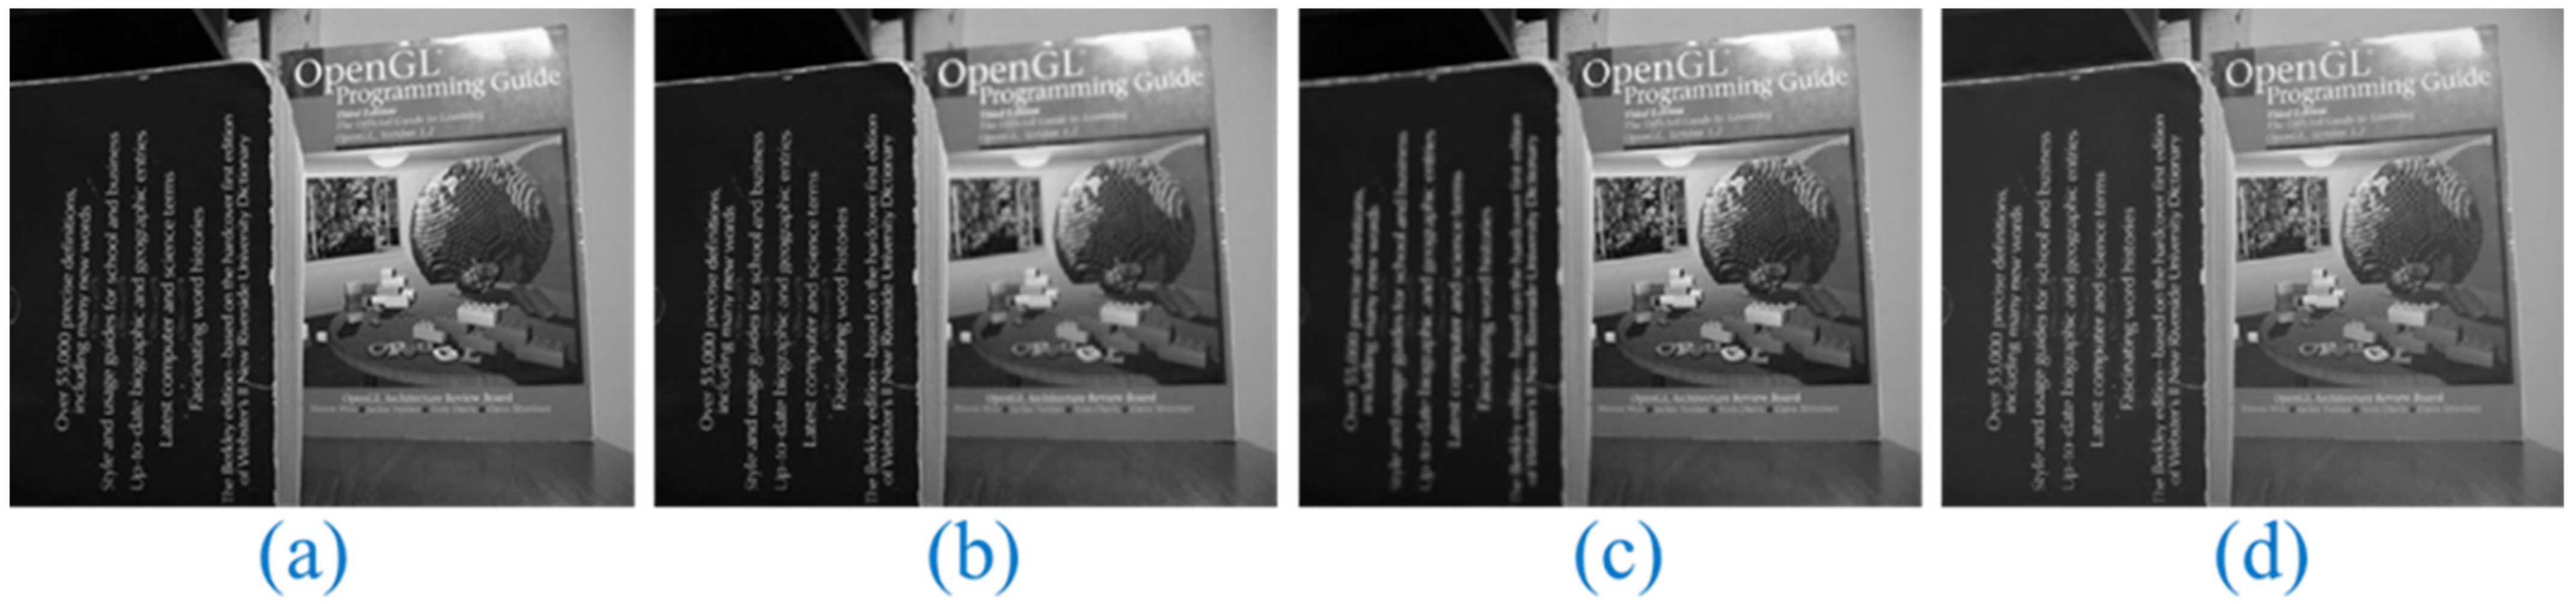
Figure 11.
Multi-focus image of a book from various perspectives. Original Image: (a), Multi-focus Input Images: (b,c), and Proposed Fusion: (d).
Figure 11.
Multi-focus image of a book from various perspectives. Original Image: (a), Multi-focus Input Images: (b,c), and Proposed Fusion: (d).
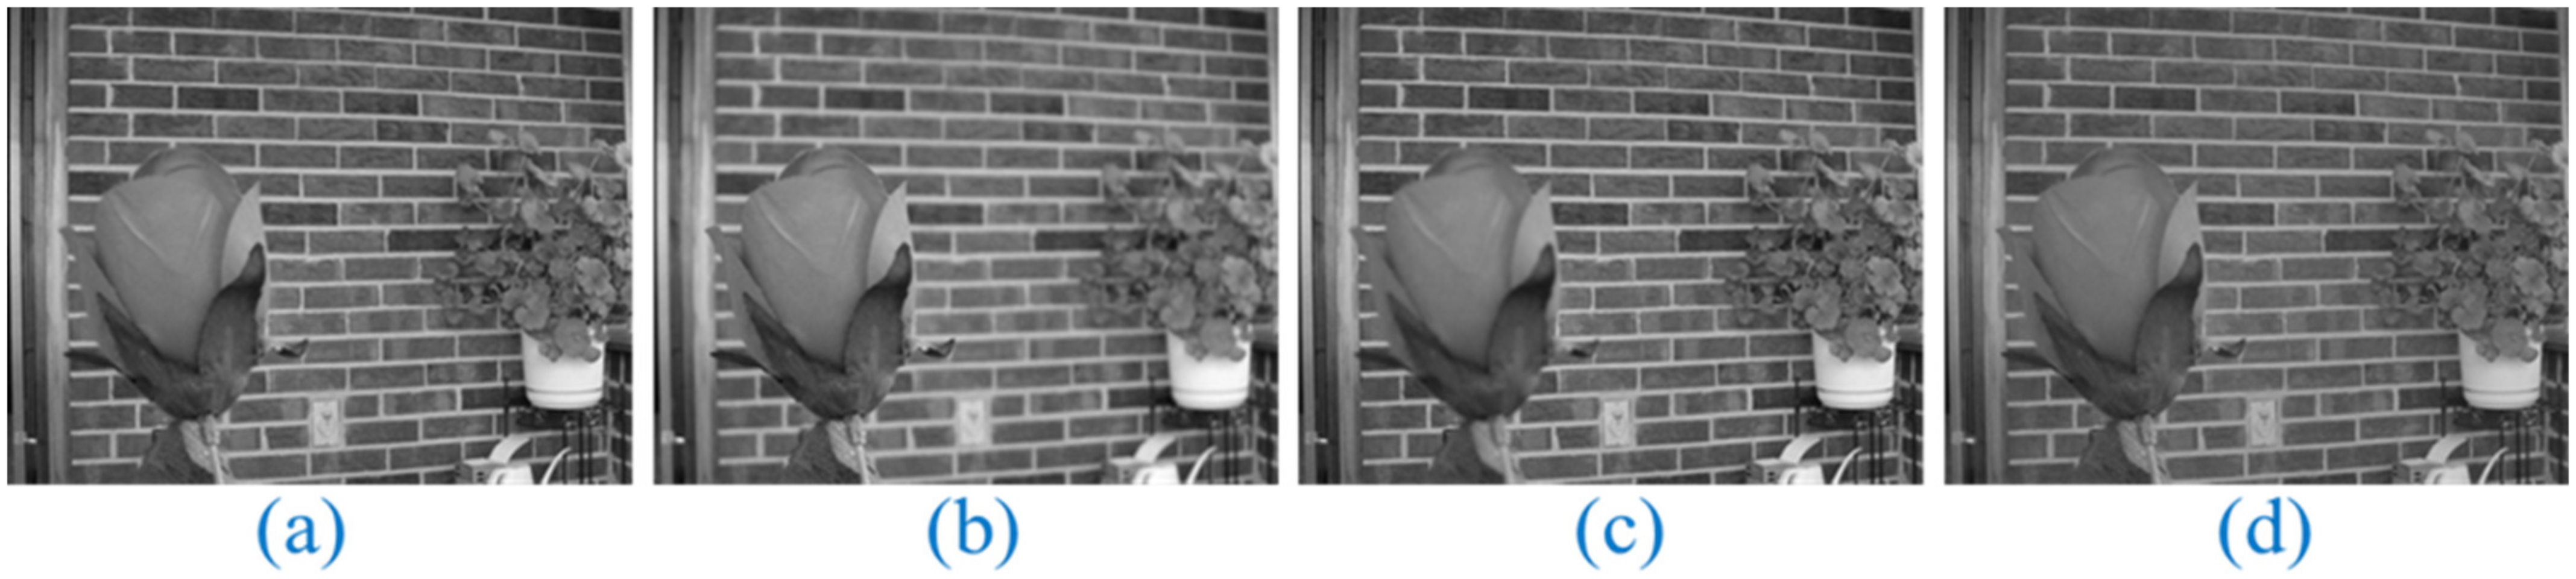
Figure 12.
Multi-focus image of a flower from various perspectives. Original Image: (a), Multi-focus Input Images: (b,c), and Proposed Fusion: (d).
Figure 12.
Multi-focus image of a flower from various perspectives. Original Image: (a), Multi-focus Input Images: (b,c), and Proposed Fusion: (d).
Figure 13.
Multi-focus image of a lab from various perspectives. Original Image: (a), Multi-focus Input Images: (b,c), and Proposed Fusion: (d).
Figure 13.
Multi-focus image of a lab from various perspectives. Original Image: (a), Multi-focus Input Images: (b,c), and Proposed Fusion: (d).
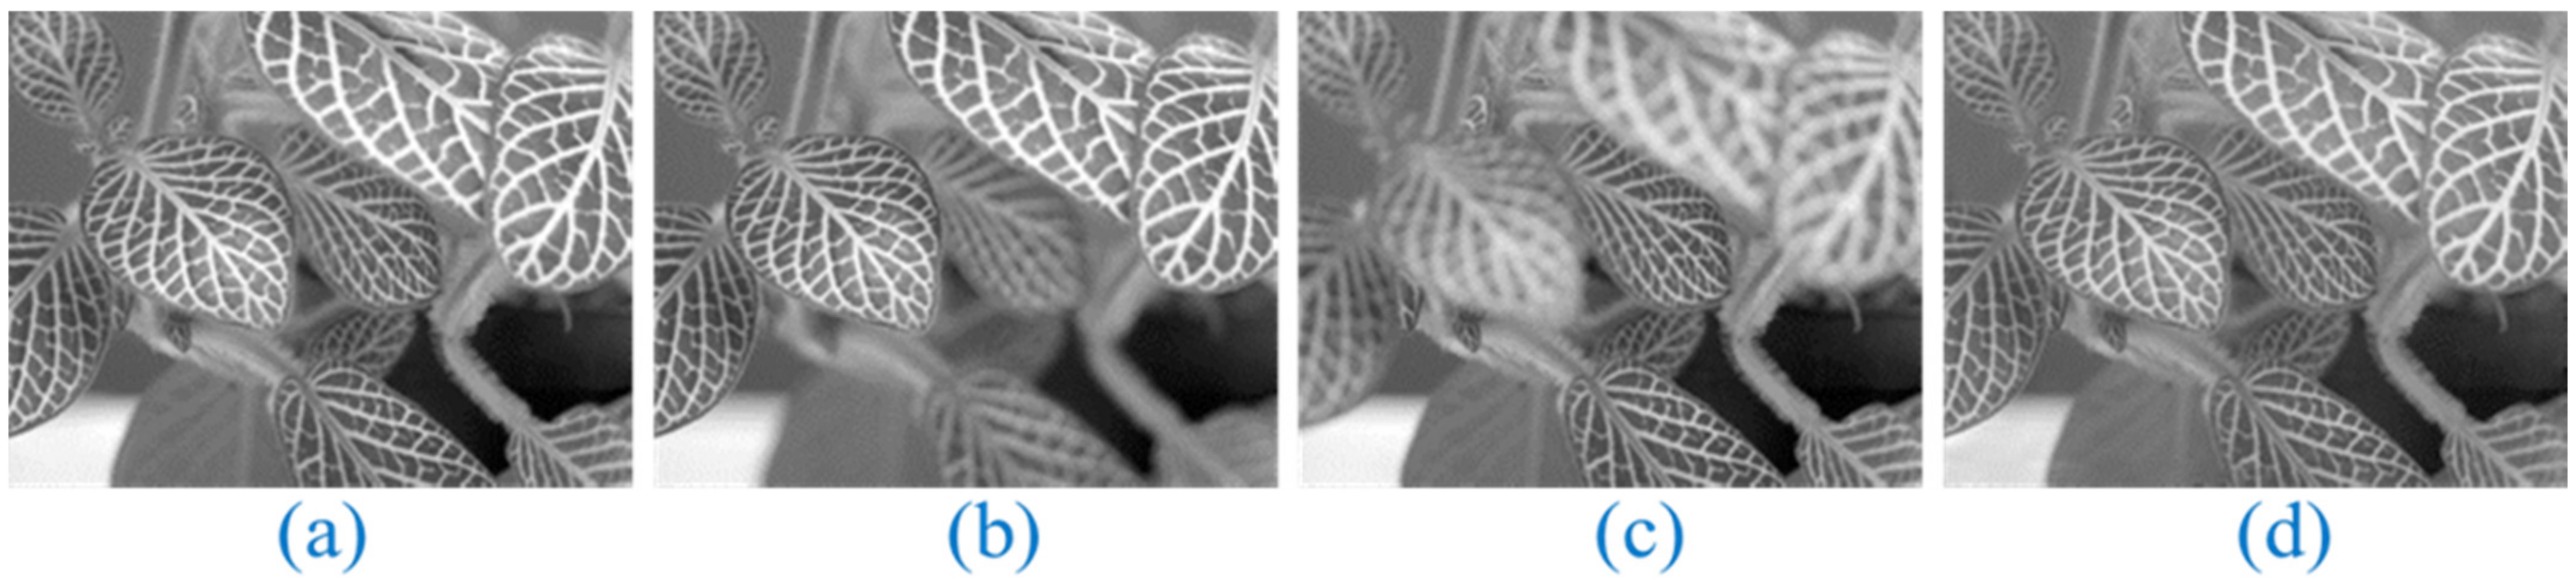
Figure 14.
Multi-focus image of a leaf from various perspectives. Original Image: (a), Multi-focus Input Images: (b,c), and Proposed Fusion: (d).
Figure 14.
Multi-focus image of a leaf from various perspectives. Original Image: (a), Multi-focus Input Images: (b,c), and Proposed Fusion: (d).
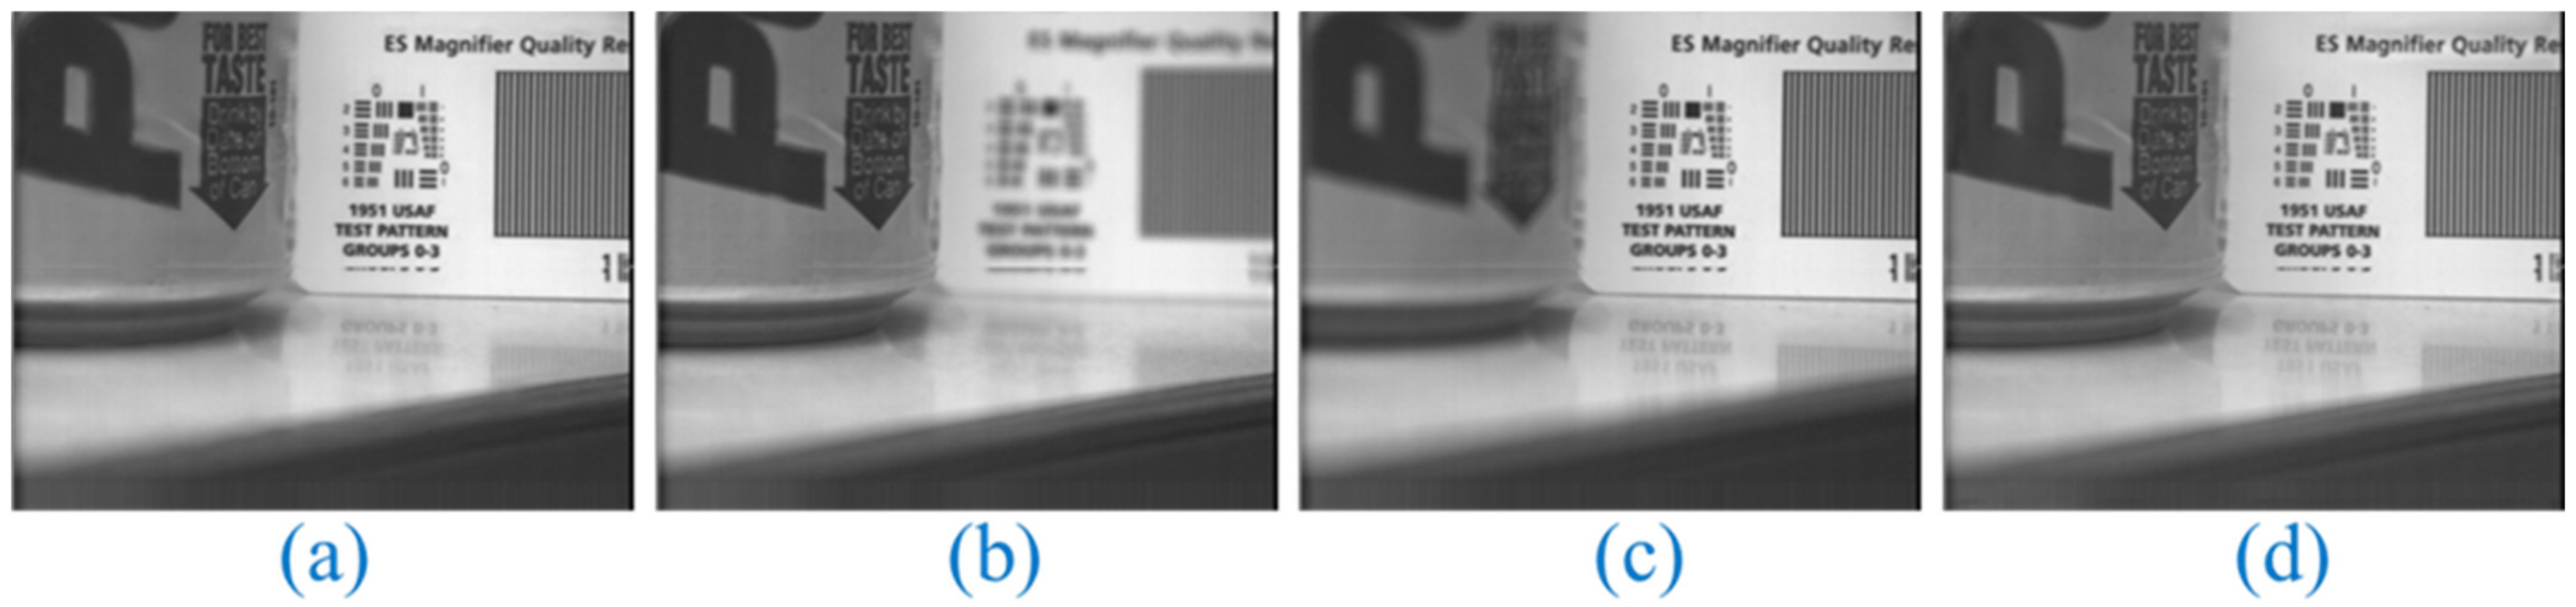
Figure 15.
Multi-focus image of a Pepsi from various perspectives. Original Image: (a), Multi-focus Input Images: (b,c), and Proposed Fusion: (d).
Figure 15.
Multi-focus image of a Pepsi from various perspectives. Original Image: (a), Multi-focus Input Images: (b,c), and Proposed Fusion: (d).
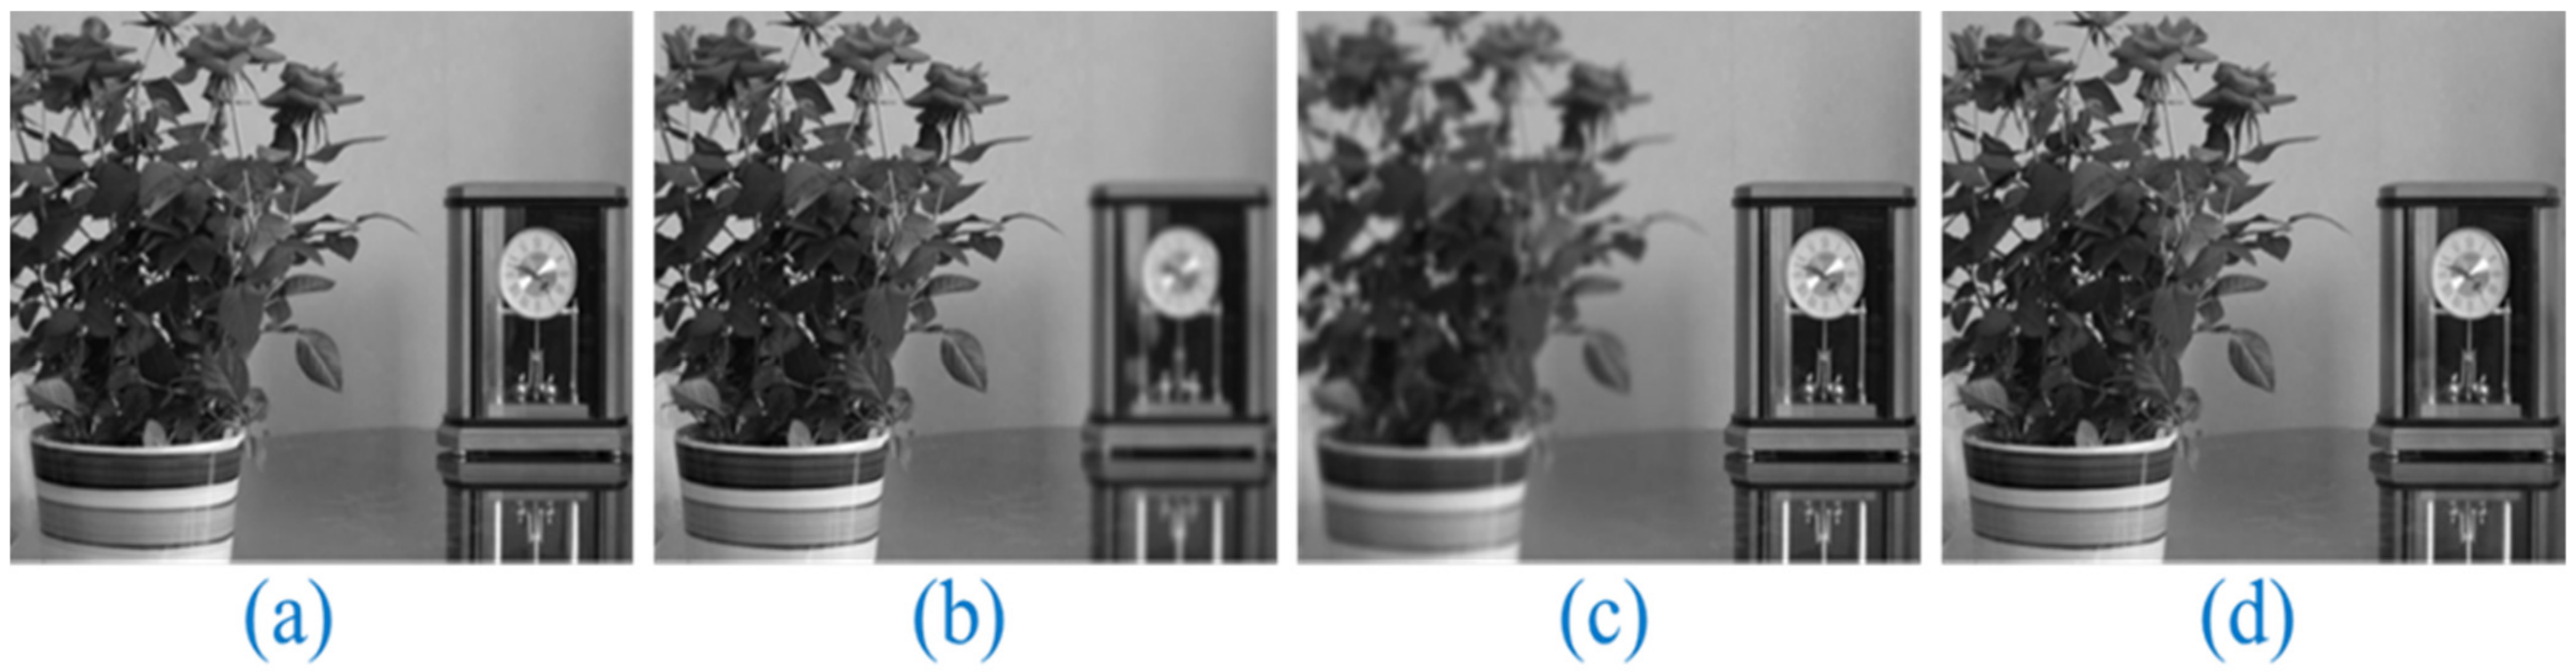
Figure 16.
Multi-focus image of a flowerpot from various perspectives. Original Image: (a), Multi-focus Input Images: (b,c), and Proposed Fusion: (d).
Figure 16.
Multi-focus image of a flowerpot from various perspectives. Original Image: (a), Multi-focus Input Images: (b,c), and Proposed Fusion: (d).
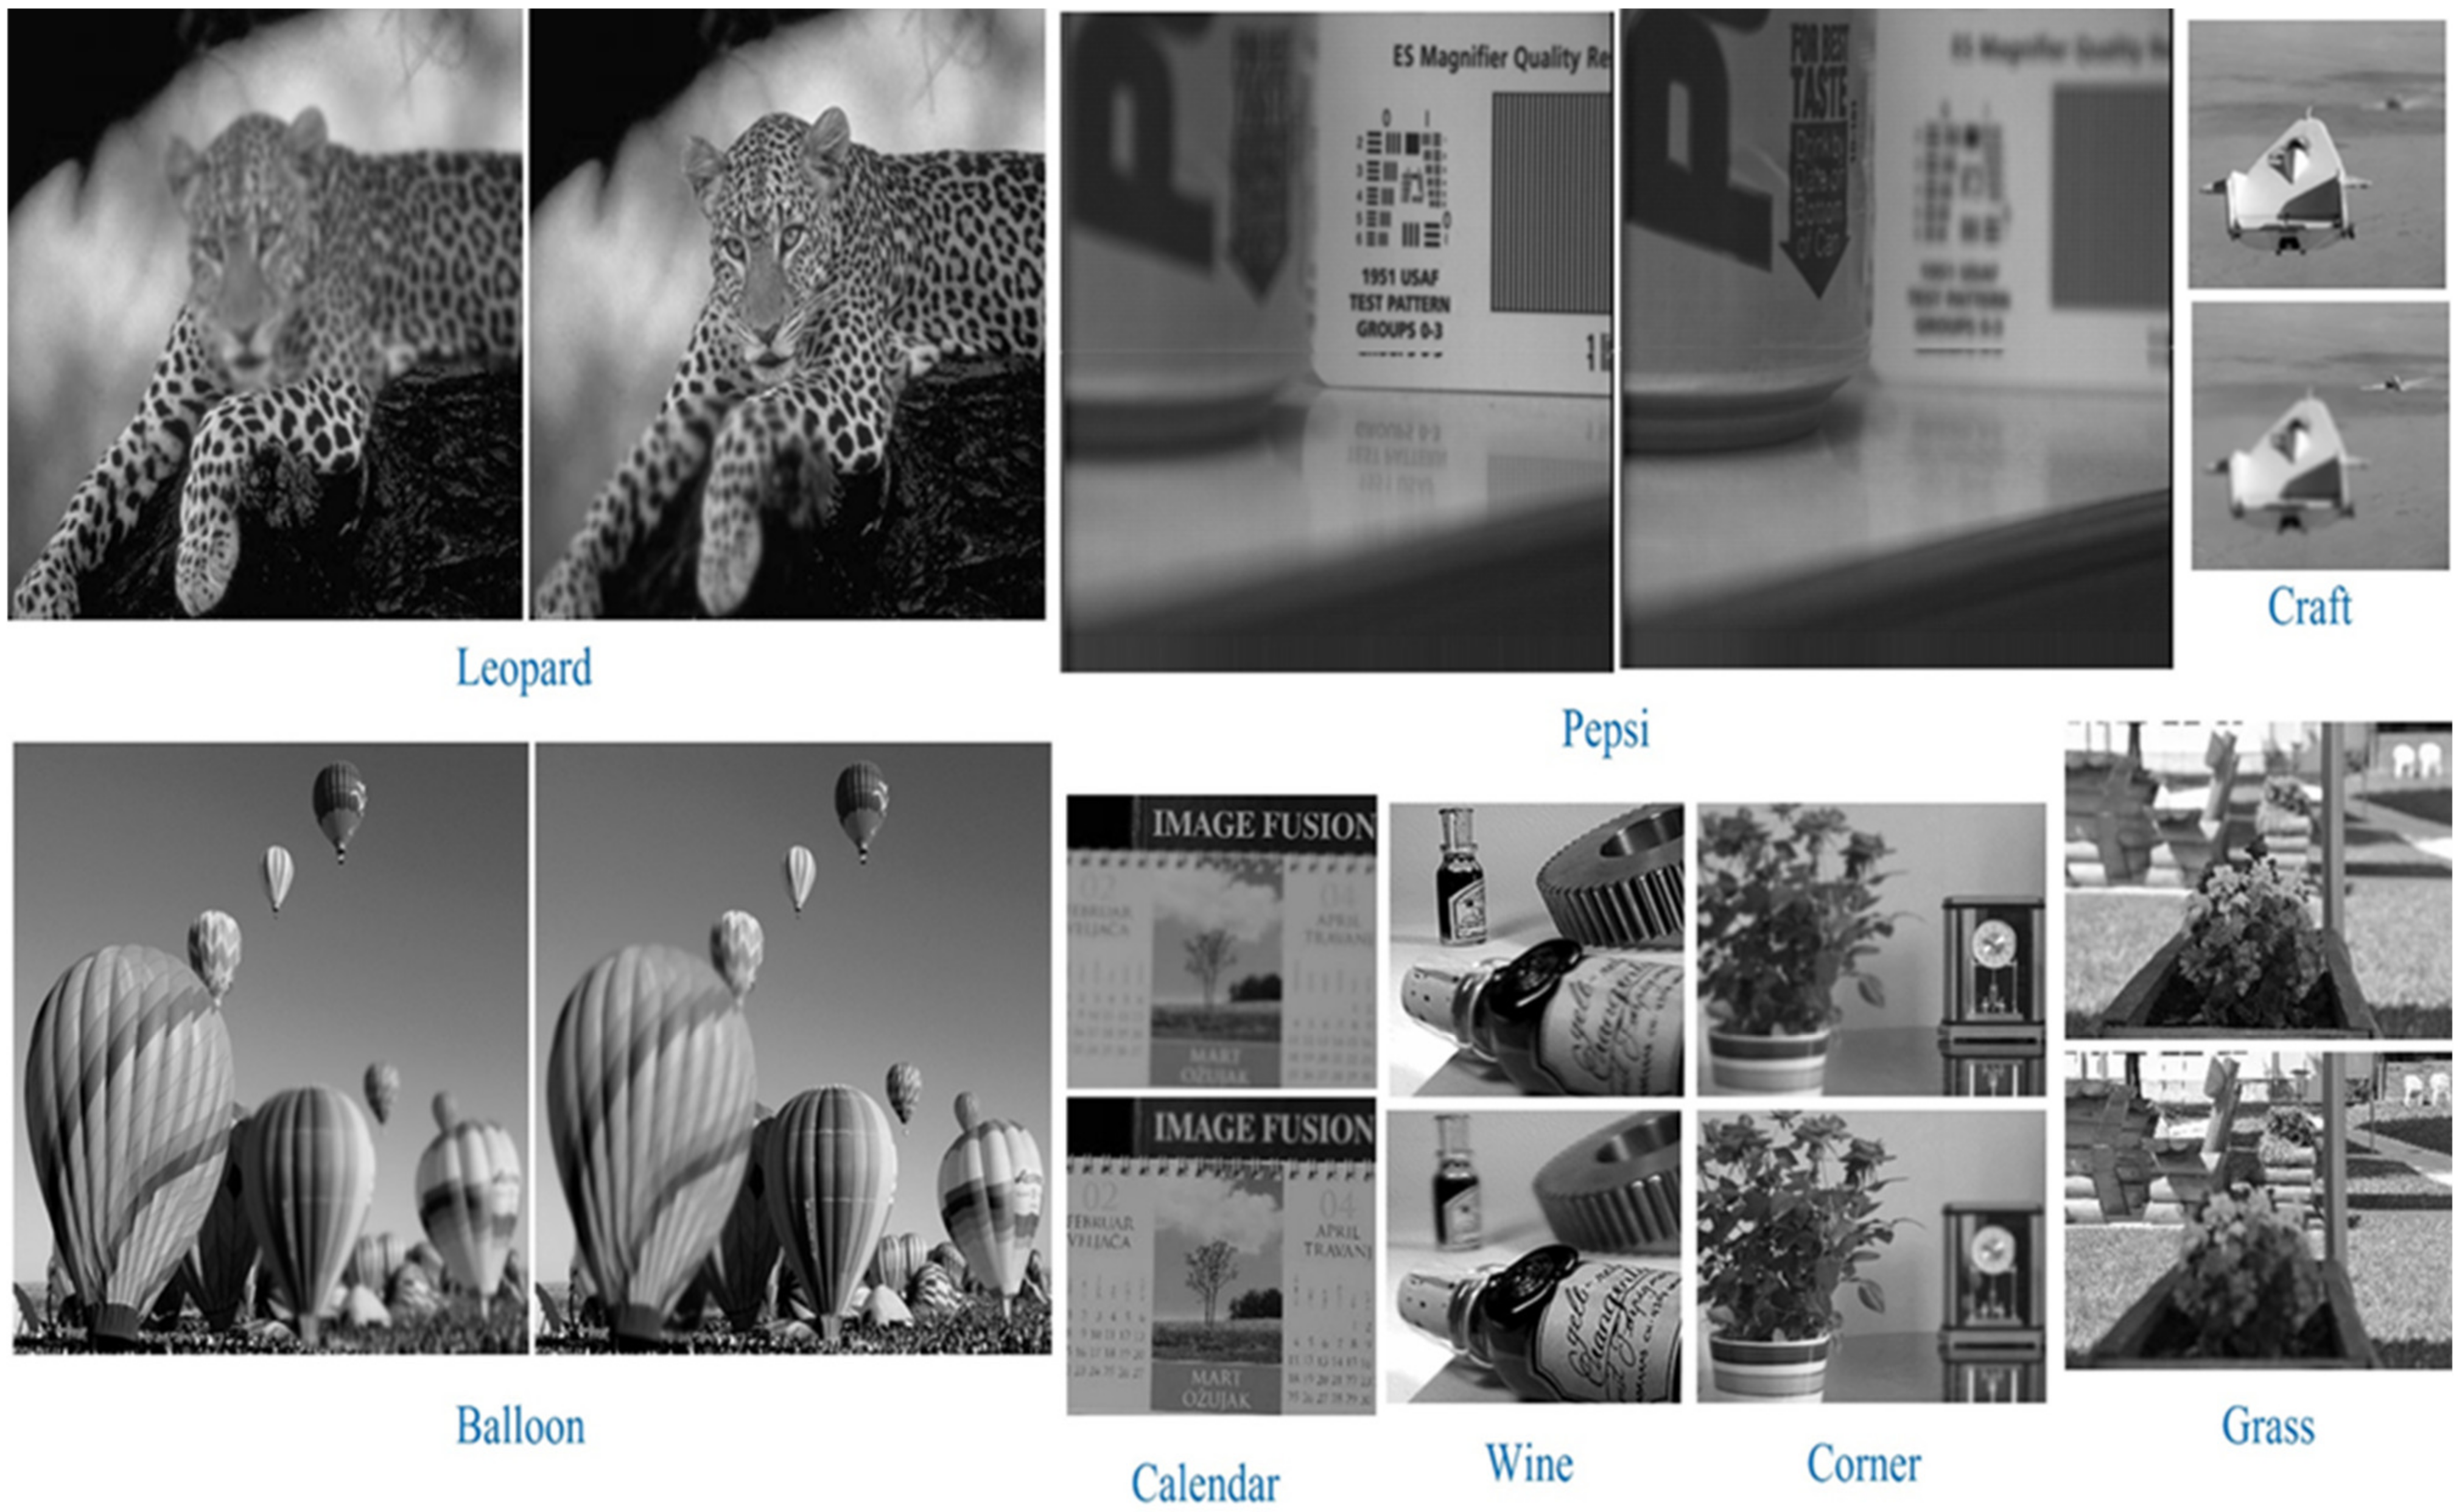
Figure 17.
Some multi-focus image pairs.
Figure 17.
Some multi-focus image pairs.
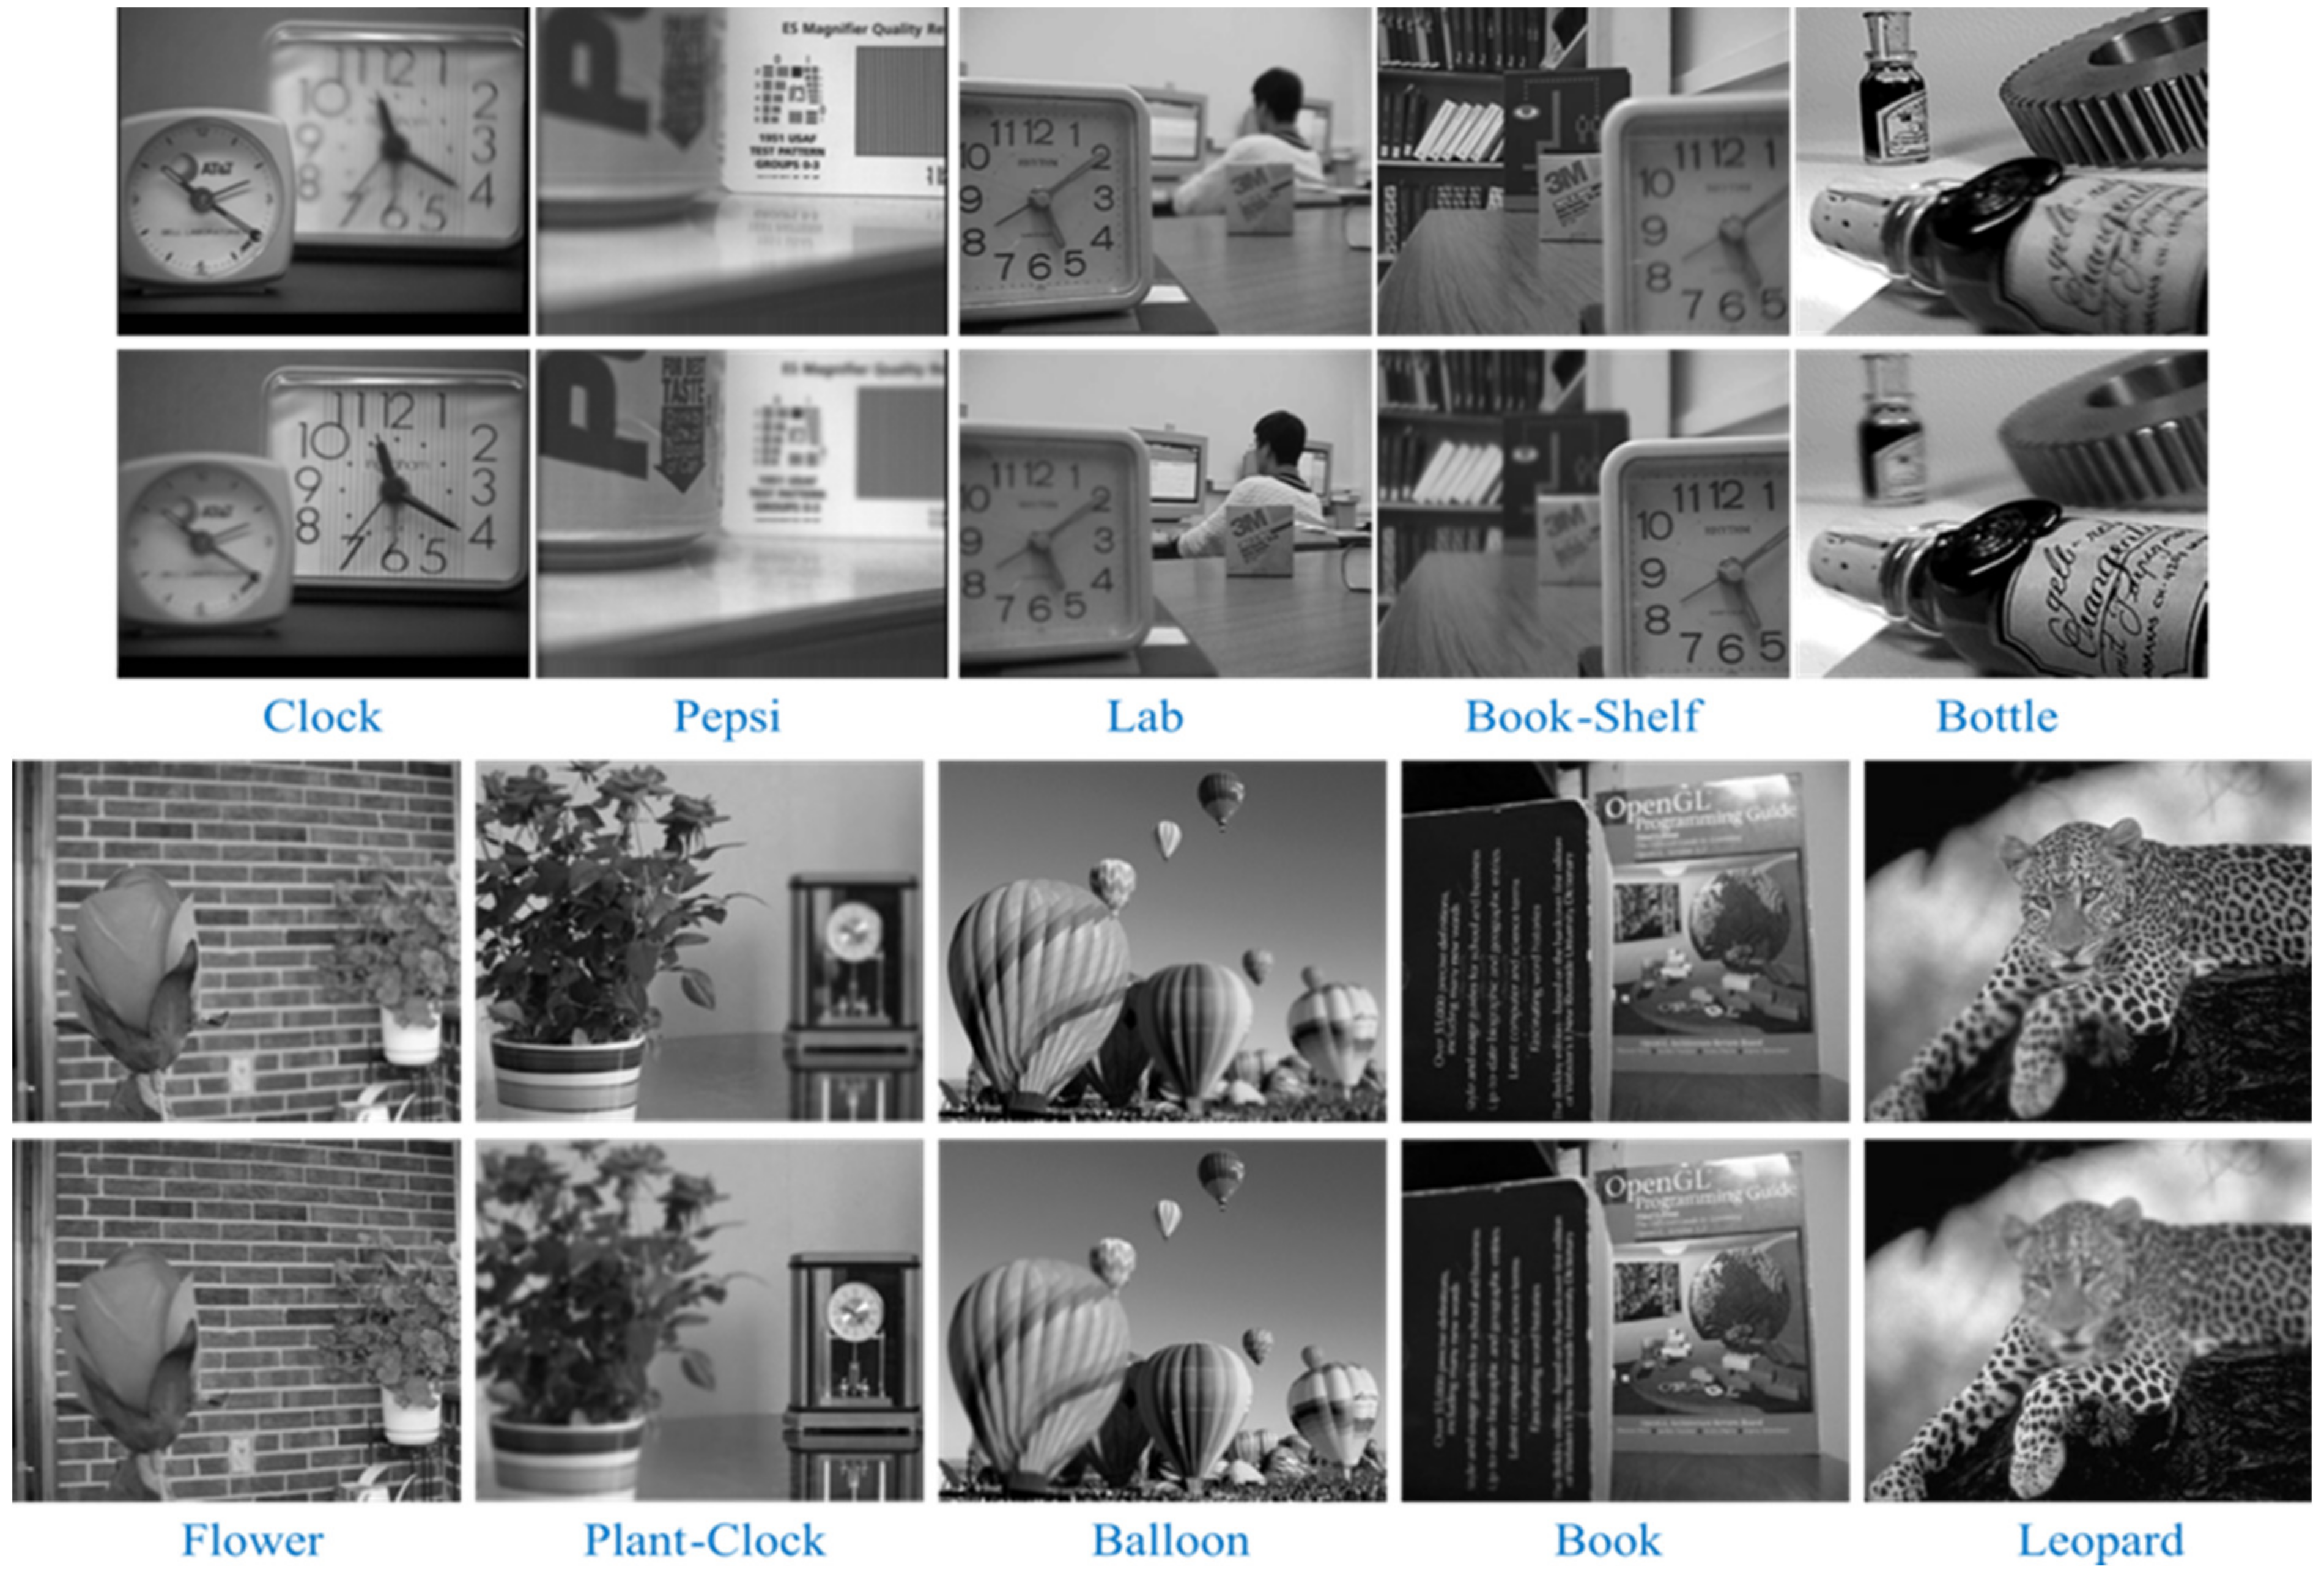
Figure 18.
Some multi-focus image pairs.
Figure 18.
Some multi-focus image pairs.
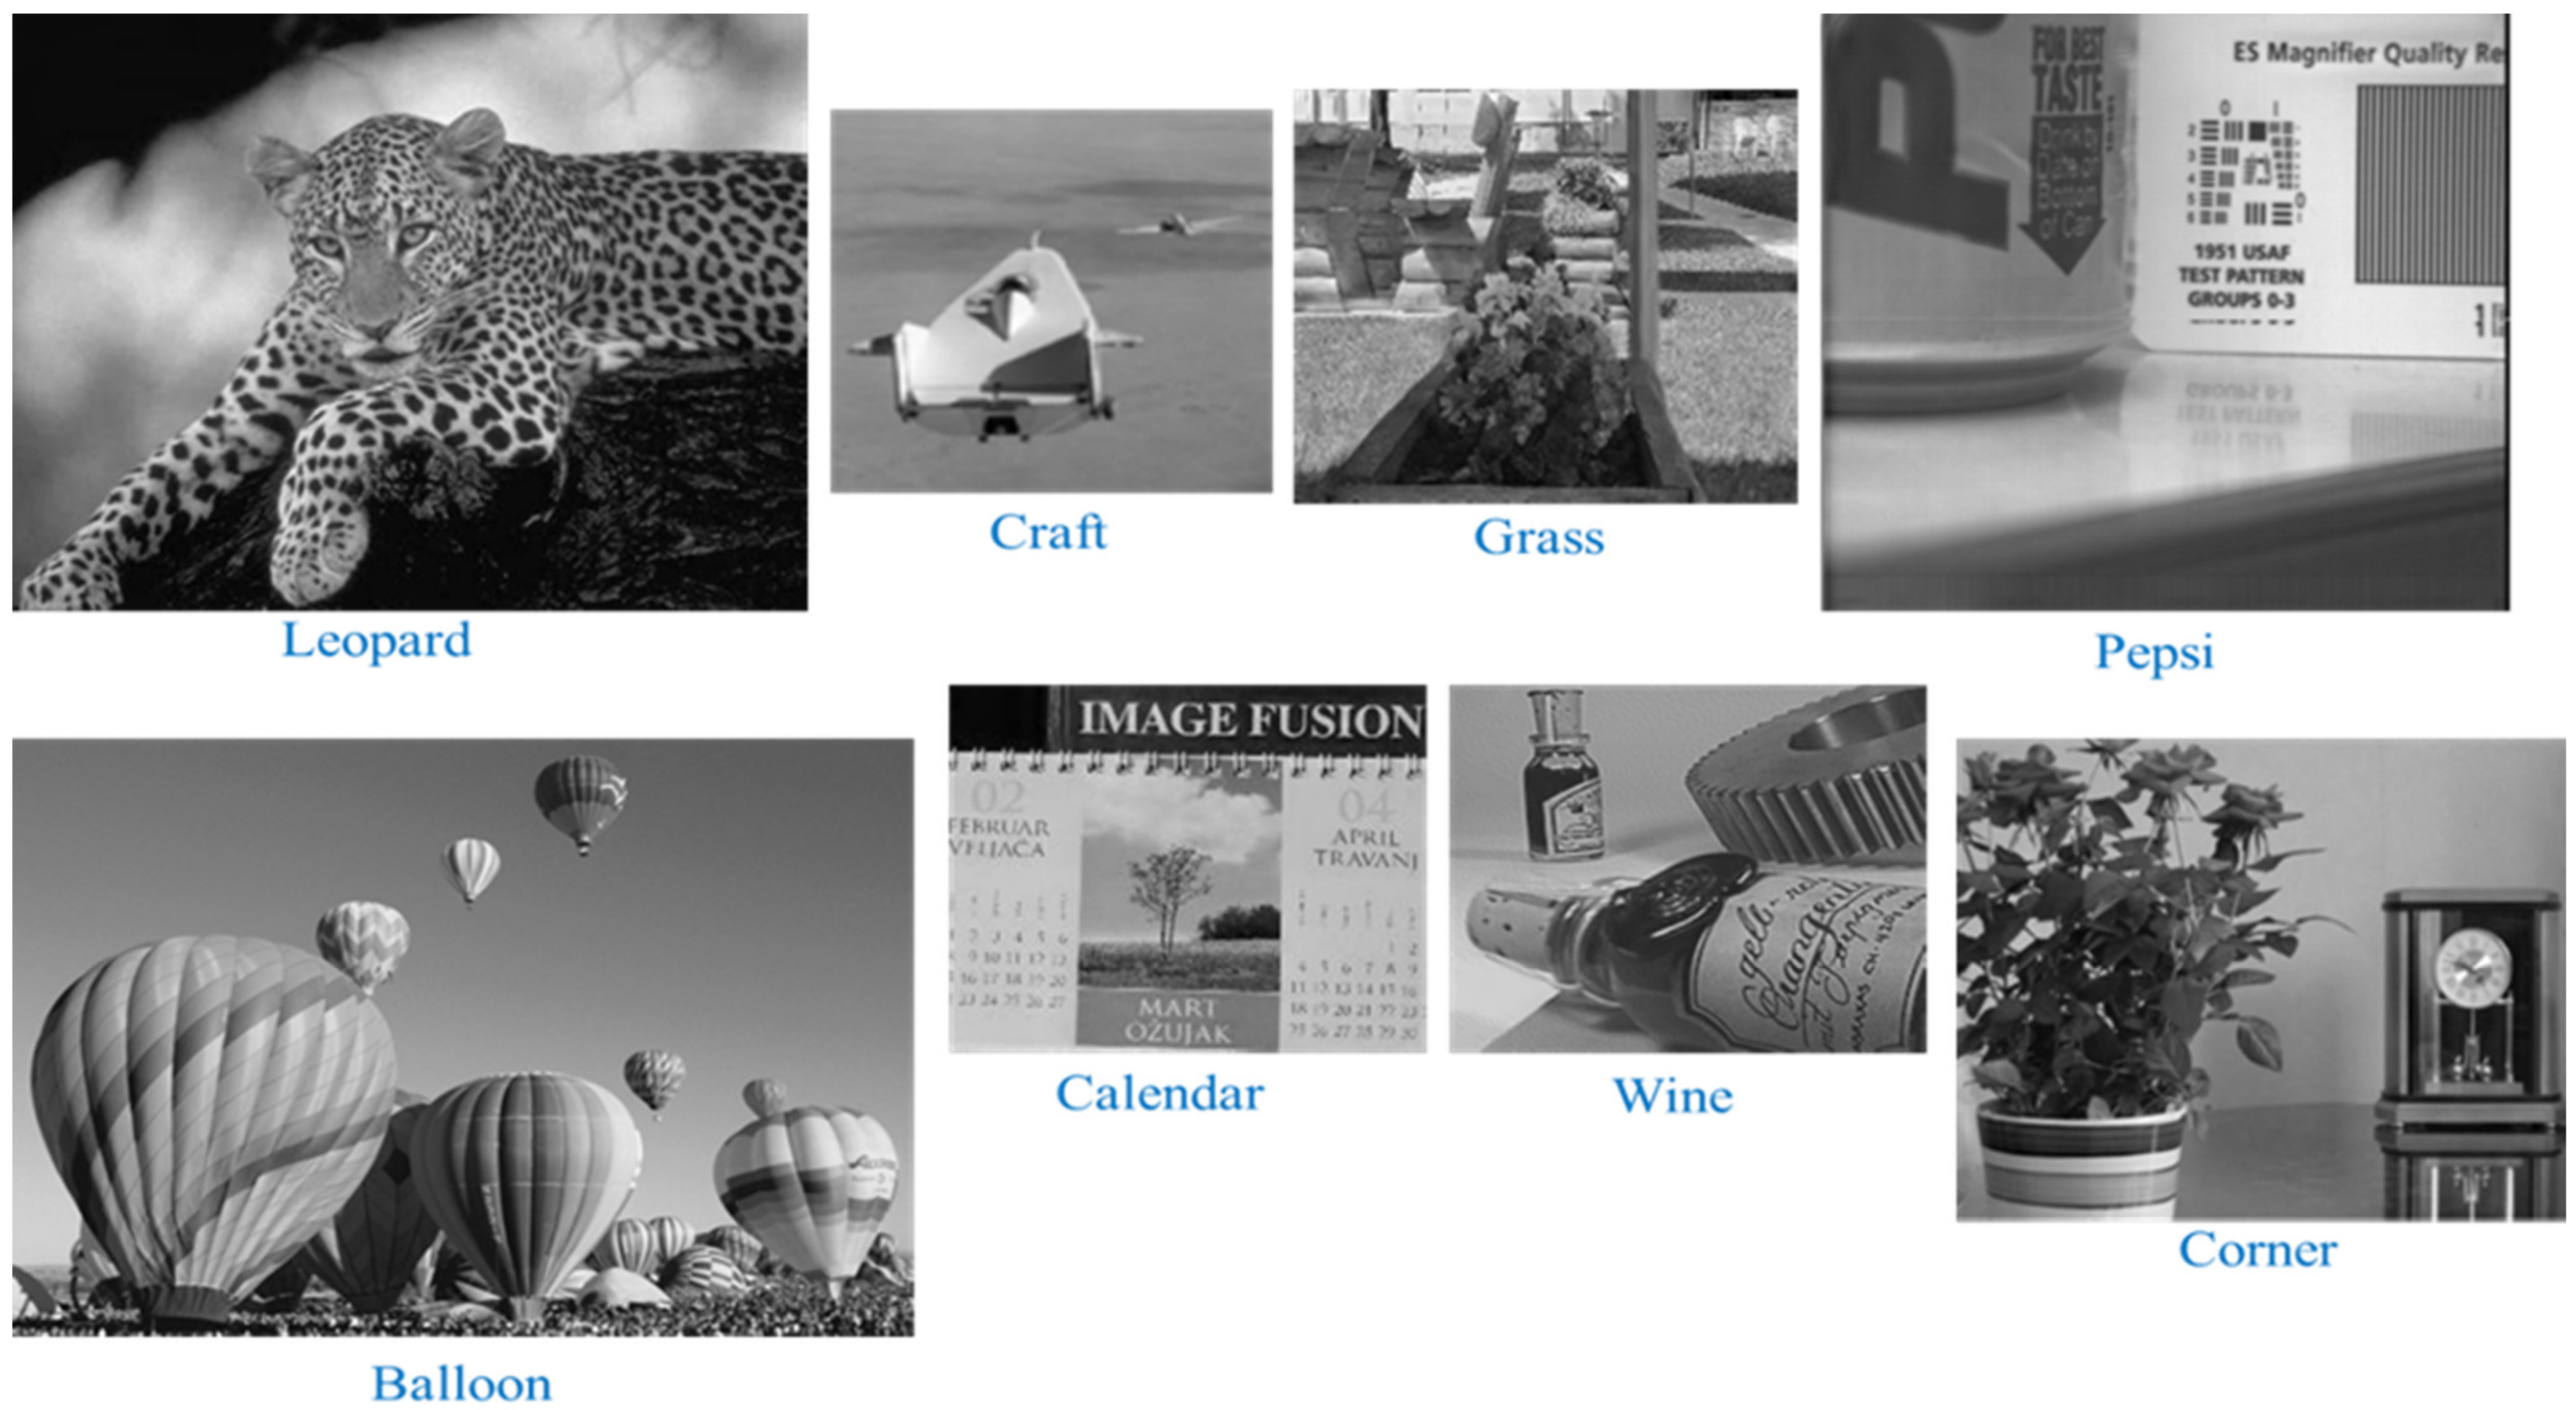
Figure 19.
Fusion results of the proposed method for the multi-focus image pairs shown in
Figure 17.
Figure 19.
Fusion results of the proposed method for the multi-focus image pairs shown in
Figure 17.
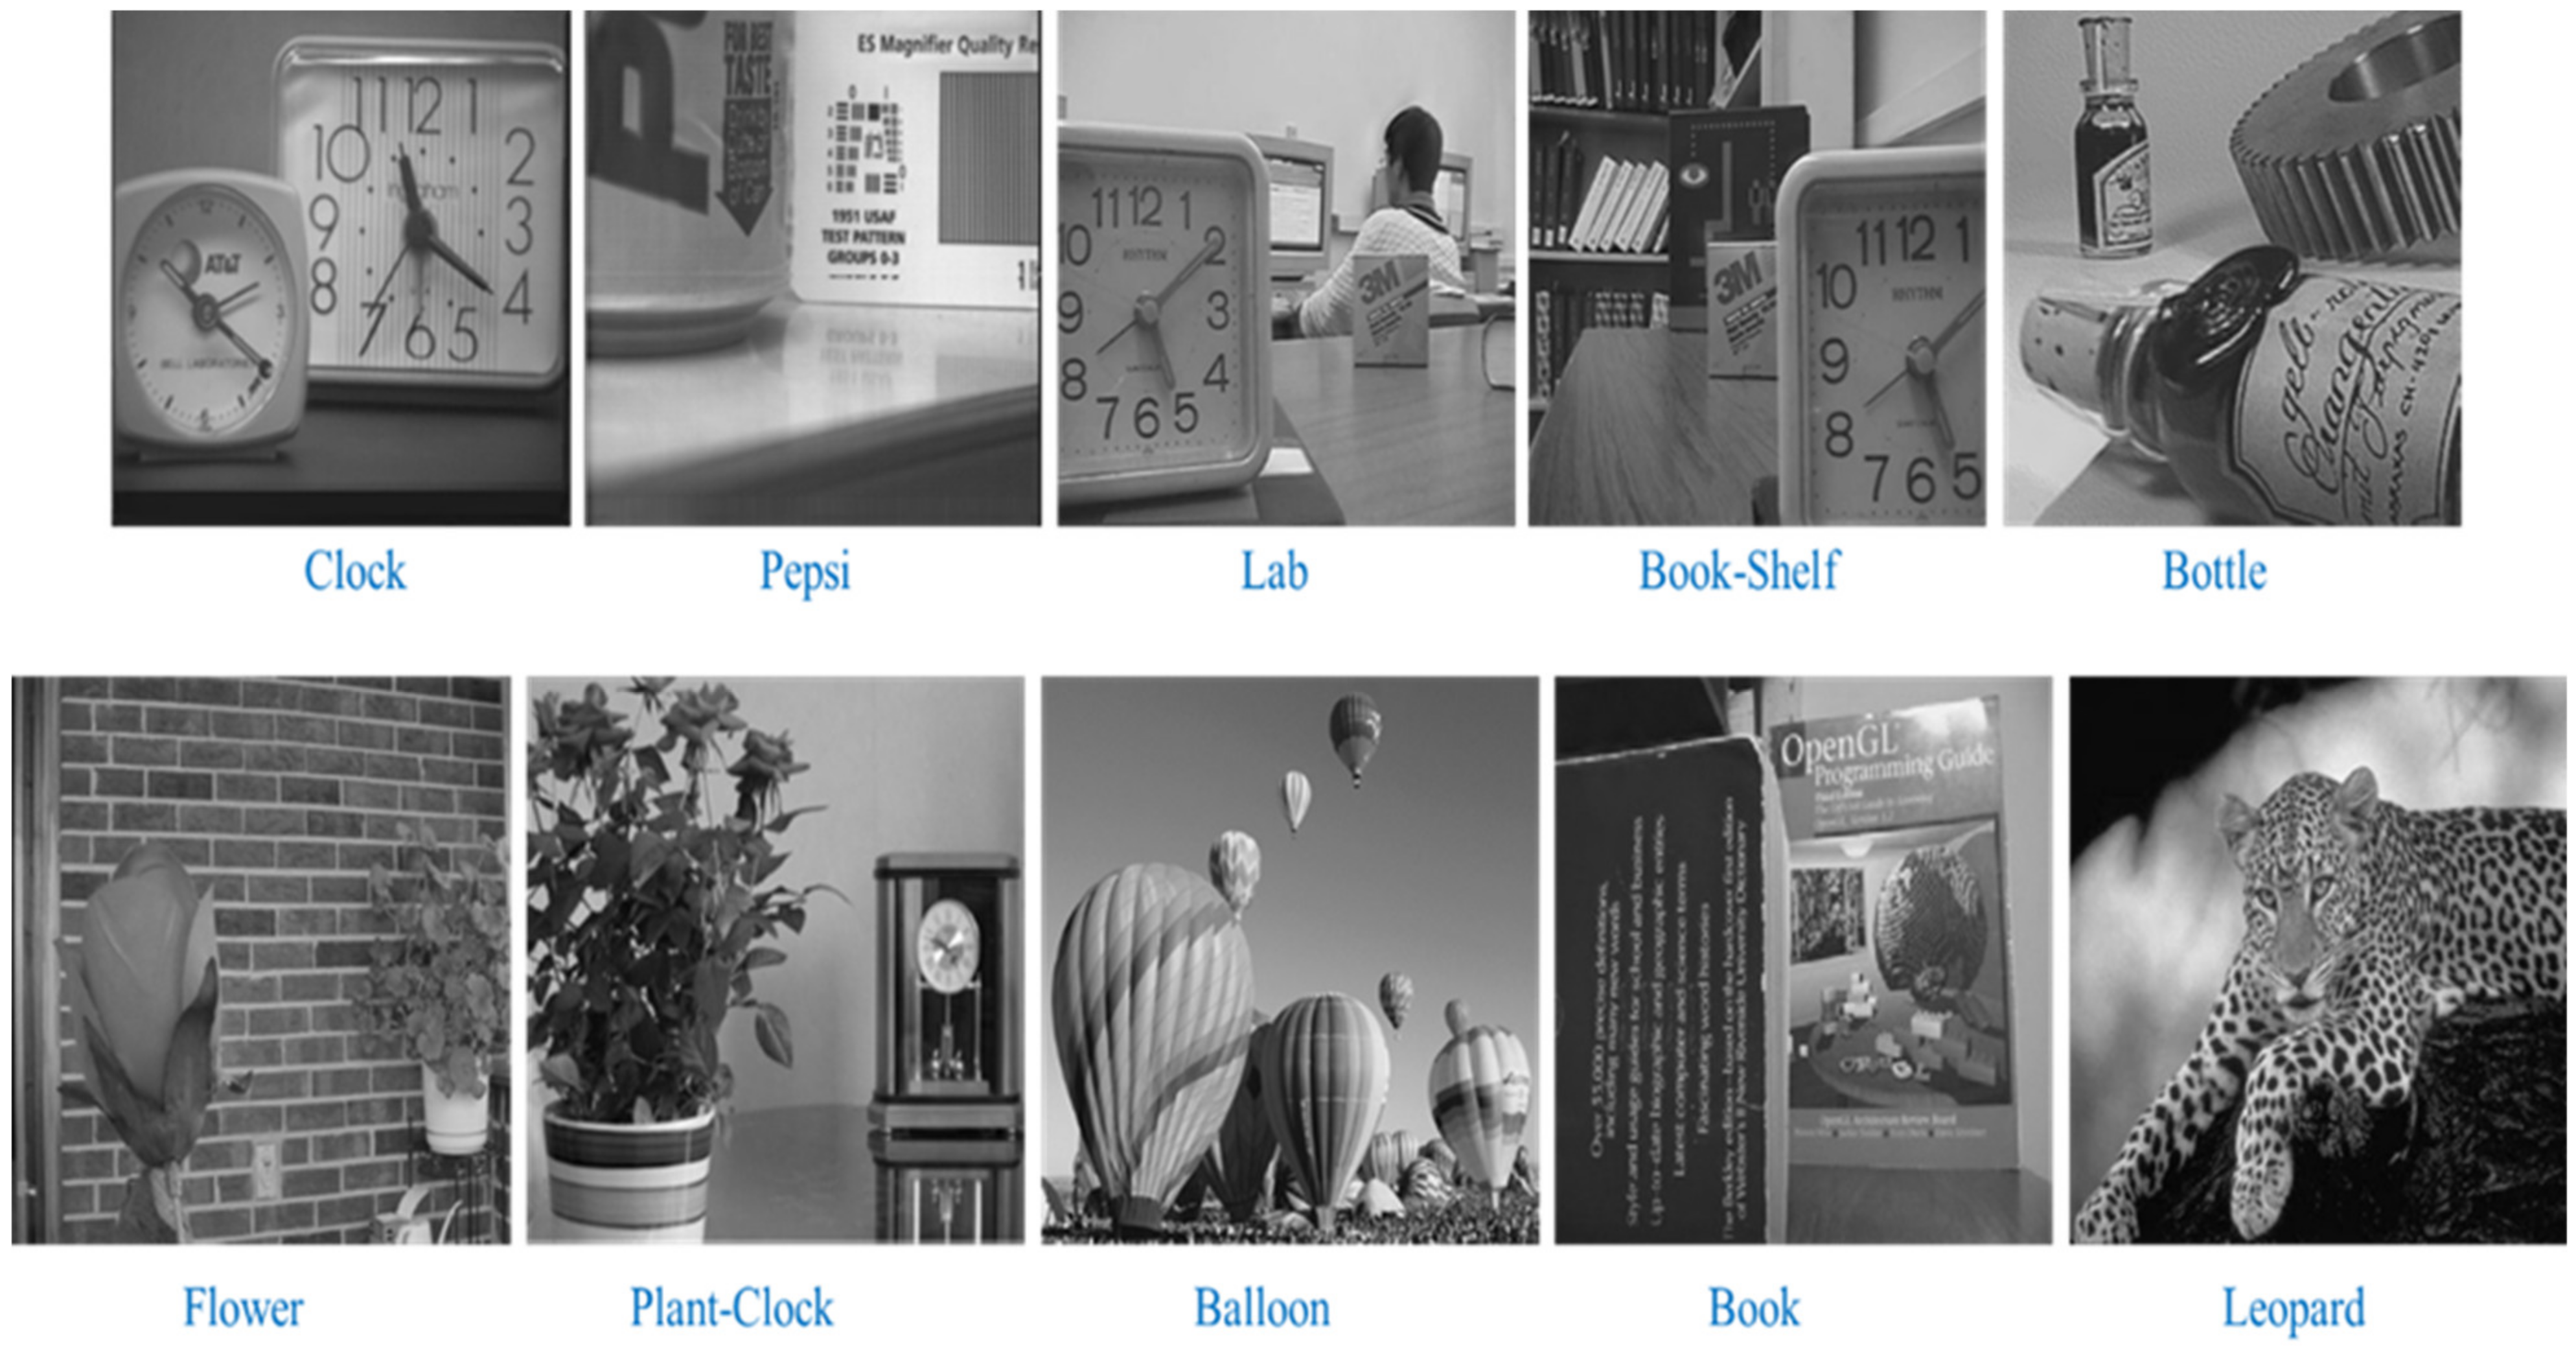
Figure 20.
Fusion results of the proposed method for the multi-focus image pairs shown in
Figure 18.
Figure 20.
Fusion results of the proposed method for the multi-focus image pairs shown in
Figure 18.
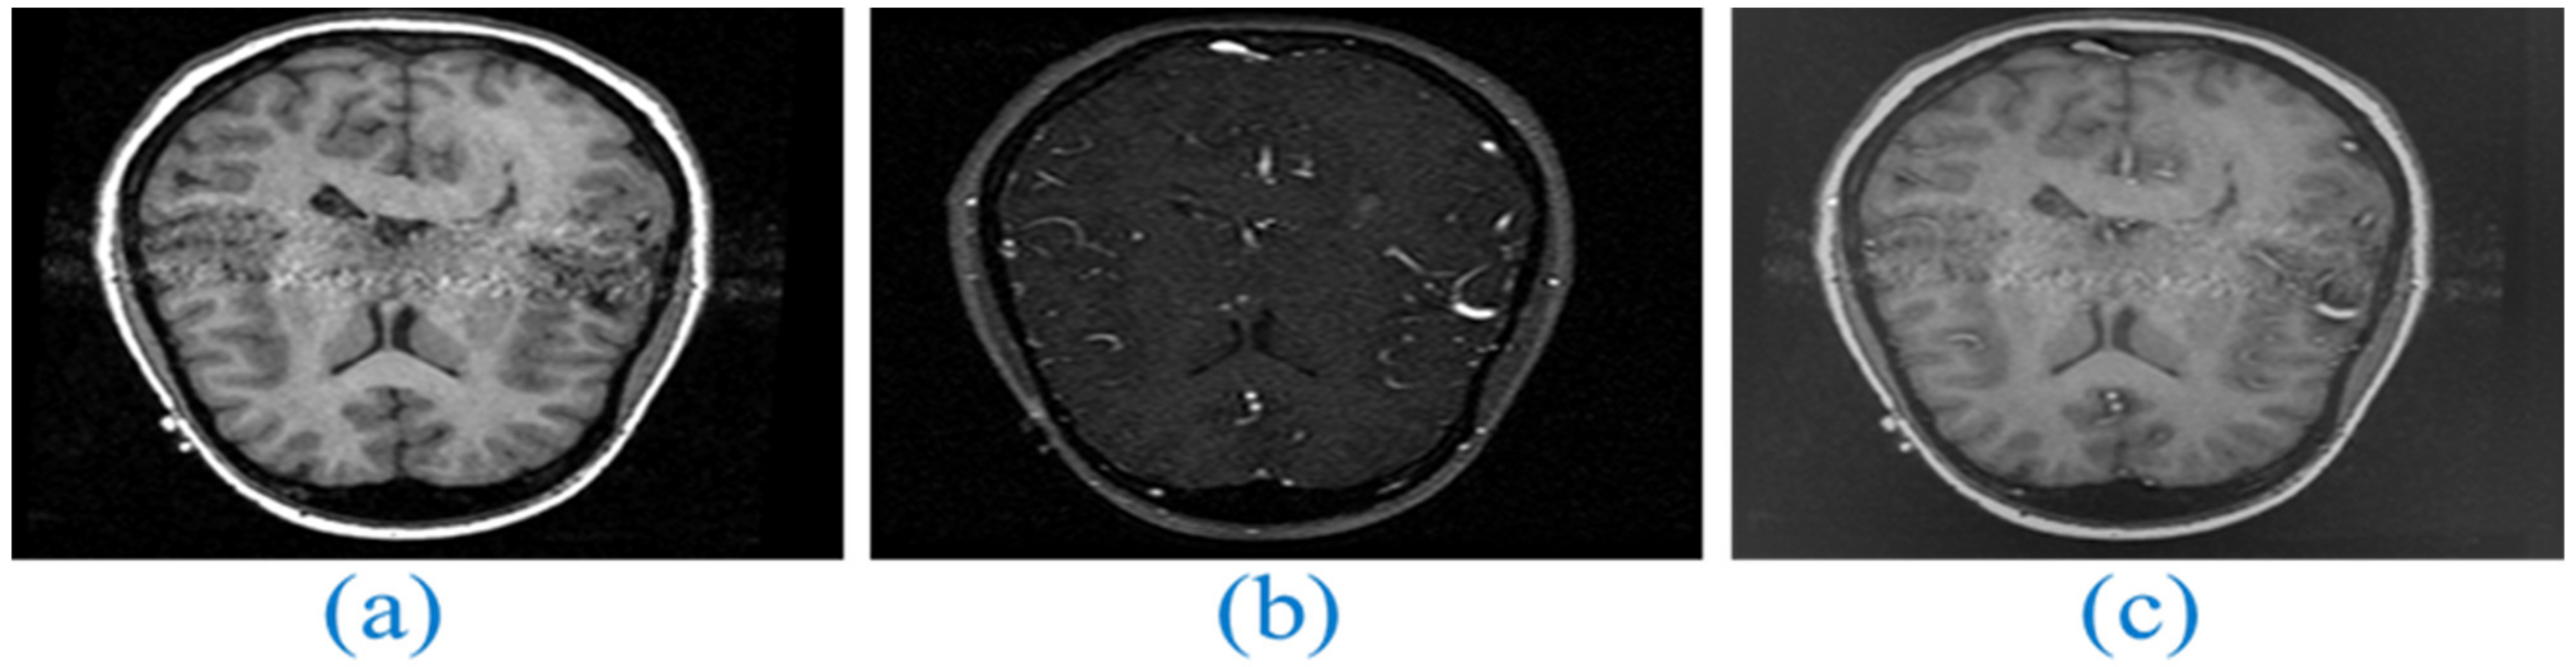
Figure 21.
Medical Image Pair: (a,b) are source images, (c) Final fused image.
Figure 21.
Medical Image Pair: (a,b) are source images, (c) Final fused image.
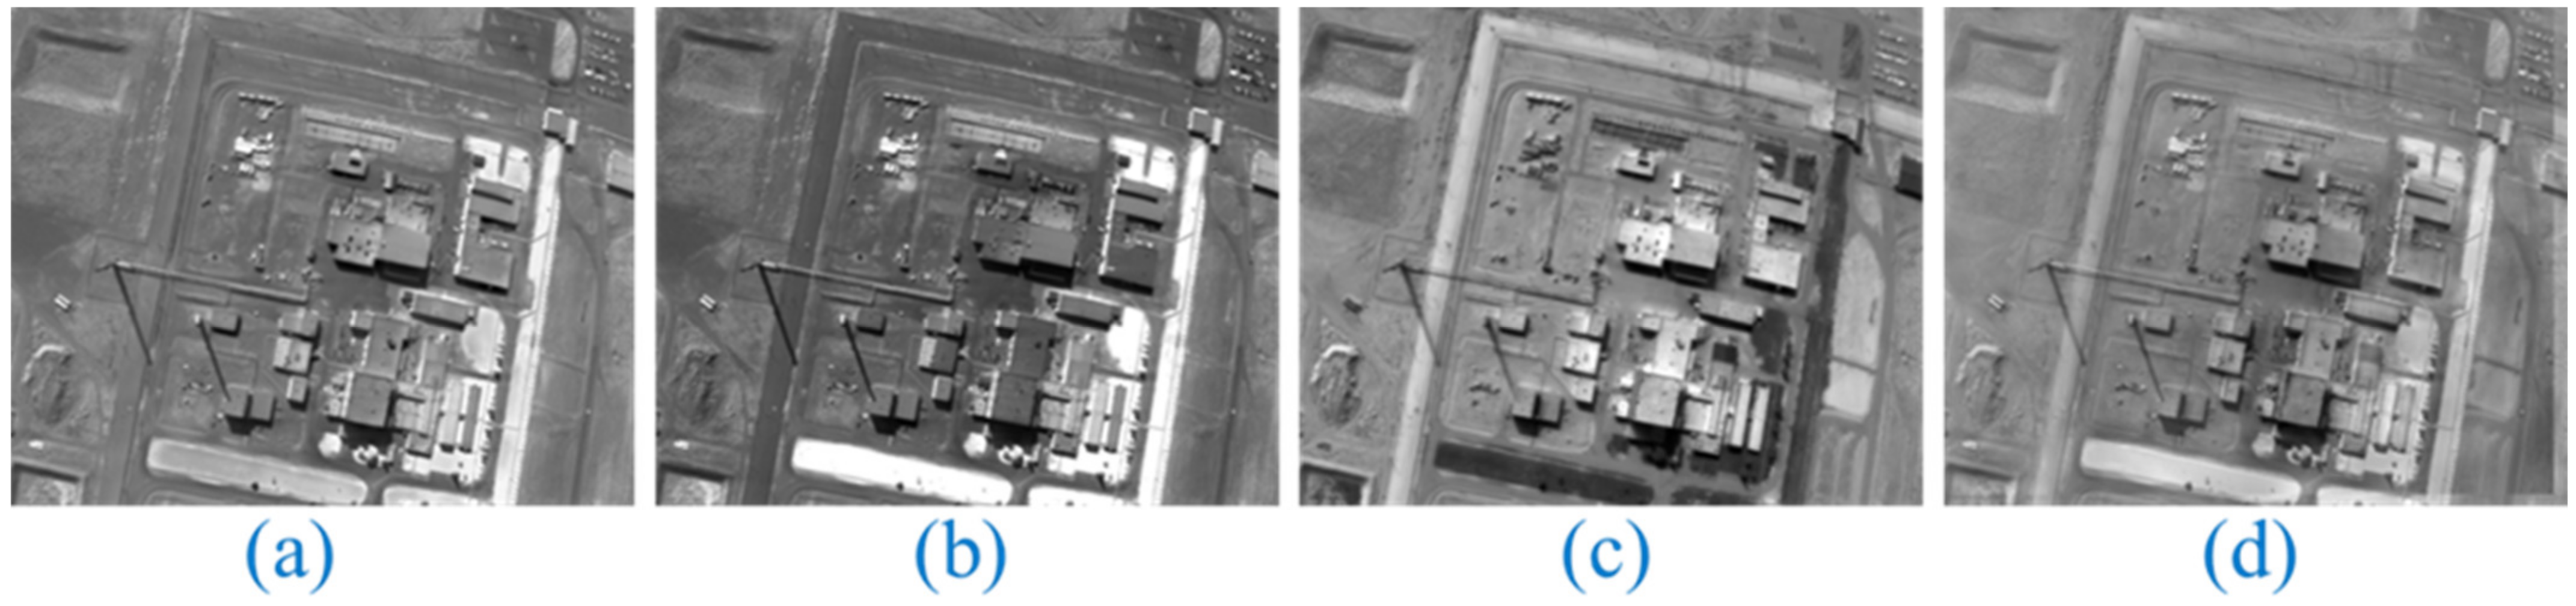
Figure 22.
Multi-focus image of a remote sensing from various perspectives: (a) the original image, (b) the image with the left focus, (c) the image with the right focus, and (d) the image fused using the proposed method.
Figure 22.
Multi-focus image of a remote sensing from various perspectives: (a) the original image, (b) the image with the left focus, (c) the image with the right focus, and (d) the image fused using the proposed method.
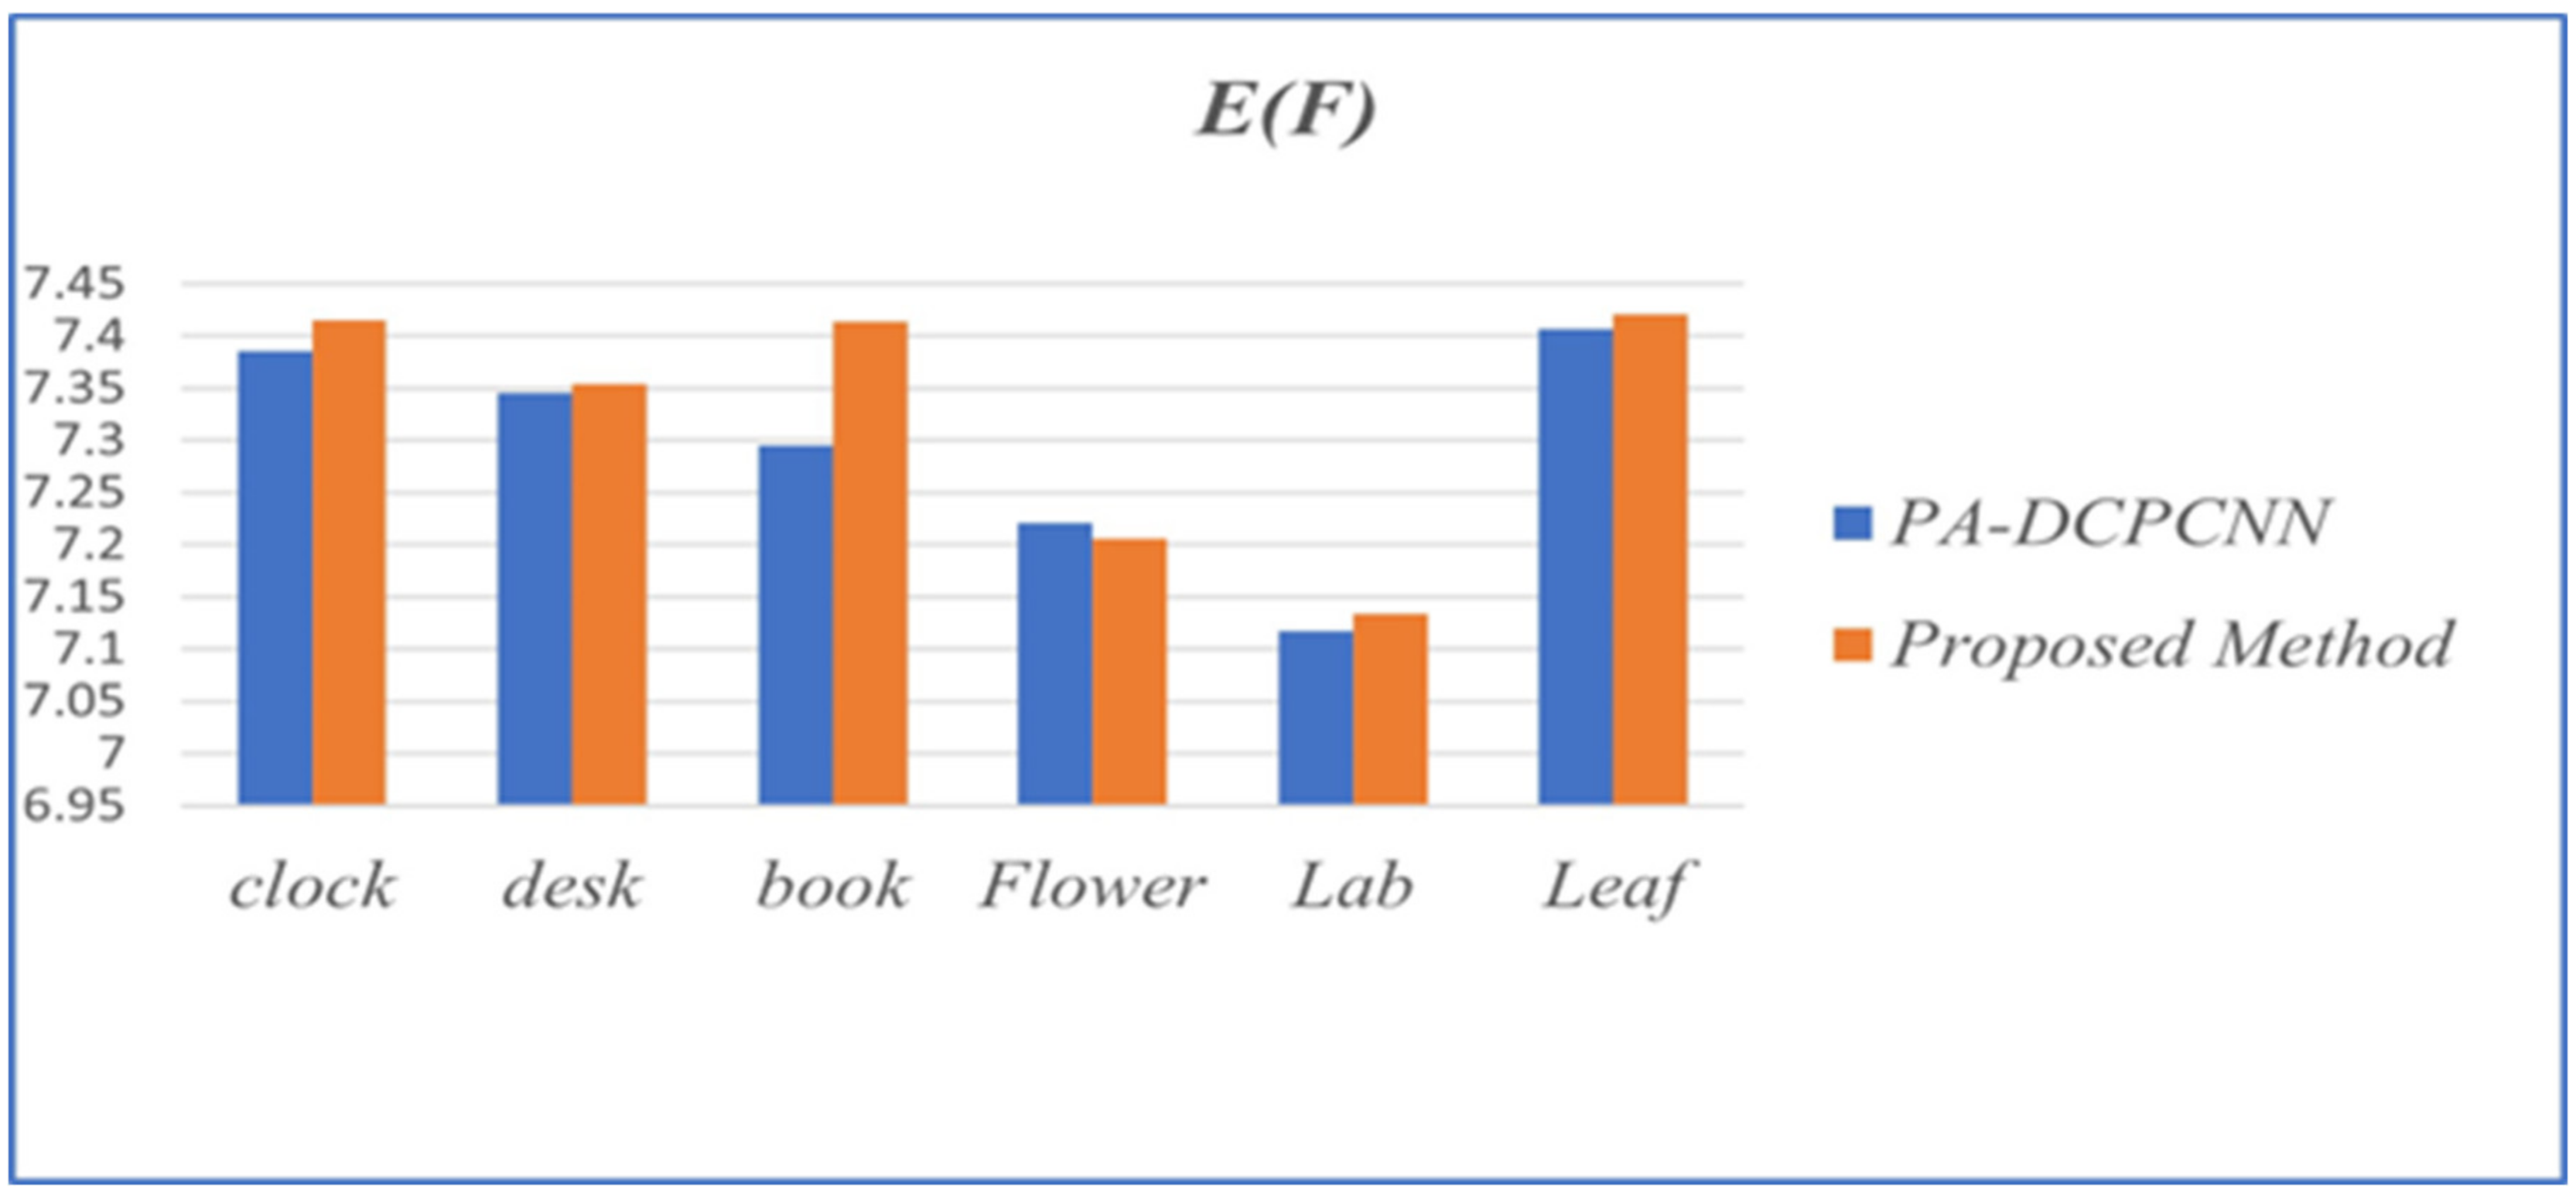
Figure 23.
Performance evaluation of image-fusion techniques in reference to E(F).
Figure 23.
Performance evaluation of image-fusion techniques in reference to E(F).
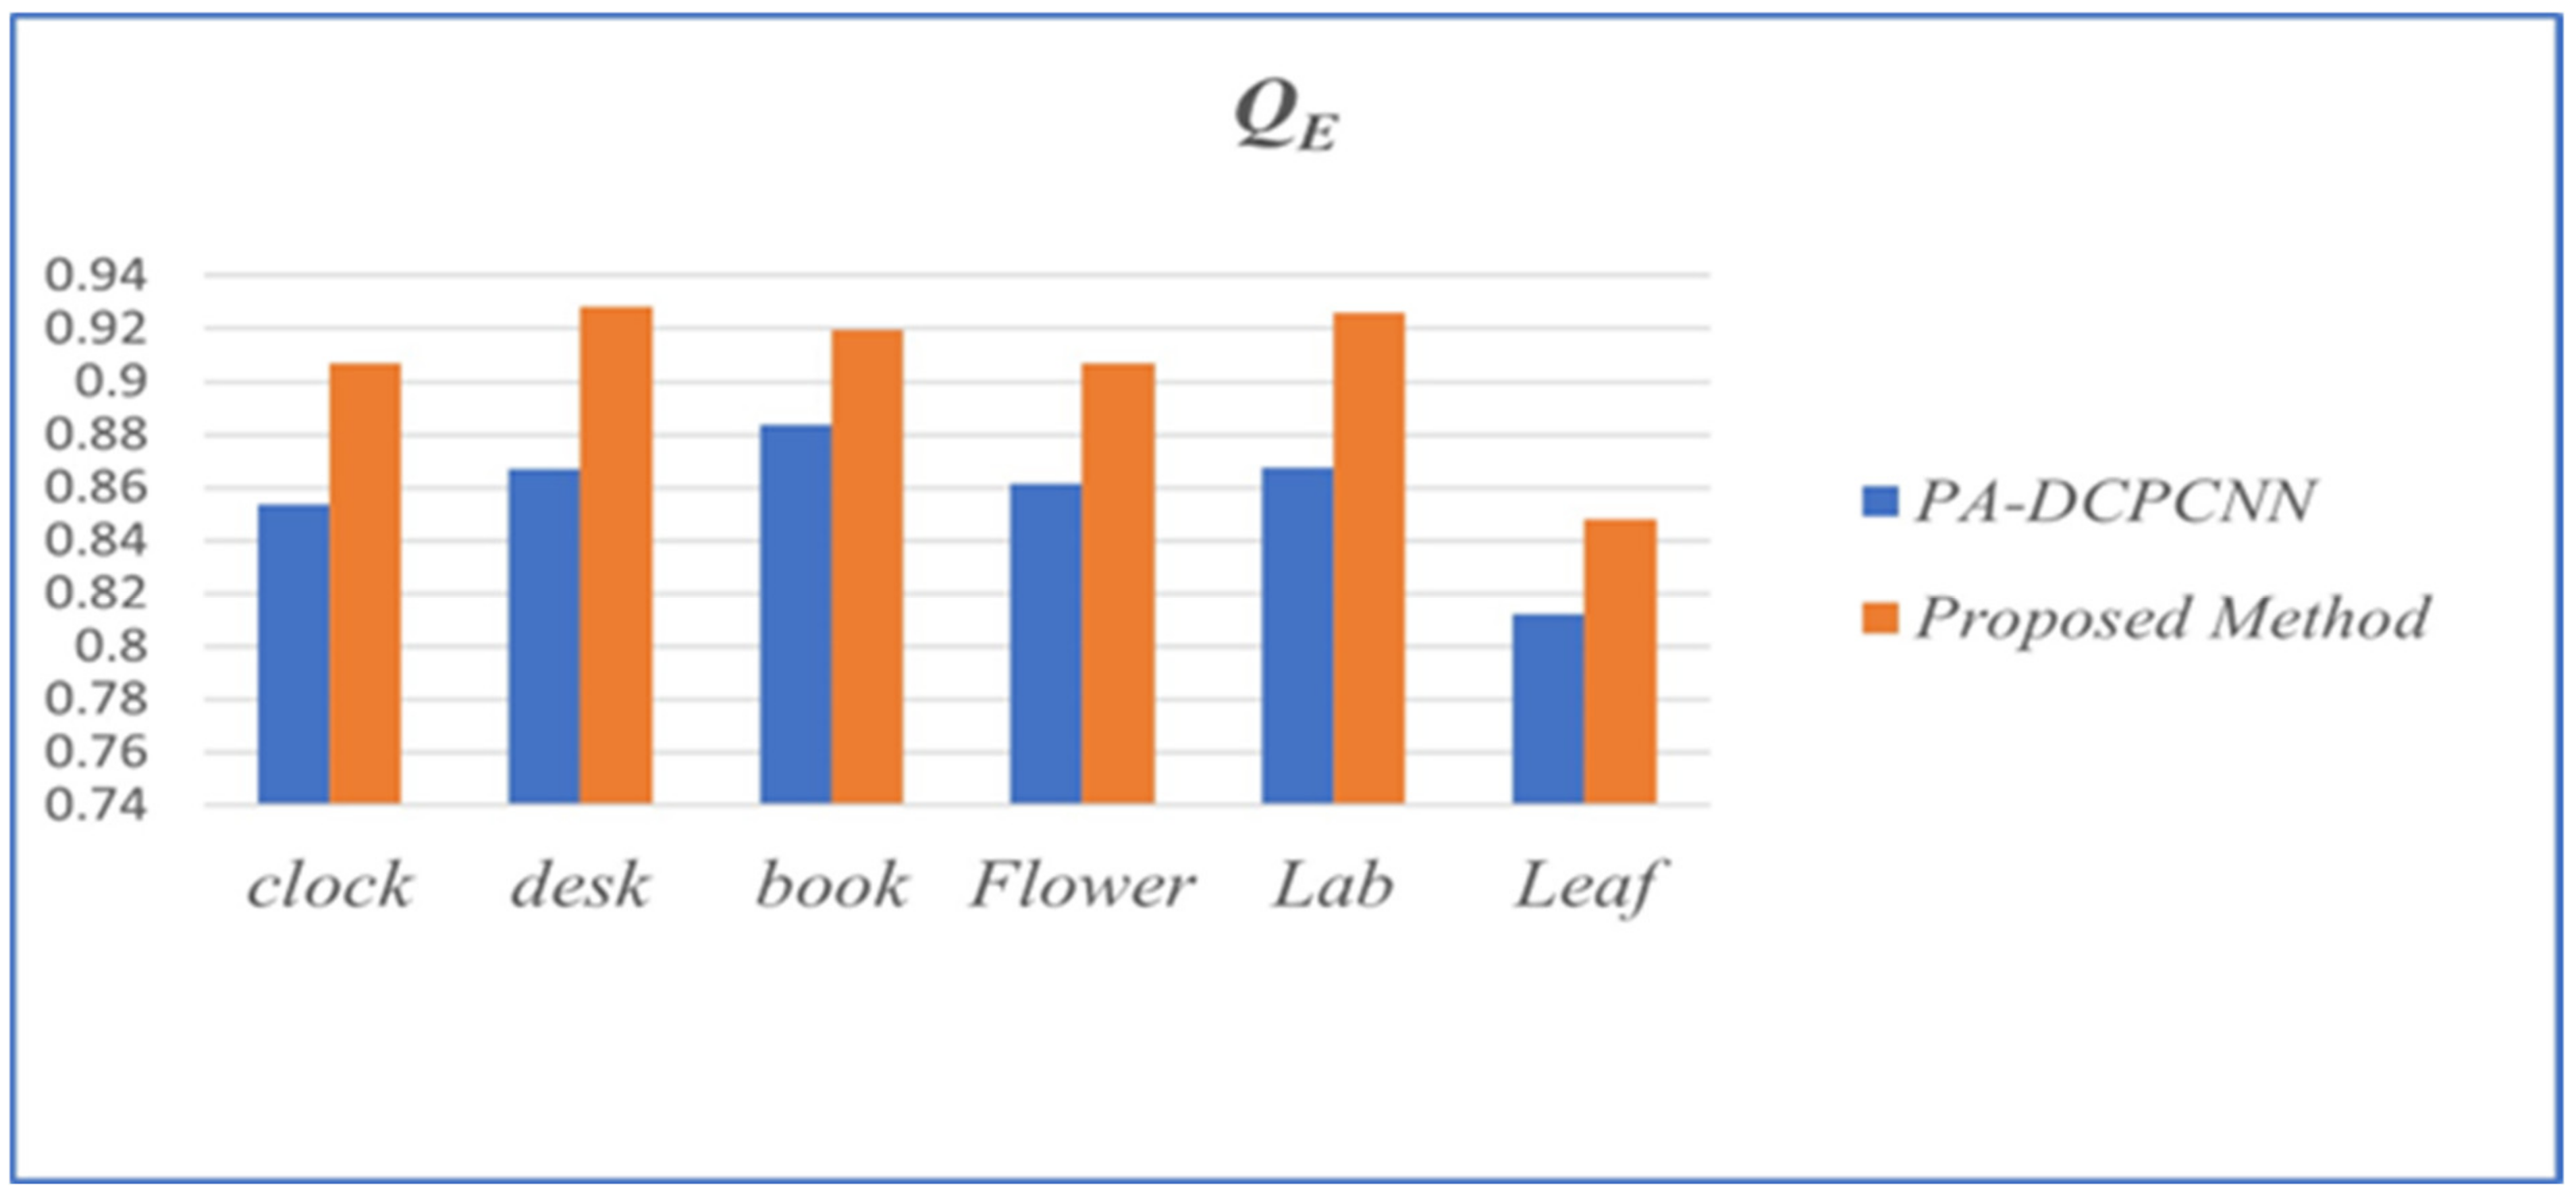
Figure 24.
Performance evaluation of image-fusion techniques in reference to QE.
Figure 24.
Performance evaluation of image-fusion techniques in reference to QE.
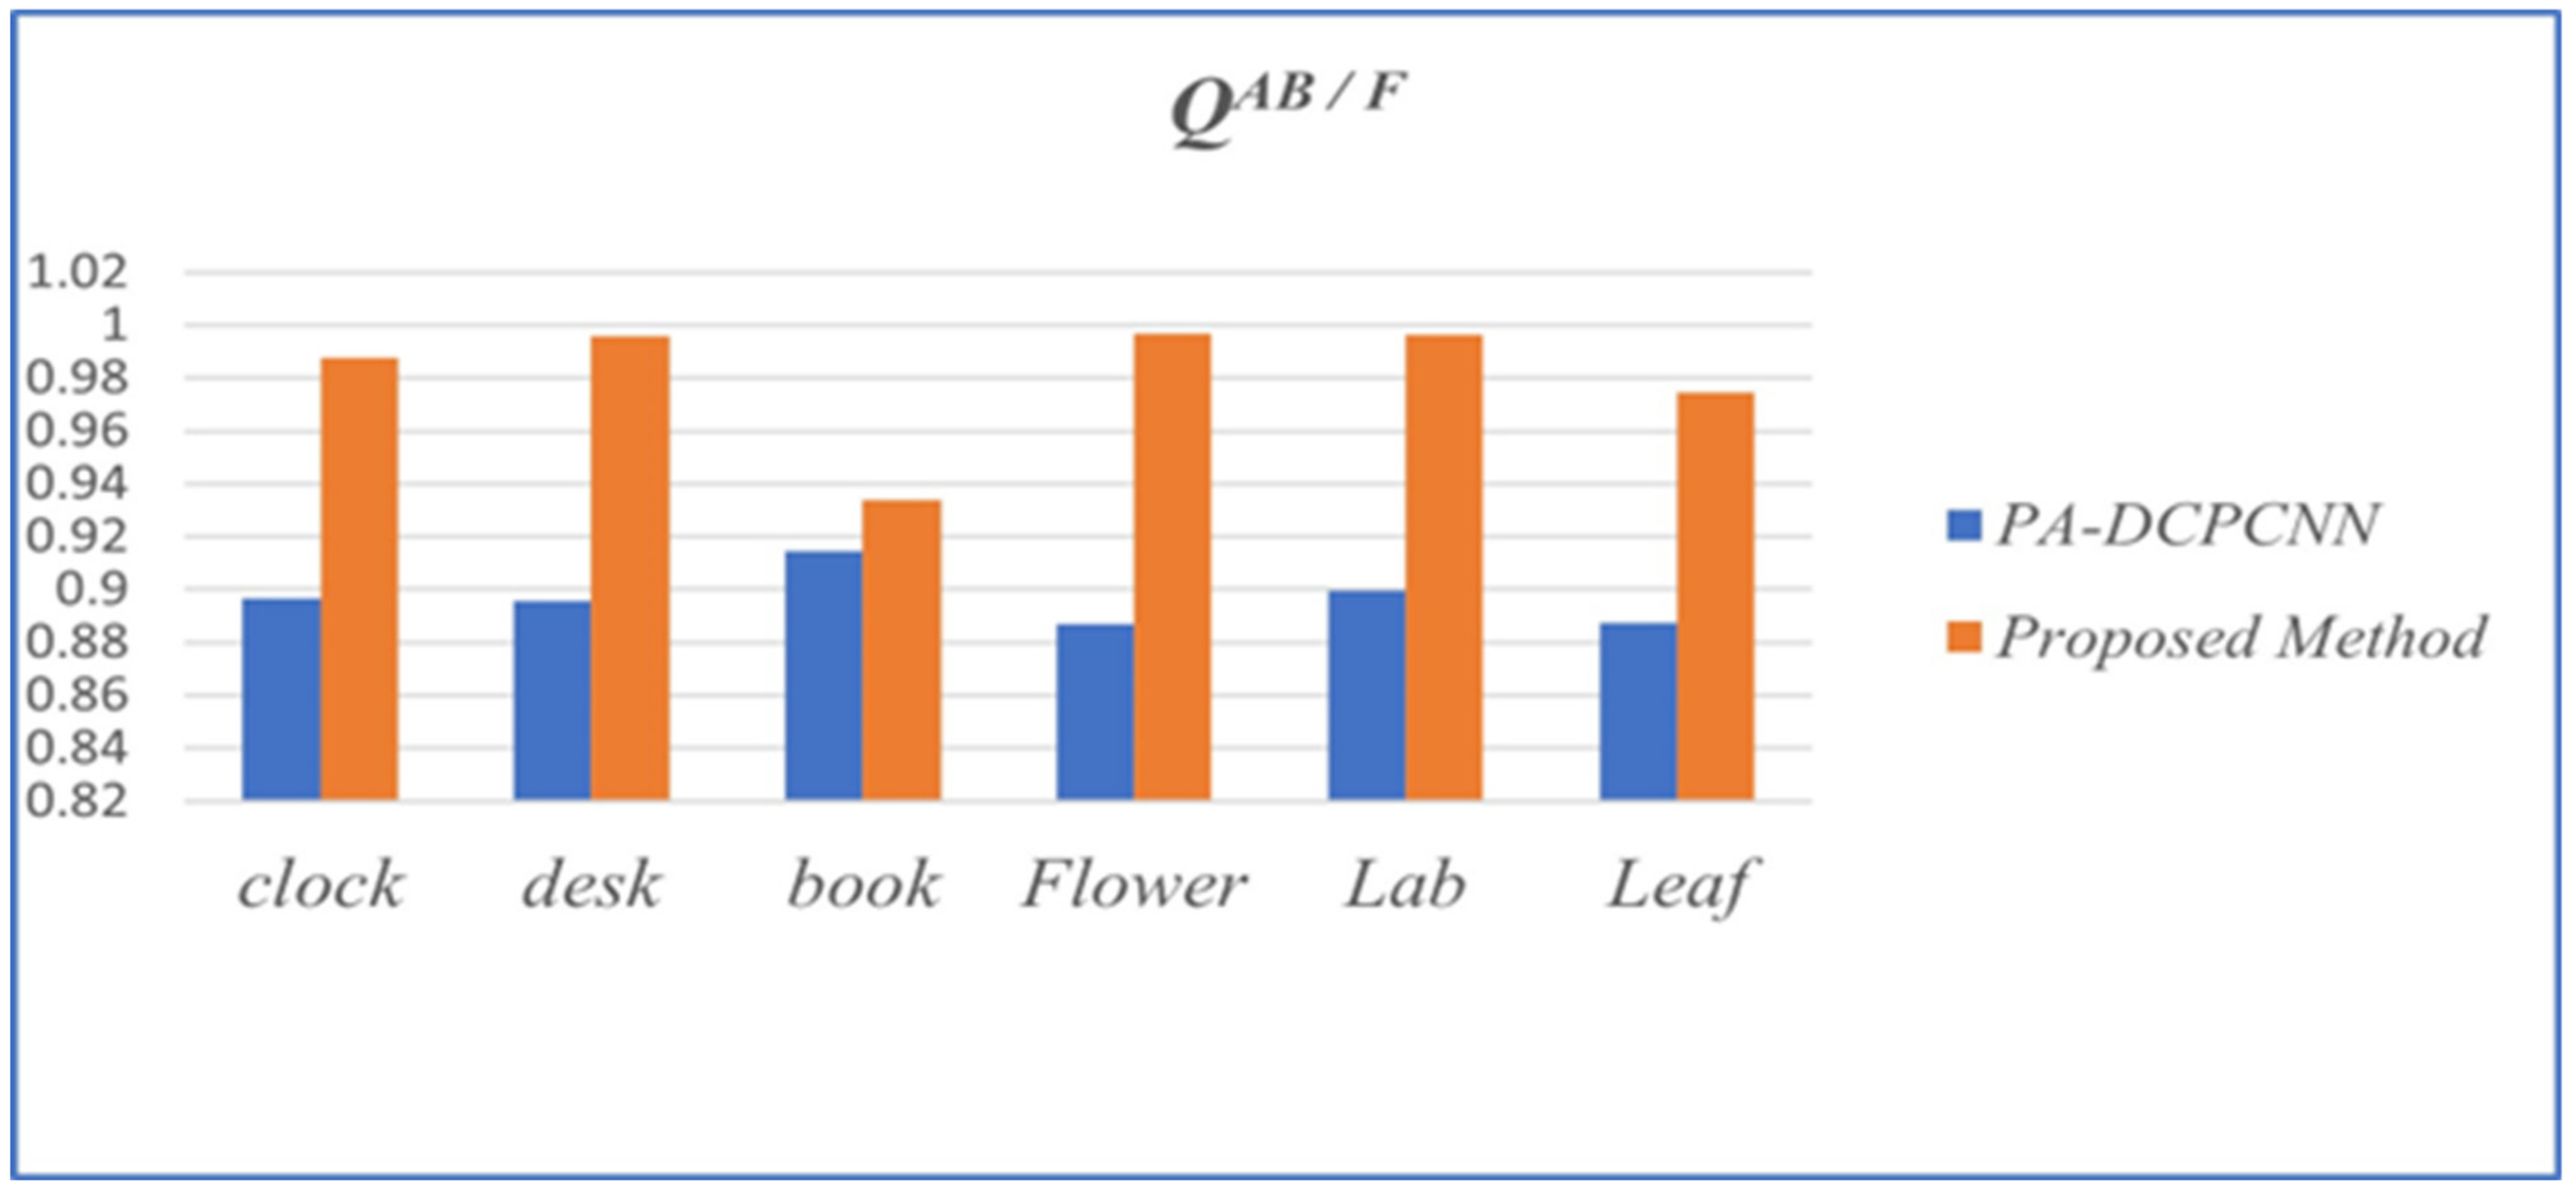
Figure 25.
Performance evaluation of image-fusion techniques in reference to QAB/F.
Figure 25.
Performance evaluation of image-fusion techniques in reference to QAB/F.
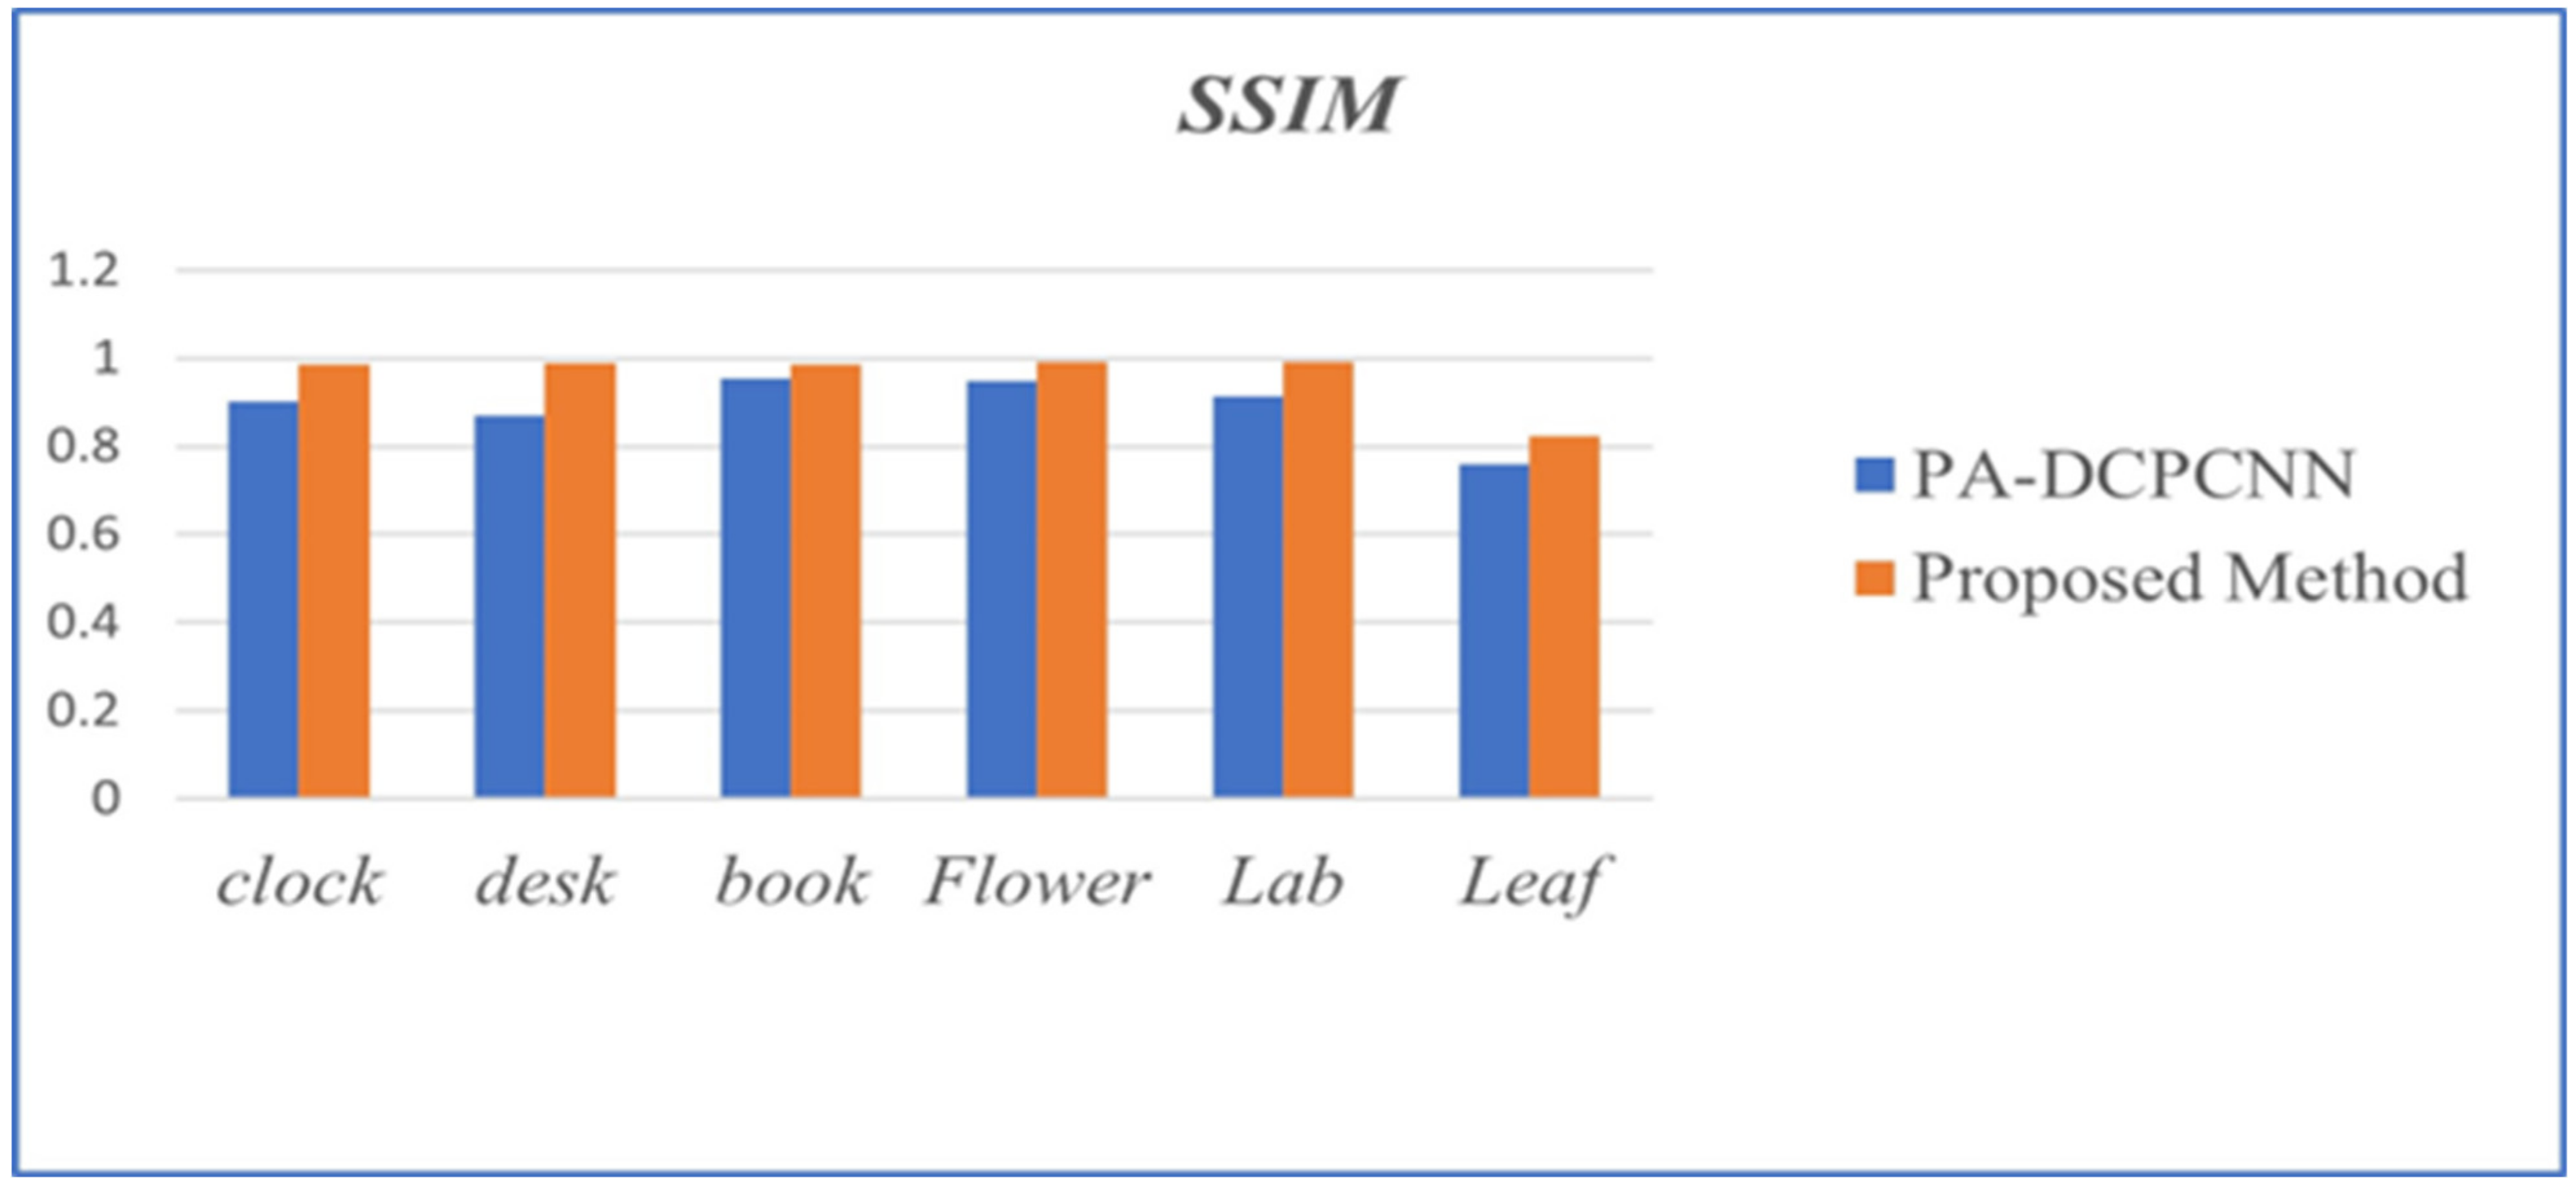
Figure 26.
Performance evaluation of image-fusion techniques in reference to SSIM.
Figure 26.
Performance evaluation of image-fusion techniques in reference to SSIM.
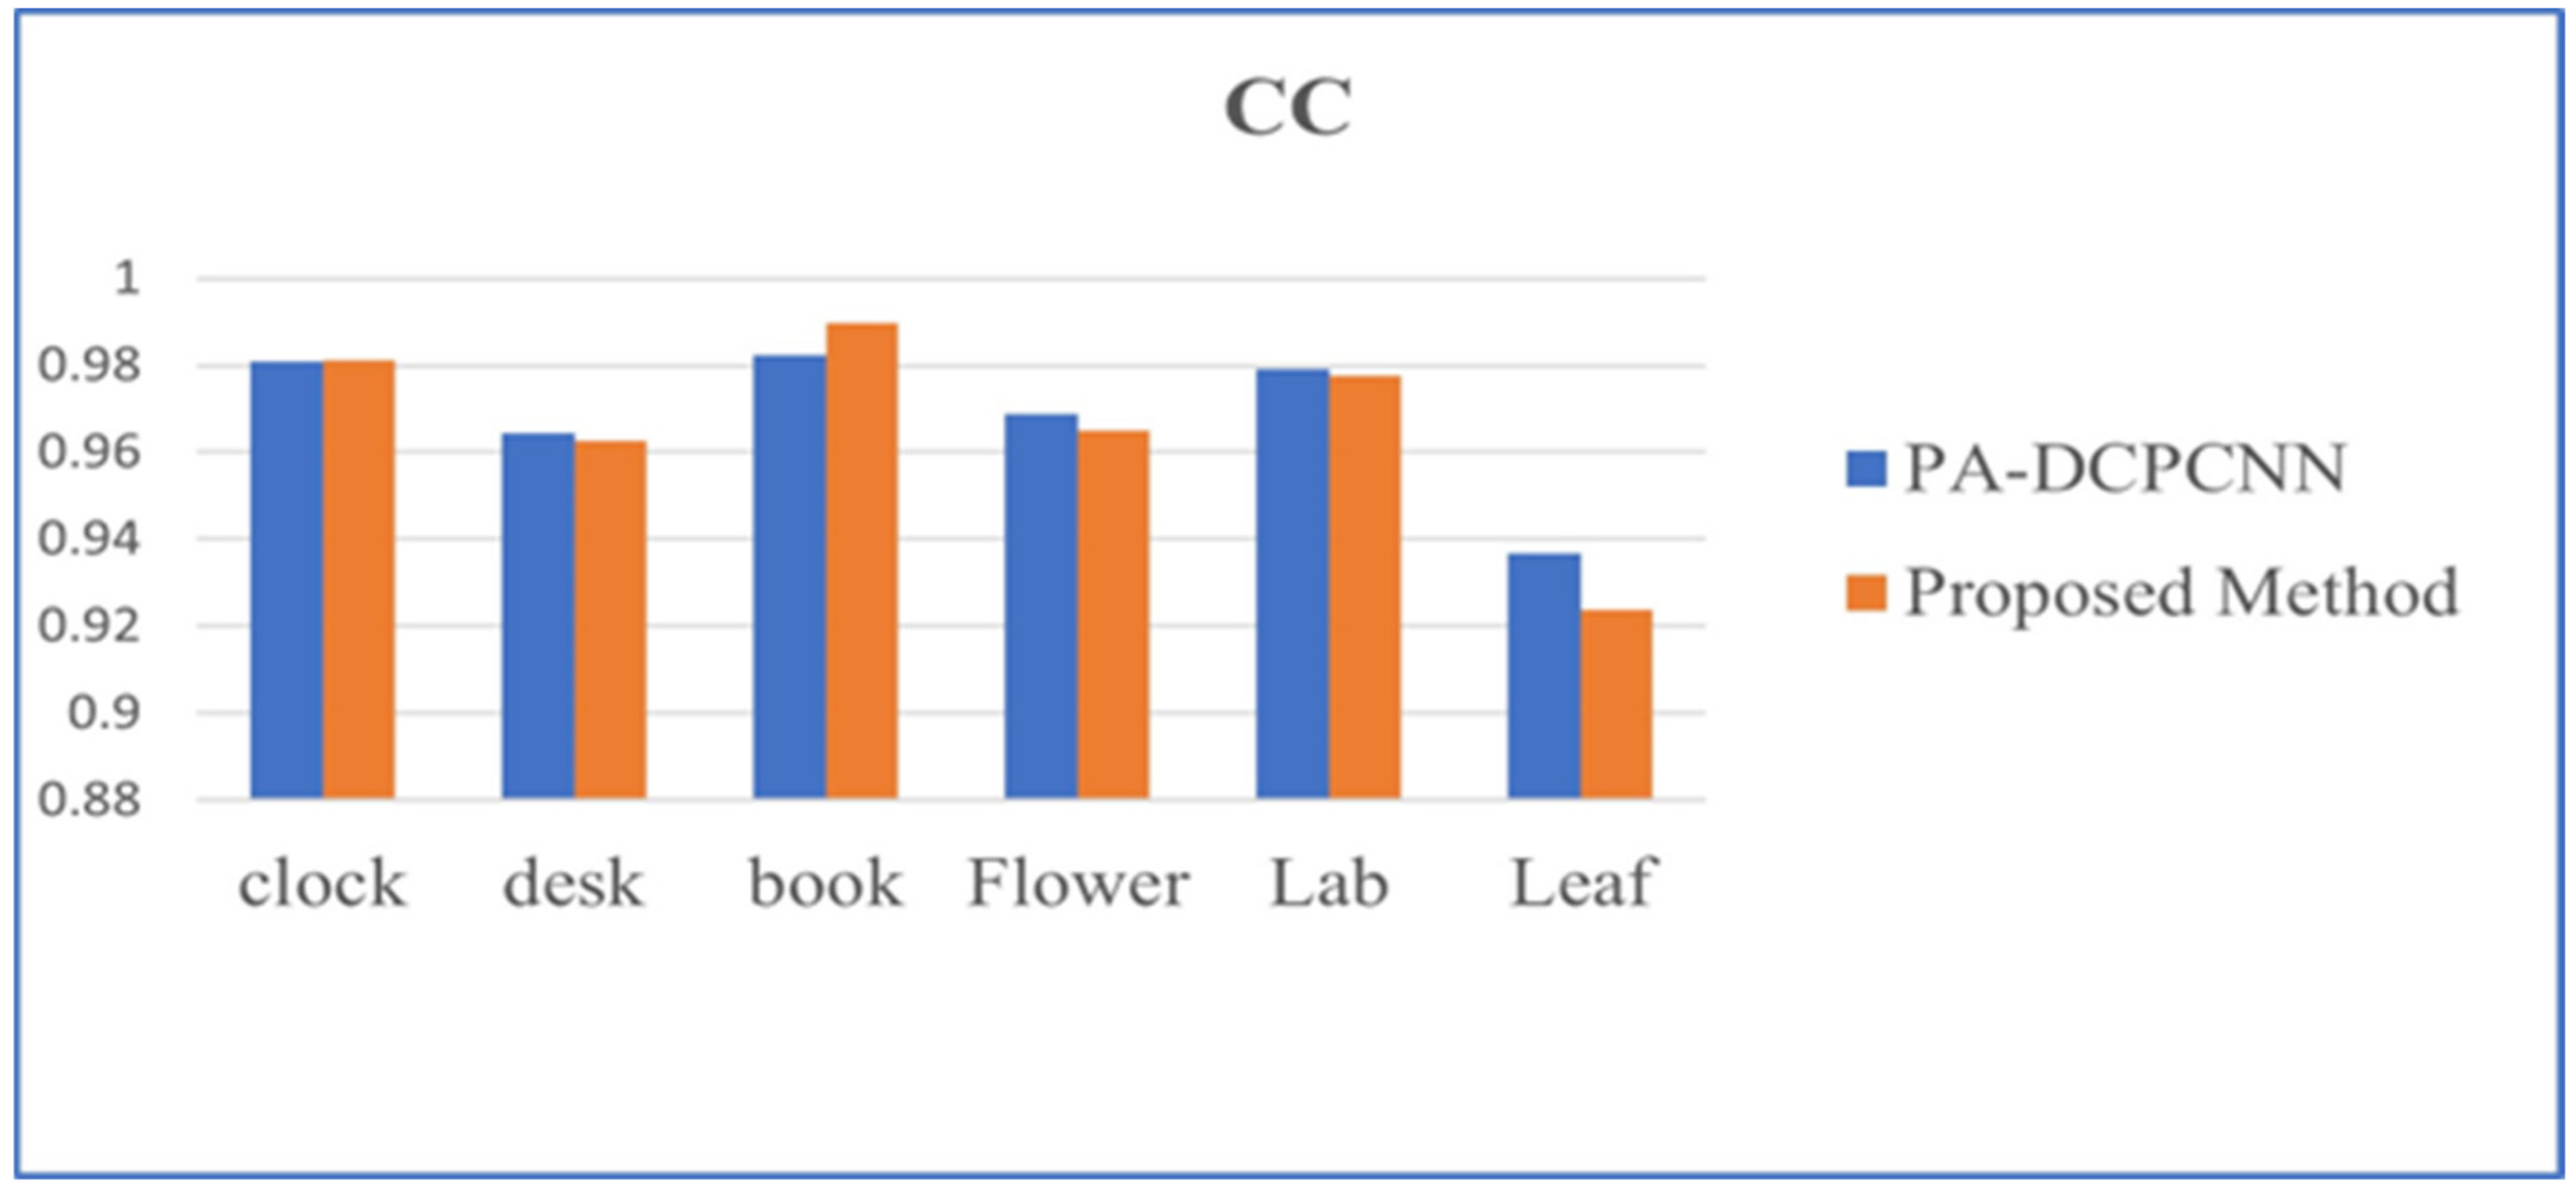
Figure 27.
Performance evaluation of image-fusion techniques in reference to CC.
Figure 27.
Performance evaluation of image-fusion techniques in reference to CC.
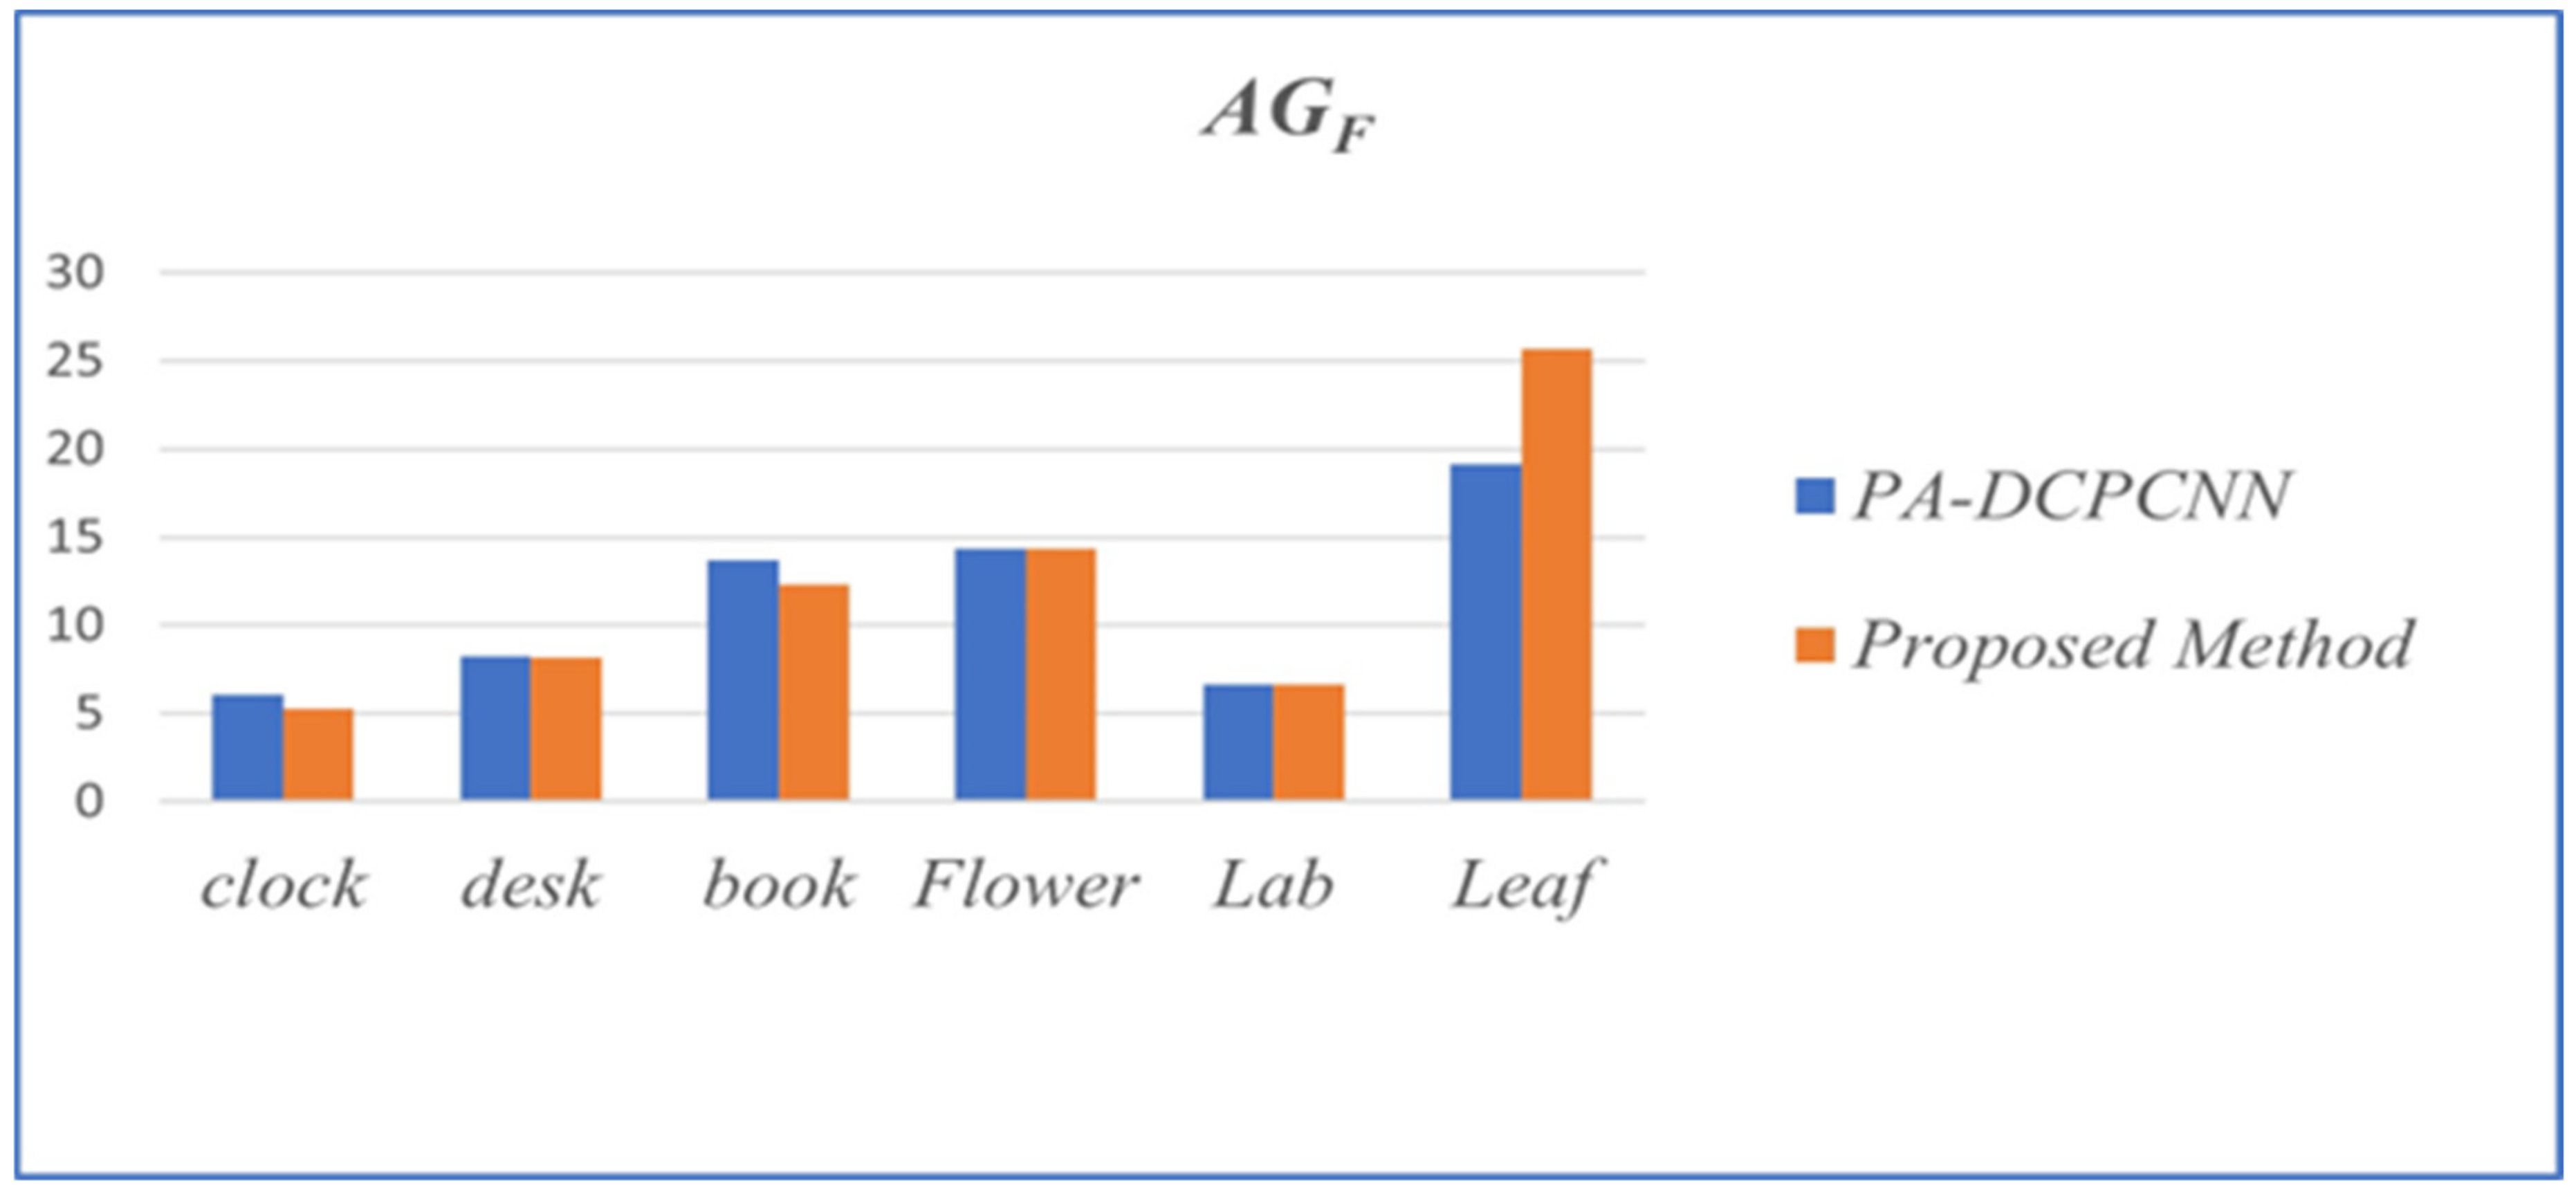
Figure 28.
Performance evaluation of image-fusion techniques in reference to AGF.
Figure 28.
Performance evaluation of image-fusion techniques in reference to AGF.
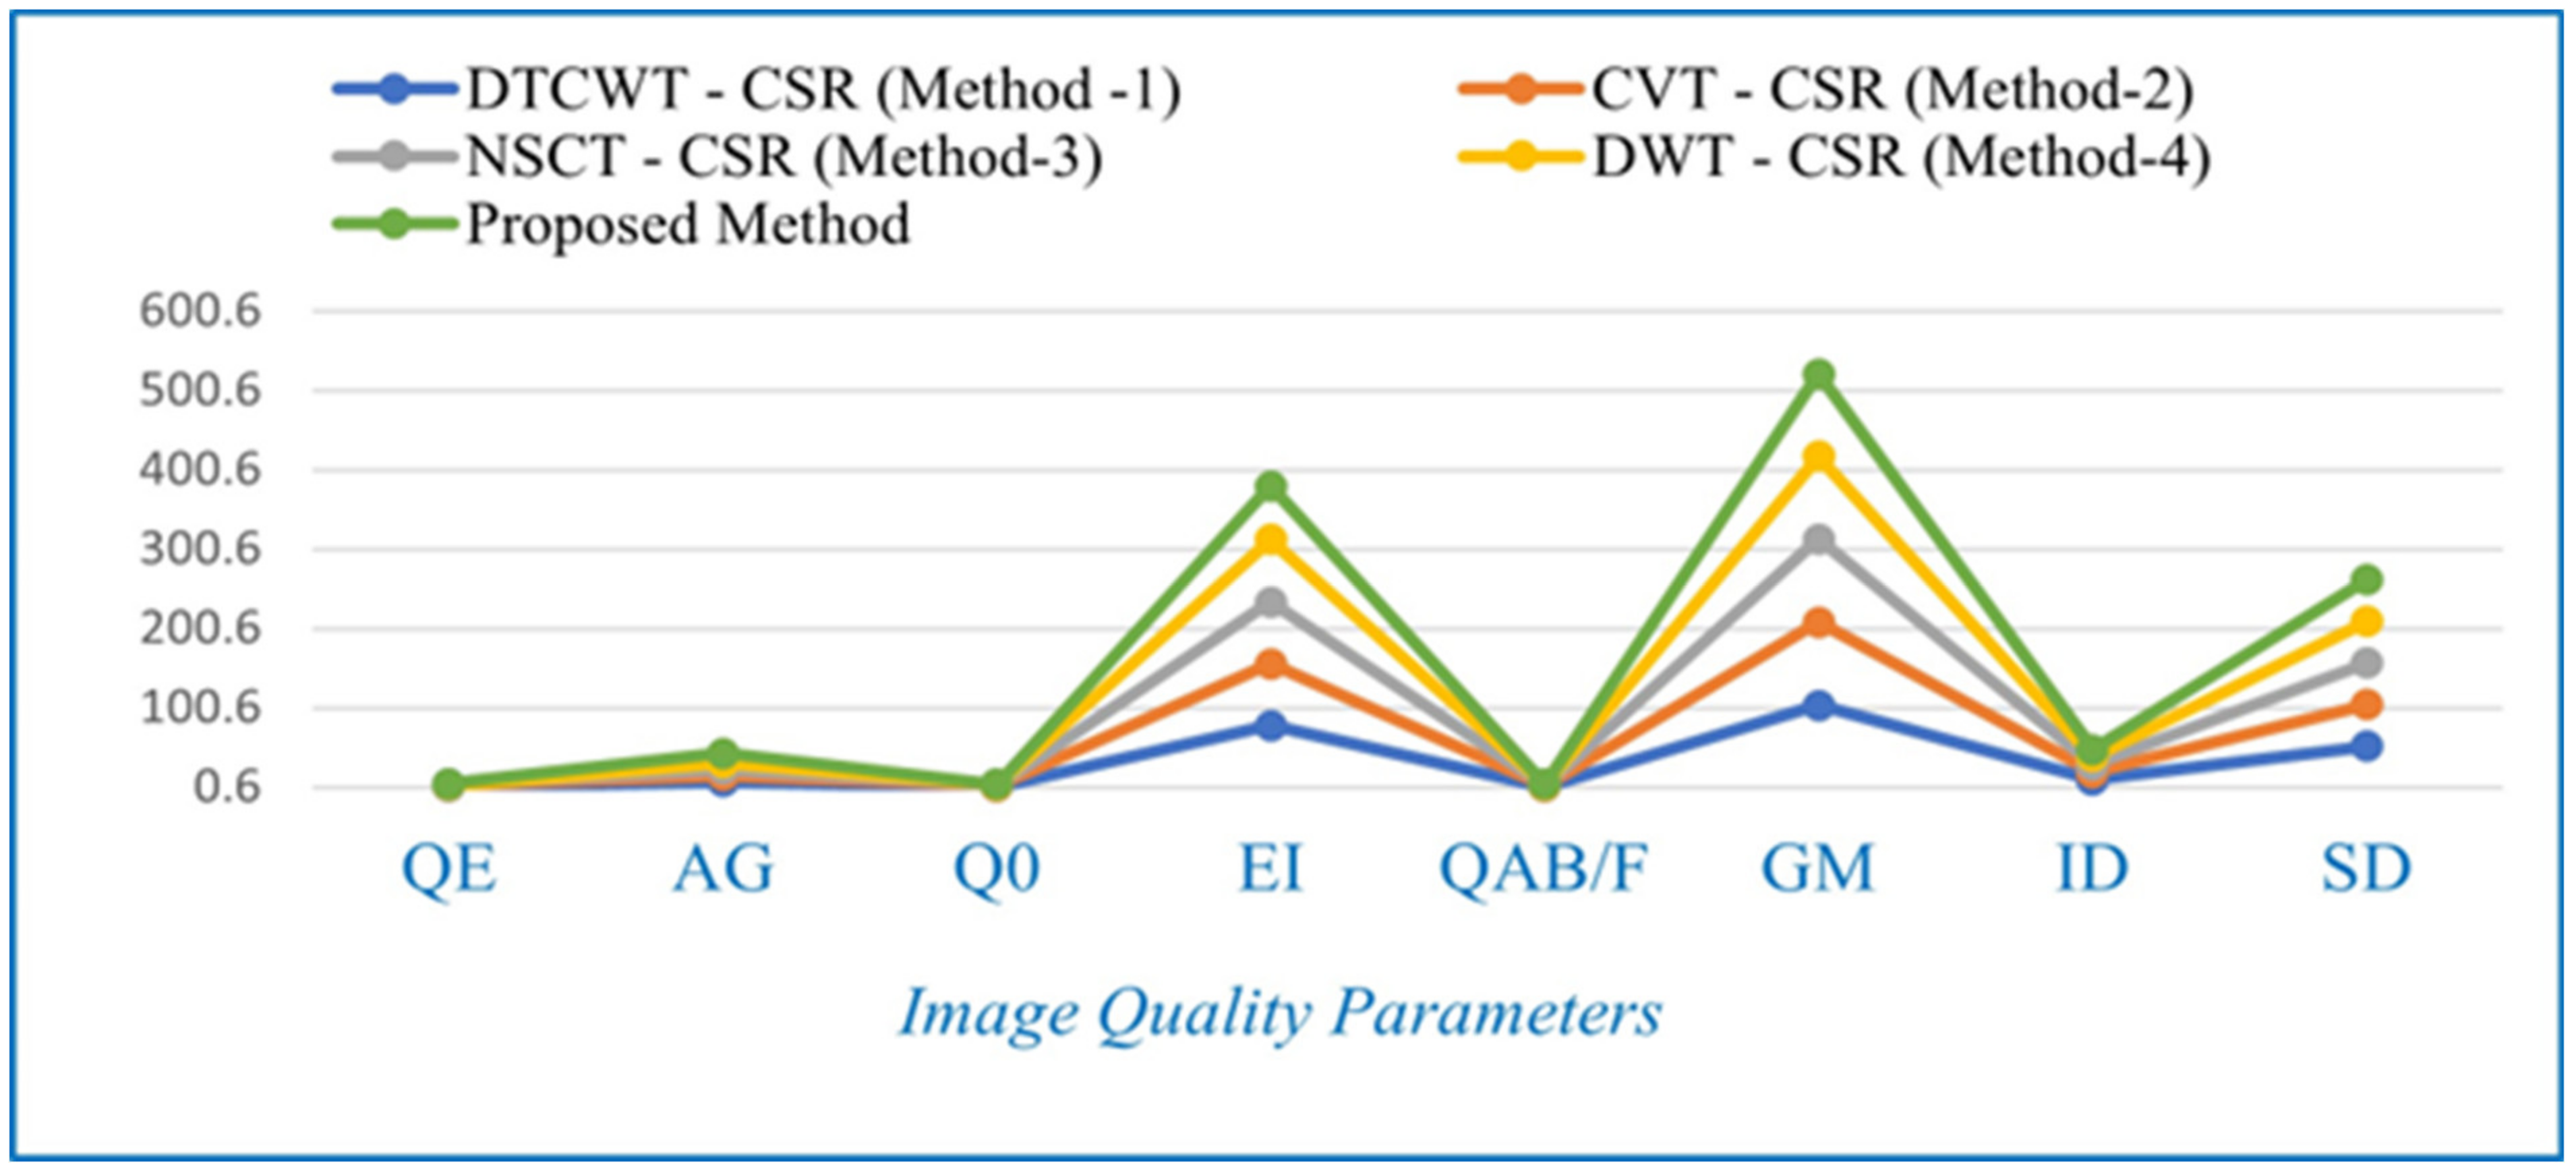
Figure 29.
Evaluation of different fusion methods for different parameters based on them average values.
Figure 29.
Evaluation of different fusion methods for different parameters based on them average values.
Table 1.
The performance of the proposed methodology for a couple of trailing images.
Table 1.
The performance of the proposed methodology for a couple of trailing images.
| Input Images | E(F)
| AG | CC | QAB/F | SSIM | QE | SD | SF | RMSE | PFE | PSNR |
|---|
| Book | 7.4138 | 12.3380 | 0.9898 | 0.9339 | 0.9230 | 0.9196 | 60.1162 | 24.5811 | 9.4618 | 9.2919 | 38.4051 |
| Clock | 7.4149 | 5.2647 | 0.9811 | 0.9874 | 0.9875 | 0.9068 | 51.2894 | 8.5571 | 3.1392 | 2.8573 | 43.1966 |
| Desk | 7.3534 | 8.1919 | 0.9626 | 0.9960 | 0.9895 | 0.9284 | 47.5574 | 15.6158 | 3.3421 | 3.0798 | 42.9247 |
| Flower | 7.2059 | 14.3306 | 0.9651 | 0.9970 | 0.9907 | 0.9069 | 38.8063 | 21.9121 | 4.1448 | 3.7621 | 41.9898 |
| Lab | 7.1336 | 6.6539 | 0.9776 | 0.9962 | 0.9922 | 0.9261 | 47.6548 | 13.0163 | 2.6898 | 2.0455 | 43.8676 |
| Leaf | 7.4216 | 25.6660 | 0.9237 | 0.9745 | 0.8225 | 0.8478 | 46.1852 | 30.8838 | 9.9976 | 8.1367 | 38.1658 |
| Balloon | 7.4656 | 9.8594 | 0.9844 | 0.9996 | 0.9997 | 0.9555 | 48.3050 | 20.8516 | 0.6925 | 0.5604 | 49.7605 |
| Pepsi | 7.1289 | 8.1156 | 0.9823 | 0.9983 | 0.9889 | 0.9475 | 45.5193 | 14.0604 | 2.3387 | 2.1737 | 44.4751 |
| Leopard | 7.4275 | 13.2577 | 0.9898 | 0.9995 | 0.9993 | 0.9524 | 65.7919 | 19.7912 | 0.7950 | 0.7018 | 49.1613 |
| Flowerpot | 7.4446 | 13.3991 | 0.9746 | 0.9943 | 0.9902 | 0.9163 | 52.5217 | 23.6082 | 3.3136 | 2.6395 | 42.9618 |
| Wine | 7.6381 | 35.0934 | 0.9497 | 0.9894 | 0.9278 | 0.8742 | 71.9911 | 51.5020 | 7.3466 | 5.3524 | 39.5039 |
| Craft | 6.4911 | 5.9747 | 0.9634 | 0.9988 | 0.9930 | 0.8880 | 30.8352 | 12.5696 | 1.5758 | 1.0967 | 46.1897 |
Table 2.
The methodologies from the literature have been compared to a number of images.
Table 2.
The methodologies from the literature have been compared to a number of images.
| Images | Moushmi et al. [18] | Aymaz et al. [4] | Li et al. [19] | Proposed Method |
|---|
| RMSE | PSNR | RMSE | PSNR | RMSE | PSNR | RMSE | PSNR |
|---|
| Flower | X | X | 4.99 | 76.22 | 7.84 | X | 4.14 | 41.99 |
| Clock | 4.51 | X | 5.85 | 40.5 | X | X | 3.14 | 43.20 |
| Book | 7.04 | X | X | X | X | X | 9.46 | 38.40 |
| Lab | X | X | X | X | 4.65 | X | 2.69 | 43.87 |
Table 3.
The results and comparisons for clock image ([
20]).
Table 3.
The results and comparisons for clock image ([
20]).
| MIF-Methods | QE | AGF | QAB/F | E(F)
| CC | SSIM |
|---|
| PA-DCPCNN | 0.8538 | 6.0719 | 0.8968 | 7.3854 | 0.9808 | 0.9031 |
| Proposed Method | 0.9068 | 5.2647 | 0.9874 | 7.4149 | 0.9811 | 0.9875 |
Table 4.
The results and comparisons for desk image ([
20]).
Table 4.
The results and comparisons for desk image ([
20]).
| MIF-Methods | QE | QAB/F | E(F) | CC | AGF | SSIM |
|---|
| PA-DCPCNN | 0.8669 | 0.8958 | 7.346 | 0.9644 | 8.215 | 0.8693 |
| Proposed Method | 0.9284 | 0.9960 | 7.3534 | 0.9626 | 8.1919 | 0.9895 |
Table 5.
The results and comparisons for book image ([
20]).
Table 5.
The results and comparisons for book image ([
20]).
| MIF-Methods | SSIM | QAB/F | AGF | CC | E(F)
| QE |
|---|
| PA-DCPCNN | 0.9539 | 0.9145 | 13.7059 | 0.9825 | 7.2957 | 0.8838 |
| Proposed Method | 0.9850 | 0.9339 | 12.3380 | 0.9898 | 7.4138 | 0.9196 |
Table 6.
The results and comparisons for flower image ([
20]).
Table 6.
The results and comparisons for flower image ([
20]).
| MIF-Methods | QE | QAB/F | E(F) | CC | AGF | SSIM |
|---|
| PA-DCPCNN | 0.8617 | 0.8869 | 7.2212 | 0.9687 | 14.3156 | 0.9477 |
| Proposed Method | 0.9069 | 0.9970 | 7.2059 | 0.9651 | 14.3306 | 0.9907 |
Table 7.
The results and comparisons for lab image ([
20]).
Table 7.
The results and comparisons for lab image ([
20]).
| MIF-Methods | SSIM | CC | QAB/F | AGF | E(F) | QE |
|---|
| PA-DCPCNN | 0.9122 | 0.9791 | 0.8996 | 6.6468 | 7.1178 | 0.8675 |
| Proposed Method | 0.9922 | 0.9776 | 0.9962 | 6.6539 | 7.1336 | 0.9261 |
Table 8.
The results and comparisons for leaf image ([
20]).
Table 8.
The results and comparisons for leaf image ([
20]).
| MIF-Methods | QE | CC | E(F) | QAB/F | AGF | SSIM |
|---|
| PA-DCPCNN | 0.8122 | 0.9366 | 7.4064 | 0.8874 | 19.1755 | 0.7587 |
| Proposed Method | 0.8478 | 0.9237 | 7.4216 | 0.9745 | 25.6660 | 0.8225 |
Table 9.
The results and comparisons for Pepsi image ([
4]).
Table 9.
The results and comparisons for Pepsi image ([
4]).
| MIF-Methods | QAB/F | AG |
|---|
| SWT-PCA-without SR | 0.81 | 6.01 |
| SWT-PCA with SR | 0.93 | 15.06 |
| Proposed Method | 0.99 | 8.12 |
Table 10.
The results and comparisons for flowerpot image ([
21]).
Table 10.
The results and comparisons for flowerpot image ([
21]).
| MIF-Methods | Qw | QE |
|---|
| CNN-DWT Domain | 0.9281 | 0.8748 |
| Proposed Method | 0.9211 | 0.9163 |
Table 11.
The average objective evaluation of different techniques on multi-focus image pairs ([
20]).
Table 11.
The average objective evaluation of different techniques on multi-focus image pairs ([
20]).
| Evaluation Metric | QE | QAB/F | AGF | CC | E(F)
| SSIM |
|---|
| PA-DCPCNN | 0.8336 | 0.898 | 15.1203 | 0.9736 | 7.2766 | 0.872 |
| Proposed Method | 0.9098 | 0.9603 | 16.2755 | 0.97 | 7.2607 | 0.9755 |
Table 12.
The average objective evaluation of different techniques on multi-focus image pairs ([
22]).
Table 12.
The average objective evaluation of different techniques on multi-focus image pairs ([
22]).
| MIF-Methods | QE | AG | Q0 | EI | QAB/F | GM | ID | SD |
|---|
| DTCWT—CSR | 0.7433 | 7.6828 | 0.8152 | 77.7976 | 0.7745 | 103.8605 | 9.7117 | 52.0522 |
| CVT—CSR | 0.712 | 7.6924 | 0.8051 | 77.8838 | 0.742 | 104.4969 | 9.732 | 52.1355 |
| NSCT—CSR | 0.7186 | 7.6807 | 0.8327 | 77.7429 | 0.7571 | 104.6126 | 9.7074 | 52.2404 |
| DWT—CSR | 0.6941 | 7.7793 | 0.8168 | 78.6239 | 0.736 | 104.4005 | 9.8798 | 52.323 |
| Proposed Method | 0.9234 | 12.6504 | 0.9202 | 67.7652 | 0.9891 | 104.1459 | 8.6857 | 52.9553 |
Table 13.
The results and comparisons for medical image ([
20]).
Table 13.
The results and comparisons for medical image ([
20]).
| MIF-Methods | E(F) | CC | AGF | SSIM | QE | QAB/F |
|---|
| PA-DCPCNN | 6.4646 | 0.9255 | 14.6353 | 0.7027 | 0.813 | 0.8704 |
| Proposed Method | 4.9199 | 0.9102 | 14.9477 | 0.9601 | 0.8296 | 0.8652 |
Table 14.
The results and comparisons for remote sensing image ([
20]).
Table 14.
The results and comparisons for remote sensing image ([
20]).
| MIF-Methods | E(F) | CC | AGF | SSIM | QE | QAB/F |
|---|
| PA-DCPCNN | 7.195 | 0.5219 | 12.6765 | 0.6679 | 0.6085 | 0.8229 |
| Proposed Method | 7.2322 | 0.4575 | 12.6270 | 0.8009 | 0.7213 | 0.8988 |
Table 15.
Average running time (in seconds) of different methods.
Table 15.
Average running time (in seconds) of different methods.
| Image Pairs | NSCT-PCNN | IM | DSIFT | MST-SR | BF | BRW-TS | PA-DCPCNN | Proposed Method |
|---|
| Gray-Scale | 201.4214 | 6.4078 | 16.0172 | 49.1306 | 1.7311 | 2.4192 | 153.6215 | 0.6790 |


