
A Knowledge Graph Embedding Approach for Polypharmacy Side Effects Prediction

Bio-Intelligence & Data Mining Lab., School of Electronic and Electrical Engineering, Kyungpook National University, Daegu 41566, Republic of Korea
*
Author to whom correspondence should be addressed.
Appl. Sci. 2023, 13(5), 2842; https://0-doi-org.brum.beds.ac.uk/10.3390/app13052842
Submission received: 20 January 2023
/
Revised: 17 February 2023
/
Accepted: 20 February 2023
/
Published: 22 February 2023
(This article belongs to the Special Issue The Development of Novel Integrative Bioinformatics Based Machine Learning Techniques and Multi-Omics Data Integration)
Abstract
:Predicting the side effects caused by drug combinations may facilitate the prescription of multiple medications in a clinical setting. So far, several prediction models of multidrug side effects based on knowledge graphs have been developed, showing good performance under constrained test conditions. However, these models usually focus on relationships between neighboring nodes of constituent drugs rather than whole nodes, and do not fully exploit the information about the occurrence of single drug side effects. The lack of learning the information on such relationships and single drug data may hinder improvement of performance. Moreover, compared with all possible drug combinations, the highly limited range of drug combinations used for model training prevents achieving high generalizability. To handle these problems, we propose a unified embedding-based prediction model using knowledge graph constructed with data of drug–protein and protein–protein interactions. Herein, single or multiple drugs or proteins are mapped into the same embedding space, allowing us to (1) jointly utilize side effect occurrence data associated with single drugs and multidrug combinations to train prediction models and (2) quantify connectivity strengths between drugs and other entities such as proteins. Due to these characteristics, it becomes also possible to utilize the quantified relationships between distant nodes, as well as neighboring nodes, of all possible multidrug combinations to regularize the models. Compared with existing methods, our model showed improved performance, especially in predicting the side effects of new combinations containing novel drugs that have no clinical information on polypharmacy effects. Furthermore, our unified embedding vectors have been shown to provide interpretability, albeit to a limited extent, for proteins highly associated with multidrug side effect.
1. Introduction
Polypharmacy refers to the simultaneous use of multiple medications to treat health conditions. The concurrent use of multiple drugs often increases the risk of adverse drug reactions due to their overlapping or interacting effects. For example, certain drug combinations can cause abnormal symptoms, such as dizziness, depression, confusion, and hallucinations [1]. Occasionally, these side effects are severe enough to require hospitalization [2,3]. Therefore, the prediction of the negative effects of polypharmacy as well as appropriate preparation for such effects are of utmost importance.
In order to predict the side effects or drug–drug interactions of multidrug administration, computational techniques have been widely used because physical testing of all types of drug combinations is impractical. To this end, different types of data such as drug molecular structures [4], drug–protein interactions [5], and transcriptome data [6] were employed to train models. Moreover, some recent studies [7,8,9,10,11,12,13,14,15,16] utilized knowledge graphs constructed from various biomedical data to better predict multidrug side effects. These data types primarily include drug–protein, protein–protein, drug–pathway, drug–disease, and tissue–protein interactions. Each node in the knowledge graph can represent a drug, protein, pathway, cell, chemical substructure, or disease. Edges between nodes can represent different types of interactions between all biological entities represented by the nodes.
In the previous studies employing knowledge graphs [8,11,13,14,15,16], all types of drug-protein interactions are treated as a single edge type without subtype. Similarly, protein–protein interactions were treated as a single type without distinction between different subtypes. Despite such a simple graph structure, the models showed good performance in predicting multidrug side effect. Recently, several studies [10,15] have employed more complex graph structures that distinguish node or edge subtypes. For example, Yu et al. [10] used a graph that includes 11 node types (such as drugs, proteins, pathways, gene ontology, and disease) and 24 edge types. However, the effectiveness of complex graphs were not shown on predictive performance. Rather, it is possible that very complex graphs lead to performance degradation of the model due to learning many parameters defined for subtype.
In order to make it easier manipulating knowledge graphs in real-world applications, many attempts have been made so far to embed the components of knowledge graphs into low-dimensional vector spaces [17,18]. For example, some studies [10,14,16] have used graph convolution networks to refine a node’s embedding vector by simply initializing the node embedding vector and repeatedly propagating it to neighboring nodes. On the other hand, in studies such as TransE [19], TransR [20], ComplEx [21], and DistMult [22], nodes were expressed as deterministic points in a vector space and the relationships between nodes were taken as operations in the vector space. Methods similar to these were applied in Yao et al. [8] and Novácek et al. [11] for polypharmacy side effect prediction. Alternatively, random walks-based algorithms such as node2vec [23] and edge2vec [24] were developed to learn low-dimensional node representations in graphs. The node2vec has been used for comparative purposes in several related studies for predicting multidrug side effects [7,11,14]. In recent years, hypergraphs in which hyperlinks can connect two or more nodes are being explored in order to represent complex higher-order relationships [25,26]. Recent works on the use of hypergraphs for biological network analysis is presented in [27], but its potential has not yet been fully exploited for multidrug side effect prediction.
Although several studies [7,8,9,10,11,12,13,14,15,16] have successfully used knowledge graphs to predict multidrug side effects and improve model predictive performance or interpretability, they have not fully utilized some of the available information. For example, they mainly focused on learning the relationships between drug–drug characteristics and side effect occurrences into models. Therefore, the relationships between single drug characteristics and side effect occurrences were not considered important. In addition, only relationships between neighboring nodes around target drugs have been usually explored, while other relationships over the graphs were often ignored. If two nodes are not so close to each other, but there are numerous paths between them, they may have a strong relationship. Hence, it seems worthwhile to consider the relationships between drugs and all other biological entities (e.g., proteins) over the graphs, regardless of their closeness.
In this study, we aimed to improve the generalizability of a multidrug side effect prediction model by embedding the components of the knowledge graph constructed from drug–protein interactions and protein–protein interactions into a unified vector space and using these embedding vectors for model training. We also further exploited the information on single drug adverse events and the relationships between drugs and all other nodes (i.e., proteins). Our main contributions are summarized as follows:
- We introduce a unified embedding approach to convert all graph nodes (representing single or multiple drugs or proteins) into a single embedding space. Side effects caused by a single drug often contribute to multidrug side effects in polypharmacy. This single drug side effect information can help predict the side effects of various multidrug combinations. Herein, we proposed a unified embedding approach that enables the learning of single drug side effect information along with that of multidrug combinations. In this approach, all biological entities represented by nodes in the knowledge graph are mapped to their corresponding n-dimensional vectors that exist in the same embedding space.
- We employ unified embedding vectors to leverage the side effect data related to single drugs as well as multidrug combinations. The embedding module in the proposed method generates the same n-dimensional vector for any given single or multidrug combination, regardless of the number of its constituent drugs. Thus, predictive model training is possible using data from single as well as multidrug combinations (labeled on the side effects that have occurred) represented by unified embedding vectors in the same latent space.
- We utilize relationships between nodes (including distant nodes) for model regularization. Another feature of the proposed model is its ability to utilize the relationships between drugs and all other biological entities shown over the knowledge graph. In particular, for each single or multidrug combination, we computed the values of its connectivity strength to proteins, which indicate how closely its constituent drugs are related to each protein in the graph. We then used these connectivity strengths to regularize the model.
- We use virtually created multidrug combinations for model regularization. To mitigate the risk of overfitting to a limited number of drug–drug samples labeled with side effects, we produced virtual multidrug combinations (actually virtual drug pairs) created with all possible pairs of single drugs and then used them for model regularization. Herein, a virtual multidrug is a combination of available single drugs with no label information. This allows our model to reflect the characteristics of all possible drug combinations as well as those of labeled drug–drug samples during the embedding process.
- We provide the interpretability of proteins significantly associated with multidrug side effects. The embedding vectors of multidrug combinations and proteins represented in a unified vector space enable us to identify proteins that are more influential in producing specific side effects. This can be achieved through the identification of proteins that are relatively close to multidrug combinations associated with a specific side effect, based on connectivity strengths between multidrug combinations and proteins in the embedding space.
2. Methods
Our proposed method is based on knowledge graphs in which each drug node is connected to at least one protein. The method projects all single and multidrug combinations onto the same embedding space (Figure 1) and then utilizes the obtained embedding vectors for polypharmacy side effects prediction. This method consists of the following three steps. First, all nodes (of single drugs and proteins) in the graph are embedded into their corresponding n-dimensional vectors using node2vec algorithm, producing initial embedding vectors for single drugs and proteins. Second, a multidrug combination is treated as a node in the graph, and the hypothetical nodes for multidrug combinations are added to the original node set. Then, the embedding vectors of all nodes included in the expanded node set are produced (or reproduced) using initial embedding vectors as inputs to a unified embedding module. Consequently, single drugs, proteins, and multidrug combinations are represented by n-dimensional embedding vectors that exist in the same latent space. Finally, the prediction module is trained with labeled data of single drugs and multidrug combinations. During this process, all parameters of the embedding and prediction modules are optimized to minimize the predefined loss function while retaining the properties of the node relationships shown in the knowledge graph as much as possible.
2.1. Initial Embedding
Each node in the knowledge graph was fed into the node2vec [23] method, which generated a 128-dimensional embedding vector. The vector size is then normalized to 1. These vectors are hereafter referred to as the initial embedding vectors. We selected all hyperparameters of the node2vec algorithm, including the number of dimensions, as used in the original study.
2.2. Unified Embedding
In this step, the initial embedding vectors of the original graph nodes were used as inputs for multidrug combinations or single drugs or proteins to the embedding modules of the proposed model. This was performed to represent both hypothetical multidrug and original graph nodes in the same embedding space because the initial embedding vectors obtained in the previous step were produced only for nodes in the original knowledge graph, which correspond to single drugs or proteins. In other words, to project both multidrug and single drug nodes into a unified embedding space, all original graph nodes were retrained, whereas the hypothetical multidrug nodes were newly trained. We considered the relationships between original nodes for newly embedding both multidrug and original nodes. The resulting embedding vectors were finally normalized to the size of 1. Consequently, 256-dimensional vectors corresponding to all single drug, multidrug, and protein nodes were obtained in the unified embedding space.
2.3. Model Architecture
Figure 2 shows the overview of the proposed model for multidrug side effects prediction. This model is mainly divided into two parts: embedding and prediction modules. For a given multidrug combination, the initial embedding vectors of its constituent drugs are given as input to the embedding module. Here, the multidrug combination includes a drug pair as well as single drug to consistently control single and multidrug inputs, i.e., a single drug is considered a multidrug combination consisting of one drug. Theoretically, all multidrug input data can be fed into the embedding module without limiting the number of drugs constituting the multidrug combination. However, owing to the limitations of the present labeled data, we could test only multidrug combinations comprising up to two drugs. As the output, one unified embedding vector was produced for a given multidrug combination, regardless of the number of constituent drugs. The unified embedding vector of a multidrug combination reflects its associated side effect information and connectivity strengths from its constituent drugs to related proteins. This embedding vector is regarded as a multidrug embedding vector.
The detailed description of the embedding module is as follows. It consists of a fully connected neural network with 1 hidden layer, where the hidden layer has 384 dimensions. Given a multidrug, the output vectors of the hidden layer for constituent drugs were summed to combine individual drug characteristics. The activation function of the hidden layer was LeakyReLU [28], whereas that of the output layer was hyperbolic tangent. The summed vector was then normalized to 1. Herein, all constituent drugs of a given multidrug do not have separate learning parameters; instead, they share the same parameters.
The prediction module receives a multidrug embedding vector as Input and produces prediction scores for targeted side effects as output. This module is a fully connected layer without hidden nodes, where a sigmoid function was used as the activation function. Compared with the embedding module, the prediction module has a simple structure because our model was designed to learn drug side effect information more in the embedding module than in the prediction module. This allows interpretability of side effects using the embedding vectors.
2.4. Learning Objective and Loss Function
The common goal of learning in the embedding and prediction modules was to predict the side effect label as accurately as possible. For this purpose, the occurrences of side effects induced by multidrug combinations were used as labels for learning. To calculate the learning loss, we used a binary cross entropy function. Another goal of learning in the embedding module was to appropriately reflect the connectivity strength (cs) between a hypothetical multidrug node and its related proteins shown in the knowledge graph. To this end, we assumed that the cs between the multidrug combination md and the protein p in the graph is the largest cs value between the constituent drugs of md and protein p in the initial embedding space. It is to place importance on and preserve the information about the strongest influence that md can have on p. Specifically, the cs between md and p was calculated as follows:
Initial embedding space:
Unified embedding space:
where is the cosine similarity, is the initial embedding vector for a node a, d is a drug constituting md, and is a unified embedding vector representing x.
The final loss function of the proposed model is thus given as follows: where is a set of labeled multidrug combinations, is a set of unlabeled virtually generated multidrug combinations, BCE is the binary cross entropy loss function, is the list of the actual labels of md, is a list of prediction scores for md, is a hyperparameter, and p is a protein set. is the mean squared difference of connectivity strengths from md to proteins in the initial and unified embedding spaces, which was calculated by
Here, MSD serves as a regularized term for calculating the final loss. In the previous expression, indicates the role of tuning the impact of the regularization term. To strengthen the generalizability of the prediction model, virtually generated multidrug combinations were additionally considered for regularization. All embedding vectors of multidrug combinations (including single drugs), virtual multidrug combinations, and proteins were obtained by minimizing the loss function. Thus, these vectors are present in the same embedding space. The learning process for our proposed model is summarized in Algorithm 1.
| Algorithm 1. Pseudo code for training the proposed model |
| G: The knowledge graph consisting of drug and protein nodes. Md: A multidrug (i.e., a set of one or more drugs). : Training data of multidrug combinations labeled with side effects. : Training data of multidrug combinations virtually generated. : An initial embedding vector of a node a. : A set of initial embedding vectors for given nodes. : A unified embedding vector of a multidrug md. : A set of side effect labels of a multidrug md. EmbNN: Neural networks of embedding module. PredNN: Neural networks of prediction module. Function EmbModule (x) Ifx is a multidrug do ElseIf x is a protein do ← EmbNN() EndIF Return normalize_vector_size() EndFunction Function get_loss_by_connectivity_strength(,) loss ← 0 For each protein p do ← (, EmbModule()) loss ← loss + EndFor Return loss EndFunction (, ) ← get_initial_embedding_vectors_for_all_nodes(G) Initialize the weights of EmbNN and PredNN randomly. Set as a positive value. For 1 to Iterations do loss ← 0 P ← Randomly select 1000 among all proteins. For each multidrug md do ← EmbModule() If md ∈ do ← PredNN () loss ← loss + get_loss_by_binary_cross_entropy(,) EndIF loss ← loss + *get_loss_by_connectivity_strength(,) EndFor Adjust the weights of EmbNN and PredNN to reduce the loss. EndFor |
3. Experiments and Results
3.1. Dataset
For this study, we used the publicly available data provided by Zitnik et al. [14], which contains information on drug–protein and protein–protein interactions as well as drug–drug and single drug side effects. We selected 284 drugs that had at least one target protein and 19,089 proteins that were either related to these drugs or interacted with at least one other protein; this is because information on the relationship between each drug and protein is essential for learning our proposed model. After preprocessing to remove duplicates from the data, we obtained 18,690 drug–protein and 715,612 protein–protein interactions. Drug–drug interactions were not utilized for constructing the graph. Thus, the resulting knowledge graph included single drugs and proteins as nodes and protein–protein and drug–protein interactions as edges. For the labeled data of multidrug combinations, we used 14,247 pairs of previously selected 284 drugs, in which each drug pair was labeled with 1308 side effects. For single drug data, only 244 of 284 drugs were labeled with 1308 side effects.
3.2. Experimental Setup
A model for predicting multidrug side effects was trained using the labeled data of drug pairs and single drugs. In addition, virtually generated drug pairs from the 284 drugs were employed without labels to regularize the model. For model training, Adam optimizer [29] was used at the learning rate of 0.01. The Hu method [30] was used to set the initial values of learning parameters. The learning was stopped if performance on validation data did not improve after 500 consecutive epochs.
As targeted side effects, we selected 200 side effects that were used chosen by Yu et al. [10]. The prediction performance was measured for each targeted side effect s, while drug pairs containing single drugs that cause the targeted side effect s were excluded from the test data, as done in a previous study [14]. To handle the data imbalance issue between positive and negative samples in test data, we randomly selected as many negative drug pairs as positive drug pairs for each side effect.
For evaluation, we considered two types of drug pair inputs, termed DPU and non-DPU, respectively, and conducted experiments for each of term separately. The DPU and non-DPU inputs are defined as follows:
- DPU: Drug pair including drugs unused in labeled multidrug combinations included in training data.
- Non-DPU: Drug pair consisted of only drugs used in labeled multidrug combinations included in training data.
The prediction performance for DPU inputs indicates how well the model predicts side effects for drug pairs including new drugs for which multidrug clinical information is unknown. Thus, this performance will be of interest to clinicians who want to use new drugs in combination with other drugs.
3.3. DPU Side Effect Prediction
Data splitting procedure: We split all given drug pair samples labeled as adverse events into training, validation, and test datasets to evaluate prediction performance for DPU inputs. Specifically, single drugs were first divided into five groups for five-fold cross validation. Then, at each iteration, labeled drug pairs consisting only of drugs belonging to four groups were used as training data, while labeled drug pairs containing at least one drug belonging to the remaining group were divided into half for validation and half for test data. Moreover, virtual drug pairs generated based on the given 284 drugs were added to the training data to include all possible multidrug combinations that were not originally present in the training data.
Performance evaluation: The performance of the proposed model was evaluated in two aspects. The first aspect relates to the effectiveness of additionally using labeled single drug data to train the model, and the second aspect relates to the appropriate range of data used for regularization when training the model. As an option for the second aspect, only the multidrug combinations included in original training dataset were used, or virtually generated multidrug combinations were used in addition to the given multidrug combinations. Table 1 shows changes in performance of model prediction with respect to these two aspects. Here, each of the model characteristics is observed to be highly effective in improving the generalizability for multidrug side effects prediction. Although virtually created drug pairs do not always seem to help improve predictive performance, they are observed to significantly improve performance if single drug label data are used together with drug pair label data for learning. Therefore, it is recommended to simultaneously use single drug and drug pair data for model training, with regularization based on all given drug pairs and virtual drug pairs.
Comparison with existing methods: For comparative study, we applied two existing methods (Decagon [7] and DistMult [18]) for model training with our data. This is because, to the best of our knowledge, the prediction performance for DPU input data has not been reported in previous studies using knowledge graphs. As results show in Table 2, the proposed model showed the highest performance with AUC of 0.708 compared to Decagon with AUC of 0.531 and DistMult with AUC of 0.577. This performance improvement demonstrates the effect of using labeled single drug data and a regularization term in the loss function. Moreover, even at the baseline model using no labeled single drug data and no regularization, our model showed better performance as AUC of 0.618 than the models based on existing methods. However, this may be because existing methods need to learn far more parameters than our model, and thus can overfit the training data. Using more extensive data for training might help to improve their performance.
3.4. Non-DPU Side Effect Prediction
Data splitting procedure: We split all labeled drug pair samples into training, validation, and test datasets to evaluate prediction performance with non-DPU inputs. Labeled drug pairs were randomly divided into five folds for cross-validation. Drug pairs of four folds were used as labeled samples in the training data. Of the remaining fold drug pairs, 50% was used as the test data and the other 50% as the validation data. By observation, almost all drugs were included in the training data as well as in the test data. Virtual drug pairs were generated in the same manner as done for the DPU side effects prediction.
Performance evaluation: The proposed method showed reasonably good performance with AUC of 0.912 also in non-DPU prediction (see Table 3). As with the DPU prediction, our model characteristics using labeled single drug data and a regularization term in the loss function have been shown to help improve the generalizability of the predictive model to some degree. However, unlike the DPU prediction, using virtual drug pairs for regularization did not affect prediction performance at all.
Comparison with previous studies: We conducted a comparative evaluation of models reported in previous studies with respect to the prediction performance of non-DPU side effects. The studies to be used for the comparison were those that included label data from the TWOSIDES database [31] based on a procedure similar to that used in our study. The comparison results are given in Table 4. Here, our model showed AUC of 0.912 on average in the 200 targeted Ses while showing AUC of 0.963 in the 10 Ses with the highest AUCs. The study by Bang et al. [13] included sample data that was most similar to the data used in our study, yet our proposed method here showed slightly better performance than that of Bang’s with AUC of 0.94 in the 10 Ses with the highest AUCs. In addition, our model performed better in the averaged AUC for targeted side effects (0.912) compared to that reported by Zitnik et al. [14] (0.872), although Zitnik’s study had significantly more targeted side effects and a wider range of labeled drug pairs than our study. On the other hand, the overall performance of the proposed model was not as good as those of previous studies using much more labeled drug pairs for training than our study (approximately 4.4 times in many studies). Due to the nature of the proposed method, only drugs linked to at least one protein were used here. The model’s performance is expected to improve if more training data are available for our model. Thus, the difference in performance between our model and the other models may be reduced or even reversed, making our model better. As evidence supporting this expectation, Table 5 shows that performance of the proposed model is higher than that of two existing models trained by our data.
3.5. Effects of Hyperparameter Setting on Prediction Performance
We first investigated how a hyperparameter ɑ affects the prediction performance, which controls the impact of the regularization term in loss function. Figure 3 shows the change in prediction performance according to the value of ɑ. The larger this value is, the greater the influence of regularization based on connectivity strengths between drugs and proteins on model learning, while the lesser the influence of side effect labels. The optimal value was larger in predicting DPU side effects than in predicting non-DPU side effects. (0.7 and 0.1 in predicting DPU and non-DPU, respectively). That is, when the multidrug inputs included new drugs for which no multidrug clinical information is known, considering the regularization based on connective strengths more than the side effect labels in training models led to better predictive performance.
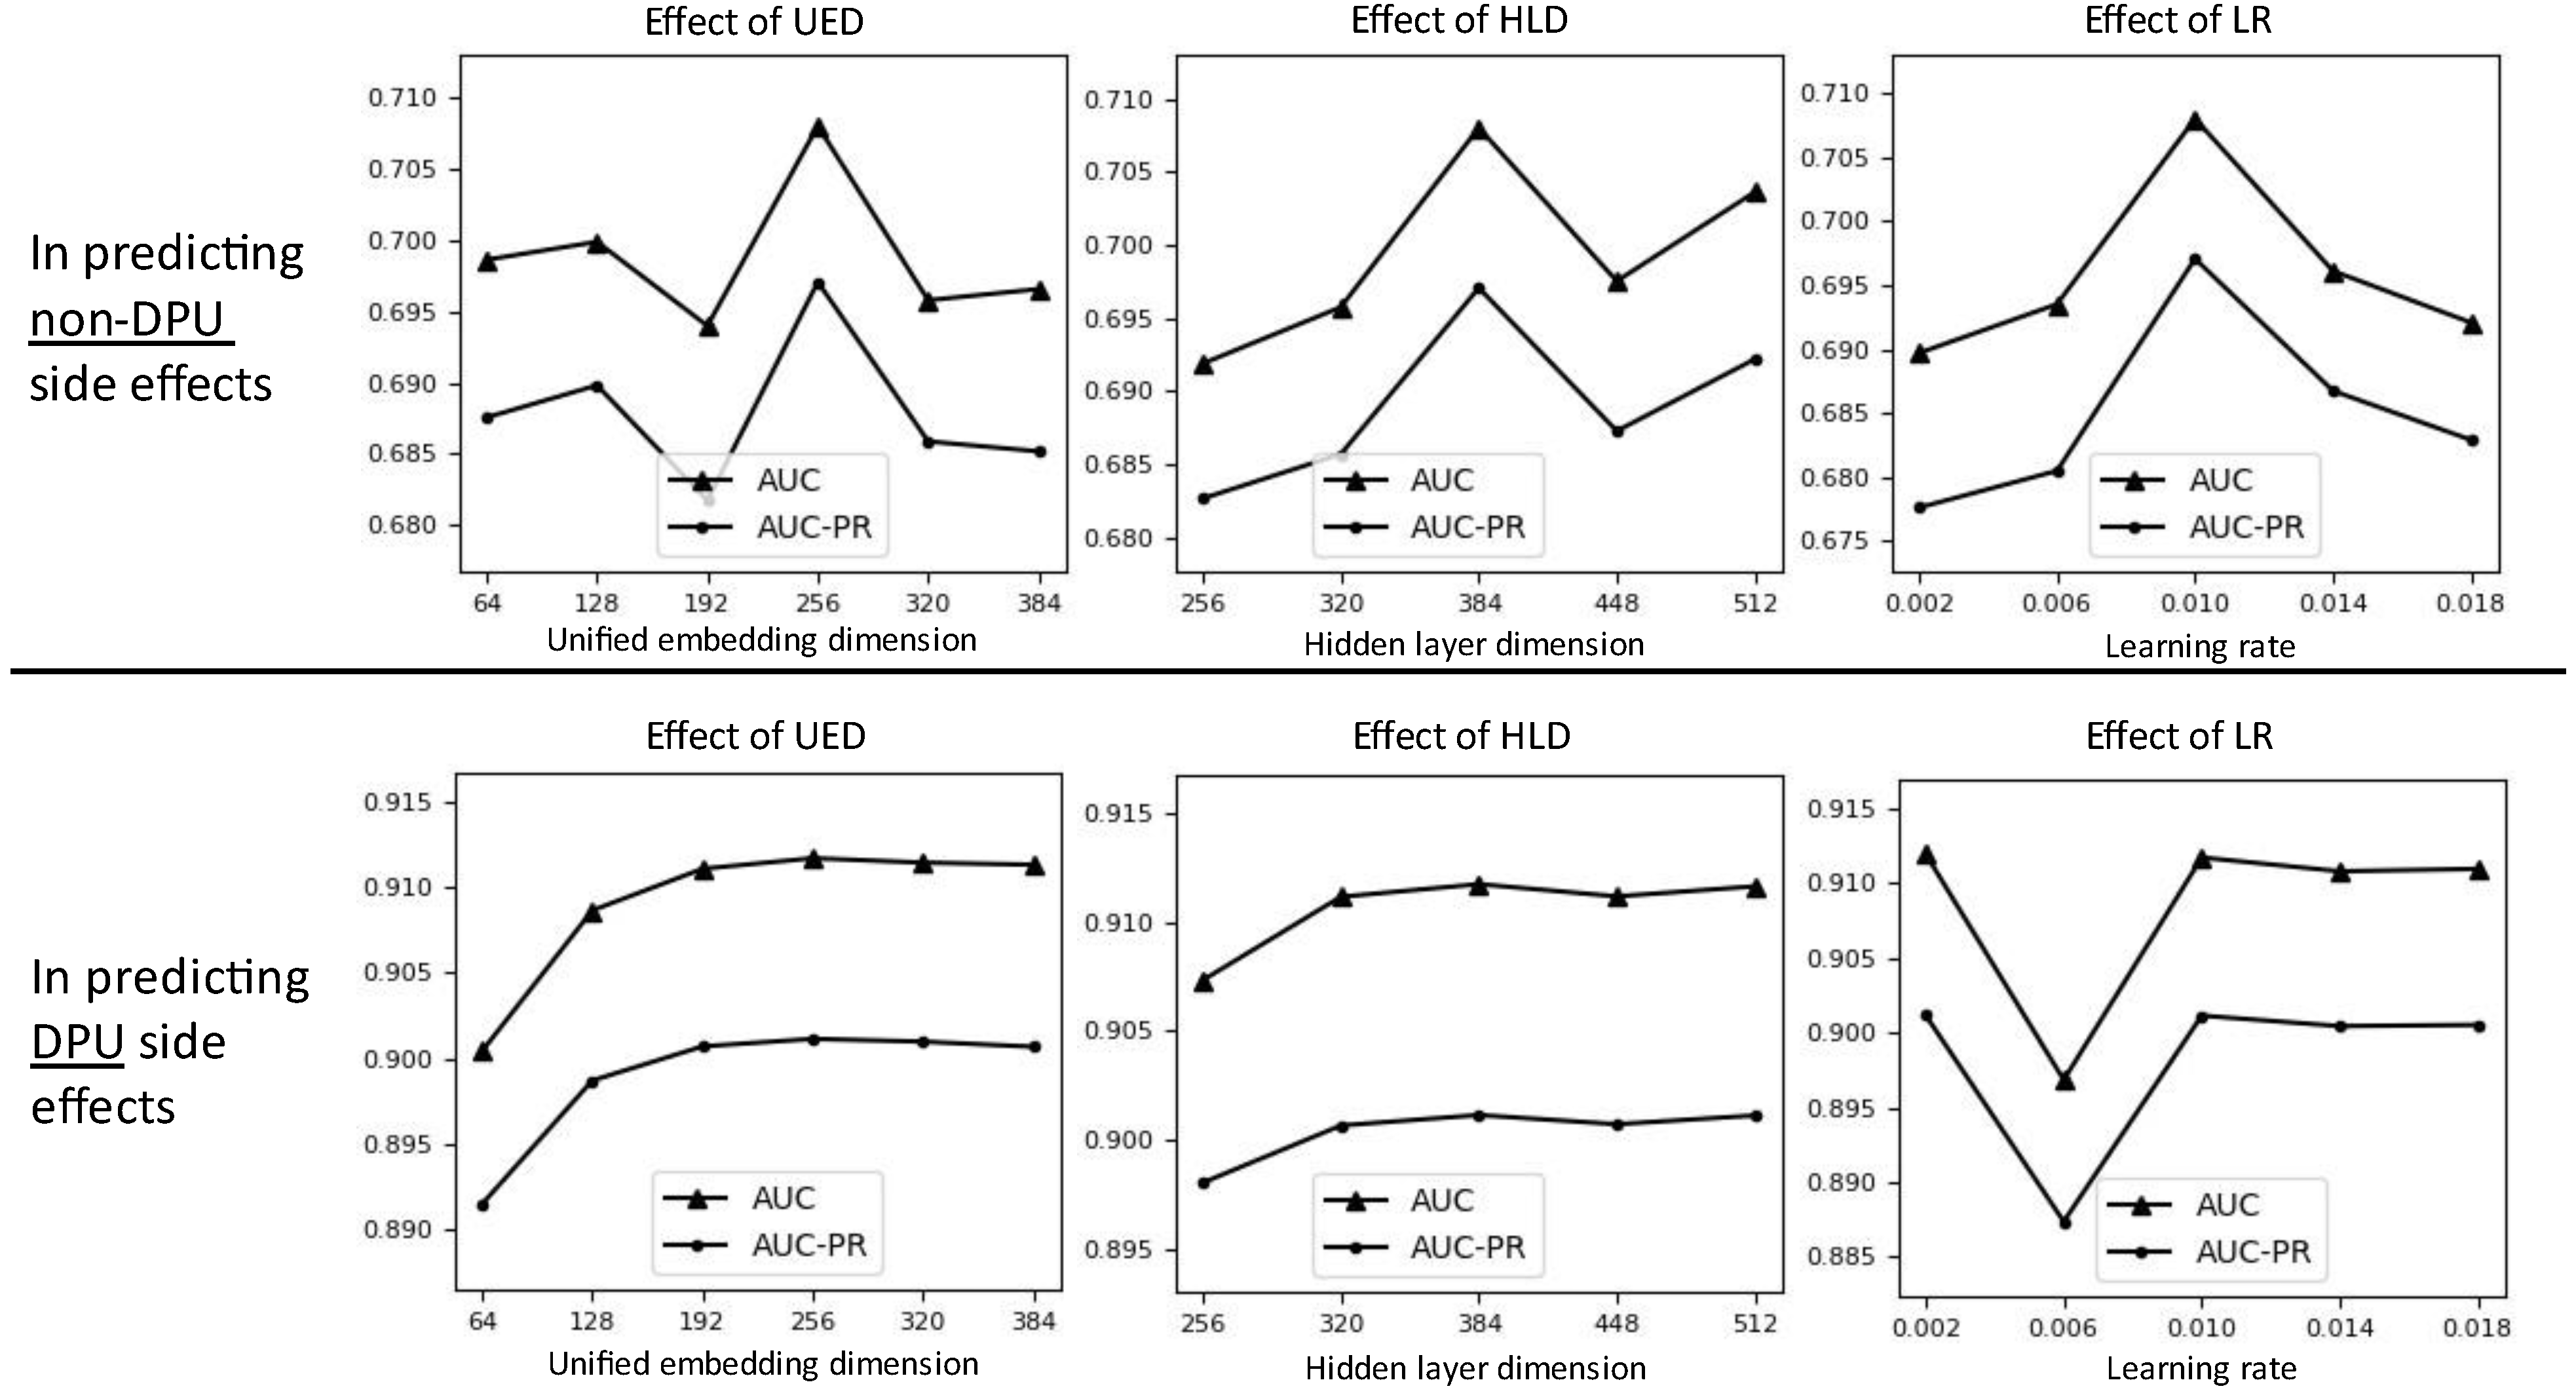
Additionally, we investigated performance under other three hyperparameters: unified embedding dimension (UED), hidden layer dimension (HLD), and learning rate (LR). The default value is 256, 384, and 0.01 for HLD, UED, and LR, respectively. We did not use a grid search to find the optimal hyperparameter combination because the search space is too large with many possible combinations. Figure 4 shows the experimental results. The appropriate UED and HLD for both DPU and non-DPU side effects predictions seem to be 256 and 384, respectively. In DPU side effects prediction, the best performance was clearly shown at the UED 256 and HLD 384. On the other hand, in non-DPU side effects prediction, the performance increased slightly when UED 256 or higher was used, but the performance change was very little. Similarly, even if the performance increased slightly when using HLD 384 or higher, the performance change was very little. Meanwhile, the appropriate LR seem to be 0.01 in both DPU and non-DPU side effects predictions. In predicting DPU side effects, the best performance was clearly shown at the LR 0.01. In predicting non-DPU side effects, the performance seems to stabilize around LR 0.01. Although performance for LR less than 0.01 (e.g., LR 0.002) is similar to that for LR 0.01, we used LR = 0.01 because of training time. In our experimental environment, the training time for 1 epoch was about 0.2 s using GPU of Quadro RTX 6000.
4. A Case Study on Interpretability
The proposed method allows us to identify significant proteins closely related to multidrug side effects through the investigation connectivity strength (cs) values between multidrug combinations and proteins. There are two embedding spaces (i.e., initial and unified space) that can be used for this interpretation. The initial embedding space was created by learning only the graph structure. On the other hand, the unified embedding space is a conversion of the initial space, designed not only to well predict polypharmacy side effects, but also to reflect the quantified relationships between multidrug and each of all proteins into the same embedding space. Therefore, it is expected that the unified embedding can identify significant proteins that are difficult to identify by the initial embedding based only on the graph structure. Experiments investigated whether this expectation was realized. More specifically, in identifying significant proteins closely related to a side effect s, we investigated whether proteins identified by the unified embedding but not identified by the initial embedding were indeed related to the s.
4.1. Determining and Selecting Proteins Significant in a Side Effect
If the protein p has cs values with positive drug pairs are significantly greater than with negative drug pairs on the unified embedding space, the p was identified to be significant. Among such significant proteins, those identified in the initial embedding space were excluded from the investigation. See Algorithm 2 for detailed procedure. Here, we used the MannWhitney U test to determine the significance of the difference in cs values between positive and negative samples, as cs values do not follow a normal distribution. We set the p-value threshold to 0.01.
| Algorithm 2. Pseudo code of determining and selecting proteins significant in a side effect s. |
| : The set of significant proteins for the s. : All proteins in graph. : A set of positive drug pairs that cause s by polypharmacy effect. : A set of negative drug pairs that do not cause the s. : A group of connectivity strength (cs) values. : Threshold to determine significance. Function MannWhitneyU(, ) Return a p-value calculated by MannWhitney U test between two groups. (Alternative hypothesis: Protein p has larger cs values in positive drug pairs than in negative drug pairs.) EndFunction Initialize to empty set. For each protein do: The group of (dp, p) values for dp The group of (dp, p) values for dp p_valueI MannWhitneyU(, ) The group of (dp, p) values for dp The group of (dp, p) values for dp p_valueU MannWhitneyU(, ) If (p_valueI ≧ ) and (p_valueU < ) do: Include p into . EndIf |
4.2. Examining the Relationships between Significant Proteins and Side Effects
We detected gene ontology (GO) terms [32] significantly related to the protein set Ps. The Enrichr program [33], one of the tools for gene set enrichment analysis (GSEA), was used. As background proteins for GSEA, 18,497 proteins that can be converted into gene symbols among all proteins in this graph were used. A p-value was calculated for each GO term, and terms with adjusted p-value of 0.01 or less were determined to be significant. Whether each GO term has a practical relevance to side effects was then investigated through the literature search.
4.3. Results
Since it is difficult to investigate all significant GO terms determined in 200 targeted side effects, we narrowed the investigation range down by a specific criterion. First, among the GO terms, those with more than 100 proteins belonging to the term were excluded. That is, terms corresponding to a wide range of biological phenomena are excluded. Then, among side effects, side effects having two or more significant GO term were excluded. Consequently, 24 side effects, each has one significant GO term only, were selected as our investigation targets.
Table 6 summarizes the results. In 16 out of 24 side effects (66.6%), the relationships with the corresponding GO terms were found through the existing literatures. Despite the GO terms of a narrow range of biological phenomena and the side effects of a narrow range of symptoms, there were existing literatures supporting the relationships. In particular, a very strong relationship was shown in some cases. For example, folliculitis has an intuitive relationship with cilium. And there is a study that mentions a direct relationship between myocarditis and cyclin/CDK. Moreover, there are many existing studies on the relationship between nail and amyloid.
5. Conclusions and Discussion
We proposed a unified embedding approach that made it possible to incorporate labeled single drug data, labeled multidrug data, nodes connectivity shown in the knowledge graph, and unlabeled virtual multidrug data into embedding space. In previous studies, the polypharmacy side effects prediction model did not learn relationships between single drug characteristics and its labels. In this study, however, we applied these relationships to learning models via the unified embedding approach and succeeded in improving the prediction performance. In addition, learning the relationships between multidrug and all graph nodes, not just between multidrug and neighboring nodes, appears to have the effect of reducing overfitting in the predictive models. This effect was further enhanced by regularizing the models using virtual multidrug data. In particular, the application of this embedding approach under multidrug inputs, including new drugs not used in existing drug combinations, clearly improved the generalizability when virtual multidrug data are used together with single drug label data. We also demonstrated that the biological terms determined using our embedding vectors have meaningful relationships with tens of adverse events. We anticipate that the proposed embedding method will provide new perspectives for relevant studies in the future.
The ideas presented in this study are not only limited to the present implementation but are also useful in various applications for improving predictive performance. Currently, the focus of our study was to propose an approach that well utilizes the relationships between drugs and proteins given in the graph. The performance might be improved by using graph convolution network for the extended graph including drug–drug interactions. Moreover, other advanced approaches for initial graph embedding might be possibly employed. In addition to the drug and protein nodes, an extended graph that includes other types of nodes can be used. However, our current model has several limitations as we implemented it under the condition that at least one target protein of each drug is known. Moreover, it is difficult to apply the proposed implementation to multiple edge types. Therefore, future studies are planned to address these issues.
Author Contributions
Conceptualization, J.K. and M.S.; methodology, J.K. and M.S.; software, J.K.; investigation, J.K.; writing—original draft preparation, J.K.; writing—review and editing, M.S.; visualization, J.K.; supervision, M.S.; funding acquisition, M.S. All authors have read and agreed to the published version of the manuscript.
Funding
This work was supported by the National Research Foundation of Korea (NRF) grant funded by the Korea government (MSIT) (No. 2020R1F1A1069984).
Institutional Review Board Statement
Not applicable.
Informed Consent Statement
Not applicable.
Data Availability Statement
The data presented in this study are openly available in reference number [14].
Conflicts of Interest
The authors declare no conflict of interest.
Abbreviations
| DPU | Drug pair including drugs unused in labeled multidrug combinations included in training data. |
| Non-DPU | Drug pair consisted of only drugs used in labeled multidrug combinations included in training data. |
| AUC | Area under the receiver operating characteristic curve |
| AUC-PR | Area under the curve of Precision-Recall |
| GO | Gene ontology |
References
- Dagli, R.J.; Sharma, A. Polypharmacy: A global risk factor for elderly people. J. Int. Oral. Health 2014, 6, i–ii. [Google Scholar]
- Hrestha, S.; Shrestha, S.; Khanal, S. Polypharmacy in elderly cancer patients: Challenges and the way clinical pharmacists can contribute in resource-limited settings. Aging Med. 2019, 2, 42–49. [Google Scholar] [CrossRef] [Green Version]
- Khezrian, M.; McNeil, C.J.; Murray, A.D.; Myint, P.K. An overview of prevalence, determinants and health outcomes of polypharmacy. Ther. Adv. Drug Saf. 2020, 11, 2042098620933741. [Google Scholar] [CrossRef]
- Wishart, D.S.; Feunang, Y.D.; Guo, A.C.; Lo, E.J.; Marcu, A.; Grant, J.R.; Sajed, T.; Johnson, D.; Li, C.; Sayeeda, Z.; et al. DrugBank 5.0: A major update to the DrugBank database for 2018. Nucleic Acids Res. 2018, 46, D1074–D1082. [Google Scholar] [CrossRef]
- Kuhn, M.; Szklarczyk, D.; Franceschini, A.; Campillos, M.; von Mering, C.; Jensen, L.J.; Beyer, A.; Bork, P. STITCH 2: An interaction network database for small molecules and proteins. Nucleic Acids Res. 2010, 38, D552–D556. [Google Scholar] [CrossRef] [Green Version]
- Musa, A.; Tripathi, S.; Dehmer, M.; Emmert-Streib, F. L1000 Viewer: A Search Engine and Web Interface for the LINCS Data Repository. Front. Genet. 2019, 10, 557. [Google Scholar] [CrossRef] [Green Version]
- Liu, T.; Cui, J.; Zhuang, H.; Wang, H. Modeling polypharmacy effects with heterogeneous signed graph convolutional networks. Appl. Intell. 2021, 51, 8316–8333. [Google Scholar] [CrossRef]
- Yao, J.; Sun, W.; Jian, Z.; Wu, Q.; Wang, X. Effective knowledge graph embeddings based on multidirectional semantics relations for polypharmacy side effects prediction. Bioinformatics 2022, 38, 2315–2322. [Google Scholar] [CrossRef]
- Wang, M.; Wang, H.; Liu, X.; Ma, X.; Wang, B. Drug-Drug Interaction Predictions via Knowledge Graph and Text Embedding: Instrument Validation Study. JMIR Med. Inform. 2021, 9, e28277. [Google Scholar] [CrossRef]
- Yu, Y.; Huang, K.; Zhang, C.; Glass, L.M.; Sun, J.; Xiao, C. SumGNN: Multi-typed drug interaction prediction via efficient knowledge graph summarization. Bioinformatics 2021, 37, 2988–2995. [Google Scholar] [CrossRef]
- Nováček, V.; Mohamed, S.K. Predicting Polypharmacy Side-effects Using Knowledge Graph Embeddings. AMIA Jt. Summits Transl. Sci. Proc. 2020, 2020, 449–458. [Google Scholar]
- Burkhardt, H.A.; Subramanian, D.; Mower, J.; Cohen, T. Predicting Adverse Drug-Drug Interactions with Neural Embedding of Semantic Predications. AMIA Annual Symposium proceedings. AMIA Symp. 2019, 2019, 992–1001. [Google Scholar]
- Bang, S.; Jhee, J.H.; Shin, H. Polypharmacy Side effect Prediction with Enhanced Interpretability Based on Graph Feature Attention Network. Bioinformatics 2021, 37, 2955–2962. [Google Scholar] [CrossRef]
- Zitnik, M.; Agrawal, M.; Leskovec, J. Modeling polypharmacy side effects with graph convolutional networks. Bioinformatics 2018, 34, 457–466. [Google Scholar] [CrossRef] [Green Version]
- Wang, R.; Li, T.; Yang, Z.; Yu, H. Predicting Polypharmacy Side Effects Based on an Enhanced Domain Knowledge Graph. In Proceedings of the Applied Informatics, Ota, Nigeria, 29–31 October 2020; pp. 89–103. [Google Scholar]
- Carletti, V.; Foggia, P.; Greco, A.; Roberto, A.; Vento, M. Predicting Polypharmacy Side Effects through a Relation-Wise Graph Attention Network. In Proceedings of the Structural, Syntactic, and Statistical Pattern Recognition, Padua, Italy, 21–22 January 2021; pp. 119–128. [Google Scholar]
- Dai, Y.; Wang, S.; Xiong, N.N.; Guo, W. A Survey on Knowledge Graph Embedding: Approaches, Applications and Benchmarks. Electronics 2020, 9, 750. [Google Scholar] [CrossRef]
- Wang, Q.; Mao, Z.; Wang, B.; Guo, L. Knowledge Graph Embedding: A Survey of Approaches and Applications. IEEE Trans. Knowl. Data Eng. 2017, 29, 2724–2743. [Google Scholar] [CrossRef]
- Bordes, A.; Usunier, N.; Garcia-Duran, A.; Weston, J.; Yakhnenko, O. Translating Embeddings for Modeling Multi-relational Data. Adv. Neural Inf. Process. Syst. 2013, 26, 2787–2795. [Google Scholar]
- Lin, H.; Liu, Y.; Wang, W.; Yue, Y.; Lin, Z. Learning Entity and Relation Embeddings for Knowledge Resolution. Procedia Comput. Sci. 2017, 108, 345–354. [Google Scholar] [CrossRef]
- Trouillon, T.; Welbl, J.; Riedel, S.; Gaussier, É.; Bouchard, G. Complex embeddings for simple link prediction. In Proceedings of the 33rd International Conference on International Conference on Machine Learning, New York, NY, USA, 20–22 June 2016; Volume 48, pp. 2071–2080. [Google Scholar]
- Yang, B.; Yih, W.-t.; He, X.; Gao, J.; Deng, L. Embedding entities and relations for learning and inference in knowledge bases. arXiv 2014, arXiv:1412.6575. [Google Scholar]
- Grover, A.; Leskovec, J. node2vec: Scalable Feature Learning for Networks. KDD 2016, 2016, 855–864. [Google Scholar] [CrossRef] [Green Version]
- Gao, Z.; Fu, G.; Ouyang, C.P.; Tsutsui, S.; Liu, X.Z.; Yang, J.; Gessner, C.; Foote, B.; Wild, D.; Ding, Y.; et al. edge2vec: Representation learning using edge semantics for biomedical knowledge discovery. BMC Bioinform. 2019, 20, 1–15. [Google Scholar] [CrossRef] [Green Version]
- Yadati, N.; Nitin, V.; Nimishakavi, M.; Yadav, P.; Louis, A.; Talukdar, P. NHP: Neural Hypergraph Link Prediction. In Proceedings of the 29th ACM International Conference on Information & Knowledge Management, Virtual Event, 19–23 October 2020; pp. 1705–1714. [Google Scholar]
- Chen, C.; Liu, Y.-Y. A survey on hyperlink prediction. arXiv 2022, arXiv:2207.02911. [Google Scholar]
- Klamt, S.; Haus, U.-U.; Theis, F. Hypergraphs and cellular networks. PLoS Comput. Biol. 2009, 5, e1000385. [Google Scholar] [CrossRef] [Green Version]
- Xu, B.; Wang, N.; Chen, T.; Li, M. Empirical evaluation of rectified activations in convolutional network. arXiv 2015, arXiv:1505.00853. [Google Scholar]
- Kingma, D.P.; Ba, J. Adam: A Method for Stochastic Optimization. arXiv 2014, arXiv:1412.6980. [Google Scholar]
- Hu, W.; Xiao, L.; Pennington, J. Provable benefit of orthogonal initialization in optimizing deep linear networks. arXiv 2020, arXiv:2001.05992. [Google Scholar]
- Tatonetti, N.P.; Ye, P.P.; Daneshjou, R.; Altman, R.B. Data-Driven Prediction of Drug Effects and Interactions. Sci. Transl. Med. 2012, 4, 125ra31. [Google Scholar] [CrossRef] [Green Version]
- Carbon, S.; Ireland, A.; Mungall, C.J.; Shu, S.; Marshall, B.; Lewis, S. AmiGO: Online access to ontology and annotation data. Bioinformatics 2009, 25, 288–289. [Google Scholar] [CrossRef] [Green Version]
- Kuleshov, M.V.; Jones, M.R.; Rouillard, A.D.; Fernandez, N.F.; Duan, Q.; Wang, Z.; Koplev, S.; Jenkins, S.L.; Jagodnik, K.M.; Lachmann, A.; et al. Enrichr: A comprehensive gene set enrichment analysis web server 2016 update. Nucleic Acids Res. 2016, 44, W90–W97. [Google Scholar] [CrossRef] [Green Version]
- van den Broek Best, O.; Vo, L.; Handmer, M.; Maclean, F.; Mancuso, P. Masquerading as A Stone: An Unusual Cause of Chronic Ureteric Obstruction. J. Urol. Surg. 2021, 8, 303–305. [Google Scholar] [CrossRef]
- Mantoo, S.; Hwang, J.; Chiang, G.; Tan, P.H. A rare case of localised AA-type amyloidosis of the ureter with spheroids of amyloid. Singap. Med. J. 2012, 53, e77–e79. [Google Scholar]
- Ratnayaka, J.A.; Serpell, L.C.; Lotery, A.J. Dementia of the eye: The role of amyloid beta in retinal degeneration. Eye 2015, 29, 1013–1026. [Google Scholar] [CrossRef]
- Lee, V.; Rekhi, E.; Kam, J.H.; Jeffery, G. Vitamin D rejuvenates aging eyes by reducing inflammation, clearing amyloid beta and improving visual function. Neurobiol. Aging 2012, 33, 2382–2389. [Google Scholar] [CrossRef]
- Plewig, G.; Kligman, A.M. The Role of Demodex. In Acne: Morphogenesis and Treatment; Springer: Berlin/Heidelberg, Germany, 1975; pp. 267–269. [Google Scholar]
- Lehman, J.M.; Laag, E.; Michaud, E.J.; Yoder, B.K. An essential role for dermal primary cilia in hair follicle morphogenesis. J. Investig. Dermatol. 2009, 129, 438–448. [Google Scholar] [CrossRef] [Green Version]
- Somuncu, S.; Somuncu, Ö.S.; Ballıca, B.; Tabandeh, B. Deficiency of epithelial–mesenchymal transition causes child indirect inguinal hernia. J. Pediatr. Surg. 2020, 55, 665–671. [Google Scholar] [CrossRef]
- Diets, I.J.; van der Donk, R.; Baltrunaite, K.; Waanders, E.; Reijnders, M.R.F.; Dingemans, A.J.M.; Pfundt, R.; Vulto-van Silfhout, A.T.; Wiel, L.; Gilissen, C.; et al. De Novo and Inherited Pathogenic Variants in KDM3B Cause Intellectual Disability, Short Stature, and Facial Dysmorphism. Am. J. Hum. Genet. 2019, 104, 758–766. [Google Scholar] [CrossRef] [Green Version]
- de Freitas, L.C.C.; Castilho, R.M.; Squarize, C.H. Histone Modification on Parathyroid Tumors: A Review of Epigenetics. Int. J. Mol. Sci. 2022, 23, 5378. [Google Scholar] [CrossRef]
- Alvelos, M.I.; Mendes, M.; Soares, P. Molecular alterations in sporadic primary hyperparathyroidism. Genet. Res. Int. 2011, 2011, 275802. [Google Scholar] [CrossRef] [Green Version]
- van der Knaap, J.A.; Kumar, B.P.; Moshkin, Y.M.; Langenberg, K.; Krijgsveld, J.; Heck, A.J.; Karch, F.; Verrijzer, C.P. GMP synthetase stimulates histone H2B deubiquitylation by the epigenetic silencer USP7. Mol. Cell 2005, 17, 695–707. [Google Scholar] [CrossRef]
- Zhao, Y.; Lang, G.; Ito, S.; Bonnet, J.; Metzger, E.; Sawatsubashi, S.; Suzuki, E.; Le Guezennec, X.; Stunnenberg, H.G.; Krasnov, A. A TFTC/STAGA module mediates histone H2A and H2B deubiquitination, coactivates nuclear receptors, and counteracts heterochromatin silencing. Mol. Cell 2008, 29, 92–101. [Google Scholar] [CrossRef]
- Casertano, A.; Rossi, A.; Fecarotta, S.; Rosanio, F.M.; Moracas, C.; Di Candia, F.; Parenti, G.; Franzese, A.; Mozzillo, E. An Overview of Hypoglycemia in Children Including a Comprehensive Practical Diagnostic Flowchart for Clinical Use. Front. Endocrinol 2021, 12, 684011. [Google Scholar] [CrossRef]
- Fanti, P.; Tosti, A.; Morelli, R.; Galbiati, G. Nail changes as the first sign of systemic amyloidosis. Dermatology 1991, 183, 44–46. [Google Scholar] [CrossRef]
- Renker, T.; Haneke, E.; Röcken, C.; Borradori, L. Systemic light-chain amyloidosis revealed by progressive nail involvement, diffuse alopecia and sicca syndrome: Report of an unusual case with a review of the literature. Dermatology 2014, 228, 97–102. [Google Scholar] [CrossRef]
- Derrick, E.K.; Price, M.L. Primary systemic amyloid with nail dystrophy. J. R. Soc. Med. 1995, 88, 290. [Google Scholar]
- Tausend, W.; Neill, M.; Kelly, B. Primary amyloidosis-induced nail dystrophy. Dermatol. Online J. 2014, 20, 21247. [Google Scholar] [CrossRef]
- af Klinteberg, B.; Oreland, L.; Hallman, J.; Wirsén, A.; Levander, S.E.; Schalling, D. Exploring the connections between platelet monoamine oxidase activity and behavior: Relationships with performance in neuropsychological tasks. Neuropsychobiology 1990, 23, 188–196. [Google Scholar] [CrossRef]
- Padmakumar, M.; Van Raes, E.; Van Geet, C.; Freson, K. Blood platelet research in autism spectrum disorders: In search of biomarkers. Res. Pract. Thromb. Haemost. 2019, 3, 566–577. [Google Scholar] [CrossRef] [Green Version]
- Xia, P.; Liu, Y.; Chen, J.; Coates, S.; Liu, D.X.; Cheng, Z. Inhibition of cyclin-dependent kinase 2 protects against doxorubicin-induced cardiomyocyte apoptosis and cardiomyopathy. J. Biol. Chem. 2018, 293, 19672–19685. [Google Scholar] [CrossRef] [Green Version]
- Rao, Z.; Ding, Y. Ubiquitin pathway and ovarian cancer. Curr. Oncol. 2012, 19, 324–328. [Google Scholar] [CrossRef] [Green Version]
- Meng, Y.; Qiu, L.; Zhang, S.; Han, J. The emerging roles of E3 ubiquitin ligases in ovarian cancer chemoresistance. Cancer Drug Resist. 2021, 4, 365–381. [Google Scholar] [CrossRef]
- Ando, H.; Ichihashi, M.; Hearing, V.J. Role of the ubiquitin proteasome system in regulating skin pigmentation. Int. J. Mol. Sci. 2009, 10, 4428–4434. [Google Scholar] [CrossRef] [Green Version]
- Qu, X.; Zhai, B.; Liu, Y.; Chen, Y.; Xie, Z.; Wang, Q.; Wu, Y.; Liu, Z.; Chen, J.; Mei, S.; et al. Pyrroloquinoline quinone ameliorates renal fibrosis in diabetic nephropathy by inhibiting the pyroptosis pathway in C57BL/6 mice and human kidney 2 cells. Biomed. Pharmacother. Biomed. Pharmacother. 2022, 150, 112998. [Google Scholar] [CrossRef]
- Jia, D.; Duan, F.; Peng, P.; Sun, L.; Ruan, Y.; Gu, J. Pyrroloquinoline-quinone suppresses liver fibrogenesis in mice. PLoS ONE 2015, 10, e0121939. [Google Scholar] [CrossRef]
- Lacombe, A.; Lee, H.; Zahed, L.; Choucair, M.; Muller, J.M.; Nelson, S.F.; Salameh, W.; Vilain, E. Disruption of POF1B binding to nonmuscle actin filaments is associated with premature ovarian failure. Am. J. Hum. Genet. 2006, 79, 113–119. [Google Scholar] [CrossRef] [Green Version]
- Tucker, E.J.; Grover, S.R.; Bachelot, A.; Touraine, P.; Sinclair, A.H. Premature Ovarian Insufficiency: New Perspectives on Genetic Cause and Phenotypic Spectrum. Endocr. Rev. 2016, 37, 609–635. [Google Scholar] [CrossRef]
- Li, H.; Zhao, Z.; Ling, J.; Pan, L.; Zhao, X.; Zhu, H.; Yu, J.; Xie, B.; Shen, J.; Chen, W. USP14 promotes K63-linked RIG-I deubiquitination and suppresses antiviral immune responses. Eur. J. Immunol. 2019, 49, 42–53. [Google Scholar] [CrossRef] [Green Version]
- Ye, L.; Zhang, Q.; Liuyu, T.; Xu, Z.; Zhang, M.-X.; Luo, M.-H.; Zeng, W.-B.; Zhu, Q.; Lin, D.; Zhong, B. USP49 negatively regulates cellular antiviral responses via deconjugating K63-linked ubiquitination of MITA. PLoS Pathog. 2019, 15, e1007680. [Google Scholar] [CrossRef]
- Klein, K.; Michel, B.; Gay, R.E.; Gay, S.; Ospelt, C. SAT0063|Functional analysis of the primary cilium in rheumatoid arthritis synovial fibroblasts. Ann. Rheum. Dis. 2013, 71, 491. [Google Scholar] [CrossRef]
- Rattner, J.B.; Sciore, P.; Ou, Y.; van der Hoorn, F.A.; Lo, I.K. Primary cilia in fibroblast-like type B synoviocytes lie within a cilium pit: A site of endocytosis. Histol. Histopathol. 2010, 25, 865–875. [Google Scholar] [CrossRef]
Figure 1.
An illustration of the core idea of this study based on a toy example. The embedding vectors of single drugs, multidrug combinations, and proteins are constructed such that they exist in the same latent space. A multidrug is embedded in the position where the properties of its constituent drugs are superimposed.

Figure 2.
Overall structure of the proposed method for multidrug side effects prediction. For a given multidrug, the model yields an embedding vector representing this multidrug and generates its prediction scores for k targeted side effects from this vector.
Figure 2.
Overall structure of the proposed method for multidrug side effects prediction. For a given multidrug, the model yields an embedding vector representing this multidrug and generates its prediction scores for k targeted side effects from this vector.

Figure 3.
Polypharmacy side effects prediction performance under different choices of the hyperparameter ɑ.
Figure 3.
Polypharmacy side effects prediction performance under different choices of the hyperparameter ɑ.

Figure 4.
Polypharmacy side effects prediction performances under different choices for each of three hyperparameters (UED, HRD, and LR).
Figure 4.
Polypharmacy side effects prediction performances under different choices for each of three hyperparameters (UED, HRD, and LR).


Table 1.
DPU side effects prediction performance for the 200 targeted side effects with respect to model characteristics. The performance is based on AUC (Area under the receiver operating characteristic curve) and AUC-PR (Area under the curve of Precision-Recall) averaged over 200 side effects. The hyperparameter ɑ was set to 0.7 at which our model showed highest performance in predicting DPU side effects.
| Model Type | Labeled Data for Training | Data for Regularization | AUC | AUC-PR | Accuracy | F1-Score | ||
|---|---|---|---|---|---|---|---|---|
| Drug Pairs | Single Drugs | Drug Pairs Included in Training Data | Virtually Created Drug Pairs | |||||
| Baseline | O | X | X | X | 0.618 | 0.618 | 0.576 | 0.567 |
| Model 1 | O | O | X | X | 0.642 | 0.645 | 0.588 | 0.575 |
| Model 2 | O | O | O | X | 0.684 | 0.673 | 0.600 | 0.584 |
| Model 3 | O | X | O | X | 0.690 | 0.683 | 0.616 | 0.602 |
| Model 4 | O | X | O | O | 0.685 | 0.670 | 0.602 | 0.582 |
| Model 5 (Proposed) | O | O | O | O | 0.708 | 0.697 | 0.637 | 0.618 |
Table 2.
DPU side effects prediction performance comparison with existing models trained with our data.
Table 2.
DPU side effects prediction performance comparison with existing models trained with our data.
| Model Type | Labeled Data for Training | Data for Regularization | AUC | AUC-PR | Accuracy | F1-Score | |||
|---|---|---|---|---|---|---|---|---|---|
| Drug Pairs | Single Drugs | Drug Pairs Included in Training Data | Virtually Created Drug Pairs | ||||||
| Existing models | Decagon [14] | O | X | X | X | 0.531 | 0.529 | 0.498 | 0.492 |
| DistMult [22] | O | X | X | X | 0.577 | 0.581 | 0.531 | 0.520 | |
| Our model | Baseline | O | X | X | X | 0.618 | 0.618 | 0.576 | 0.567 |
| Proposed | O | O | O | O | 0.708 | 0.697 | 0.637 | 0.618 | |
Table 3.
Non-DPU side effects prediction performance for the 200 targeted side effects with respect to model characteristics: Here AUC and AUC-PR are presented as average values for 200 side effects. The hyperparameter ɑ was set to 0.1 at which our model showed highest performance in predicting non-DPU side effects.
| Model Type | Labeled Data for Training | Data for Regularization | AUC | AUC-PR | Accuracy | F1-Score | ||
|---|---|---|---|---|---|---|---|---|
| Drug Pairs | Single Drugs | Drug Pairs Included in Training Data | Virtually Created Drug Pairs | |||||
| Baseline | O | X | X | X | 0.893 | 0.887 | 0.821 | 0.818 |
| Model 1 | O | O | X | X | 0.904 | 0.895 | 0.827 | 0.821 |
| Model 2 | O | O | O | X | 0.912 | 0.900 | 0.835 | 0.824 |
| Model 3 | O | X | O | X | 0.912 | 0.901 | 0.837 | 0.827 |
| Model 4 | O | X | O | O | 0.912 | 0.901 | 0.836 | 0.827 |
| Model 5 (Proposed) | O | O | O | O | 0.912 | 0.901 | 0.837 | 0.828 |
Table 4.
Performance comparison with previous studies on non-DPU polypharmacy side effects prediction.
Table 4.
Performance comparison with previous studies on non-DPU polypharmacy side effects prediction.
| Study | Average of AUCs for Non-DPU Inputs | Targeted Side Effects (Ses) | Used Resources for Graph Construction | Used Data |
|---|---|---|---|---|
| Proposed model | 0.912 in all targeted Ses. 0.963 in the 10 Ses with the highest AUC. | 200 Ses | Drug-protein (DP), and Protein-Protein (PP) | 14,247 labeled drug pairs and 284 labeled single drugs. |
| Zitnik et al., (2018) [14] | 0.872 in all targeted Ses. | 964 Ses | DP, PP and Drug-Drug (DD) * | 63,473 labeled drug pairs and negative sampling |
| Wang et al., (2020) [15] | 0.97 in the 50 Ses with the highest AUC. | 50 or more Ses | PP, DP, DD *, and Drug-Enzyme | Labeled drug pairs from 389 drugs. |
| Nováček et al., (2020) [11] | Apparently 0.99 in all targeted Ses. | Apparently 964 Ses | DD * (and perhaps also PP and DP) | 63,473 labeled drug pairs and negative sampling. |
| Liu et al., (2021) [7] | 0.947 in all targeted Ses. | 964 Ses | DP, DD *, and Semantic data. | Labeled drug pairs from 645 drugs. |
| Bang et al., (2021) [13] | 0.94 in the 10 Ses with the highest AUC. | 10 or more Ses | DP and DD * | 14,247 labeled drug pairs. |
| Yu et al., (2021) [10] | 0.949 in all targeted Ses. | 200 Ses | PP *, DP *, DD *, and other ten links of multi-type | 46,221 labeled drug pairs and negative sampling. |
| Carletti et al., (2021) [16] | 0.998 in all targeted Ses. | 964 Ses | DP, PP and DD * | 63,473 labeled drug pairs. |
| Yao et al., (2022) [8] | 0.996 in all targeted Ses. | 200 Ses | DD * (and perhaps also DP and PP) | Apparently 63,473 labeled drug pairs and negative sampling. |
‘*’ indicates that the edge is set to have multi-type in the study.
Table 5.
Non-DPU side effects prediction performance comparison with existing models trained with our data.
Table 5.
Non-DPU side effects prediction performance comparison with existing models trained with our data.
| Model Type | AUC | AUC-PR | Targeted Side Effects (Ses) | Used Resources for Graph Construction | Used Data |
|---|---|---|---|---|---|
| Proposed model | 0.912 | 0.901 | 200 Ses | Drug-protein (DP), and Protein-Protein (PP) | 14,247 labeled drug pairs and 284 labeled single drugs |
| Decagon [14] | 0.805 | 0.792 | PP, DP, and multi-typed Drug-Drug | 14,247 labeled drug pairs and negative sampling | |
| DistMult [22] | 0.812 | 0.806 |
Table 6.
Significant term for each 24 side effects, determined by unified embedding.
| Side Effect ID | Significant GO Term | GO ID | Overlap * | Adjusted p-Value | Related Literatures and Notes |
|---|---|---|---|---|---|
| Calculus ureteric | Regulation of amyloid precursor protein biosynthetic process | GO:0042984 | 5/11 | 0.008806 | Ureteric calculus is related to amyloid [34,35]. |
| Eye injury | Regulation of amyloid precursor protein biosynthetic process | GO:0042984 | 5/11 | 0.007394 | Weaken of eye function is related to amyloid [36,37]. |
| Folliculitis | Intraciliary transport involved in cilium assembly | GO:0035735 | 10/40 | 0.00145 | Folliculitis is directly related to cilia (cilium) [38,39]. |
| Hernia inguinal | Histone lysine methylation | GO:0034968 | 10/34 | 0.003045 | Hernia is related to histone lysine methylation [40,41]. |
| Hyperparathyroidism | Histone ubiquitination | GO:0016574 | 7/21 | 0.009554 | Hyperparathyroidism is related to histone [42,43]. |
| Hyperpigmentation | Histone H2B ubiquitination | GO:0033523 | 5/10 | 0.003118 | Pigmentation is related to histone H2B in Drosophila [44,45]. |
| Hypoglycaemia neonatal | Protein serine/threonine kinase activator activity | GO:0043539 | 6/37 | 0.001837 | Neonatal hypoglycaemia is related to serine/threonine kinase [46]. |
| Ingrowing nail | Regulation of amyloid precursor protein biosynthetic process | GO:0042984 | 6/11 | 0.003511 | Nail growing is related to amyloid [47,48,49,50]. |
| Motor retardation | Platelet aggregation | GO:0070527 | 8/36 | 0.004725 | Psychomotor activity is related to platelet [51,52]. |
| Myocarditis | Cyclin/CDK positive transcription elongation factor complex | GO:0008024 | 4/6 | 0.001296 | Myocarditis is strongly related to cyclin/CDK [53]. |
| Ovarian cancer | Ubiquitin binding | GO:0043130 | 8/73 | 0.004612 | Ovarian cancer is related to ubiquitin [54,55]. |
| Pigmentation disorder | Ubiquitin binding | GO:0043130 | 8/73 | 0.006731 | Pigmentation is related to ubiquitin [56]. |
| Pleural fibrosis | Quinone biosynthetic process | GO:1901663 | 5/14 | 0.009926 | Fibrosis of liver and kidney is related to pyrroloquinoline-quinone [57,58]. |
| Premature menopause | Intermediate filament organization | GO:0045109 | 8/18 | 0.005834 | Premature menopause is strongly related to actin filament [59,60]. |
| Soft tissue infection | Protein K63-linked deubiquitination | GO:0070536 | 6/32 | 0.00143 | K63-linked deubiquitination is related to antiviral response [61,62]. |
| Synovitis | Intraciliary transport involved in cilium assembly | GO:0035735 | 10/40 | 0.000563 | Synovitis is related to cilia [63,64]. |
| Colitis pseudomembranous | DNA-templated transcription, elongation | GO:0006354 | 10/69 | 0.004319 | Not found related Literatures |
| Dysphemia | Intraciliary transport involved in cilium assembly | GO:0035735 | 11/40 | 0.00759 | |
| Flashing lights | Histone monoubiquitination | GO:0010390 | 8/24 | 0.005066 | |
| Furuncle | Coenzyme A metabolic process | GO:0015936 | 6/14 | 0.005619 | |
| Myasthenia gravis | Histone ubiquitination | GO:0016574 | 9/21 | 6.16E-05 | |
| Seborrhoeic keratosis | Prenyltransferase activity | GO:0004659 | 6/9 | 0.008161 | |
| Sinus headache | tRNA wobble base modification | GO:0002097 | 7/14 | 0.00292 | |
| Trigger finger | Positive regulation of protein export from nucleus | GO:0046827 | 7/15 | 0.003106 |
* Overlap: (Number of identified proteins corresponding to the GO term.)/(Number of background proteins corresponding to the GO term.).
Disclaimer/Publisher’s Note: The statements, opinions and data contained in all publications are solely those of the individual author(s) and contributor(s) and not of MDPI and/or the editor(s). MDPI and/or the editor(s) disclaim responsibility for any injury to people or property resulting from any ideas, methods, instructions or products referred to in the content. |
© 2023 by the authors. Licensee MDPI, Basel, Switzerland. This article is an open access article distributed under the terms and conditions of the Creative Commons Attribution (CC BY) license (https://creativecommons.org/licenses/by/4.0/).
Share and Cite
MDPI and ACS Style
Kim, J.; Shin, M. A Knowledge Graph Embedding Approach for Polypharmacy Side Effects Prediction. Appl. Sci. 2023, 13, 2842. https://0-doi-org.brum.beds.ac.uk/10.3390/app13052842
AMA Style
Kim J, Shin M. A Knowledge Graph Embedding Approach for Polypharmacy Side Effects Prediction. Applied Sciences. 2023; 13(5):2842. https://0-doi-org.brum.beds.ac.uk/10.3390/app13052842
Chicago/Turabian StyleKim, Jinwoo, and Miyoung Shin. 2023. "A Knowledge Graph Embedding Approach for Polypharmacy Side Effects Prediction" Applied Sciences 13, no. 5: 2842. https://0-doi-org.brum.beds.ac.uk/10.3390/app13052842
Note that from the first issue of 2016, this journal uses article numbers instead of page numbers. See further details here.