Article

LED Illumination Modules Enable Automated Photoautotrophic Cultivation of Microalgae in Parallel Milliliter-Scale Stirred-Tank Bioreactors

by
Philipp Benner
,
Finn Joshua Lüdtke
,
Nina Beyer
,
Nikolas von den Eichen
,
José Enrique Oropeza Vargas
and
Dirk Weuster-Botz
*
Department of Energy and Process Engineering, TUM School of Engineering and Design, Technical University of Munich, Boltzmannstraße 15, 85748 Garching, Germany
*
Author to whom correspondence should be addressed.
Submission received: 16 March 2023 / Revised: 4 April 2023 / Accepted: 12 April 2023 / Published: 18 April 2023

Abstract

:

Featured Application

Automated and scalable high-throughput development of photoautotrophic bioprocesses with microalgae.

Abstract

Scalable lab-scale photobioreactors are needed for the exploration of new and improved photoautotrophic bioprocesses. Microbioreactor systems in which parallel bioreactors operate automatically are frequently employed to increase the speed of strain selection as well as the bioprocess-based exploration of heterotrophic fermentation processes. To enable the photoautotrophic operation of a commercially available parallel microbioreactor system with 48 stirred-tank bioreactors, LED illumination modules were designed to allow for individual light supply (400–700 nm) for each of the parallel bioreactors automated by a liquid handling station that performs both individual pH control and OD750 detection. The illumination modules enable dynamic variation of the incident light intensities of up to 1800 µmol m−2 s−1. Automated liquid level detection and volume control of each individual mL-scale gassed photobioreactor has to be established to compensate for evaporation because of the long process times of several days up to weeks. Photoautotrophic batch processes with Microchloropsis salina that employ either varying constant incident light intensities or day and night dynamics resulted in a standard deviation of OD750 of up to a maximum of 10%, with the exception of high-photoinhibiting incident light intensities. The established photoautotrophic microbioreactor system enables the automated investigation of microalgae processes in up to 48 parallel stirred photobioreactors and is thus a new tool that enables efficient characterization and development of photoautotrophic processes with microalgae.

1. Introduction

Microalgae are eukaryotic, unicellular organisms that often grow photoautotrophically. This means that they use carbon dioxide as their sole carbon source and light as their energy source to enable not only growth but also the intracellular formation of a variety of products. Microalgae are commercially exploited for the production of high-value products such as β-carotene, lutein, and astaxanthin [1]. Furthermore, fatty acids produced with microalgae are found in the food and feed, aquaculture, pharmaceuticals, and cosmetics industries [2]. Lipids produced by microalgae can be processed for use as biofuels and biolubricants. Microalgae grow significantly faster than other plants, require a smaller land area, and can even be cultivated in brackish water [3]. Another application is wastewater treatment in which nitrates and phosphates that damage the ecosystem and pollute groundwater are used by microalgae for growth [4]. Exploiting microalgae for the cost-effective production of biopharmaceuticals requires a more in-depth knowledge of their diverse glycosylation pathways [5]. Recombinant microalgae can be useful for the production of key base chemicals, such as polyamine production in Chlamydomonas reinhardtii [6]. Immunostimulants and recombinant vaccines from microalgae are also used in aquaculture [7]. It is possible that microalgae strains might become commercially successful in the future and used in many applications [8,9]. Microalgae support a circular bio-economy, as they enable wastewater treatment while producing microalgae biomass, which can be converted into biofuels and value added products, e.g., antioxidants or pigments [10,11,12].
To make bioprocesses as effective as possible and maximize their economic relevance, it is essential to know the photoautotrophic growth and product formation kinetics of microalgae [13,14]. Besides such process variables as temperature, pH, DO, salinity, CO2 supply, power input, and nutrients, light availability is an essential factor for photoautotrophic bioprocesses [15,16,17]. It is common practice to use lab-scale photobioreactors to identify the optimal values of significant process variables for the growth and product formation of microalgae. The need to control the various process variables in combination with shear sensitive microalgae has led to the emergence of many different externally illuminated photobioreactor (PBR) designs [18]. The most common bioreactor types are microfluidic PBR [19] and shaken PBR, which involve microtiter plates [20] and shake flasks [21,22]. Common types of pneumatic PBR are the bubble column PBR, which includes the airlift PBR with riser and downcomer [23], as well as simpler versions for preculture preparation [24]. Other types are flat plate PBR, which features an advantageous surface-to-volume ratio [25], and tubular PBR [26]. Stirred-tank bioreactors with a highly controlled environment can be adapted for photoautotrophic cultivations; however, this requires due knowledge of the key metrics that represent the state of the art for heterotrophic cultivations [27]. The light source is positioned either around the glass body of the reactor [28] or inside the bioreactor [29].
In microalgae cultivation processes, the pH is commonly controlled either by adjusting the CO2 content in the air supply in the case of gas-lift PBR [28,30] or CO2 is dispersed in gasification containers in open thin-layer PBR [31] and open raceway ponds. In heterotrophic bioprocesses, pH is controlled by base or acid titration [32]. This approach can also be transferred to photoautotrophic cultivations of microalgae [33]. In cases where microalgae processes are not pH-controlled, the use of a self-buffering medium is permitted [20].
High throughput is essential for identifying optimal process conditions or screening for new production strains. This has given rise to the development of microbioreactor (MBR) systems following the rules of miniaturization, parallelization, and automation [34,35]. MBRs can be either scaled-down stirred-tank bioreactors [36,37] or shaken bioreactors [38,39]. For automated and unsupervised operations, these MBRs are commonly placed inside a liquid handling station (LHS). Besides various prokaryotic microorganisms [40,41,42], yeasts such as Komagatella pastoris have also been cultivated in miniaturized stirred-tank bioreactors, whereby scalability was demonstrated up to the m3 scale [43]. For cell cultures, MBR systems are designed with significantly lower shear forces [44]. For small-scale stirred-tank bioreactors, different stirrers have been designed for different energy dissipation and gas exchange values [36,41,45]. Recent developments focus on new sensors [46] and the smart integration of multiple laboratory devices [47].
The concept of MBRs is to be transferred from heterotrophic to photoautotrophic cultivation. Some of the aforementioned items associated with miniaturization, such as low-volume flat plate PBRs [48] or parallelization in MTPs [20] have already been realized. To the best of our knowledge, miniaturized stirred-tank PBRs have, however, not yet been described.
Light with a wavelength of between 400 and 700 nm is defined as photosynthetically active radiation (PAR) [49,50]. Within the PAR range, light is absorbed at various efficiencies by the chlorophyll in microalgae and the associated pigments. Some studies have analyzed algal growth using only red and/or blue light [51,52,53,54]. However, sunlight will probably continue to be the primary energy source for economically feasible production processes. For this reason, white light with a broad spectrum is preferred with laboratory-scale PBRs when scale-up is desired. This is why the use of light-emitting diodes (LEDs) is gaining relevance in the cultivation of microalgae for research and development. They are long-lasting, have a defined emission spectrum, and are electronically dimmable. LEDs can be dimmed either by constant current reduction (CCR, analog dimming) or pulse-width modulation (PWM, digital dimming). Such characteristics as small size and low radiant energy dissipation [55] are ideal for miniaturized PBRs due to the general space limitations and, especially, to the need for cooling. When it comes to controlling such constant current sources, microcontrollers are an excellent solution. The required components can be stacked on a single chip (a so-called “system on a chip”) [56]. The software is loaded into the read-only memory (ROM), which generates the output values. Furthermore, input signals, which control the script and output values, can be received via sensors.
Parallelized, miniaturized, and automated PBRs would be beneficial for efficient microalgae screening, media optimization, and bioprocess development, but, unfortunately, these are not yet in sight. An established MBR system that employs single-use stirred-tank bioreactors and can be operated with an LHS is to be adapted for photoautotrophic cultivation. In this context, new LED illumination modules are to be constructed, which are adapted to the MBRs using a controller unit for standalone use. The new parallel PBRs are to be evaluated based on examples of automated photoautotrophic batch cultivations of Microchloropsis salina using either varying constant incident light intensities or dynamic day and night cycles.

2. Materials and Methods

2.1. Microalgae Strain and Reaction Medium

The growth of Microchloropsis salina (M. salina, SAG 40.85) obtained from the Culture Collection of Algae at the University of Göttingen, Germany, was investigated in miniaturized stirred-tank bioreactors. M. salina is a compelling microalgae because of the potential of its lipid production as sustainable feedstock for biofuels [57], its photoautotrophic eicosapentaenoic acid (EPA) production [58], and its being a suitable model microalgae because of its known light-dependent growth kinetics [30]. The culture was kept in shaking flasks at room temperature and ambient light conditions until the precultures were prepared (20 mL inoculum and 180 mL ASW). Daily shaking of the flasks prevented sedimentation of the cells. There was no further medium supplementation in the shaking flasks. M. salina was cultivated for strain maintenance, preculture preparation, and in the batch processes with modified artificial seawater (ASW) according to the procedure used by Boussiba et al. [59]. The ASW was composed of NaCl (27 g L−1), MgSO4 · 7 H2O (6.6 g L−1), CaCl2 · 2 H2O (1.5 g L−1), KNO3 (5 g L−1), KH2PO4 (0.07 g L−1), Na2EDTA · 2 H2O (0.021 g L−1), FeCl3 · 6 H2O (0.014 g L−1), and 1 mL L−1 of a trace element solution of ZnCl2 (0.04 g L−1), H3BO3 (0.6 g L−1), CuCl2 · 2 H2O (0.04 g L−1), MnCl2 (0.4 g L−1), (NH4)6Mo7O24 · 4 H2O (0.37 g L−1). The pH was adjusted to 8.0 with NaOH, and the medium was sterilized by filtering.

2.2. Parallel Stirred-Tank Bioreactors

The parallel mL-scale stirred-tank bioreactor unit (bioREACTOR48, 2mag AG, Munich, Germany) was configured with 48 single-use bioreactors made of polystyrene with no baffles (HTBD, 2mag AG, Munich, Germany). The microalgae suspension was mixed with magnetically driven S-stirrers, which were originally designed for mixing solids [45]. The stirrers were mounted on closed axes that were fixed to the gas supply cover of the parallel bioreactor unit. A gas mixing device (DASGIP MX 4/4, Eppendorf SE, Hamburg, Germany) supplied sterile air mixed with CO2 into the head spaces of all the parallel bioreactors via a single central valve. The gas supply cover had an opening for each MBR for sampling and a gas outlet. The Teflon bushings, which were installed by the manufacturer, were removed from the opening to increase the diameter.

2.3. LHS Integration, Process Monitoring and Control

The stirred-tank bioreactor unit was placed in an LHS containing eight pipetting channels and one plate handler (Microlab STARlet, Hamilton Bonaduz AG, Bonaduz, Switzerland). The LHS took samples from the parallel bioreactors and controlled the integrated MTP photometer (Synergy HTX, Biotek, Winooski, VT, USA) and MTP plate washer (405 LS, Biotek, Winooski, VT, USA) for the repeated OD750 and pH analysis of the samples. The reusable steel needles were washed first in 70% (v/v) ethanol and afterwards in sterile water prior to sample taking to avoid the disposable tips. The tasks to be performed by the LHS, photometer and plate washer were programmed in a method editor and initiated using runtime control software (Microlab® STAR Software VENUS Version 4.5, Hamilton Bonaduz AG, 205 Bonaduz, Switzerland). Sub-methods, such as sampling, pH measurement, and level correction, were programmed and automatically executed during the process, applying a scheduling algorithm for their prioritization [47].

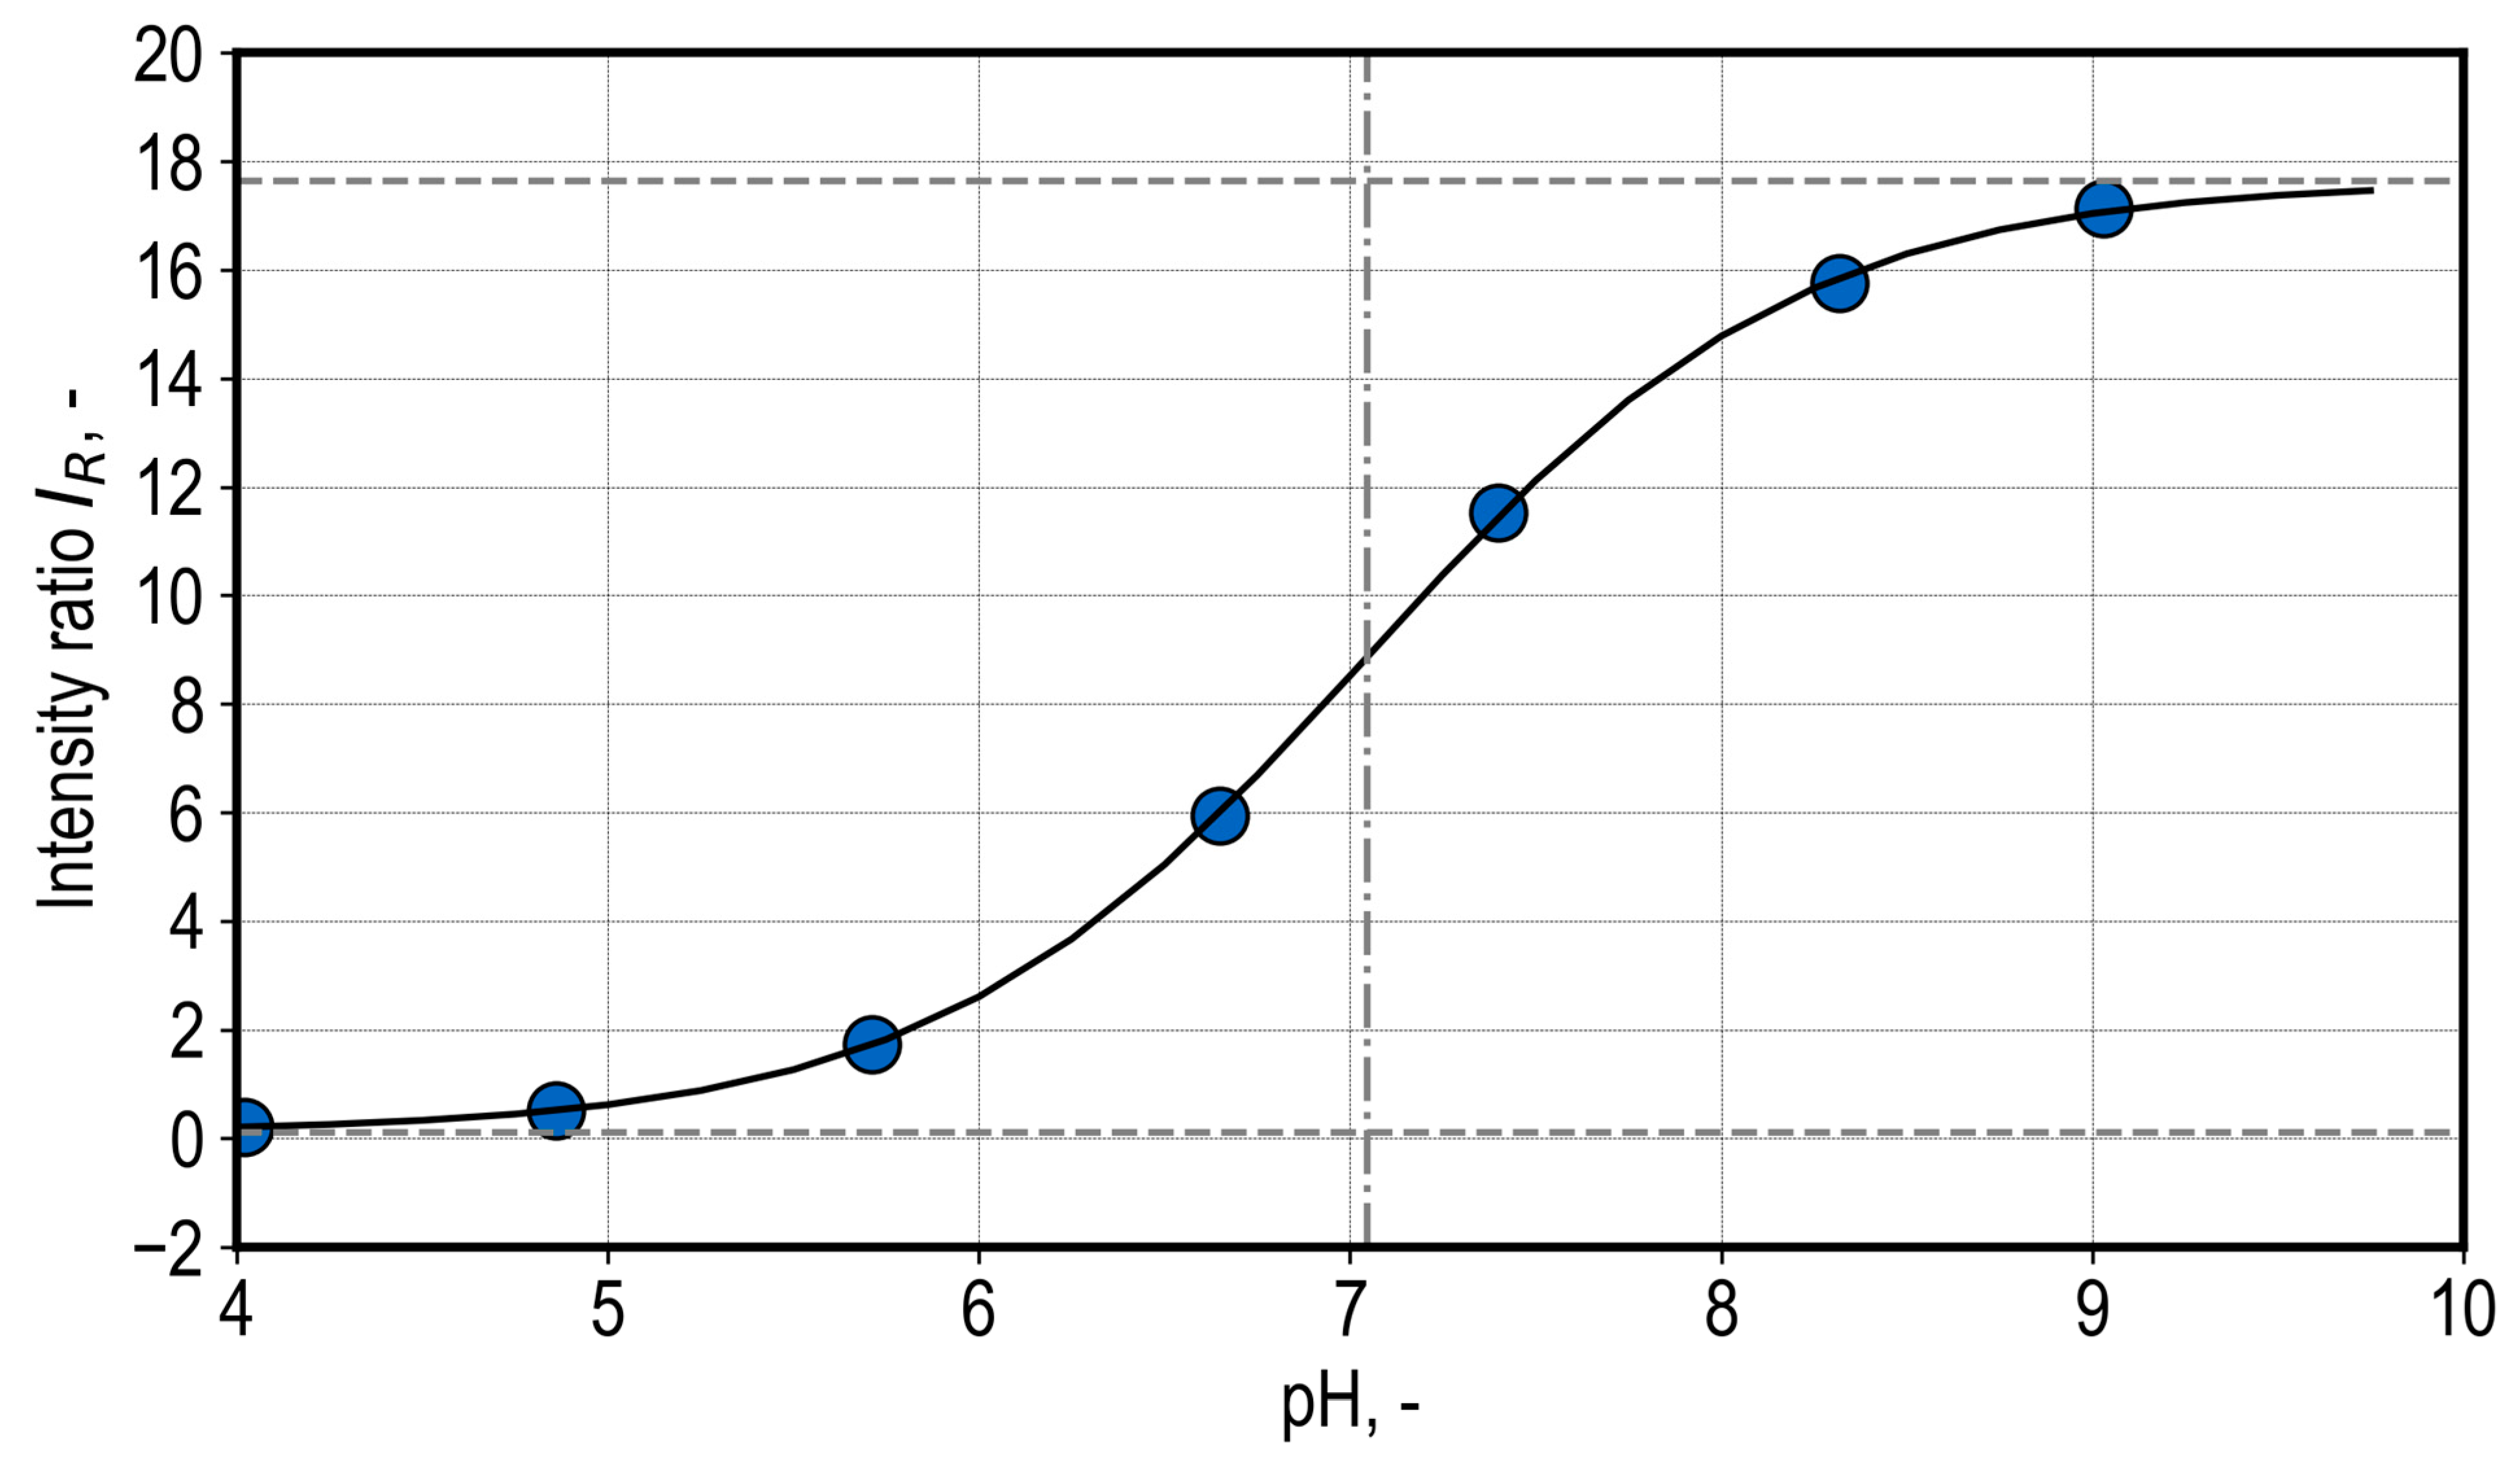
2.3.1. At-Line pH Measurement of the Parallel Stirred-Tank Bioreactors

The pH was determined at-line as described previously [60] using a 96-well microplate with integrated chemical optical pH sensors (HydoPlate HP96U, PreSens Precision Sensing GmbH, Regensburg, Germany) read by a fluorescence microplate reader (Synergy HTX, multi-mode reader, Biotek, Winooski, VT, USA). The pH sensors contained two different dyes. The fluorescence signal of the pH indicator dye was measured at 538 nm after excitation at 485 nm, while the fluorescence signal of the non-pH-sensitive reference dye was measured at 620 nm. The quotient of the intensity signals of both fluorescence dyes represents the intensity ratio IR (Equation (1)):
I R = I i n d i c a t o r I r e f e r e n c e  
The pH was calibrated before use using a HydroPlate of the same batch number. The reference HydroPlate was filled in triplicate with artificial sea water with varying pH values. The intensity ratio IR and pH were correlated (Figure A1) with Equation (2) to estimate the correlation model parameters Imax, Imin, pH0, and dpH. Fitting was performed using pH_solverv10 software (PreSens GmbH, Regensburg, Germany).
I R = I m i n I m a x 1 + e p H p H 0 d p H + I m a x  
At-line OD and pH measurements were linked during cultivation to reduce the sample volume. After serial dilution for OD measurement, 202 µL of undiluted cell suspension remained in the HydroPlate. After incubation, the fluorescence microplate reader outputted a value IR, correlating to the pH value. The incubation time was checked for constant measurements and set to a minimum of 15 min. If the measured pH was below 7.7 or above 8.3, a 45 µL quantity of either base (0.5 M NaOH) or acid (0.5 M HCl), respectively, was added to the respective bioreactor by the LHS during the photoautotrophic batch cultivation of M. salina in 48 parallel miniaturized stirred-tank PBRs at constant illumination. Parallel studies with physically simulated day and night cycles of the incident light intensities were not subject to pH control by the LHS. If the pH fell below pH 7.5 during batch cultivation of M. salina, 45 mL of 0.5 M NaOH was added manually.

2.3.2. Adjusting the Liquid Level in the Parallel Stirred-Tank Bioreactors

To compensate for evaporation, the LHS performs a liquid level adjustment every hour for each parallel bioreactor. The pipetting channels move to a set height within the bioreactors, which corresponds to the liquid level of the designated volume. The LHS performs an aspiration and dispensing step and records the pressure dynamics inside the channel. The pressure dynamics exhibit different progressions depending on whether the needles are in a gas or liquid phase (Figure 1). When aspirating the liquid phase, a vacuum is created inside the needle, which is represented by a curve with a logarithmic form. As soon as the pipetting piston stops, the pressure rises again. If air is aspirated, small water residues remain after the needles are washed, leading to rapid fluctuations in the recorded pressure dynamics. If the needles are completely dry, no pressure dynamics are recorded (not shown). The pressure dynamics are approximated with a spline function (scipy univariate spline) the derivative of which is analyzed for zeroes. If there are more zeroes than the threshold level of 20, the phase is classified as gas (air) and a fixed volume of 150 µL H2O is added to each reactor.
The hourly aspiration step for liquid level correction additionally serves as a water droplet supplant inside the pipette opening of the gas supply cover of the parallel bioreactor unit. The effluent gas transports water vapor, and when the gas phase is cooled to 14 °C in the headspace of the reactor unit, water condenses, eventually forming droplets. The above step pushes the droplets back into the reaction chamber, thus preventing the pipette openings from becoming closed by condensed water droplets, which may stop gassing of the headspace.

2.4. Preculture and Cultivation Protocol

Precultures were produced in 400 mL bubble column PBRs with a working volume of 200 mL [24]. The PBRs were placed inside an incubator (Profors, Infors HT, Bottmingen, Switzerland) running at 25 °C. The gas flow rates were adjusted manually to ensure sufficient mixing; the gas consisted of compressed air mixed with 2% CO2. Illumination from above was realized by six fluorescent tubes with an average photon flux density of 85 μmol m−2 s−1. If the offline measured pH was outside the range 7.5–pH 8.5, the pH was adjusted manually with either 0.5 M NaOH or 0.5 M HCl, as required. When a cell density of OD750 above 3.0 was measured, a new preculture was inoculated with an OD750 of 0.15.
Precultures with an OD750 of approximately 2 were diluted with ASW medium to a designated OD750 of 0.5. An amount of 10 mL of the cell suspension was then distributed into the parallel stirred-tank bioreactors. The parallel mL-scale stirred-tank bioreactor unit was placed inside an LHS for automated OD and pH measurement, pH correction, liquid level adjustment and droplet supplant. The microalgae cell suspension was agitated at 500 rpm with magnetically induced S-stirrers. Agitation was automatically stopped for sampling and liquid level detection. The 48 parallel stirred-tank bioreactors were gassed by 288 L h−1 of air with 2% CO2. Headspace cooling of the parallel bioreactors was set to 14 °C.
The cultivation temperature was a constant 29 °C as long as microalgae growth was being studied at constant illumination. Studies based on day and night cycles of incident light and temperature used the weather data of a summer day in June 2012 in Almeria, which were repeatedly applied. Because of its high solar irradiance, warm air temperature, and infrastructure, the seaside town of Almeria is an ideal reference location for outdoor microalgae cultivation [31]. The light intensity was automatically adjusted every ten minutes. The temperatures of all parallel bioreactors were adjusted automatically with a step time of 1 h, in line with the air temperature of the summer day in Spain (6 a.m.: 13.9 °C, 7 a.m.: 18.3 °C, 8 a.m.: 21.2 °C, 9 a.m.: 25.5 °C, 10 a.m.: 27.6 °C, 11 a.m.: 28.8 °C, 12 a.m.: 27.9 °C, 1 p.m.: 28.6 °C, 2 p.m.: 29.4 °C, 3 p.m.: 29.1, 4 p.m.: 29.1 °C, 5 p.m.: 28.3 °C, 6 p.m.: 27.9 °C, 7 p.m.: 26.6 °C, 8 p.m.: 24.9 °C, 9 p.m.: 22.8 °C, 10 p.m.: 21.8 °C, 11 p.m.: 20.9 °C, 12 p.m.: 16.8 °C, 1 a.m.: 17.5 °C, 2 a.m.: 17.1 °C, 3 a.m.: 15.8 °C, 4 a.m.: 15.1 °C, 5 a.m.: 14.6 °C).

2.5. At-Line and Offline Measurement of Optical Densities, Determination of Cell Dry Weight Concentration and Growth Rate

For at-line OD750 measurements, the LHS (Microlab STARlet, Hamilton Bonaduz AG, Bonaduz, Switzerland) sampled a 250 µL cell suspension and performed a 1:5 and 1:25 dilution in a 96-well MTP (clear, flat bottom). The M. salina cell suspensions were diluted with deionized water with 27 g L−1 NaCl. Optical densities were measured automatically using an MTP photometer at 750 nm (Synergy HTX, multi-mode reader, Biotek, Winooski, VT, USA). Offline OD750 measurements were performed with a cuvette photometer (Genesys 10S UVVis, Thermo Fisher, Waltham, MA, USA) with 10 mm cuvettes at 750 nm. To enable better comparison between OD750 in preculture and stirred-tank PBRs, an OD750 correlation was generated between the MTP and cuvette photometers. All results showed either directly measured or correlated cuvette OD750. OD measurement at 750 nm is an established method for growth monitoring of microalgae [16,57,58].
A linear correlation factor was calculated to estimate a cell dry weight (CDW) concentration based on the measured OD750. In a separate experiment, the OD750 and CDW concentration of samples with varying cell concentrations were determined. Gravimetric measurements of CDW concentrations were performed in triplicates. Pre-dried (24 h at 80 °C) glass microfiber filters (GF/C, Waltham, MA, USA, GE Healthcare) were weighed. The filters were then loaded with a specific amount of the microalgae suspension, and any salt residue was rinsed off with twice as much deionized water as the sample volume. The loaded filters were then dried within 48 h at 80 °C before being weighed once more. Cell dry weight concentration was calculated as the difference between an unloaded and loaded filter divided by the applied sample volume.
The exponential growth phase was determined by taking into account the linear increase in a semi-logarithmic representation. After that, the specific growth rate was estimated using exponential regression solely during exponential growth.

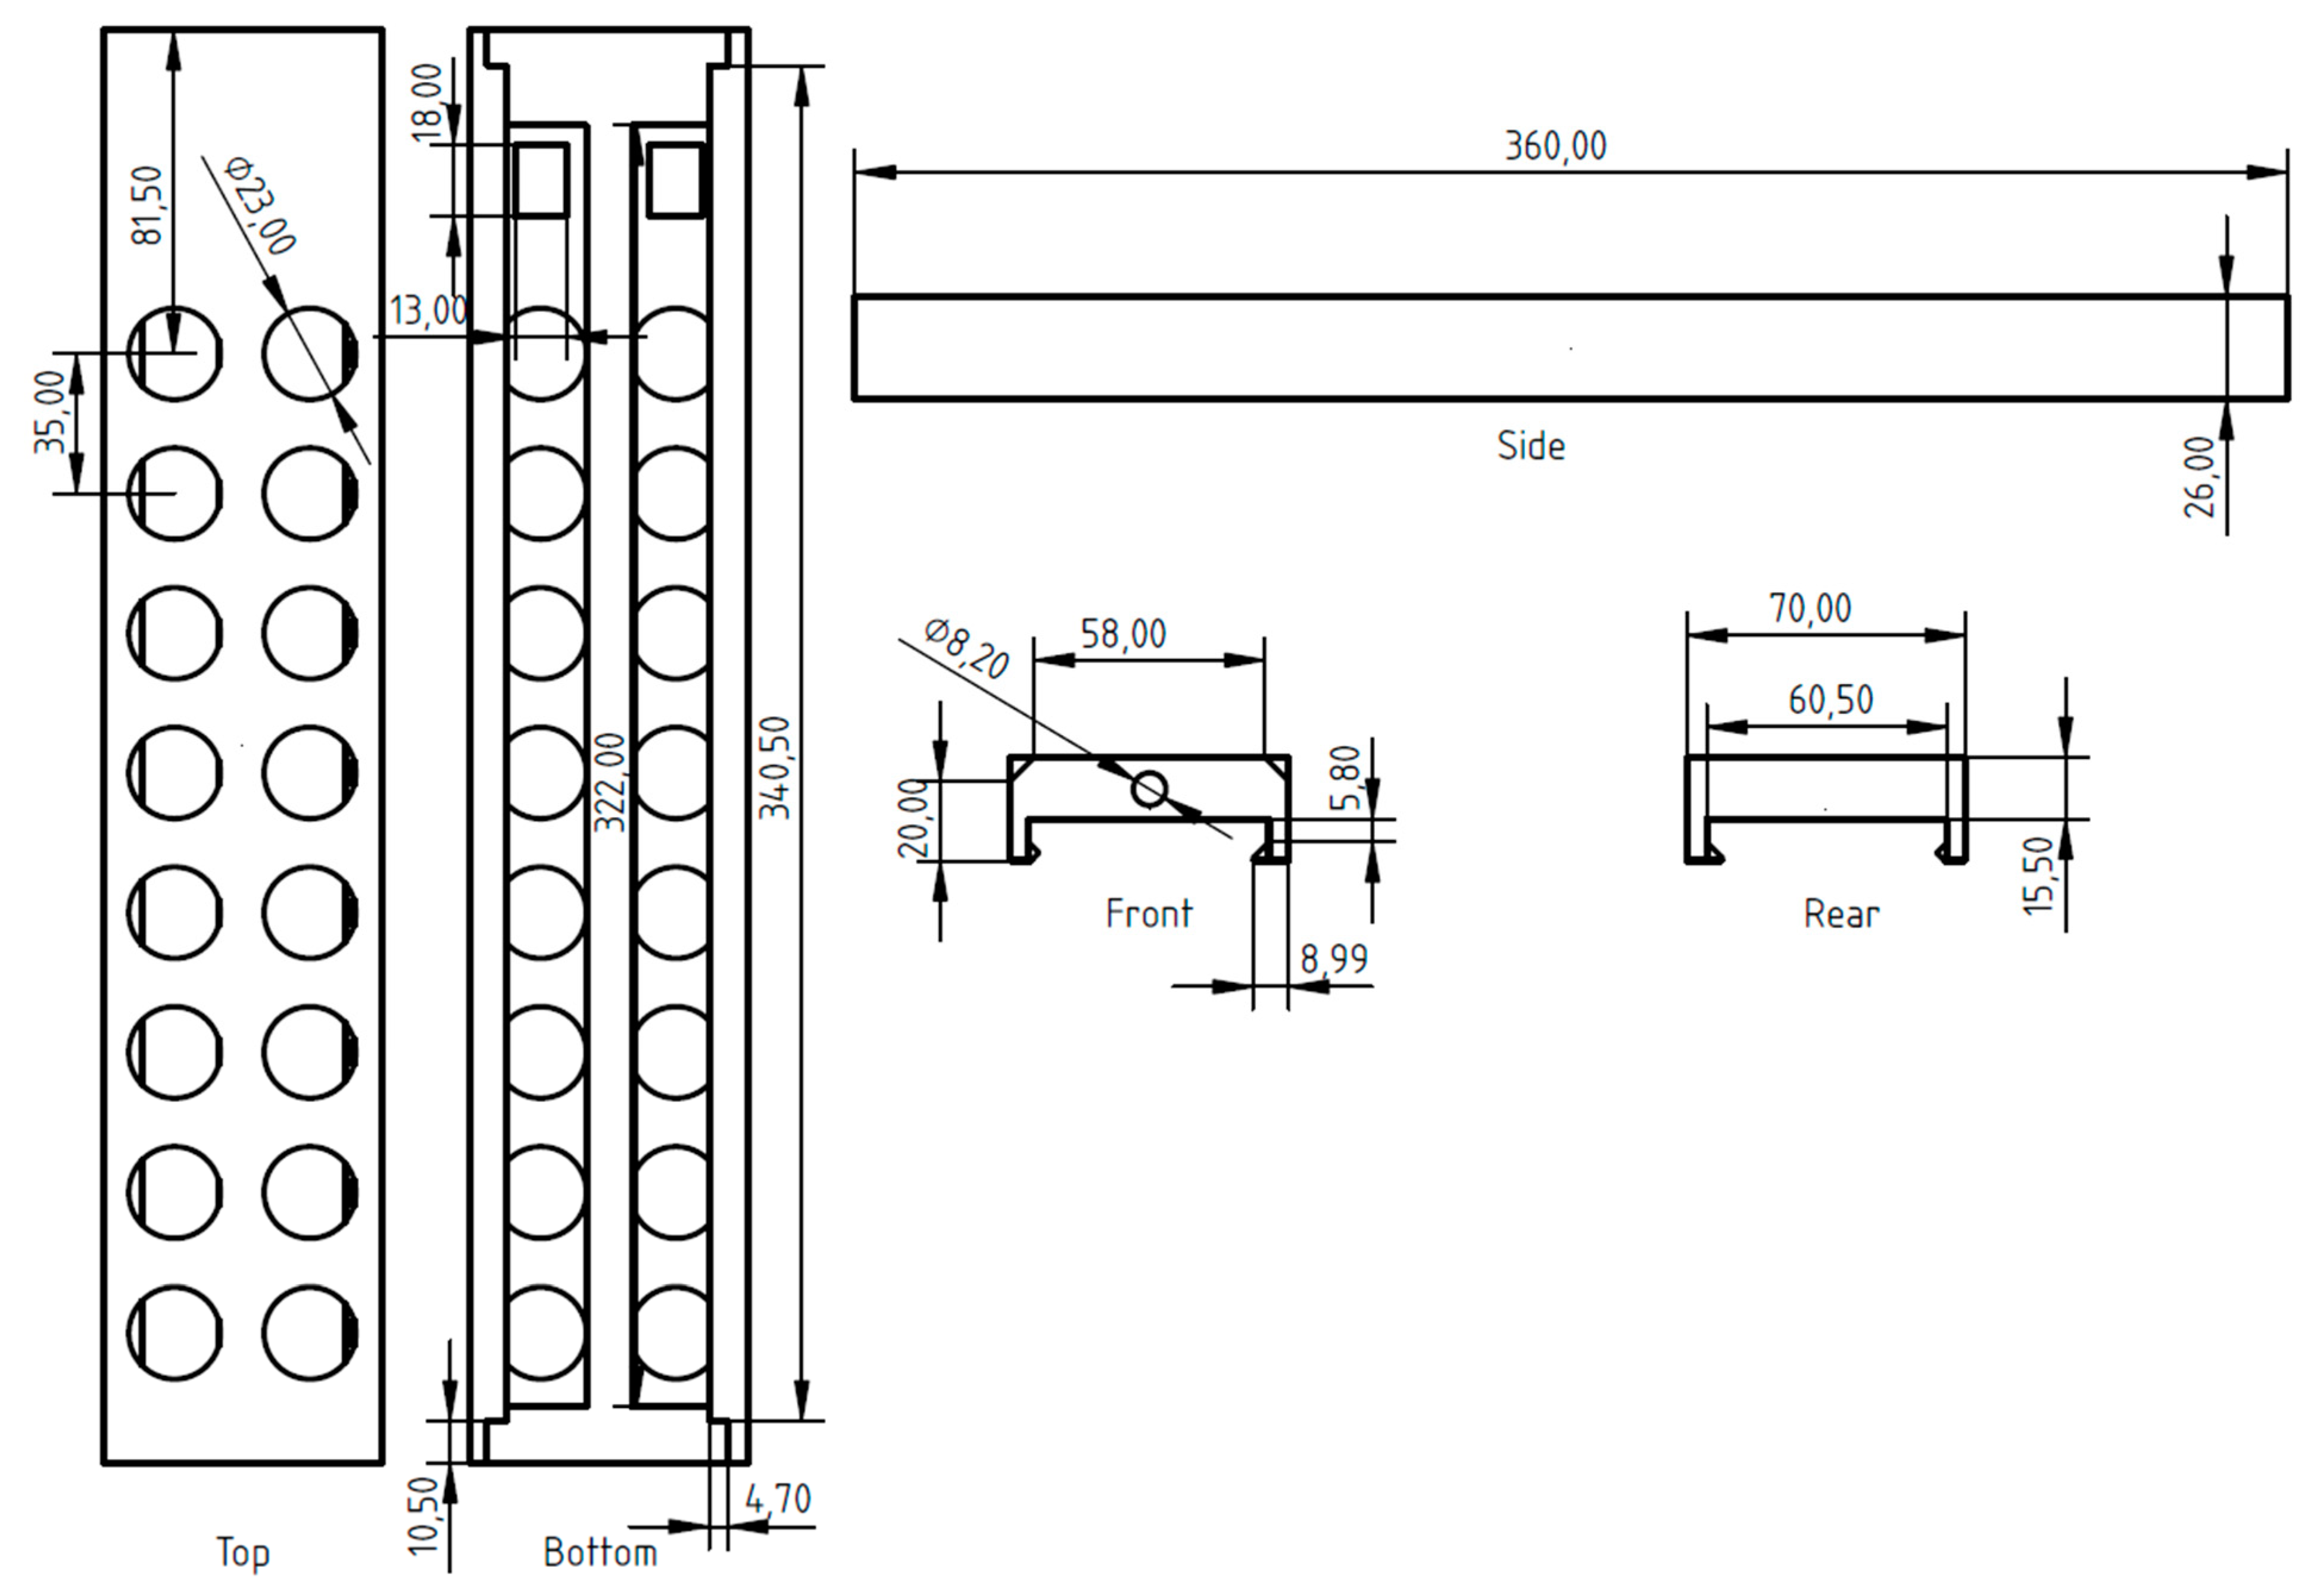
2.6. Illumination Modules

New modules were designed and built in-house to provide LED illumination at the bottom of each single-use bioreactor. Each illumination module provided a dynamic light supply for two rows of mL-scale stirred-tank bioreactors in the bioreaction unit (Figure 2). The housing of the illumination modules (Figure 2a and Figure A2), the aluminum heat exchanger (Figure 2f and Figure A3), the light sensor fixture (Figure A4), and the controller housing (Figure A7) were designed with open source CAD software (FreeCAD, Version 0.19, Computer Software, (2022), https://freecad.github.io/SourceDoc/, accessed on 1 August 2022). The aluminum circuit board (Figure 2c) was designed with Fusion360 (Autodesk, San Rafael, CA, USA) and obtained from Fischer Leiterplatten GmbH (Witten, Germany). Designs for all 3D-printed parts were sliced with PrusaSlicer 2.2.0 software (Prusa Research, Prague, Czech Republic) and printed with a filament printer (Prusa i3 MK3, Prusa, Prague Czech Republic). Filaments made from polyethylene terephthalate (PETG, Extrudr, Lauterach, Austria) were used for the controller unit, and thermoplastic polyurethane filaments (TPU hard, Extrudr, Lauterach, Austria) were used for the illumination module housing and light sensor fixture.
White LEDs (Nichia NF2W757GT-F1, Nichia Corporation, Anan, Japan) with a broad spectrum were selected as the light sources for the illumination modules. Figure 3 compares the spectrum of such an LED with the solar reference spectrum. Both cover the PAR range of 400–700 nm. The LED spectrum was measured with a miniature spectrometer (FLAME, Ocean Optics, Ostfildern, Germany).
The LEDs were soldered to a circuit board with six LEDs illuminating each reactor position and eight reactor positions in total. Two circuit boards were placed on an aluminum heat exchanger (Figure 2). A water-carrying pipe was laid through the aluminum body, which in turn was connected to a flow cooling unit (Kühleinheit 230 V/400 W, FRYKA-Kältetechnik GmbH, Esslingen am Neckar, Germany). The LED cooling temperature was set to 16 °C and controlled by the flow cooling unit. All components were mounted tightly inside the housing of the illumination modules to ensure precise positioning of the LEDs beneath the bioreactors. The white plastic of the housing separates each individual lighting position both from external light and the light from neighboring positions. Each module is able to illuminate 16 parallel stirred-tank bioreactors. If two or three modules are used, the cooling circuits are connected in series. The power supply jack (SAL8 FK30, CONEC Elektronische Bauelemente Gmbh, Lippstadt, Germany) is attached to the front of the housing and connected to the two circuit boards. The illumination module is placed underneath the parallel mL-scale stirred-tank bioreactor unit where it illuminates each reactor bottom individually (Figure 4). The white housing and white circuit board efficiently reflect the light towards the bottom of each reactor. The round openings 23 mm in diameter close tightly with the reactor bottoms.

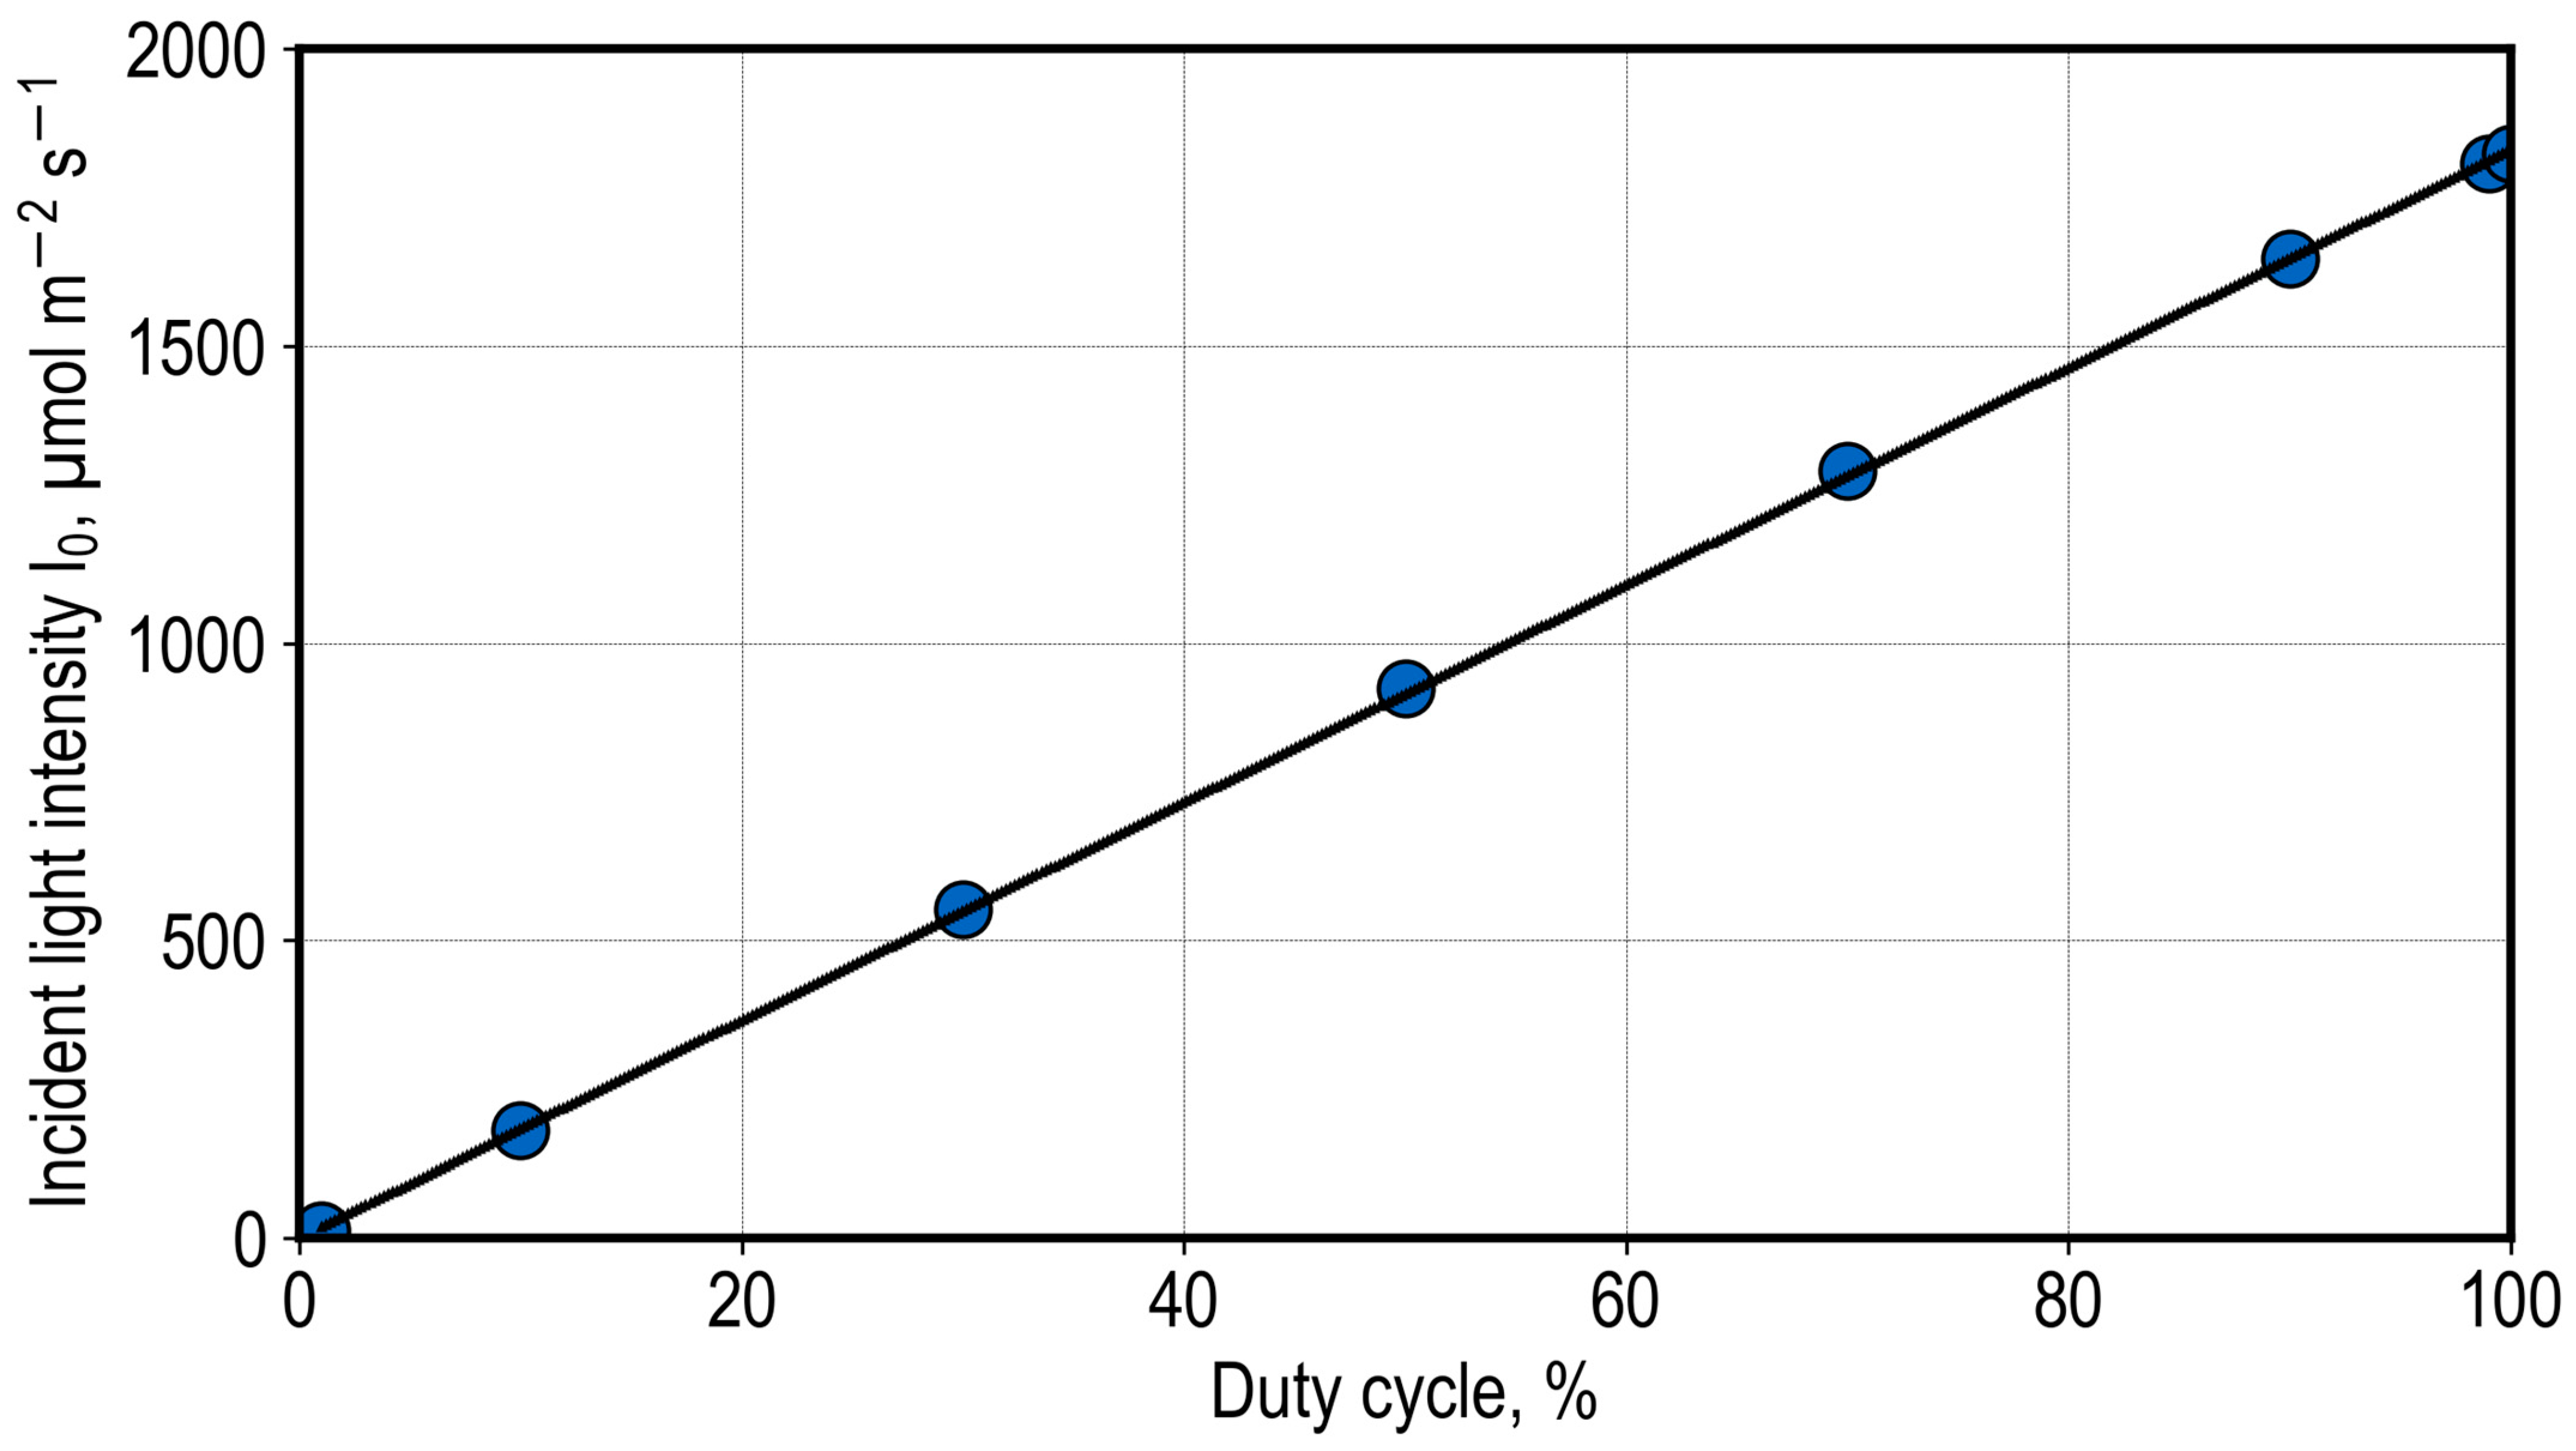
2.7. Determining Incident Light Intensities

The incident light intensities of a reactor position were measured using a miniature spectrometer (FLAME, Ocean Optics, Ostfildern, Germany) by sequentially recording the measurements and calculating an average value. The sensor head was positioned perpendicularly to the light source with a 3D-printed fixture (Figure A4). The incident light intensity was determined to be 400–700 nm (PAR range). Based on the LED-specific spectrum, a correlation factor of 4.64 from W m−2 to µmol m−2 s−1 was used.

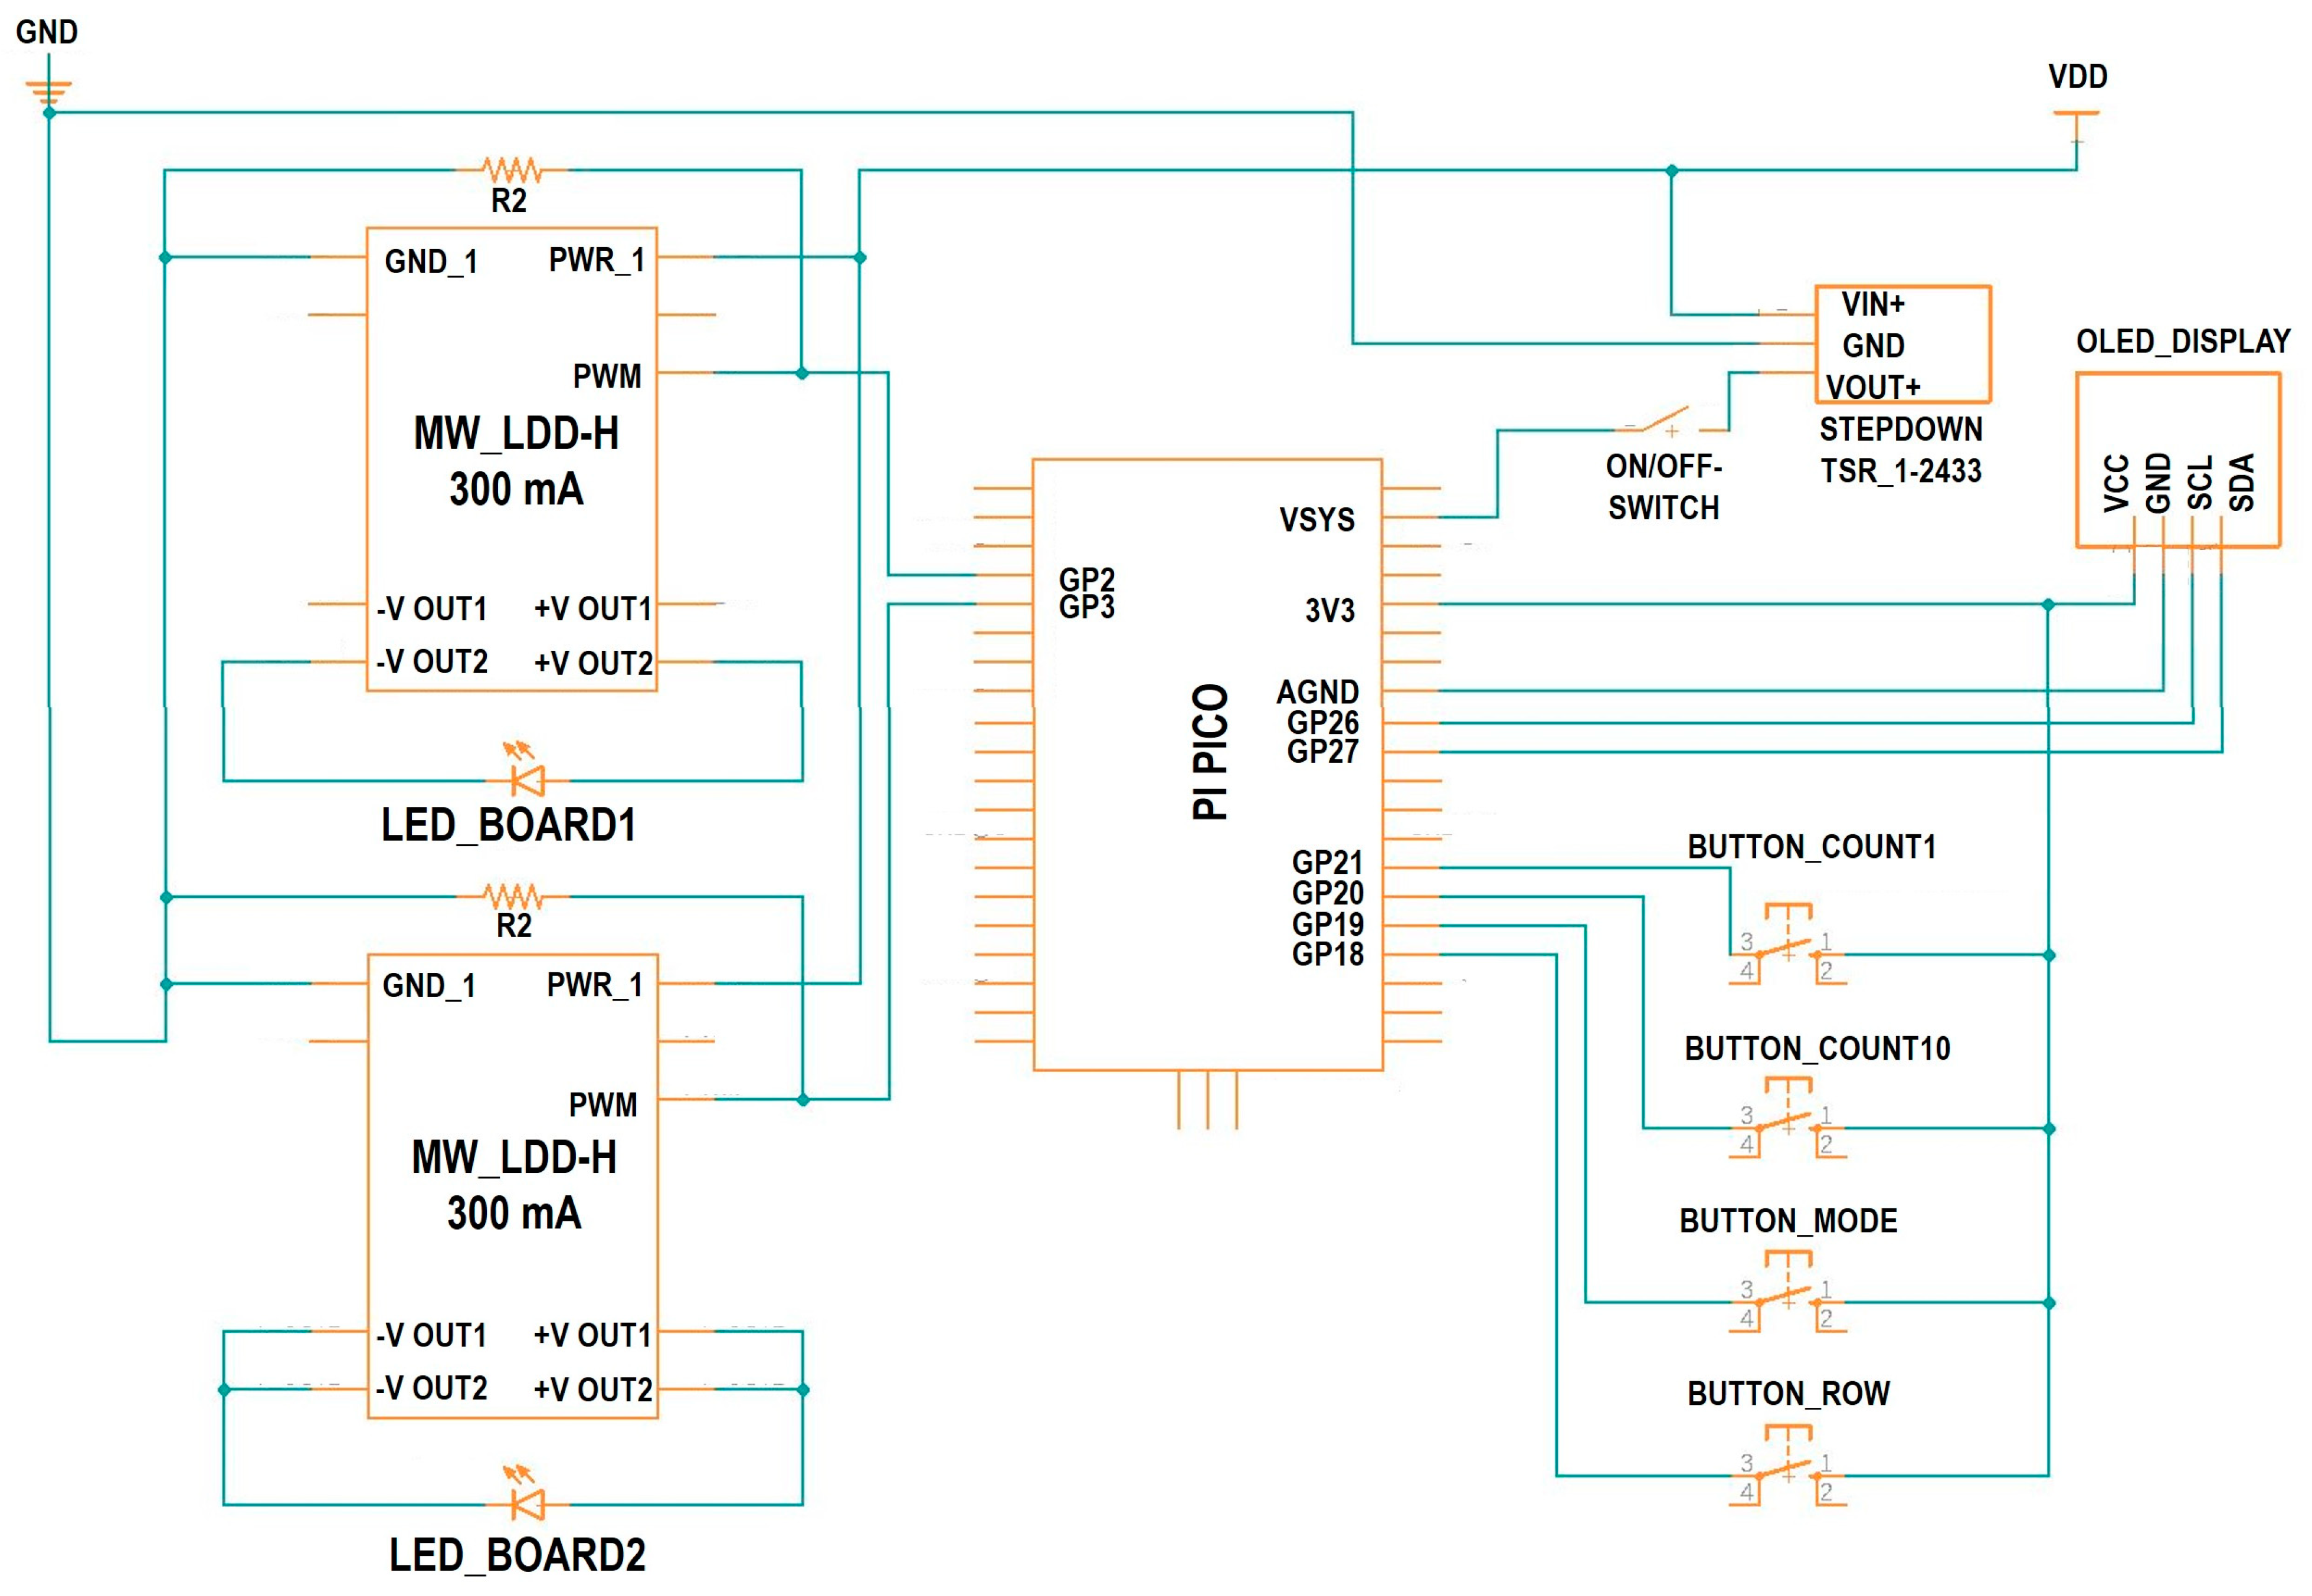
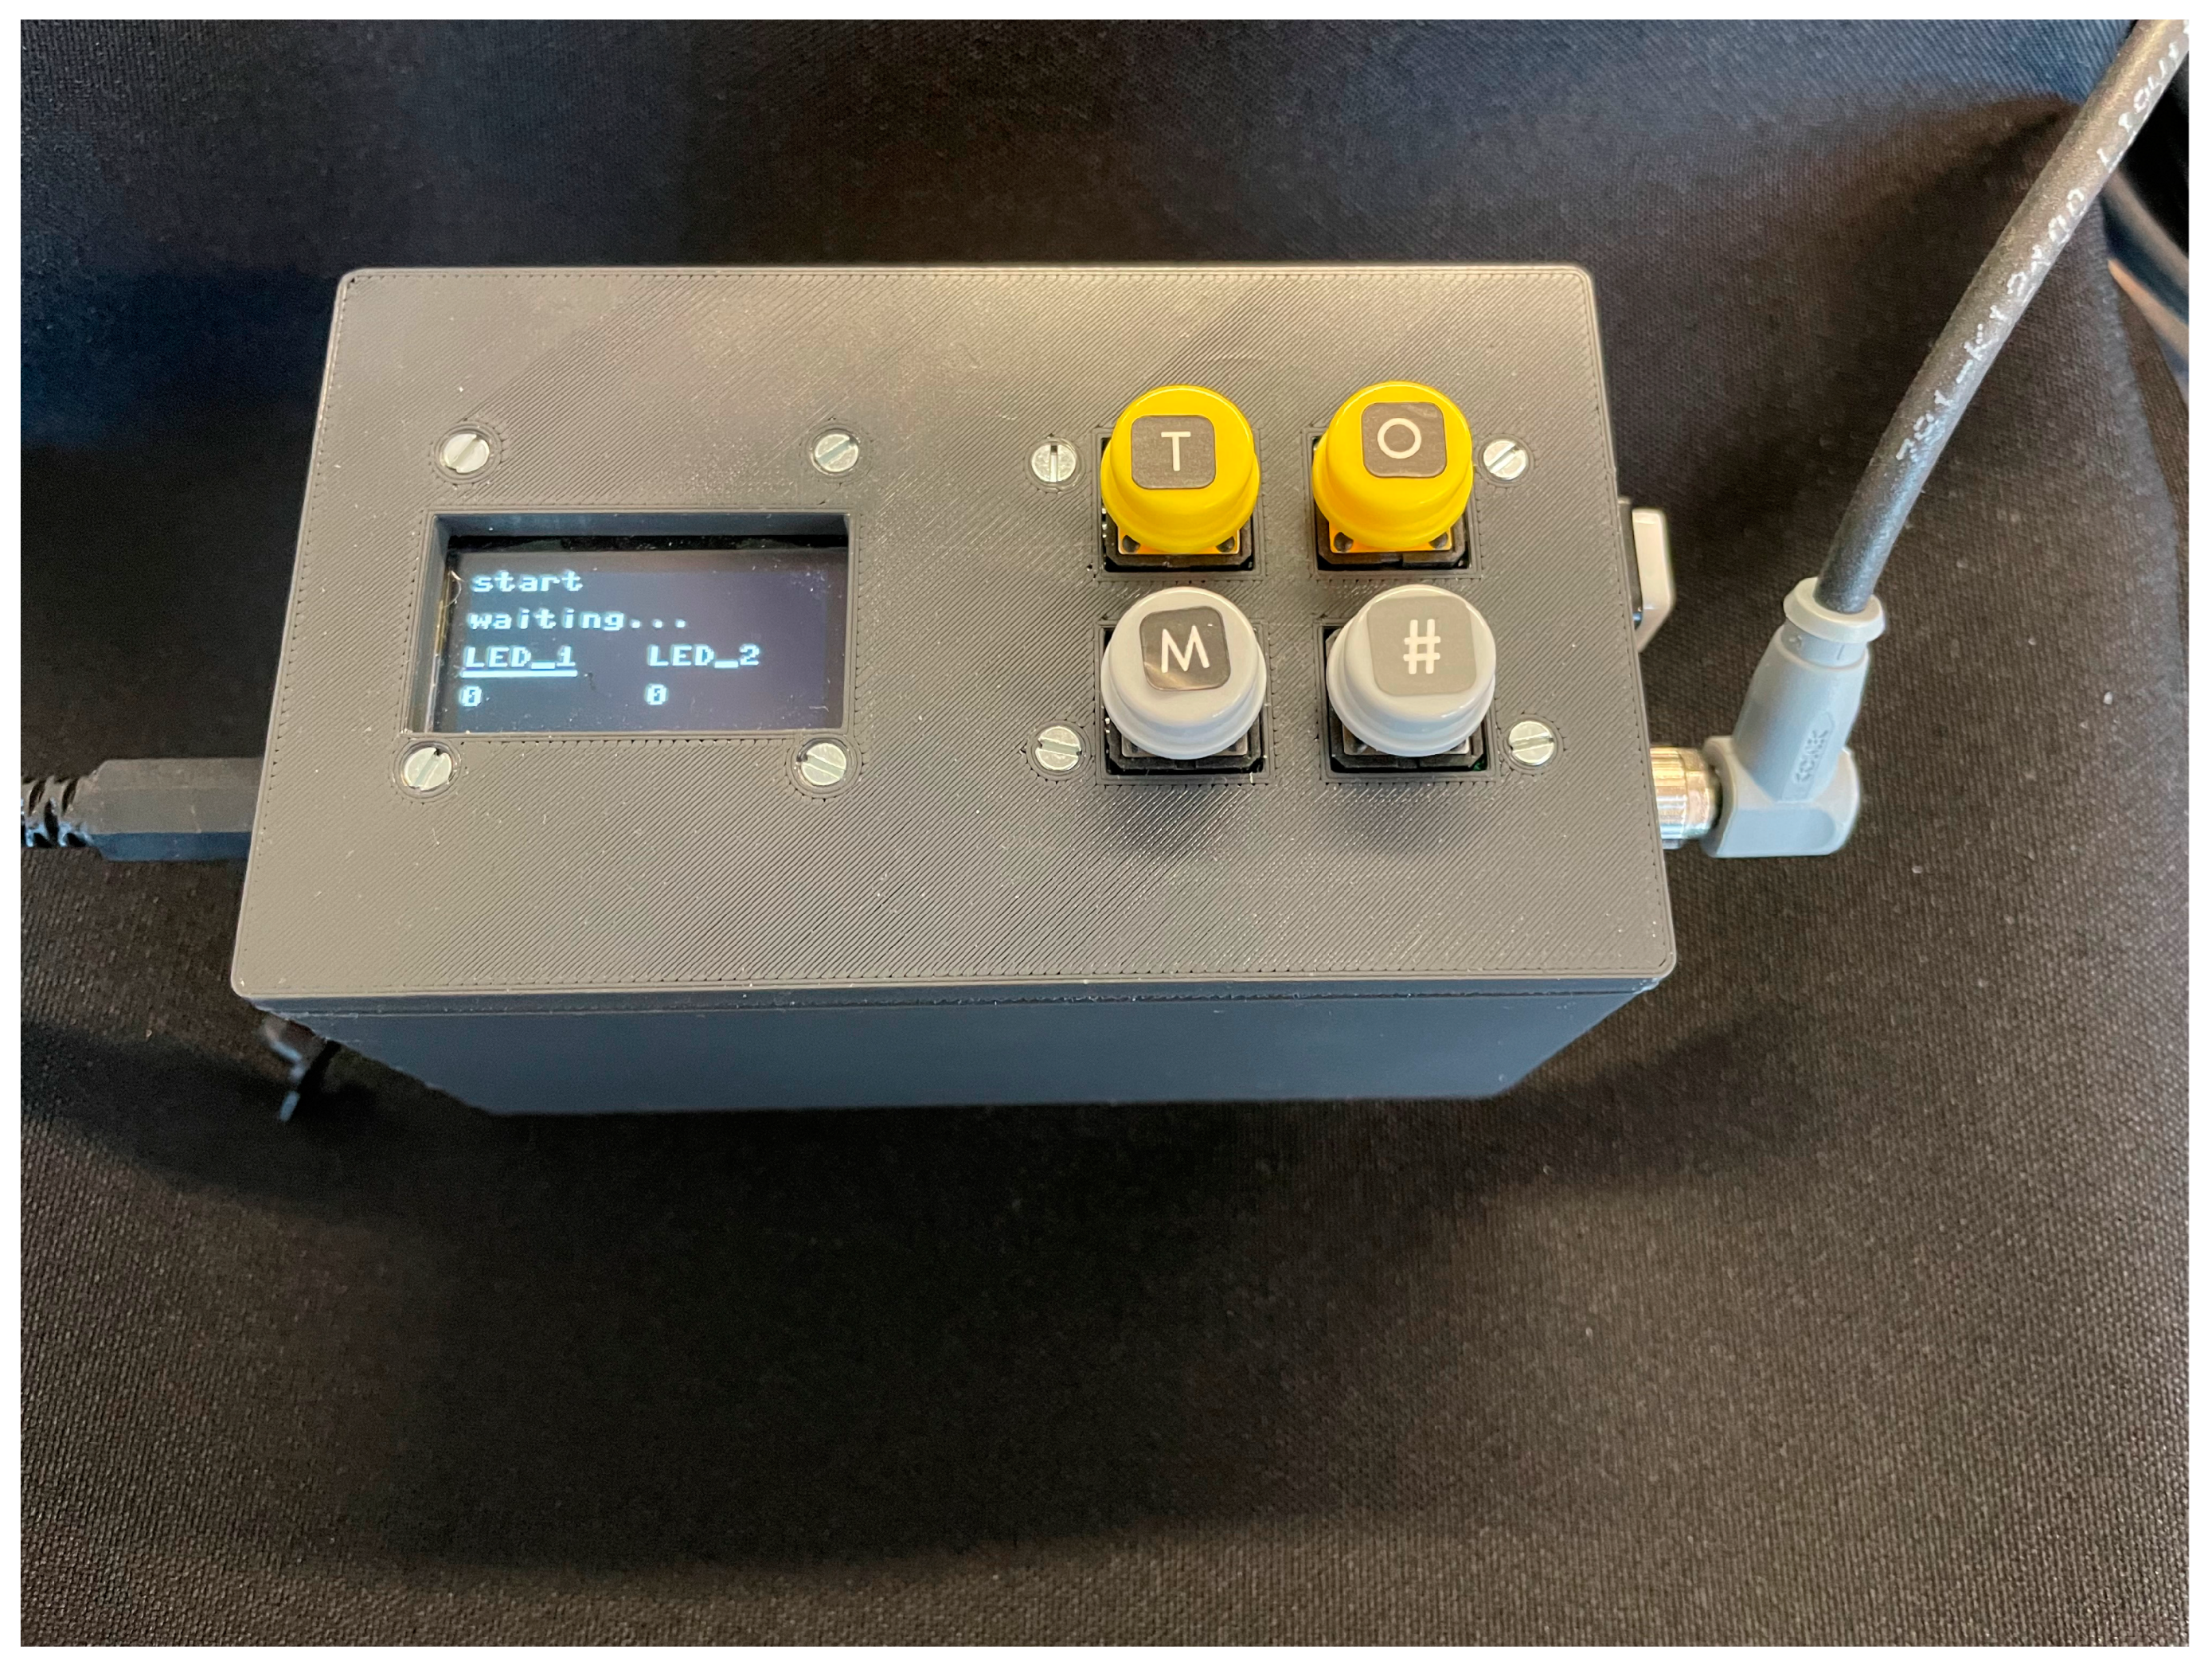
2.8. LED Power Supply and Controller

The in-house-built controller unit powers and regulates two groups of LEDs separately. This enables the illumination of reactors to be turned on or off in groups of eight as well as dimmed. The built-in constant current source (MeanWell LDD 300 H, Mean Well Enterprises, New Taipei City, Taiwan) supplies 300 mA at a maximum voltage of 32 V. Groups of six parallel LEDs were connected in series. The constant current source (LDD-300H, Mean Well, New-Taipeh City, Taiwan) was dimmed by a pulse-width modulation (PWM) interface connected to the microcontroller (Raspberry Pi Pico, Raspberry Pi Foundation, Cambridge, UK). The emitted light intensity was measured over the distance from LED to reactor bottom (15 mm) and is shown in Figure A5. Incident light intensities between 0 and 1817 µmol m−2 s−1 had a linear correlation and could be adjusted precisely. The duty cycle of the PWM was selectable between 0 and 100% with a theoretical accuracy of 65,535 steps. Three controller units and three illumination modules were required for the parallel photoautotrophic cultivation of microalgae in 48 stirred-tank bioreactors.
An electronic schematic diagram of the controller unit is presented in Figure A6. A separate power connection was needed for each illumination module due to the use of a step-down transformer (TSR 1-2433-, Traco Electronic, Baar, Switzerland), which supplies 3.3 V to the microcontroller. A haptic power switch was used to turn the microcontroller on and off. The microcontroller (Raspberry Pi Pico with RP2040, Raspberry Pi Foundation, Cambridge, UK) transmitted PWM signals to both of the 300 mA constant current sources. Each current source powered the LEDs for eight reactor positions. The controller unit could be set either using tactile buttons for easy control or remotely via a USB port. The OLED display was powered by the microcontroller and showed the selected mode, the time, and the light intensity in % or µmol m−2 s−1. All components of the controller unit were mounted inside 3D-printed housing (Figure A7).
The LED control software v1 (see Supplementary Materials for details) was written in MicroPython and saved as a main.py file on the microcontroller ROM. After the microcontroller was supplied with power, the script was executed and the display and other devices initialized. The software controlled two rows of LEDs at once and adjusted their light intensities. Three different modes could be selected, and the active mode was shown on the display. The start mode was the home screen, where LEDs were turned off and the program was waiting for input. The input from the buttons could be detected and executed in all three modes. In constant mode, the LEDs turned on at the selected value. The internal real-time clock of the microcontroller was used to display the time from the start of illumination in constant mode. Although the timer was of millisecond accuracy, it displayed only the day, hour, minute, and second while running. A CSV file containing weather data from Almeria, Spain was saved on the ROM to enable execution of the day/night mode. The file had two columns: the date and time, and the respective radiation given as the light intensity W m−2, with values recorded for each minute. Due to the limited random access memory size, only every 10th row was read into it, with the light intensity (W m−2) subsequently being translated to photon flux density (µmol m−2 s−1) using a conversion factor of 0.4 (conversion for PAR range) × 4.64 (conversion for spectrum and units).
The counter was interpreted as the percentage dilution factor by which the light intensity read from the CSV file was reduced. The light intensity was updated every 10 min. Date, time, and partial photon flux density in µmol m−2 s−1 were displayed when in day/night mode.

3. Results and Discussion

3.1. Photoautotrophic Cultivations of M. salina in Miniaturized Stirred-Tank PBR at Constant Incident Light Intensities

Photoautotrophic and pH-controlled growth of M. salina were studied with varying constant incident light intensities using the newly designed illumination modules in conjunction with the bioreaction unit. To check the reproducibility of the microalgal growth, one row of eight stirred-tank bioreactors was illuminated at the same incident light intensity. The effects of altogether 12 different constant incident light intensities were investigated in the course of two automated experiments, each consisting of 48 stirred-tank bioreactors in parallel. The growth of M. salina was monitored at-line by measuring OD750 (Figure 5).
Growth of M. salina commenced with no lag phase in all 48 parallel PBRs immediately after placing the bioreaction unit with the inoculated stirred-tank bioreactors on the deck of the LHS and switching on the illumination modules (Figure 4c). The specified step time of 12 h for OD750 measurements does not allow the identification of short lag phases. Biomass formation of M. salina in the first 12 h, automatically measured at-line as OD750, was significantly higher than in the subsequent exponential growth phases, independent of the varying incident light intensities between 100 and 1000 µmol m−2 s−1. After inoculation, the microalgae culture has to adapt to the new environment with higher light intensity compared to the preculture preparation, which should actually cause an initial lag phase. The reasons for the rapid increase in OD750 within the first 12 h are unknown. OD measurements may be affected by changes in the optical characteristics of the microalgae at the wavelength applied (e.g., morphological adaptation of the cells).
Individual constant exponential growth of M. salina was observed in the following 3–3.5 d (process times with constant exponential growth rates are shown in Figure 5) after which a more or less linear increase in OD750 was measured. Relative standard deviations of OD750 were lower in the first 3 d of the batch processes (<8.5% on average) but increased until Day 6 to 10% on average at the maximum. These deviations are in the same range as previously reported with heterotrophic parallel cultivations of microorganisms in miniaturized stirred-tank bioreactors [43,61,62,63].
It should be pointed out that the flashing light does not affect the growth of M. salina in the parallel stirred-tank PBRs, as the PWM dimming frequency of the LEDs was set to 1000 Hz. In the literature, the flashing light effect was evaluated at frequencies of 1–100 Hz [64,65]. For example, a frequency of 5–10 Hz indicated an increased yield of Chlamydomonas reinhardtii biomass compared to constant incident light, but, at 100 Hz, the results were comparable [66].
Due to the long process times of microalgae cultivation, which can extend over several days, varying evaporation rates in the parallel PBRs may result in increased standard deviations. As described above, evaporation is compensated for by employing individually measured liquid levels in the parallel stirred-tank PBRs followed by liquid level correction by the individual addition of sterile water. The total added volume was tracked for each of the parallel PBRs, and a mean evaporation rate was estimated. The individual evaporation rates are plotted in Figure 6.
The evaporation rates varied over the range 94.0–119.4 µL h−1, with an average of 104 ± 5.7 µL h−1. It is clear that automated individual liquid level corrections are necessary if dry air is used for gassing the parallel stirred-tank PBRs.
Depending on the reactor position, the 5.5% mean difference in the evaporation rates may not reduce parallel reproducibility in typical heterotrophic batch processes from a few hours up to one day. However, the slow growth of microalgae in photoautotrophic batch processes between several days and several weeks will result in notable differences in the reaction volumes in the stirred-tank PBRs with non-individual compensation of evaporation. Thus, individual measurement of liquid levels in parallel PBRs followed by liquid level correction is sure to improve the parallel reproducibility of photoautotrophic bioprocesses. Incidentally, evaporation compensation is not only common but also an important factor in microalgae cultivation independent of the photobioreactors employed [67].
A second parallel photoautotrophic growth study with 48 stirred-tank bioreactors was performed with M. salina (Figure 7). The incident light intensities were varied in each row of eight stirred-tank bioreactors over the range 40–1817 µmol m−2 s−1 to enable investigation of the effects of both lower and higher constant incident light intensities in comparison with the previous study.
As before, no lag phase was observed at low-incident light intensities. Constant exponential growth of M. salina following the initial high biomass formation was observed for up to 3.5 d before any linear increase in OD750 was measured. In contrast, lag phases of 1.5 d after the initial high biomass formation were seen at high-constant-incident light intensities of 1400–1817 µmol m−2 s−1. The following exponential growth phases of M. salina were reduced to 2 d before the linear increase in OD750 took place. The relative standard deviations of the OD750 measurements were higher at the end of the batch processes with the highest incident light intensity (up to 15% at 1400 µmol m−2 s−1, and up to 28% at 1800 µmol m−2 s−1, respectively).
The pH in the parallel stirred-tank PBRs may have an influence on both exponential growth rates and OD750 after 6 d. As an example, the at-line measured pH is shown in Figure 7 as a function of process time. The pH was measured at-line and controlled with a step time of 12 h.
Even though the initial pH of the ASW medium was pH 8.0 before inoculation, the pH dropped to pH 7.3 at the beginning of the batch processes due to the 2% CO2 in the air used for gassing. After three additions of a base by the LHS at process times of 0 d, 0.5 d, and 1.0 d, respectively, the lower boundary of the uncontrolled pH range (pH 7.7) was reached in all of the 48 parallel PBRs. Subsequently, the pH increased due to the fixation of CO2 by the microalgae in suspension, and no further base or acid addition was necessary. After 5 d, the pH started to decrease in the stirred-tank PBRs with constant incident light intensities of 150 µmol m−2 s−1 or higher, but pH titration was not necessary (>pH 7.7). The decreasing pH correlates with the decreasing growth rate (see Figure 7), as less CO2 is consumed toward the end of the process.
The pH control adjusts the initial pH rather slowly, but most microalgae are tolerant of a neutral or slightly alkaline pH [68] and have a broad pH optimum for growth [31,59].
In Figure 8, the estimated exponential growth rates of the individual batch processes are plotted as a function of the constant incident light intensities and the optical density OD750 on Day 6.
Exponential growth rates of M. salina and OD750 after 6 d increase non-linearly with increasing incident light intensities up to 250 µmol m−2 s−1. The exponential growth rates and optical densities OD750 attained were subsequently constant (µopt ~0.5 d−1) within the estimation error, indicating a slight limitation of the microalgae in suspension. A significant reduction in the exponential growth rate of M. salina can be clearly seen at the highest incident light intensity of 1830 µmol m−2 s−1, indicating slight inhibition of the microalgae in suspension. Although the estimated exponential growth rates and the OD750 data were generated in two separate experiments, the values fit the trend of the curves within the estimation errors, indicating sequential reproducibility.
The maximum growth rates of M. salina observed in the parallel stirred-tank PBRs with constant illumination (µopt = 0.525 d−1) were compared with the literature data (Table 1). M. salina strains, media, illuminated layer thickness, and reactor types were found to vary considerably, making direct comparison difficult. Optimum growth rates of M. salina are reported between 0.1 and 1.3 d−1 [17,69,70,71,72]. The maximum OD750 measured in the stirred-tank PBRs is comparable to data published by Pfaffinger et al. [30] reporting on photoautotrophic batch cultivations of M. salina using a flat plate gas-lift PBR on a liter-scale with a layer thickness of 2 cm.

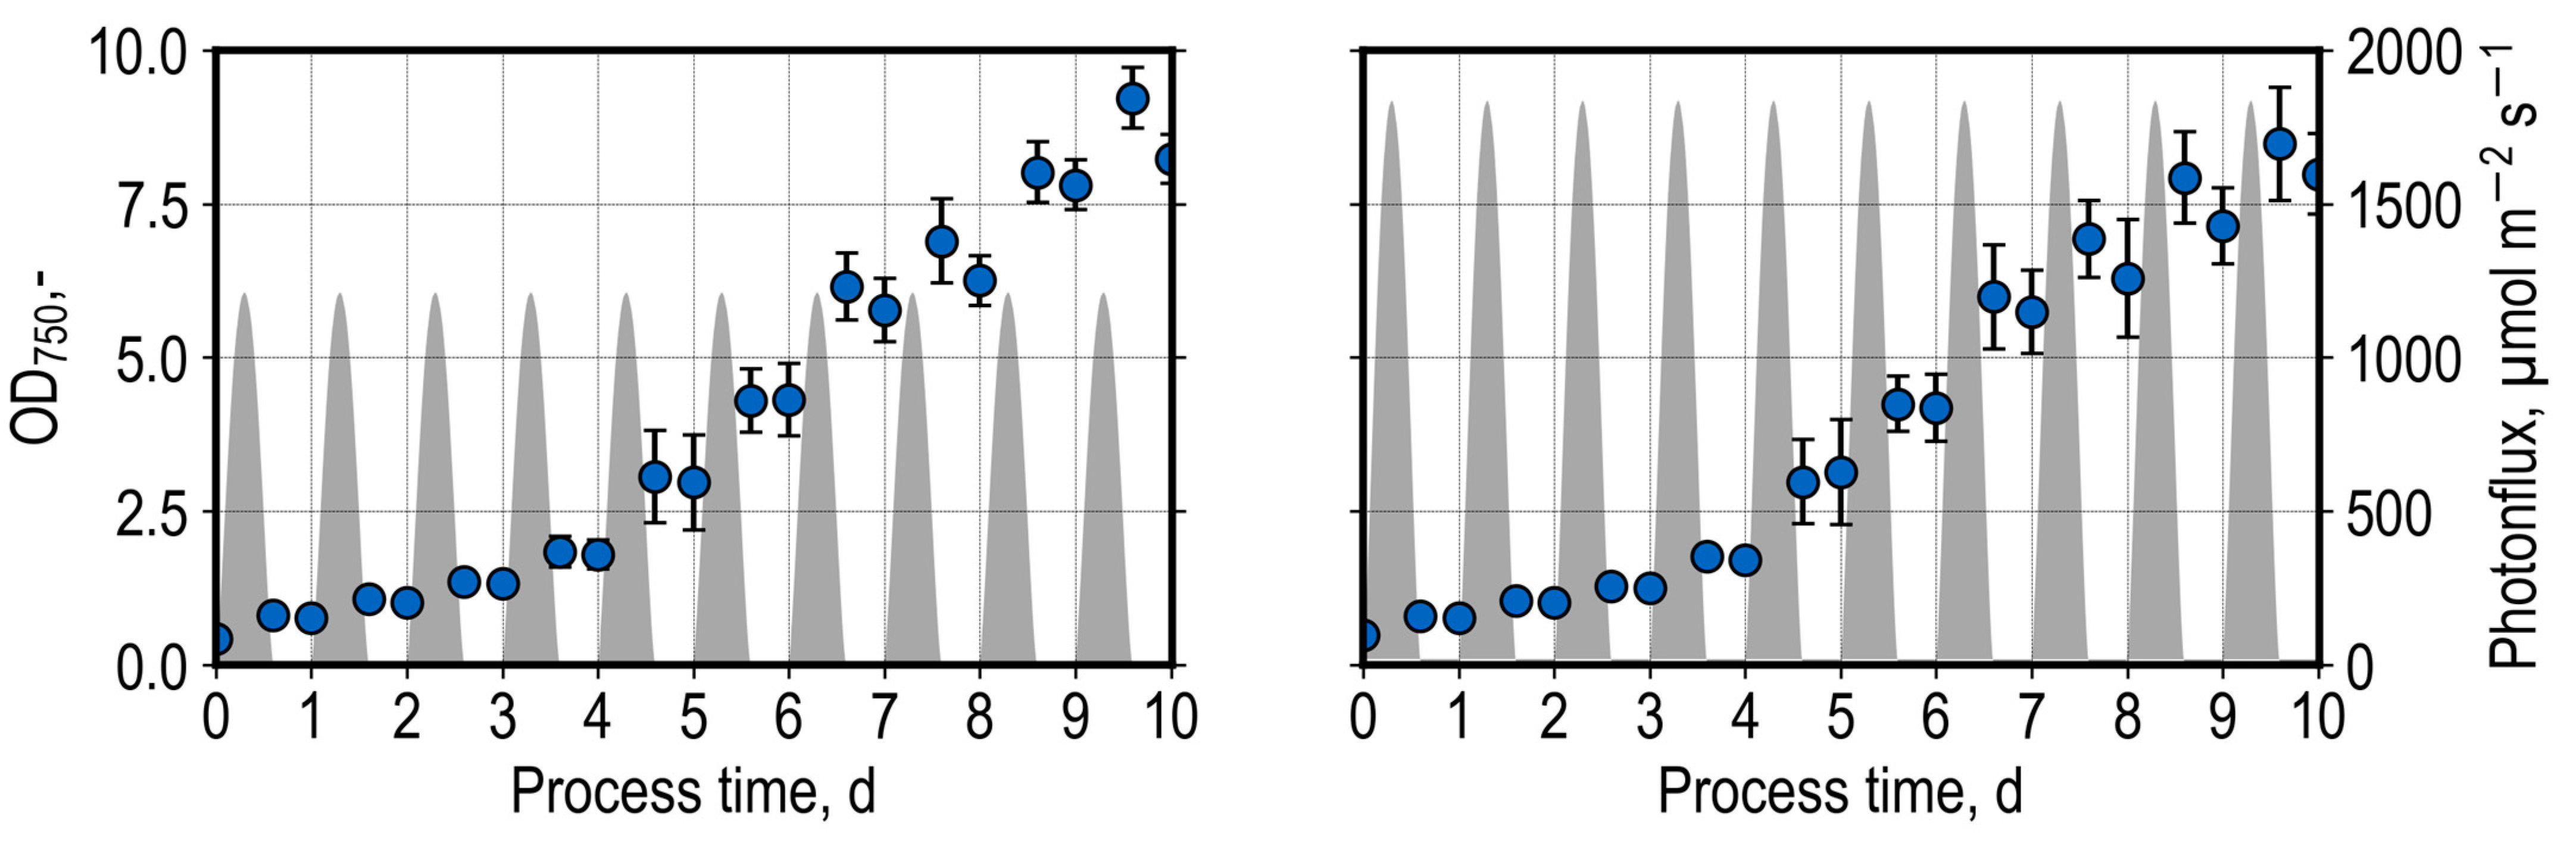
3.2. Photoautotrophic Cultivations of M. salina in Miniaturized Stirred-Tank PBRs with Day and Night Cycles

Outdoor cultivations of microalgae are subject to variations in temperature and incident light intensities arising from natural day and night cycles. For this reason, day and night cycles of incident light intensities and temperatures configured to imitate typical Mediterranean climate conditions (repeated summer day in Almeria, Spain, recorded by DLR at Plataforma Solar de Almería on 15 June 2012, courtesy of S. Wilbert) were applied in this study to enable investigation of the growth of M. salina in 16 miniaturized parallel stirred-tank PBRs (Figure 9). One row of 8 parallel PBRs was illuminated with 66% of the incident light intensities, while illumination of the second row followed real-world climate data. Reducing the light intensity to 66% is intended to give an indication of growth in conditions of less sunlight, e.g., due to a cloudy sky.
The microalgae displayed behavior that is typical of day and night growth, with biomass formation for as long as light was available and biomass decay when there was no light. No significant differences were observed when following the real Mediterranean climate data compared with the reduced incident light intensities (66%). Mean OD750 values of 8.96 ± 0.84 (100% illumination) and 9.89 +/− 0.68 (66% illumination), respectively, were measured after 9.5 d. The pH varied between 7.5 and 8.0. The maximum volumetric productivities were reached at Day 6: 0.81 g L−1 d−1 (100%) and 0.83 g L−1 d−1 (66%), respectively. This corresponds with the results obtained with M. salina in photoautotrophic batch processes at constant incident light intensities of 250–1000 µmol m−2 s−1 (Figure 5).
The maximum volumetric productivities of M. salina observed in the parallel stirred-tank PBRs with day and night cycles are compared to data from the literature (Table 2). Only Pfaffinger et al. [17] reported higher volumetric productivities (4 g L−1 d−1) with the same microalgal strain, climate simulation, and artificial seawater medium. This is due to the smaller layer thickness of 6 mm compared to 35 mm in the parallel stirred-tank PBRs, which enable exponential growth at higher CDW concentrations.

4. Conclusions and Outlook

New LED illumination modules enabled a commercial MBR system to be operated in an LHS for the photoautotrophic cultivation of microalgae in 48 parallel stirred-tank bioreactors at six different incident light intensities, either with varying constant LED illumination or based on dynamic day and night cycles. This facilitates automated microalgae strain screening and bioprocess development under realistic reaction conditions, even in outdoor applications. In addition to the adapted illumination modules, automated measured liquid levels in the parallel stirred-tank PBRs followed by individual liquid level correction are prerequisites for successful operation to compensate for evaporation because of the long process times of several days up to weeks in batch processes. The parallel reproducibility of microalgae growth was in the same order of magnitude compared to heterotrophic bioprocesses with the automated MBRs. This was shown with the example of photoautotrophic growth studies with M. salina with a relative standard deviation of OD750 of up to 10% at the maximum with the exception of high-photoinhibiting incident light intensities of 1400–1800 µmol m−2 s−1. As a consequence, the bioreaction unit in combination with the illumination module has the potential to significantly accelerate bioprocess development with photoautotrophic microorganisms.
The transfer and scale-up of phototrophic bioprocesses will necessitate estimating the microalgae growth kinetics as a function of the mean light availability in the suspension, assuming that light is the limiting state variable. The mean integral photon flux density is a function of incident light intensity, microalgae cell concentration, homogeneity in suspension, light penetration depth, light absorption, and reflection physics in the cell suspension. It is thus a function of the geometry of the single-use photobioreactors. Consequently, future research needs to characterize the issues in miniaturized stirred-tank PBRs, and scale-up studies need to be performed to enable the direct transfer of photoautotrophic bioprocesses, even if completely different PBRs are subsequently used on a production scale.

Supplementary Materials

The following supporting information can be downloaded at: https://0-www-mdpi-com.brum.beds.ac.uk/article/10.3390/app13085064/s1, main.py (LED control software), Almeria.csv (light data), sh1106.py (display driver).

Author Contributions

Conceptualization, P.B. and D.W.-B.; methodology, P.B., F.J.L., N.B. and N.v.d.E.; software, P.B. and F.J.L.; validation, P.B.; formal analysis, P.B.; investigation, P.B. and J.E.O.V.; resources, D.W.-B.; data curation, P.B.; writing—original draft preparation, P.B.; writing—review and editing, D.W.-B.; visualization, P.B.; supervision, D.W.-B.; project administration, D.W.-B.; funding acquisition, D.W.-B. All authors have read and agreed to the published version of the manuscript.

Funding

Funding was provided by the Technical University of Munich (TUM), Munich, Germany.

Institutional Review Board Statement

Not applicable.

Data Availability Statement

The data presented in this study are available on request from the corresponding author.

Acknowledgments

The support of Philipp Benner and Nikolas von den Eichen by the TUM Graduate School (Technical University of Munich, Germany) is gratefully acknowledged. The authors would like to thank Karlis Blums and Lukas Bromig (Chair of Biochemical Engineering, Technical University of Munich, Garching, Germany) for their fruitful discussions.

Conflicts of Interest

The authors declare no conflict of interest.

Abbreviations

ASWartificial seawater
CDWcell dry weight
dday
EPAeicosapentaenoic acid
FPflat plate
LHSliquid handling station
MBRmicrobioreactor
M. salinaMicrochloropsis salina
MTPmicrotiter plate
OD750optical density at 750 nm
PARphotosynthetically active radiation
PBRphotobioreactor
PWMpulse-width modulation
ROMread-only memory
rpmrevolutions per minute
TLCthin-layer cascade

Appendix A

Figure A1. Calibration curve of a microplate with integrated chemical optical pH sensors (intensity ratio IR as function of pH). The sensors are read from the bottom using a fluorescence reader with wavelengths of 485/540 nm and 485/620 nm. IR was measured in triplicate (standard deviation < 1%). The calibration is valid for an artificial seawater (ASW) medium at room temperature. Identified correlation parameters: Imin = 0.115; Imax = 17.635; pH0 = 7.048; dpH = 0.582. Imin and Imax represent the horizontal asymptotes of the sigmoidal calibration curve (--), pH0 is the inflection point (-.), and dpH affects the curve width.
Applsci 13 05064 g0a1
Figure A2. Technical drawing of the illumination module housing. Dimensions in mm. A comma is used as decimal separator in this figure.
Applsci 13 05064 g0a2
Figure A3. Technical drawing of the heat exchanger. Dimensions in mm. A comma is used as decimal separator in this figure.
Applsci 13 05064 g0a3
Figure A4. Technical drawing of the spectrometer sensor mount for measuring incident photon flux density. Dimensions in mm. A comma is used as decimal separator in this figure.
Applsci 13 05064 g0a4
Figure A5. Incident light intensities measured at one reactor position of an illumination module as a function of selected dimming settings between 0 and 100%. Light intensities were measured in the range 400–700 nm (PAR).
Applsci 13 05064 g0a5
Figure A6. Electronic schematic of the controller unit. The illumination module is illustrated by the LED symbol and is controlled by the MW_LDD-H constant current source with a 300 mA forward current. The PWM input signals are grounded by the 10 kΩ resistors R1 and R2. Power for the PI_PICO (Raspberry Pi Pico) is supplied by a TSR-1 step-down converter (3.3 V). The ON/OFF switch is in the form of an interconnected pressure switch. BUTTON_XYs are tactile buttons used as input signals for the script. An OLED display is directly connected to and powered by the microcontroller.
Applsci 13 05064 g0a6
Figure A7. Controller unit with tactile buttons, ON/OFF switch, OLED display, power supply, and power output. Buttons are used for switching between the modes (Button M: start, constant, and day/night) and the LED rows (Button #: Row 1 and Row 2). The other two buttons are counters for fast and precise adjustment of the light intensity. The first counter increases intensity in 10% steps (Button T). The second increases intensity in 1% steps (Button O).
Applsci 13 05064 g0a7

References

  1. Borowitzka, M.A. High-Value Products from Microalgae—Their Development and Commercialisation. J. Appl. Phycol. 2013, 25, 743–756. [Google Scholar] [CrossRef]
  2. Maltsev, Y.; Maltseva, K. Fatty Acids of Microalgae: Diversity and Applications. Rev. Environ. Sci. Biotechnol. 2021, 20, 515–547. [Google Scholar] [CrossRef]
  3. Brennan, L.; Owende, P. Biofuels from Microalgae—A Review of Technologies for Production, Processing, and Extractions of Biofuels and Co-Products. Renew. Sustain. Energy Rev. 2010, 14, 557–577. [Google Scholar] [CrossRef]
  4. Azizi, S.; Bayat, B.; Tayebati, H.; Hashemi, A.; Shariati, F.P. Nitrate and Phosphate Removal from Treated Wastewater by Chlorella Vulgaris under Various Light Regimes within Membrane Flat Plate Photobioreactor. Environ. Prog. Sustain. Energy 2021, 40, e13519. [Google Scholar] [CrossRef]
  5. Barolo, L.; Abbriano, R.M.; Commault, A.S.; George, J.; Kahlke, T.; Fabris, M.; Padula, M.P.; Lopez, A.; Ralph, P.J.; Pernice, M. Perspectives for Glyco-Engineering of Recombinant Biopharmaceuticals from Microalgae. Cells 2020, 9, 633. [Google Scholar] [CrossRef]
  6. Freudenberg, R.A.; Baier, T.; Einhaus, A.; Wobbe, L.; Kruse, O. High Cell Density Cultivation Enables Efficient and Sustainable Recombinant Polyamine Production in the Microalga Chlamydomonas reinhardtii. Bioresour. Technol. 2021, 323, 124542. [Google Scholar] [CrossRef] [PubMed]
  7. Ma, K.; Bao, Q.; Wu, Y.; Chen, S.; Zhao, S.; Wu, H.; Fan, J. Evaluation of Microalgae as Immunostimulants and Recombinant Vaccines for Diseases Prevention and Control in Aquaculture. Front. Bioeng. Biotechnol. 2020, 8, 590431. [Google Scholar] [CrossRef] [PubMed]
  8. Perez-Garcia, O.; Bashan, Y. Microalgal Heterotrophic and Mixotrophic Culturing for Bio-Refining: From Metabolic Routes to Techno-Economics. In Algal Biorefineries; Prokop, A., Bajpai, R.K., Zappi, M.E., Eds.; Springer International Publishing: Cham, Switzerland, 2015; pp. 61–131. ISBN 978-3-319-20199-3. [Google Scholar]
  9. Schipper, K.; Al-Jabri, H.M.S.J.; Wijffels, R.H.; Barbosa, M.J. Techno-Economics of Algae Production in the Arabian Peninsula. Bioresour. Technol. 2021, 331, 125043. [Google Scholar] [CrossRef]
  10. Moreira, J.B.; Santos, T.D.; Duarte, J.H.; Bezerra, P.Q.M.; de Morais, M.G.; Costa, J.A.V. Role of Microalgae in Circular Bioeconomy: From Waste Treatment to Biofuel Production. Clean Technol. Environ. Policy 2023, 25, 427–437. [Google Scholar] [CrossRef]
  11. Nagarajan, D.; Lee, D.-J.; Chen, C.-Y.; Chang, J.-S. Resource Recovery from Wastewaters Using Microalgae-Based Approaches: A Circular Bioeconomy Perspective. Bioresour. Technol. 2020, 302, 122817. [Google Scholar] [CrossRef]
  12. Rajesh Banu, J.; Preethi; Kavitha, S.; Gunasekaran, M.; Kumar, G. Microalgae Based Biorefinery Promoting Circular Bioeconomy-Techno Economic and Life-Cycle Analysis. Bioresour. Technol. 2020, 302, 122822. [Google Scholar] [CrossRef]
  13. Lehr, F.; Morweiser, M.; Rosello Sastre, R.; Kruse, O.; Posten, C. Process Development for Hydrogen Production with Chlamydomonas reinhardtii Based on Growth and Product Formation Kinetics. J. Biotechnol. 2012, 162, 89–96. [Google Scholar] [CrossRef] [PubMed]
  14. Yang, H.Y.L.; Erickson, L.E.; Yang, S.S. Kinetics and Bioenergetics of Light-Limited Photoautotrophic Growth of Spirulina platensis. Available online: https://click.endnote.com/viewer?doi=10.1002%2Fbit.260290705&token=WzMyMzg0NDUsIjEwLjEwMDIvYml0LjI2MDI5MDcwNSJd.SQEfKLFjgm0xauc9sm0R2o59A20 (accessed on 6 October 2022).
  15. Koller, A.P.; Wolf, L.; Weuster-Botz, D. Reaction Engineering Analysis of Scenedesmus ovalternus in a Flat-Plate Gas-Lift Photobioreactor. Bioresour. Technol. 2017, 225, 165–174. [Google Scholar] [CrossRef] [PubMed]
  16. Koller, A.P.; Löwe, H.; Schmid, V.; Mundt, S.; Weuster-Botz, D. Model-Supported Phototrophic Growth Studies with Scenedesmus obtusiusculus in a Flat-Plate Photobioreactor. Biotechnol. Bioeng. 2017, 114, 308–320. [Google Scholar] [CrossRef] [PubMed]
  17. Pfaffinger, C.E.; Severin, T.S.; Apel, A.C.; Göbel, J.; Sauter, J.; Weuster-Botz, D. Light-Dependent Growth Kinetics Enable Scale-up of Well-Mixed Phototrophic Bioprocesses in Different Types of Photobioreactors. J. Biotechnol. 2019, 297, 41–48. [Google Scholar] [CrossRef]
  18. Benner, P.; Meier, L.; Pfeffer, A.; Krüger, K.; Oropeza Vargas, J.E.; Weuster-Botz, D. Lab-Scale Photobioreactor Systems: Principles, Applications, and Scalability. Bioprocess Biosyst. Eng. 2022, 45, 791–813. [Google Scholar] [CrossRef]
  19. Kim, H.S.; Weiss, T.L.; Thapa, H.R.; Devarenne, T.P.; Han, A. A Microfluidic Photobioreactor Array Demonstrating High-Throughput Screening for Microalgal Oil Production. Lab Chip 2014, 14, 1415. [Google Scholar] [CrossRef]
  20. Ojo, E.O.; Auta, H.; Baganz, F.; Lye, G.J. Design and Parallelisation of a Miniature Photobioreactor Platform for Microalgal Culture Evaluation and Optimisation. Biochem. Eng. J. 2015, 103, 93–102. [Google Scholar] [CrossRef]
  21. Nayak, M.; Thirunavoukkarasu, M.; Mohanty, R.C. Cultivation of Freshwater Microalga Scenedesmus Sp. Using a Low-Cost Inorganic Fertilizer for Enhanced Biomass and Lipid Yield. J. Gen. Appl. Microbiol. 2016, 62, 7–13. [Google Scholar] [CrossRef]
  22. Flórez-Miranda, L.; Cañizares-Villanueva, R.O.; Melchy-Antonio, O.; Martínez-Jerónimo, F.; Flores-Ortíz, C.M. Two Stage Heterotrophy/Photoinduction Culture of Scenedesmus incrassatulus: Potential for Lutein Production. J. Biotechnol. 2017, 262, 67–74. [Google Scholar] [CrossRef]
  23. Gayathri, S.; Rajasree, S.R.R.; Suman, T.Y.; Aranganathan, L.; Thriuganasambandam, R.; Narendrakumar, G. Induction of β, ε-Carotene-3, 3′-Diol (Lutein) Production in Green Algae Chlorella Salina with Airlift Photobioreactor: Interaction of Different Aeration and Light-Related Strategies. Biomass Conv. Bioref. 2021, 11, 2003–2012. [Google Scholar] [CrossRef]
  24. Havel, J.; Franco-Lara, E.; Weuster-Botz, D. A Parallel Bubble Column System for the Cultivation of Phototrophic Microorganisms. Biotechnol. Lett. 2008, 30, 1197–1200. [Google Scholar] [CrossRef] [PubMed]
  25. Reyna-Velarde, R.; Cristiani-Urbina, E.; Hernández-Melchor, D.J.; Thalasso, F.; Cañizares-Villanueva, R.O. Hydrodynamic and Mass Transfer Characterization of a Flat-Panel Airlift Photobioreactor with High Light Path. Chem. Eng. Process. Process Intensif. 2010, 49, 97–103. [Google Scholar] [CrossRef]
  26. Molina, E.; Fernandez, J.; Acien, F.G.; Chisti, Y. Tubular Photobioreactor Design for Algal Cultures. J. Biotechnol. 2001, 92, 113–131. [Google Scholar] [CrossRef]
  27. Deniz, I. Scaling-up of Haematococcus pluvialis Production in Stirred Tank Photobioreactor. Bioresour. Technol. 2020, 310, 123434. [Google Scholar] [CrossRef] [PubMed]
  28. Li, J.; Xu, N.S.; Su, W.W. Online Estimation of Stirred-Tank Microalgal Photobioreactor Cultures Based on Dissolved Oxygen Measurement. Biochem. Eng. J. 2003, 14, 51–65. [Google Scholar] [CrossRef]
  29. Ogbonna, J.C.; Soejima, T.; Tanaka, H. An Integrated Solar and Artificial Light System for Internal Illumination of Photobioreactors. J. Biotechnol. 1999, 70, 289–297. [Google Scholar] [CrossRef]
  30. Pfaffinger, C.E.; Schöne, D.; Trunz, S.; Löwe, H.; Weuster-Botz, D. Model-Based Optimization of Microalgae Areal Productivity in Flat-Plate Gas-Lift Photobioreactors. Algal Res. 2016, 20, 153–163. [Google Scholar] [CrossRef]
  31. Apel, A.C.; Pfaffinger, C.E.; Basedahl, N.; Mittwollen, N.; Göbel, J.; Sauter, J.; Brück, T.; Weuster-Botz, D. Open Thin-Layer Cascade Reactors for Saline Microalgae Production Evaluated in a Physically Simulated Mediterranean Summer Climate. Algal Res. 2017, 25, 381–390. [Google Scholar] [CrossRef]
  32. Chmiel, H.; Takors, R.; Weuster-Botz, D. (Eds.) Bioprozesstechnik, 4th ed.; Springer Spektrum: Berlin/Heidelberg, Germany, 2018; ISBN 978-3-662-54041-1. [Google Scholar]
  33. Granum, E.; Myklestad, S.M. A Photobioreactor with PH Control: Demonstration by Growth of the Marine Diatom Skeletonema costatum. J. Plankton Res. 2002, 24, 557–563. [Google Scholar] [CrossRef]
  34. Hemmerich, J.; Noack, S.; Wiechert, W.; Oldiges, M. Microbioreactor Systems for Accelerated Bioprocess Development. Biotechnol. J. 2018, 13, 1700141. [Google Scholar] [CrossRef] [PubMed]
  35. Hortsch, R.; Weuster-Botz, D. Chapter 3—Milliliter-Scale Stirred Tank Reactors for the Cultivation of Microorganisms. In Advances in Applied Microbiology; Laskin, A.I., Sariaslani, S., Gadd, G.M., Eds.; Academic Press: Cambridge, MA, USA, 2010; Volume 73, pp. 61–82. [Google Scholar]
  36. Puskeiler, R.; Kusterer, A.; John, G.T.; Weuster-Botz, D. Miniature Bioreactors for Automated High-Throughput Bioprocess Design (HTBD): Reproducibility of Parallel Fed-Batch Cultivations with Escherichia coli. Biotechnol. Appl. Biochem. 2005, 42, 227–235. [Google Scholar] [CrossRef] [PubMed]
  37. Weuster-Botz, D.; Puskeiler, R.; Kusterer, A.; Kaufmann, K.; John, G.T.; Arnold, M. Methods and Milliliter Scale Devices for High-Throughput Bioprocess Design. Bioprocess Biosyst. Eng. 2005, 28, 109–119. [Google Scholar] [CrossRef]
  38. Buchenauer, A.; Hofmann, M.C.; Funke, M.; Büchs, J.; Mokwa, W.; Schnakenberg, U. Micro-Bioreactors for Fed-Batch Fermentations with Integrated Online Monitoring and Microfluidic Devices. Biosens. Bioelectron. 2009, 24, 1411–1416. [Google Scholar] [CrossRef] [PubMed]
  39. Funke, M.; Buchenauer, A.; Schnakenberg, U.; Mokwa, W.; Diederichs, S.; Mertens, A.; Müller, C.; Kensy, F.; Büchs, J. Microfluidic Biolector—Microfluidic Bioprocess Control in Microtiter Plates. Biotechnol. Bioeng. 2010, 107, 497–505. [Google Scholar] [CrossRef]
  40. Vester, A.; Hans, M.; Hohmann, H.-P.; Weuster-Botz, D. Discrimination of Riboflavin Producing Bacillus Subtilis Strains Based on Their Fed-Batch Process Performances on a Millilitre Scale. Appl. Microbiol. Biotechnol. 2009, 84, 71–76. [Google Scholar] [CrossRef] [PubMed]
  41. Hortsch, R.; Stratmann, A.; Weuster-Botz, D. New Milliliter-Scale Stirred Tank Bioreactors for the Cultivation of Mycelium Forming Microorganisms. Biotechnol. Bioeng. 2010, 106, 443–451. [Google Scholar] [CrossRef] [PubMed]
  42. Hoefel, T.; Wittmann, E.; Reinecke, L.; Weuster-Botz, D. Reaction Engineering Studies for the Production of 2-Hydroxyisobutyric Acid with Recombinant Cupriavidus Necator H 16. Appl. Microbiol. Biotechnol. 2010, 88, 477–484. [Google Scholar] [CrossRef] [PubMed]
  43. Schmideder, A.; Hensler, S.; Lang, M.; Stratmann, A.; Giesecke, U.; Weuster-Botz, D. High-Cell-Density Cultivation and Recombinant Protein Production with Komagataella Pastoris in Stirred-Tank Bioreactors from Milliliter to Cubic Meter Scale. Process Biochem. 2016, 51, 177–184. [Google Scholar] [CrossRef]
  44. Hsu, W.-T.; Aulakh, R.P.; Traul, D.L.; Yuk, I.H. Advanced Microscale Bioreactor System: A Representative Scale-down Model for Bench-Top Bioreactors. Cytotechnology 2012, 64, 667–678. [Google Scholar] [CrossRef]
  45. Riedlberger, P.; Weuster-Botz, D. New Miniature Stirred-Tank Bioreactors for Parallel Study of Enzymatic Biomass Hydrolysis. Bioresour. Technol. 2012, 106, 138–146. [Google Scholar] [CrossRef] [PubMed]
  46. Benner, P.; Effenberger, S.; Franzgrote, L.; Kurzrock-Wolf, T.; Kress, K.; Weuster-Botz, D. Contact-Free Infrared OD Measurement for Online Monitoring of Parallel Stirred-Tank Bioreactors up to High Cell Densities. Biochem. Eng. J. 2020, 164, 107749. [Google Scholar] [CrossRef]
  47. Bromig, L.; von den Eichen, N.; Weuster-Botz, D. Control of Parallelized Bioreactors I: Dynamic Scheduling Software for Efficient Bioprocess Management in High-Throughput Systems. Bioprocess Biosyst. Eng. 2022, 45, 1927–1937. [Google Scholar] [CrossRef] [PubMed]
  48. Krujatz, F.; Fehse, K.; Jahnel, M.; Gommel, C.; Schurig, C.; Lindner, F.; Bley, T.; Weber, J.; Steingroewer, J. MicrOLED-Photobioreactor: Design and Characterization of a Milliliter-Scale Flat-Panel-Airlift-Photobioreactor with Optical Process Monitoring. Algal Res. 2016, 18, 225–234. [Google Scholar] [CrossRef]
  49. Richmond, A. Handbook of Microalgal Culture: Biotechnology and Applied Phycology; John Wiley & Sons: Hoboken, NJ, USA, 2008; ISBN 978-1-4051-7249-3. [Google Scholar]
  50. MacIntyre, H.L.; Cullen, J.J. Using Cultures to Investigate the Physiological Ecology of Microalgae. In Algal Culturing Techniques; Academic Press: Cambridge, MA, USA, 2005; pp. 287–326. [Google Scholar]
  51. Cordara, A.; Re, A.; Pagliano, C.; Van Alphen, P.; Pirone, R.; Saracco, G.; Branco dos Santos, F.; Hellingwerf, K.; Vasile, N. Analysis of the Light Intensity Dependence of the Growth of Synechocystis and of the Light Distribution in a Photobioreactor Energized by 635 Nm Light. PeerJ 2018, 6, e5256. [Google Scholar] [CrossRef] [PubMed]
  52. Mohammed, K.; Ahammad, S.Z.; Sallis, P.J.; Mota, C.R. Energy-Efficient Stirred-Tank Photobioreactors for Simultaneous Carbon Capture and Municipal Wastewater Treatment. Water Sci. Technol. 2014, 69, 2106–2112. [Google Scholar] [CrossRef]
  53. Wagner, I.; Steinweg, C.; Posten, C. Mono- and Dichromatic LED Illumination Leads to Enhanced Growth and Energy Conversion for High-Efficiency Cultivation of Microalgae for Application in Space. Biotechnol. J. 2016, 11, 1060–1071. [Google Scholar] [CrossRef] [PubMed]
  54. Wang, C.-Y.; Fu, C.-C.; Liu, Y.-C. Effects of Using Light-Emitting Diodes on the Cultivation of Spirulina Platensis. Biochem. Eng. J. 2007, 37, 21–25. [Google Scholar] [CrossRef]
  55. Glemser, M.; Heining, M.; Schmidt, J.; Becker, A.; Garbe, D.; Buchholz, R.; Brück, T. Application of Light-Emitting Diodes (LEDs) in Cultivation of Phototrophic Microalgae: Current State and Perspectives. Appl. Microbiol. Biotechnol. 2016, 100, 1077–1088. [Google Scholar] [CrossRef]
  56. Adi, P.D.P.; Kitagawa, A.; Sihombing, V.; Silaen, G.J.; Mustamu, N.E.; Siregar, V.M.M.; Sianturi, F.A.; Purba, W. A Study of Programmable System on Chip (PSoC) Technology for Engineering Education. J. Phys. Conf. Ser. 2021, 1899, 012163. [Google Scholar] [CrossRef]
  57. Schädler, T.; Thurn, A.-L.; Brück, T.; Weuster-Botz, D. Continuous Production of Lipids with Microchloropsis salina in Open Thin-Layer Cascade Photobioreactors on a Pilot Scale. Energies 2021, 14, 500. [Google Scholar] [CrossRef]
  58. Thurn, A.-L.; Stock, A.; Gerwald, S.; Weuster-Botz, D. Simultaneous Photoautotrophic Production of DHA and EPA by Tisochrysis lutea and Microchloropsis salina in Co-Culture. Bioresour. Bioprocess. 2022, 9, 130. [Google Scholar] [CrossRef]
  59. Boussiba, S.; Vonshak, A.; Cohen, Z.; Avissar, Y.; Richmond, A. Lipid and Biomass Production by the Halotolerant Microalga Nannochloropsis salina. Biomass 1987, 12, 37–47. [Google Scholar] [CrossRef]
  60. Knorr, B.; Schlieker, H.; Hohmann, H.-P.; Weuster-Botz, D. Scale-down and Parallel Operation of the Riboflavin Production Process with Bacillus subtilis. Biochem. Eng. J. 2007, 33, 263–274. [Google Scholar] [CrossRef]
  61. Hortsch, R.; Weuster-Botz, D. Growth and Recombinant Protein Expression with Escherichia coli in Different Batch Cultivation Media. Appl. Microbiol. Biotechnol. 2011, 90, 69–76. [Google Scholar] [CrossRef]
  62. Strillinger, E.; Grötzinger, S.W.; Allers, T.; Eppinger, J.; Weuster-Botz, D. Production of Halophilic Proteins Using Haloferax volcanii H1895 in a Stirred-Tank Bioreactor. Appl. Microbiol. Biotechnol. 2016, 100, 1183–1195. [Google Scholar] [CrossRef]
  63. Von den Eichen, N.; Bromig, L.; Sidarava, V.; Marienberg, H.; Weuster-Botz, D. Automated Multi-Scale Cascade of Parallel Stirred-Tank Bioreactors for Fast Protein Expression Studies. J. Biotechnol. 2021, 332, 103–113. [Google Scholar] [CrossRef]
  64. Abu-Ghosh, S.; Fixler, D.; Dubinsky, Z.; Iluz, D. Continuous Background Light Significantly Increases Flashing-Light Enhancement of Photosynthesis and Growth of Microalgae. Bioresour. Technol. 2015, 187, 144–148. [Google Scholar] [CrossRef] [PubMed]
  65. Degen, J.; Uebele, A.; Retze, A.; Schmid-Staiger, U.; Trösch, W. A Novel Airlift Photobioreactor with Baffles for Improved Light Utilization through the Flashing Light Effect. J. Biotechnol. 2001, 92, 89–94. [Google Scholar] [CrossRef]
  66. Vejrazka, C.; Janssen, M.; Streefland, M.; Wijffels, R.H. Photosynthetic Efficiency of Chlamydomonas reinhardtii in Flashing Light. Biotechnol. Bioeng. 2011, 108, 2905–2913. [Google Scholar] [CrossRef] [PubMed]
  67. Talent, M.; Burgess, G.; Fernández-Velasco, J.G. Protocol to Compensate Net Evaporation and Net Precipitation in Open-Pond Microalgal Massive Cultures and Permit Maximal Steady-State Productivities. Biomass Bioenergy 2014, 64, 81–90. [Google Scholar] [CrossRef]
  68. Goldman, J.C.; Azov, Y.; Riley, C.B.; Dennett, M.R. The Effect of PH in Intensive Microalgal Cultures. I. Biomass Regulation. J. Exp. Mar. Biol. Ecol. 1982, 57, 1–13. [Google Scholar] [CrossRef]
  69. Huesemann, M.H.; Van Wagenen, J.; Miller, T.; Chavis, A.; Hobbs, S.; Crowe, B. A Screening Model to Predict Microalgae Biomass Growth in Photobioreactors and Raceway Ponds. Biotechnol. Bioeng. 2013, 110, 1583–1594. [Google Scholar] [CrossRef] [PubMed]
  70. Ocaranza, D.; Balic, I.; Bruna, T.; Moreno, I.; Díaz, O.; Moreno, A.A.; Caro, N. A Modeled High-Density Fed-Batch Culture Improves Biomass Growth and β-Glucans Accumulation in Microchloropsis salina. Plants 2022, 11, 3229. [Google Scholar] [CrossRef]
  71. Sukenik, A. Ecophysiological Considerations in the Optimization of Eicosapentaenoic Acid Production by Nannochloropsis sp. (Eustigmatophyceae). Bioresour. Technol. 1991, 35, 263–269. [Google Scholar] [CrossRef]
  72. Van Wagenen, J.; Miller, T.W.; Hobbs, S.; Hook, P.; Crowe, B.; Huesemann, M. Effects of Light and Temperature on Fatty Acid Production in Nannochloropsis salina. Energies 2012, 5, 731–740. [Google Scholar] [CrossRef]
  73. Hulatt, C.J.; Wijffels, R.H.; Bolla, S.; Kiron, V. Production of Fatty Acids and Protein by Nannochloropsis in Flat-Plate Photobioreactors. PLoS ONE 2017, 12, e0170440. [Google Scholar] [CrossRef] [PubMed]
  74. Duck, B. Basic Measurements of Radiation at Station Newcastle (2017-11). PANGAEA 2018. [Google Scholar] [CrossRef]
Figure 1. Typical pressure dynamics inside the needles of the LHS during an aspiration step (2200 ms) followed by a dispensing step: (a) needle in liquid phase (water), and (b) needle in gas phase (air). Both pressure dynamics were recorded with steel needles, which were washed automatically shortly before use.
Applsci 13 05064 g001
Figure 2. Illumination modules for two rows of mL-scale stirred-tank bioreactors: (a) housing in which all components are mounted, 6 LEDs positioned precisely below each bioreactor, individual lighting positions separated from external light and light from neighboring positions; (b) power supply jack SAL8 FK30; (c) two circuit boards for LEDs (yellow); (d) power socket connected to (b); (e) aluminum heat exchanger; (f) inlet and outlet pipe for water cooling (rendered with 3D Builder, Microsoft Corporation, Redmond, DC, USA; CADrays, OpenCascade, Issy-Les-Moulineaux, France).
Applsci 13 05064 g002
Figure 3. Normalized light intensities of the solar spectrum ASTM G173-03 (gray) derived from SMARTS v. 2.9.2 (ASTM, 2003) compared with the normalized light intensities of the spectrum of the LEDs used in the illumination modules (blue). Both spectra were normalized by dividing each value by the maximum value of the respective spectrum.
Applsci 13 05064 g003
Figure 4. (a) Photograph showing three illumination modules on the deck of the LHS. LED illumination is switched on. (b) Photograph showing the bioreaction unit (bioREACTOR48, 2mag AG, Munich, Germany) with 48 single-use bioreactors positioned above the three illumination modules. Headspace cooling and cooling for the magnetic inductive drive and parallel stirred-tank bioreactors are connected. LED illumination is switched on. (c) Gas supply cover with 48 openings for the LHS needles is mounted on top of the bioreaction unit during operation with LED illumination of a microalgae suspension (Microchloropsis salina).
Applsci 13 05064 g004
Figure 5. Automated photoautotrophic batch cultivations of M. salina in miniaturized stirred-tank PBRs. Each row of eight bioreactors in the bioreaction unit was illuminated at six different incident light intensities I0. Each bioreactor was initially filled with 10 mL of M. salina suspension in an ASW medium with an initial OD750 of 0.5 (initial pH 8 ± 0.3). Magnetically induced S-stirrers were employed at 500 rpm. The head space of the 48 parallel stirred-tank bioreactors was rinsed with 288 L h−1 of sterile air with 2% CO2. The gray shading indicates the exponential growth phase used to estimate the individual exponential growth rates as a function of the incident light intensities.
Applsci 13 05064 g005
Figure 6. Evaporation rates during automated photoautotrophic batch cultivations of M. salina in stirred-tank PBRs. The layout represents the positioning of the 48 parallel PBRs inside the bioreactor. The final evaporation rates were estimated by totaling the quantities of individual sterile water added for automated liquid level correction. The inlet of the gas supply cover of the bioreaction unit is located between the 3rd and 4th rows of Reactor Position 8 (Figure 4c).
Applsci 13 05064 g006
Figure 7. Automated photoautotrophic batch cultivation of M. salina in miniaturized stirred-tank PBRs. Each row of eight bioreactors in the bioreaction unit was illuminated at six different incident light intensities I0. Each bioreactor was initially filled with 10 mL of M. salina suspension in an ASW medium with an initial OD750 of 0.5 (initial pH 8 + 0.3). Magnetically induced S-stirrers were employed at 500 rpm. The head space of the 48 parallel stirred-tank bioreactors was rinsed with 288 L h−1 of sterile air with 2% CO2. The blue vertical shading indicates the exponential growth phase used to estimate the individual exponential growth rates as a function of the incident light intensities. Mean OD is represented by blue circles, whereas pH is represented by white circles. If the at-line-measured pH was below pH 7.7 or above pH 8.3 (horizontal gray-shaded area), either 45 µL of base (0.5 M NaOH) or acid (0.5 M HCl) was added to the relevant bioreactor by the LHS.
Applsci 13 05064 g007
Figure 8. Automated photoautotrophic batch cultivations of M. salina in miniaturized stirred-tank PBRs (● first experiment, ■ second experiment). Estimated exponential growth rates of M. salina (blue) and OD750 after 6 d as a function of the constant incident light intensities I0 (red). Standard deviations are based on n = 8 parallel stirred-tank bioreactors.
Applsci 13 05064 g008
Figure 9. Automated photoautotrophic batch cultivation of M. salina in miniaturized stirred-tank PBRs with day and night cycles imitating typical Mediterranean climate conditions (repeated summer day in Almeria, Spain, recorded by DLR at Plataforma Solar de Almería on 15 June 2012, courtesy of S. Wilbert). One row of eight stirred PBRs in the bioreaction unit was illuminated at 66% (left), and the second row at 100% light intensity (right). The gray shading indicates the dynamic incident light intensity variations applied. The temperature of all parallel PBRs was adjusted hourly to follow the climate data. Each bioreactor was initially filled with 10 mL of M. salina suspension in an ASW medium with an initial OD750 of 0.5 (initial pH 8 + 0.3). Magnetically induced S-stirrers were employed at 500 rpm. The head space of the 48 parallel stirred-tank bioreactors was rinsed with 288 L h−1 of sterile air with 2% CO2. Sampling was performed at physically simulated sunrise and sunset times.
Applsci 13 05064 g009
Table 1. Maximum growth rates observed (µopt) and maximum dry cell weight (CDWmax) concentrations reported for M. salina in photoautotrophic batch cultivations at constant illumination.
SourceCDWmax
(g L−1)
µopt
(d−1)
StrainMediumIncident Light
(µmol m−2 s−1)
Layer Thickness
(mm)
This work3.4 **
(after 6 d)
0.525M. salina
(SAG)
ASW100035
[17]10
(after 7 d)
0.792M. salina
(SAG)
ASW*6
[30]4.5
(after 9 d)
0.744M. salina
(SAG)
ASW*20
[70]0.62
(after 8 d)
0.108M. salina
(CSIRO)
ASW,
f/2
50unknown
[72]14.2
(after 50 d)
1.3M. salina
(CCMP)
f/2-Si25046
[71]unknown0.72***f/229050
* The incident light intensity was not published. ** The CDW concentration was estimated on the basis of the measured OD750, applying a linear correlation factor of 0.44 g L−1. *** Nannochloropsis sp.
Table 2. Maximum volumetric productivities (STYmax) and maximum dry cell weight (CDWmax) concentrations reported for M. salina in photoautotrophic batch cultivations with day and night cycles.
SourceCDWmax
(g L−1)
STYmax
(g L−1 d−1)
StrainMediaIlluminationLayer Thickness
(mm)
This work4.0 *
(after 10 d)
0.81M. salina
(SAG)
ASWSummer day,
Almeria, Spain **
35
[17]33
(after 14 d)
~4M. salina
(SAG)
ASWSummer day,
Almeria, Spain **
6
[73]4.7
(after 16 d)
0.51N. sp. 211/78 (CCAP)f/2180 µmol m−2 s−1
16 h–8 h
day–night cycles
14
[58]5.5
(after 12 d)
0.7M. salina
(SAG)
f/2Summer day, Newcastle, Australia ***20
* The CDW concentration was estimated on the basis of the measured OD750 with a linear correlation factor of 0.44 g L−1. ** Recorded by DLR at Plataforma Solar de Almería on 15 June 2012 (courtesy of S. Wilber). *** Recorded by BSRN station no. 52 on 19 January 2018 [74].
Disclaimer/Publisher’s Note: The statements, opinions and data contained in all publications are solely those of the individual author(s) and contributor(s) and not of MDPI and/or the editor(s). MDPI and/or the editor(s) disclaim responsibility for any injury to people or property resulting from any ideas, methods, instructions or products referred to in the content.

