Article

Study on the Change in Vegetation Coverage in Desert Oasis and Its Driving Factors from 1990 to 2020 Based on Google Earth Engine

1
Key Laboratory of Tarim Oasis Agriculture, Ministry of Education, Tarim University, Alar 843300, China
2
College of Horticulture and Forestry, Tarim University, Alar 843300, China
*
Author to whom correspondence should be addressed.
Submission received: 8 March 2023 / Revised: 13 April 2023 / Accepted: 23 April 2023 / Published: 26 April 2023
(This article belongs to the Special Issue Applications of Machine Learning on Earth Sciences)

Abstract

:
Fractional Vegetation Cover (FVC) is an important indicator to evaluate the quality of the regional ecological environment. Alar City is a typical desert oasis region. Investigating the spatial and temporal changes in its vegetation cover at different stages is a guide to the ecological balance and sustainable green development of the Tarim River basin. Based on the Google Earth Engine (GEE) cloud platform, this study analyzed the spatial and temporal characteristics and trends of vegetation cover changes in Alar City from 1990 to 2020 using the Hurst index and coefficient of variation. The results show that the spatial distribution of vegetation in the study area in the last 30 years shows a wave-like characteristic with an overall apparent upward trend. The vegetation cover in the study area is predominantly increasing and the spatial distribution shows a phased and regional character. Compared with 1990, there is a significant increase in the area of cultivated land in 2020. Among them, the areas of vegetation growth mainly occur in the basin around the Tarim River. Human activities have weakened the influence of natural factors on FVC. The results of the study suggest that the GEE platform can be an effective tool for permanently monitoring vegetation.

1. Introduction

Vegetation is a key element of the global water, atmosphere and energy cycle [1]. As the main component of the terrestrial biosphere, it has the functions of wind prevention and sand fixation, blocking noise, regulating atmosphere, conserving water and soil, and maintaining climate and ecosystem stability [2]. Vegetation growth is strongly affected by climate change and human activities, and various biological and physical processes also affect the climate system and water–land cycle [3]. The change in vegetation cover affects the global or regional ecosystem balance and habitat conditions, and the study of vegetation cover change is the basis of protecting the quality of the ecological environment.
Monitoring the dynamic change in vegetation coverage (FVC) is essential to understand its impact on ecosystem structure and function. Remote sensing technology breaks through the limitations in the scope and scale of field monitoring and realizes vegetation monitoring of longer time series and a larger spatial scale. The normalized vegetation index (NDVI) can effectively reflect the growth status of surface vegetation, and is the most common index used to monitor the dynamic changes in vegetation over large areas and long periods of time [4]. Anyamba et al. [5] dynamically analyzed the vegetation cover changes in the Sahel region from 1981 to 2003 based on NOAA/AVHRR image data with a resolution of 8 km and NDVI index changes; Piao et al. [6] analyzed the temporal and spatial patterns of vegetation growth and change in temperate and frigid regions of Eurasia from 1982 to 2006 according to monthly NDVI data with an 8 km resolution generated by integrating monthly NDVI images with changes in vegetation growth data. At present, MODIS image data, MODIS-related series data products or Landsat image data of certain periods are mostly used in the research of dynamic change in vegetation coverage, which are extracted and processed by MRT, ENVI and other software [7,8,9,10,11]. Google’s newly developed Google Earth Engine (GEE) cloud platform combines massive petabyte-scale data acquisition, spatial visualization image processing and high-performance computing analysis. The platform stores over 200 public datasets, including Landsat, MODIS, Sentinel, ALOS and other series of satellite data, as well as CHIRPS and other meteorological products data, which can provide long-term, high-resolution satellite image data at the global scale. The powerful data processing capability greatly shortens the calculation time of satellite image data, improves the working efficiency and provides high accuracy and standardization for the dynamic monitoring of vegetation cover and it has been widely used in crop growth monitoring, land-use-type classification and other aspects [12].
Located in the south of Xinjiang, on the northern edge of the Taklamakan Desert, Alar is a typical man-made oasis in an arid region. Ecosystems are fragile and unstable, and climate change and human activities have led to a series of ecological problems, such as the expansion of desert areas, forest destruction, grassland degradation, river breakage, oasis degradation, etc. [13]. In recent decades, the state has attached great importance to ecological problems; a series of projects and policies have been launched since the 1950s to combat desertification and restore the ecology, and the results have been remarkable. During the ten years from 2010 to 2020, China has completed a total of 1.88 million square kilometers of desertification prevention and control tasks, and 0.177 million square kilometers of desertification land has been banned and protected. The varea of desertification land nationwide has decreased by 432.67 square kilometers. The above data are from the State Forestry and Grassland Administration (http://www.forestry.gov.cn/, accessed on 17 June 2022). To study the spatial and temporal changes in vegetation in the region, it is important to obtain the precise vegetation conditions at different times in the study area, which is of scientific guidance to maintain the ecological balance and ecological environment restoration in the Tarim River basin and improve the local climate regulation capacity. Based on the Google Earth Engine cloud platform, this study used Landsat series images with a spatial resolution of 30 m as the data source to estimate the vegetation cover in the Alar region for the past 30 years from 1990 to 2020 using the image dichotomy method, and explored the spatial and temporal dynamic trends using the CV coefficient of variation and Hurst index, in order to provide a scientific basis for the dynamic monitoring and evaluation of vegetation resources and ecological environment in desert oases.

2. Materials and Methods
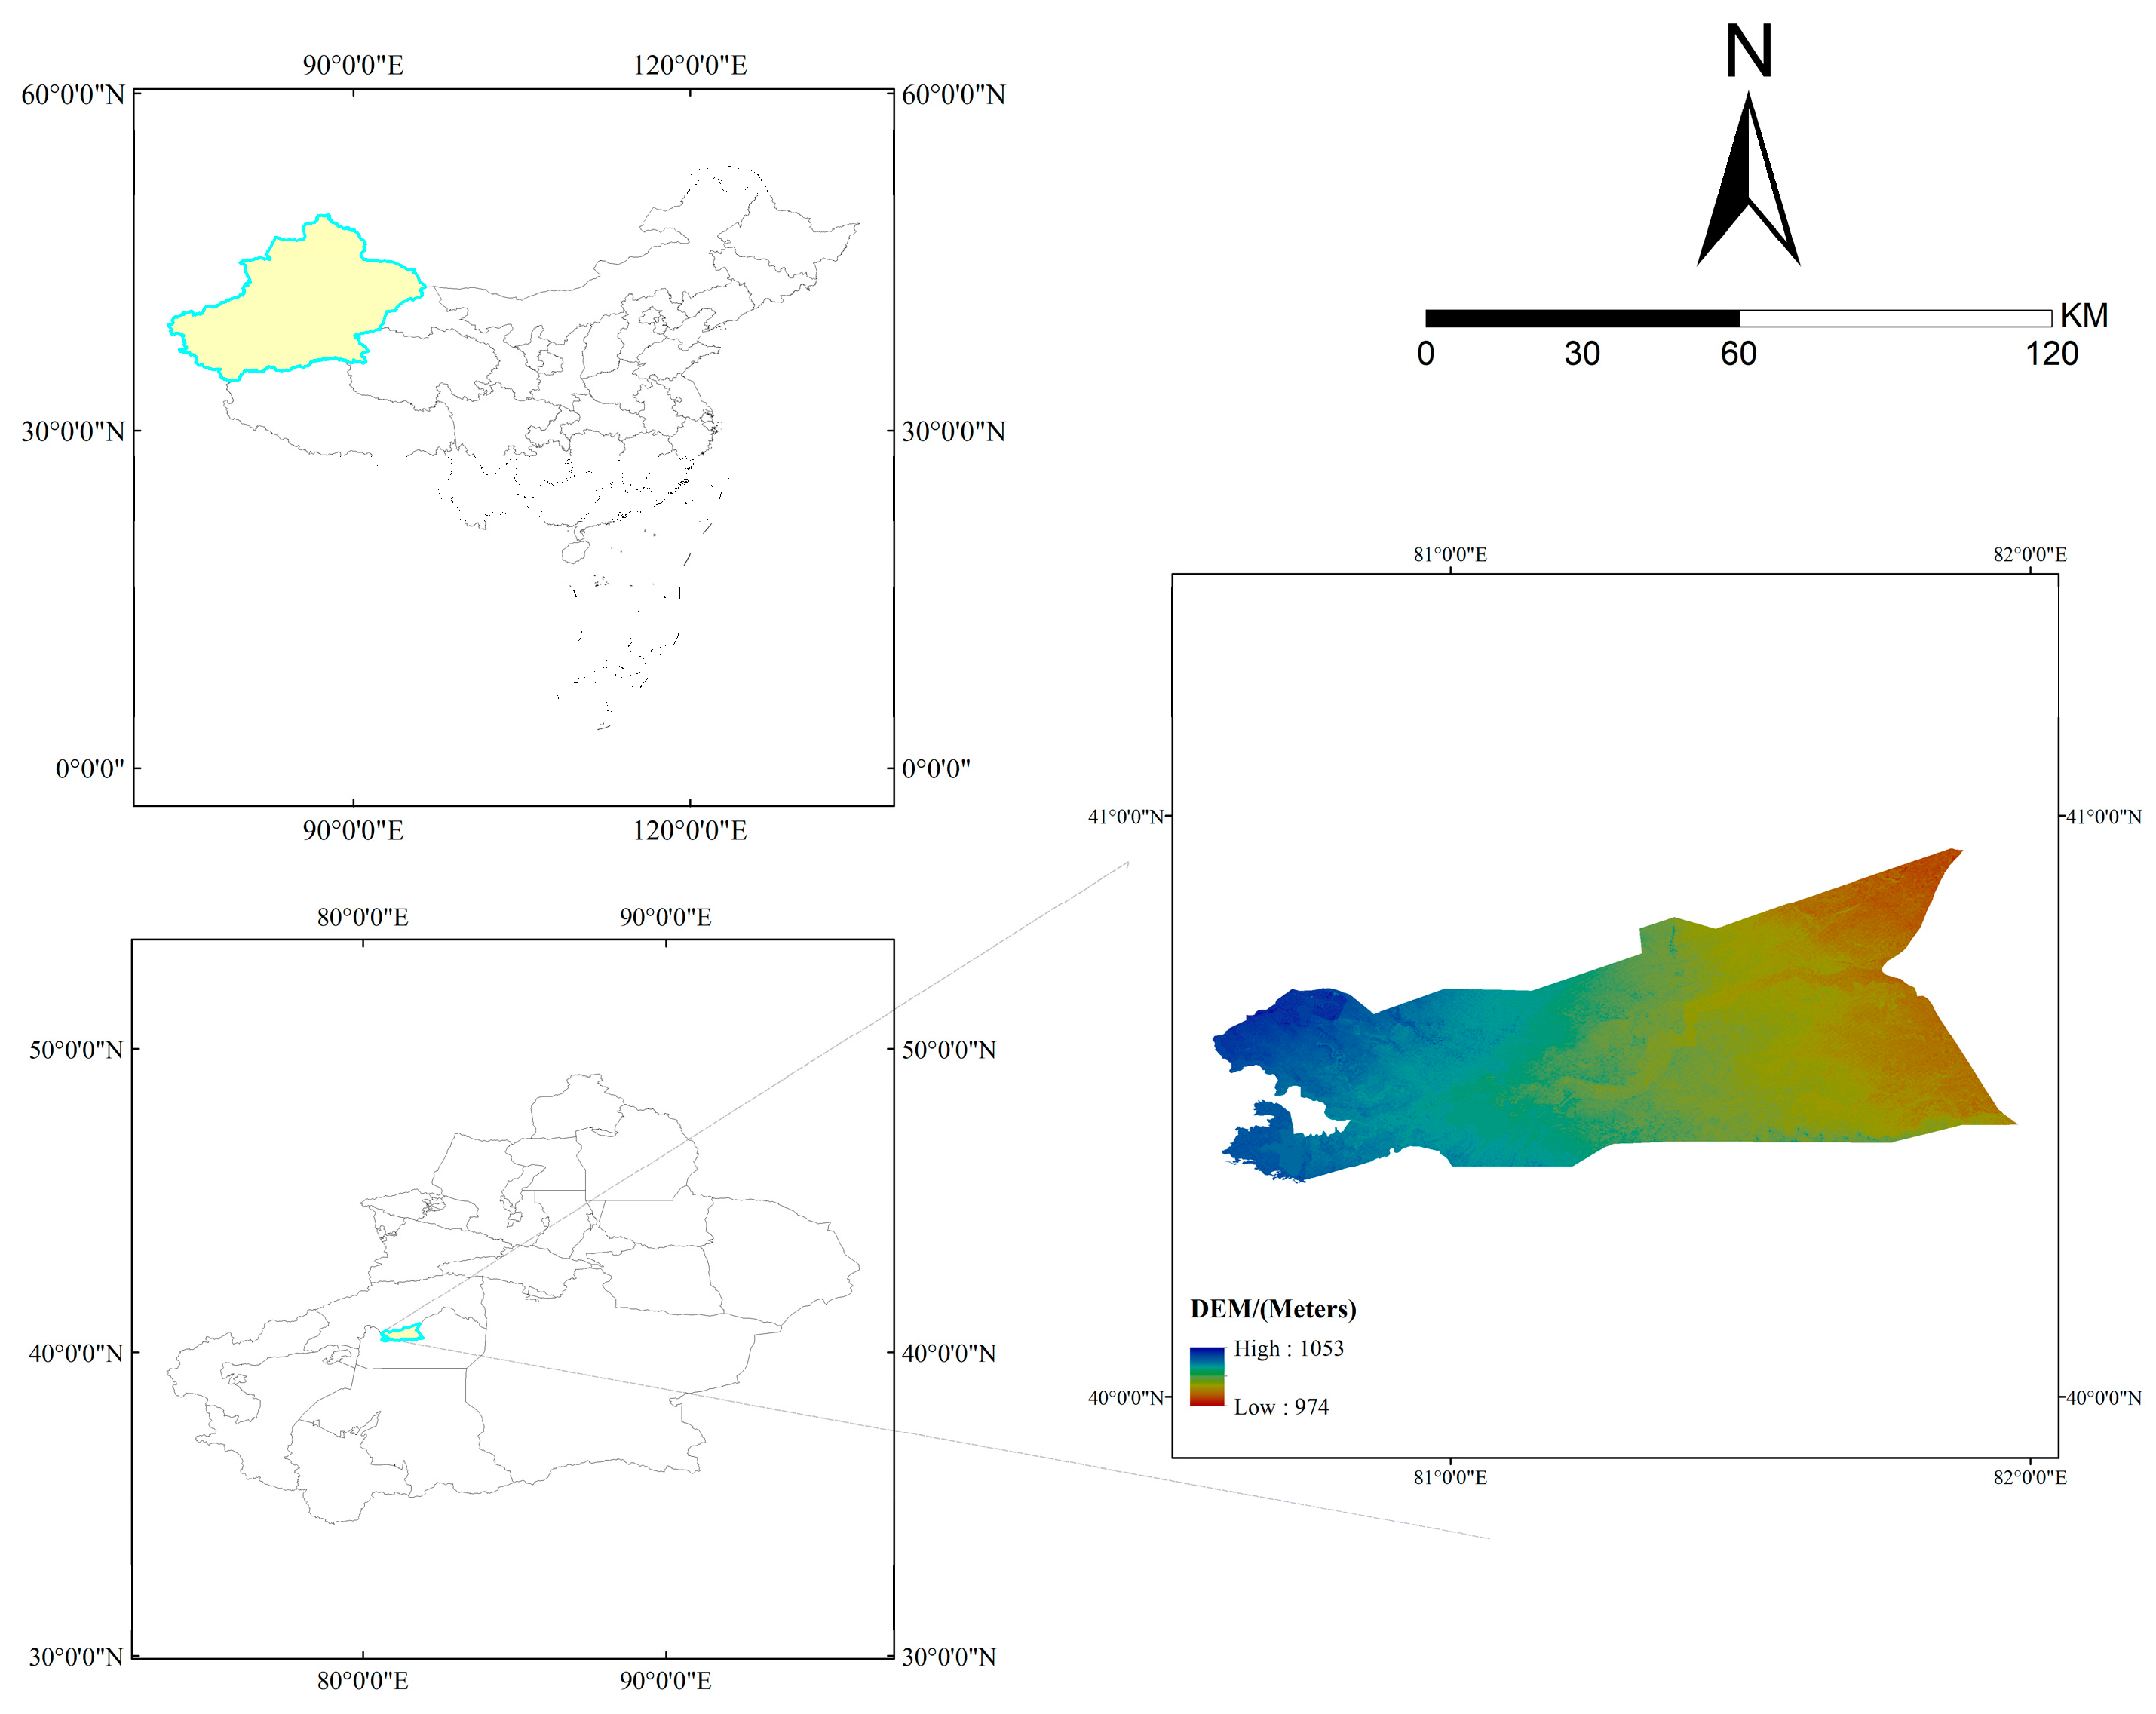
2.1. Study Area

The Alar Reclamation Area is located at the southern foot of the Tianshan Mountains and the northern part of the Tarim Basin. The geographical coordinates are between 79°22′ and 81°53′ E and 40°20′ and 41°47′ N. It has a warm temperate extreme continental arid desert climate [14], with a total area of 6923 square kilometers (Figure 1). Alar is an alluvial fine soil plain by the Tarim River, and the terrain slopes from northwest to southeast. Water resources in the Reclamation area are provided by the Aksu and Tarim rivers with three major plain reservoirs, with an average annual sunshine of 2556.3 to 2991.8 h and a sunshine rate of 58 to 69%. Rainfall in the Reclamation area is scarce, with little snow in winter and strong surface evaporation. The average annual precipitation is 40.1 to 82.5 mm, and the average annual evaporation is 1876.6 to 2558.9 mm. The desert vegetation types are mainly trees, shrubs, herbs and short-lived plants; the vegetation cover along the rivers and basins is high, with more oases, forests and high-vegetation-cover grasslands distributed; at the same time, food-based crops and cash crops such as cotton, oil seeds and red dates are planted.

2.2. Data Sources

Google Earth Engine is a petabyte-scale system that enables scientific analysis and visualization of geospatial datasets. It provides users with a codable front-end workbench that allows interactive data and algorithm development, reduces the difficulty of data acquisition and alleviates the computational redundancy of large amounts of image data [12]. Landsat image data are provided by the United States Geological Survey (USGS) with a spatial resolution of 30 m and a temporal resolution of 16 days [15].
In this study, Landsat 5, 7 and 8 series image data (Table 1) from the Alar region for every March to October from 1990 to 2020 were selected, which were preprocessed by the GEE platform with geometric correction and atmospheric correction to reduce the influence of clouds and other effects, and these data were also reconstructed by Hants harmonic analysis to mitigate the impact caused by missing images. Two periods of land transfer data (30 m × 30 m) from the Institute of Geographical Sciences of the Chinese Academy of Sciences were selected for 1990 and 2020 for monitoring the status of land use, and the land included five types of arable land, orchard, desert, water and construction land.

2.3. Research Method

2.3.1. Dimidiate Pixel Model

Fraction Vegetation Coverage (FVC) is an important index to measure vegetation quality and ecosystem change [4]. NDVI is the normalized vegetation index, which quantifies the condition of vegetation by calculating the difference between the near-infrared light reflected by vegetation and the red light absorbed by it. It is an important reference indicator for monitoring vegetation growth and cover changes. Existing studies have shown that there is a linear regression relationship between NDVI and FVC, so pixel dichotomy can be used to calculate vegetation cover changes in the study area. The commonly used methods for calculating FVC also include empirical research and spectral mixture analysis (SMA) methods [16,17]. In this research, the pixel dichotomy method is used to estimate FVC. This method is the most commonly used and simplest linear model among all methods. The principle is based on the fact that the picture element is composed of a vegetation-covered area and a non-vegetation covered area, and the spectral information is composed of a linear mixture of the two parts [18]. The ratio of each part of the image element to its area is its weight, and the percentage of vegetation area is the FVC of the picture element. The FVC is calculated as follows:
F V C = N D V I N D V I soil N D V I veg N D V I soil × 100 %
In the formula, NDVI is the vegetation index value in the mixed image element. In the pixel dichotomy model, the vegetation cover structure is divided into two categories: pure pixels and mixed pixels. Pure pixel coverage refers to the complete range with a vegetation coverage value of 1, while mixed pixels refer to the composition of vegetation and non-vegetation types. NDVIsoil is the vegetation index value of the pure soil image element, which is theoretically close to 0; NDVIveg is the vegetation index value of the pure vegetation image element, which is theoretically close to 1. To prevent noise points and grayscale interference of NDVI on the image, 5% and 95% of NDVI were taken to represent NDVIsoil and NDVIveg, respectively, in this research. Based on the vegetation cover thresholds and previous classification studies from [18] and in the context of the study area, the final FVC values were classified into five classes (Table 2).

2.3.2. Trend Analysis

In this research, the unary linear regression and the significance test (Slope) are used to obtain the trend of multiyear NDVI by fitting each raster NDVI of remote sensing images for the last n years, and the annual FVC values were synthesized. The slope of the time series was calculated in the long time series to reflect the trend of FVC [19]. The calculation formula is as follows:
K = n × m = 1 n m × F V C t ( m = 1 n m ) ( m = 1 n F V C m ) n × m = 1 n m 2 ( m = 1 n m ) 2
In the formula, K is the slope of linear regression, characterizing the annual synthetic FVC trend; n is the total number of monitoring years; t is the number of monitoring years; and FVCt is the annual synthetic FVC value corresponding to year i. K > 0 indicates an increasing trend of FVC, K = 0 indicates FVC is basically constant and K < 0 indicates a decreasing trend of FVC.

2.3.3. Coefficient of Variance

The coefficient of variance (CV) refers to the degree of variation in a set of data and is the ratio of the variation index to its average index. It can be adopted to reflect the dispersion of spatial data in the time series and evaluate the stability of the time series of data. The coefficient of standard deviation is commonly used; CV is the ratio of standard deviation to the mean [20,21] and the calculation formula is as follows:
CV = σ / μ
σ = i = 1 n ( x i x ¯ ) 2 n
μ = i = 1 n x i n
In the formula, σ is the standard deviation of the annual FVC mean value; μ is the annual FVC mean value; xi is the FVC value corresponding to year i; x ¯ is the actual mean value of FVC for the year; and n is the number of years. The larger the CV value, the higher the degree of change and the greater the data fluctuation and instability. The smaller the CV value, the lower the degree of change, which means the more stable the data.
In this paper, the CV of vegetation cover change in the research area from 1990 to 2020 is divided into four levels according to the Natural Breaks (Jenks) to characterize the stability of vegetation cover in the research area: 0 < CV ≤ 0.2 indicates low fluctuation, 0.2 ≤ CV < 0.5 indicates relatively low fluctuation, 0.5 ≤ CV < 0.8 indicates medium fluctuation, and 0.8 ≤ CV < 2.13 indicates high fluctuation [22,23].

2.3.4. Hurst Index

The Hurst index(H) reflects the correlation and consistency between the future change trend and the past change trend of the data in the time series. In this paper, the Hurst index is used to characterize the trend of FVC in the time series: 0 < H < 0.5 means that the vegetation cover has a reverse continuous variation; H = 0.5 means that the vegetation cover varies randomly; and 0.5 < H < 1 means that the vegetation cover has a positive continuous variation [24]. This study uses the commonly used R/S analysis method (Rescaled Range Analysis Method) to calculate the Hurst index (H), dividing a time series of total length T into several short series of length n. For each t, calculate its rescaled extreme deviation, which is based on the following principle: assume a time series of {FVCt}, t = 1, 2, 3… n, and define the mean series as follows:
F V C t ¯ = 1 T t = 1 τ F V C ( τ ) τ = 1 , 2 , n
Cumulative deviation: calculate the cumulative deviation from the mean of the time series τ as follows:
X ( t , τ ) = t = 1 τ ( F V C ( t ) F V C ( τ ) )   0   <   t   <   τ
Range: calculate the range of fluctuations within each time series τ as follows:
R ( τ ) = max 1 t τ X ( t , τ ) min 1 t τ X ( t , τ ) ( τ = 1 , 2 , , n )
Standard deviation: calculate the standard deviation of each time series τ as follows:
S ( τ ) = [ 1 τ t = 1 τ ( F V C ( t ) F V C ( t ) ) 2 ] 1 2 τ = 1 , 2 , n R ( τ ) S ( τ ) = c τ H
log ( R ( τ ) S ( τ ) ) = log ( c ) + H log ( τ )
where H is the Hurst index, c is a constant which takes the value of the intercept of the regression equation and τ is the length of the time series.

3. Results and Discussion

3.1. Characteristics of Interannual Variation in Vegetation Cover

The annual FVC trend in Alar City from 1990 to 2020 is shown in Figure 2. We removed abnormal data values, and the overall change over 30 years shows a fluctuation rise trend (R2 is 0.867), with a growth rate of 8.2%/10a (annual) and an annual average FVC of 0.24~0.49. In the recent 30 years, the vegetation planting in Alar City has been continuously enhanced. As shown in Figure 2, the average FVC is 0.347, and the maximum FVC in 2020 is 0.495. After eliminating the abnormal fluctuation values, it can be seen that the FVC showed a slow growth trend from 1990 to 2003. Located in the northern edge of Taklimakan Desert, Alar City is a typical artificial oasis, arid and rainless. In 2004, the Reclamation area in Alar City was set up as a city, and its urban landscaping has been further increased. The FVC increased significantly from 2004 to 2010 compared with the previous years. Due to the implementation of the policy of converting cultivated land into forest in 2010, the FVC decreased slightly compared with that in 2009; however, the overall FVC still showed an upward trend from 2010 to 2020.
As can be seen from Figure 3a–c, the FVC variation in the Alar region over the last 30 years is on the rise in the spring, summer and autumn, with the highest interannual variation rate of 9.2%/10a and R2 of 0.96 in the summer, followed by 9.0%/10a and R2 of 0.97 in the autumn, and a lower interannual variation rate of 5.8%/10a and R2 of 0.81 in the spring. As can be seen from Figure 4, there are still differences in the spatial distribution of vegetation cover in different seasons of the same year. Spring and summer were dominated by high vegetation cover, while the proportion of medium and higher vegetation areas in the summer was the lowest among the four seasons. Higher vegetation cover and medium vegetation cover are predominant in the spring, with a uniform distribution; higher vegetation areas are more sparsely distributed. In addition, the proportion of areas with low vegetation is relatively high in all seasons. Overall, vegetation cover is best in the summer, average in the autumn and poor in the spring. Spring vegetation cover is low due to low precipitation in the spring and the tendency to experience extreme weather such as floating dust, fugitive dust and sandstorms, resulting in low vegetation cover and significant interannual fluctuations. In the summer, the area receives plenty of sunshine and less extreme weather, and fruit crops and other crops are nearing maturity, which has a greater impact on vegetation cover. Overall, there is variation in annual averages, interannual rates of change and interannual fluctuations between seasons in the Alar region.

3.2. Spatial Distribution Characteristics of Vegetation Cover

It can be seen from Figure 5 and Figure 6 that the spatial distribution of FVC in the research area is significantly different in different years, except that three reservoirs and two rivers are not defined. It can be roughly divided into three stages: the first stage is from 1990 to 2000, and the distribution of vegetation coverage shows a polarization between extremely high vegetation coverage and extremely short vegetation coverage. The extremely short vegetation coverage area is the unreclaimed bare land in the desert, with the average proportion dropping from 52.4% to 47.7%; the proportions of medium vegetation coverage area and high vegetation coverage area increased, up from 6.9% to 11.8% and 9.5% to 12.3%, respectively. The second stage is from 2000 to 2010, and compared with the previous stage, the vegetation coverage area significantly increased. During this period, the desert bare land was reclaimed into cultivated land, forest land, etc., with a relatively uniform spatial distribution, and the proportion of bare land decreased from 47.7% to 37.2%; vegetation coverage increased, in which the proportion of medium coverage area and high coverage area increased to 12.9% and 19.2%, respectively. The third stage is from 2010 to 2020, and the proportion of desert bare land gradually decreased and stabilized at about 27%. The vegetation coverage area gradually tended to be stable after increasing, and the proportion of medium and high vegetation coverage areas increased to 21.4% and 24.8%, respectively. There is little difference in the proportion of medium and high vegetation coverage areas in this decade.
In the recent 30 years, the vegetation area in Alar City has been increasing continuously, most of the desert areas have been reclaimed, the high vegetation coverage area has increased from 9.5% to 24.8% and the low vegetation coverage area (desert bare land, etc.) has decreased from 52.4% to 26.8%. The proportion of high vegetation coverage areas is uniformly distributed in Alar City. Most of the high vegetation coverage areas are near the reservoirs, Tarim River and other areas with plenty of water. The proportion of medium vegetation coverage areas is relatively scattered. The short vegetation coverage area accounts for the lowest proportion and is mostly distributed in the desert around the third, eleventh and twelfth regiments (special administrative division of the plan with the same administrative level as a town). In general, from 1990 to 2020, the overall trend of vegetation coverage in the Alar Reclamation area was good, and the desertification control effect was significant, which led to the increase in cultivated land and forest land. The area of forest land in the second, eighth, tenth and eleventh regiments increased, and the increase in cultivated land was mainly distributed in the ninth, eleventh, twelfth and thirteenth regiments.
In general, vegetation cover in desert oasis areas was dominated by an increase in cover during the period 1990–2020, and there were more significant differences in the spatial distribution of vegetation cover changes.

3.3. Vegetation Cover Stability Analysis

The coefficients of variation in image element values were calculated for long-term remote sensing raster images of vegetation cover change in the Alar Reclamation area over the past 30 years using MATLAB software, and the results are shown in Figure 7 and Table 3, where the distribution of the coefficient of variation is highly spatially autocorrelated with vegetation cover. The mean CV value for Alar Reclamation was 0.40, with a standard deviation of 0.29, and 89.52% of the regional coefficient of variation values ranged from 0 to 0.8, indicating that Reclamation as a whole is in a state of steady growth and change. In total, 23.82% of the area has a CV coefficient value between 0 and 0.2, which is a very stable state. The areas with very stable vegetation cover are mainly the three reservoirs of Shengli, Upstream and Dolang, the Tarim and Aksu rivers, and part of the Taklamakan desert around the eleventh regiment. In total, 43.40% of the areas have CV coefficients between 0.2 and 0.5, which is a relatively stable state, mostly human activity areas mainly on the north and south banks of the Tarim River. In total, 22.30% of the areas have CV coefficients between 0.5 and 0.8, which is a weak state of variation. In total, 10.48% of the areas have CV coefficients between 1 and 2.13, which is a high fluctuation and intense variation stage, mainly in the areas around Duolang Reservoir and Shengli Reservoir, because where water resources are abundant, people reclaim the desert, build new regiments and plant economic crops such as cotton and pepper, which improve the vegetation cover. In summary, the interannual fluctuations in vegetation cover are mainly caused by climate change and human activities.

3.4. Vegetation Cover Persistence Analysis

Using the R/S analysis method, a time-series analysis of the vegetation cover of the study area was conducted using MATLAB software on an image-by-image basis, and hierarchical statistics were performed to obtain the spatial distribution of the Hurst index for the study area from 1990 to 2020 (as shown in Figure 8 and Figure 9).The variation trend is divided into three categories according to the different range of H value [25,26]: anti-persistence, stochasticity and positive persistence. Because the FVC value of the three reservoirs and the Tarim River valley is zero, there is no definition in the calculation: it is null in the figure. As shown in Table 4, the Hurst value of the whole Reclamation area is 0.07~1, with the mean value of 0.63 and the standard deviation of 0.15. The significant anti-persistence areas with a Hurst index lower than 0.5 account for 18.3%, mainly concentrated in the human activity areas around three major reservoirs and the Tarim River valley; the areas with a Hurst index higher than 0.5 account for 81.7% and the areas with positive persistence H values are mainly concentrated in the newly built regiments such as the ninth, eleventh and twelfth regiments, alleviating desertification. It can be seen that the positive persistence trend is stronger than the anti-persistence trend, and the trend of vegetation coverage in Alar Reclamation area in the future is consistent with that in 1990–2020.
The research area is a typical artificial desert oasis located in the north of Tarim Basin, studied from 2000 to 2020. The land use transfer matrix for the study area was calculated using arcgis software for the selected products of GLobeland 30 for the years 2000 and 2020. The land use types in the research area were converted to different degrees (as shown in Table 5 and Figure 9). Among them, the null value indicates that the ground feature types were not converted. It can be seen from the table that the grassland area increased by 32.2%, the cultivated land area increased by 21.2% and the forest land area decreased by 88% in the past 30 years; forest land has been converted into grassland, cultivated land and water bodies. The area of construction land increased by 64.4%, and the overall change in water body was relatively small, increasing by 13%. It can be said that the impact of human activities on vegetation coverage is far greater than that of natural factors. The promotion of urbanization and the implementation of ecological and environmental protection policies are the main driving factors for the spatial–temporal change in vegetation coverage in the research area.
Urban expansion is mainly reflected in population growth and economic development, and human economic activities are an important influencing factor in vegetation cover change [27]. According to the analysis of land cover dynamics in desert oasis areas, the change in vegetation cover in Alar from 2000 to 2020 shows an increase in urban construction land and arable forest land, with urban construction land having a more pronounced impact on socio-economic factors compared to arable and forest land, and the driving forces affecting the change in the three land types in Alar City are gradually strengthening. Analysis of the statistical yearbook shows that the total agricultural output value in Alar from 2000 to 2020 increased by 21,952.82 billion yuan, the total forestry output value increased by 2901.8 million yuan, the cultivated area of food crops decreased by 88,500 hectares and the total sown area of crops increased by 884,400 hectares [28,29]. This paper uses multiple linear regression, the coefficient of variation and Hurst index to explore and analyze the changes in vegetation cover in the Alar region in different years, adding multifactorial considerations to ensure that the research results are more objective and reasonable.

4. Conclusions

Based on the Google Earth Engine cloud platform, taking the Alar Reclamation area as the research area, this paper calculated the time series of vegetation coverage in the research area for 30 years with the use of Landsat series image data from 1990 to 2020. In addition, analysis on the temporal and spatial pattern and variation trend was conducted from the aspects of Slope regression analysis, coefficient of variance, Hurst index, etc., and the role of human activities and climate factors in vegetation evolution was explored. It is expected to provide a scientific basis for ecological environment protection and the control of the desert oasis.
The results indicate the following:
(1)
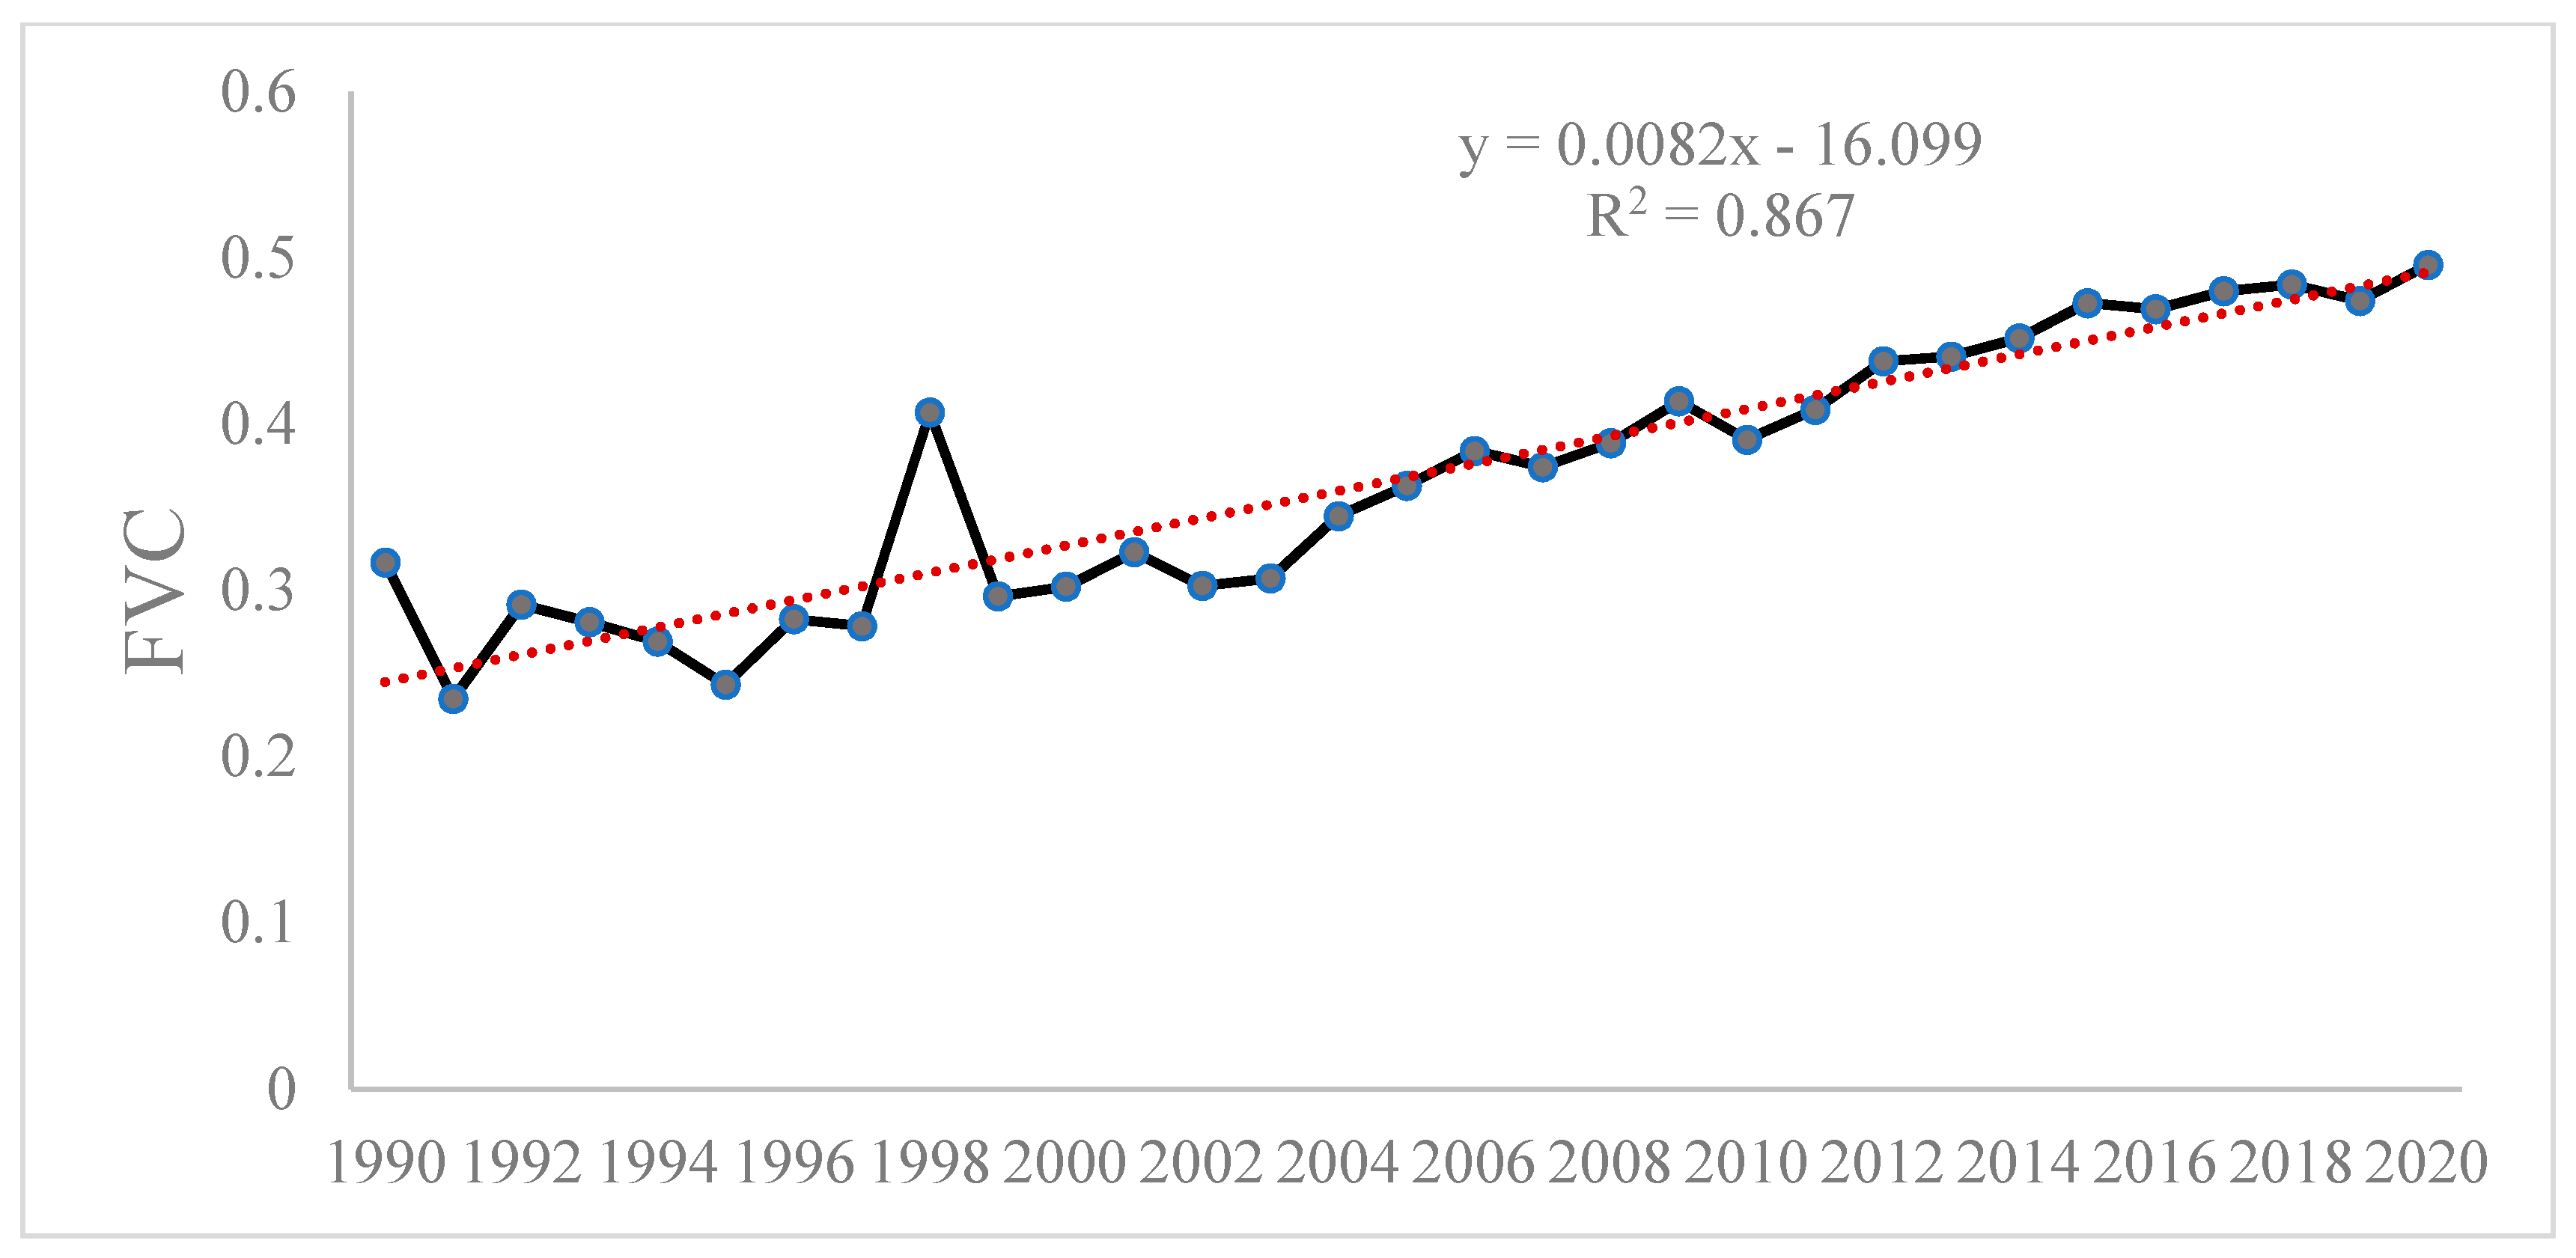
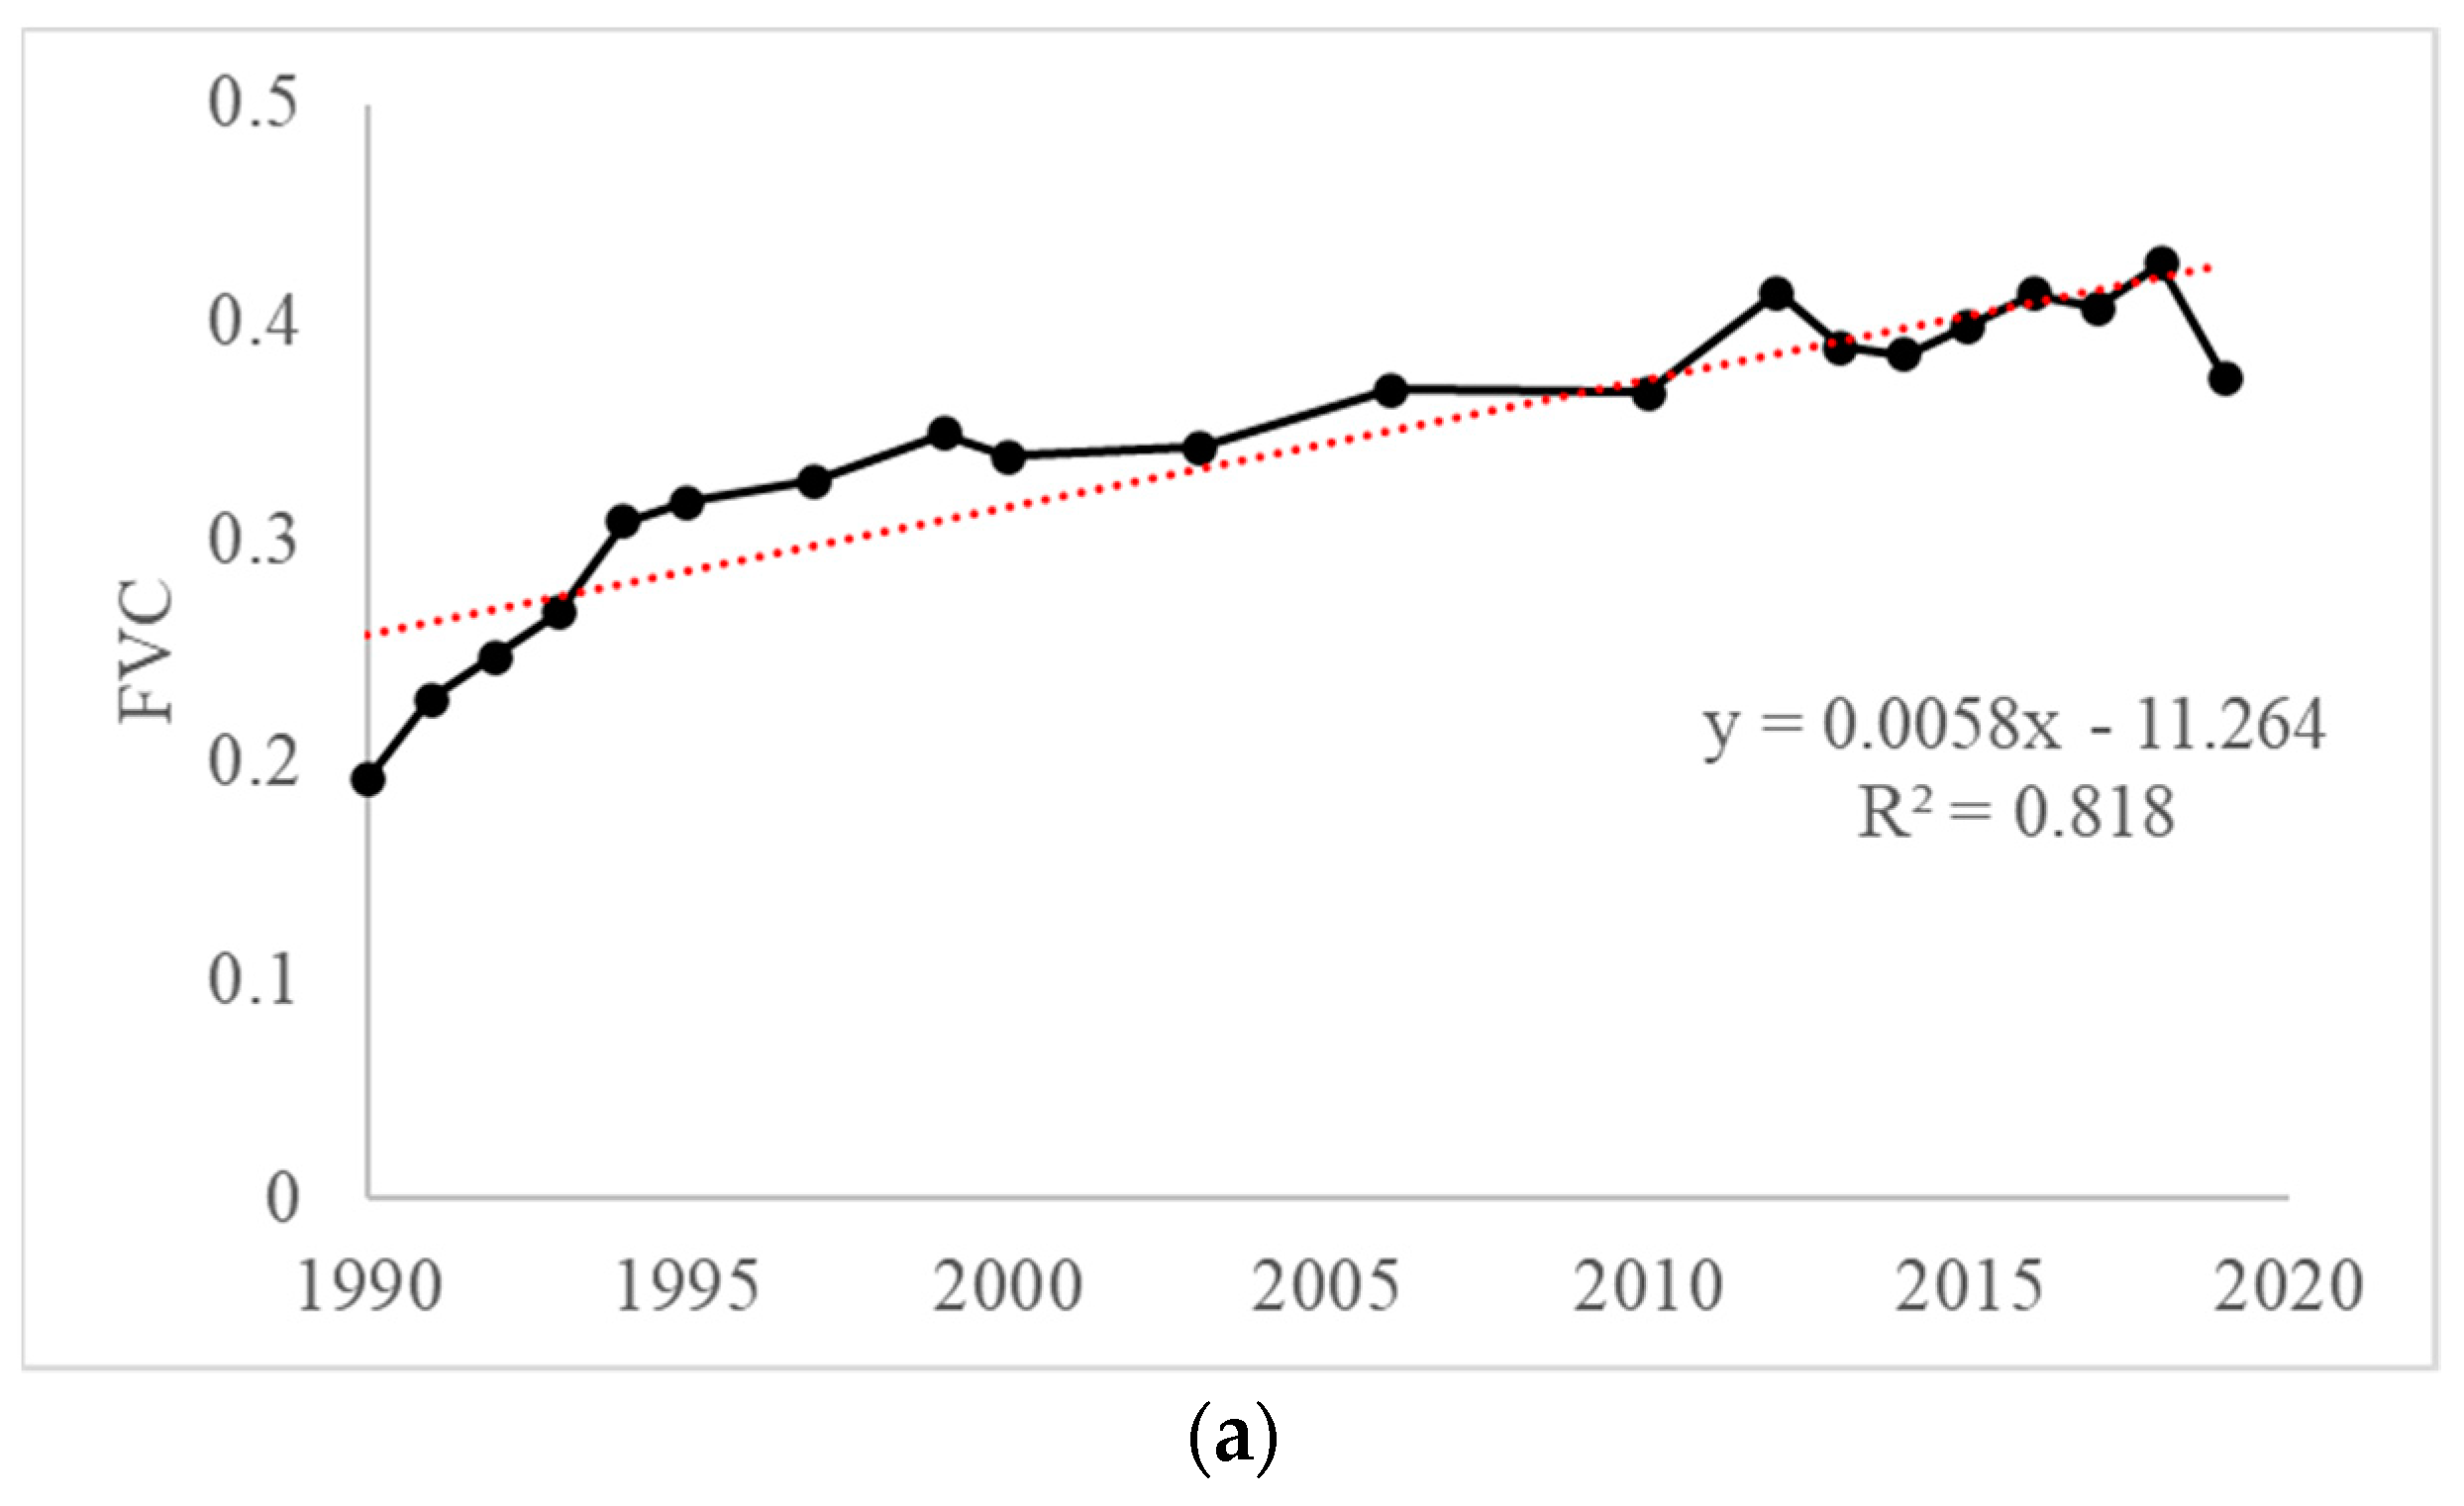
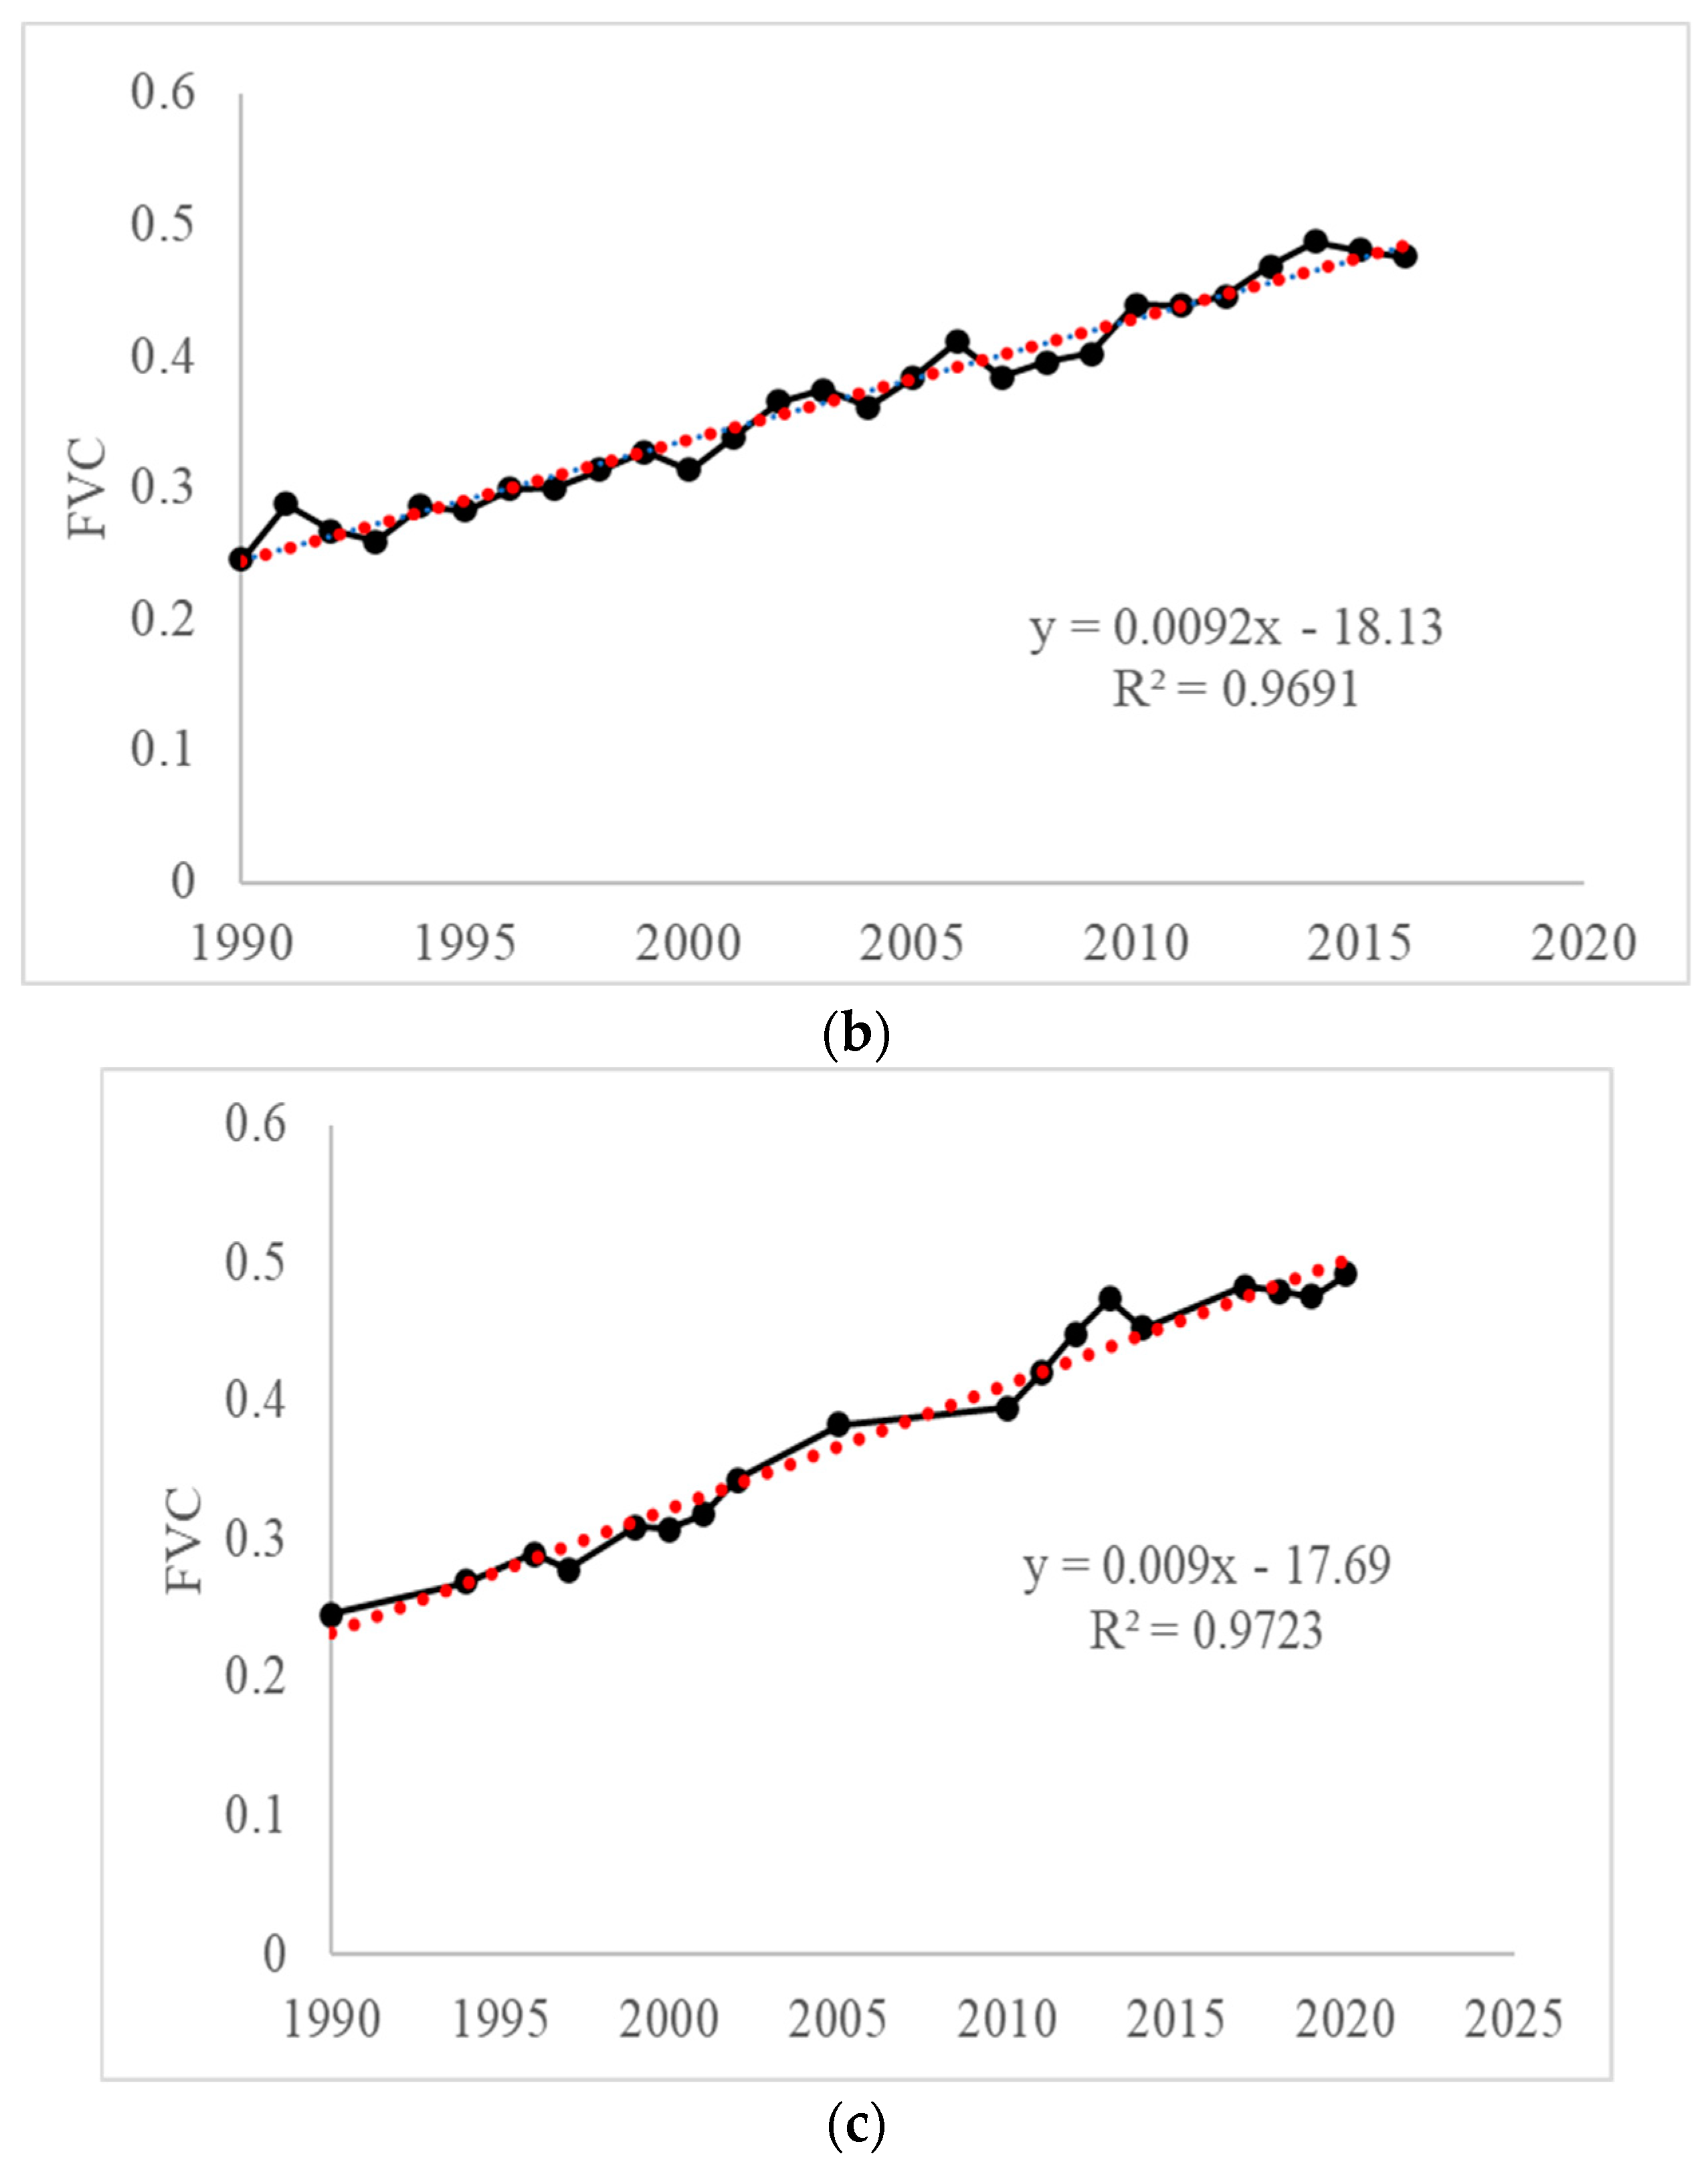
From 1990 to 2020, desert control in the Alar Reclamation area achieved notable results, and the vegetation coverage showed a significant upward trend, with the R2 of 0.89 and the annual growth rate of 3.8%/10a. The overall trend of FVC remained positive, but the variation rate and amplitude were different. The climate improved with the management of the environment and, due to its geographical location and other characteristics, the average annual amount of sunshine is currently sufficient and the vegetation cover is at its highest in the summer and lower in the spring due to the presence of extreme weather such as dust storms. The annual FCV mean in the research area shows a positive correlation trend of fluctuation change with a slow increase.
(2)
Based on the estimation of the Slope trend analysis, the vegetation coverage in the Alar Reclamation area in the recent 30 years has significantly improved, with the vegetation coverage improvement area accounting for 62.6% and the basically invariant area accounting for 19%. Among them, the area that has been improved and passed the significance testing accounts for 42.8% of the total area, showing a spatial distribution pattern of “high vegetation coverage on both sides of the north and south of the Tarim River valley, low vegetation coverage in desert areas”.
(3)
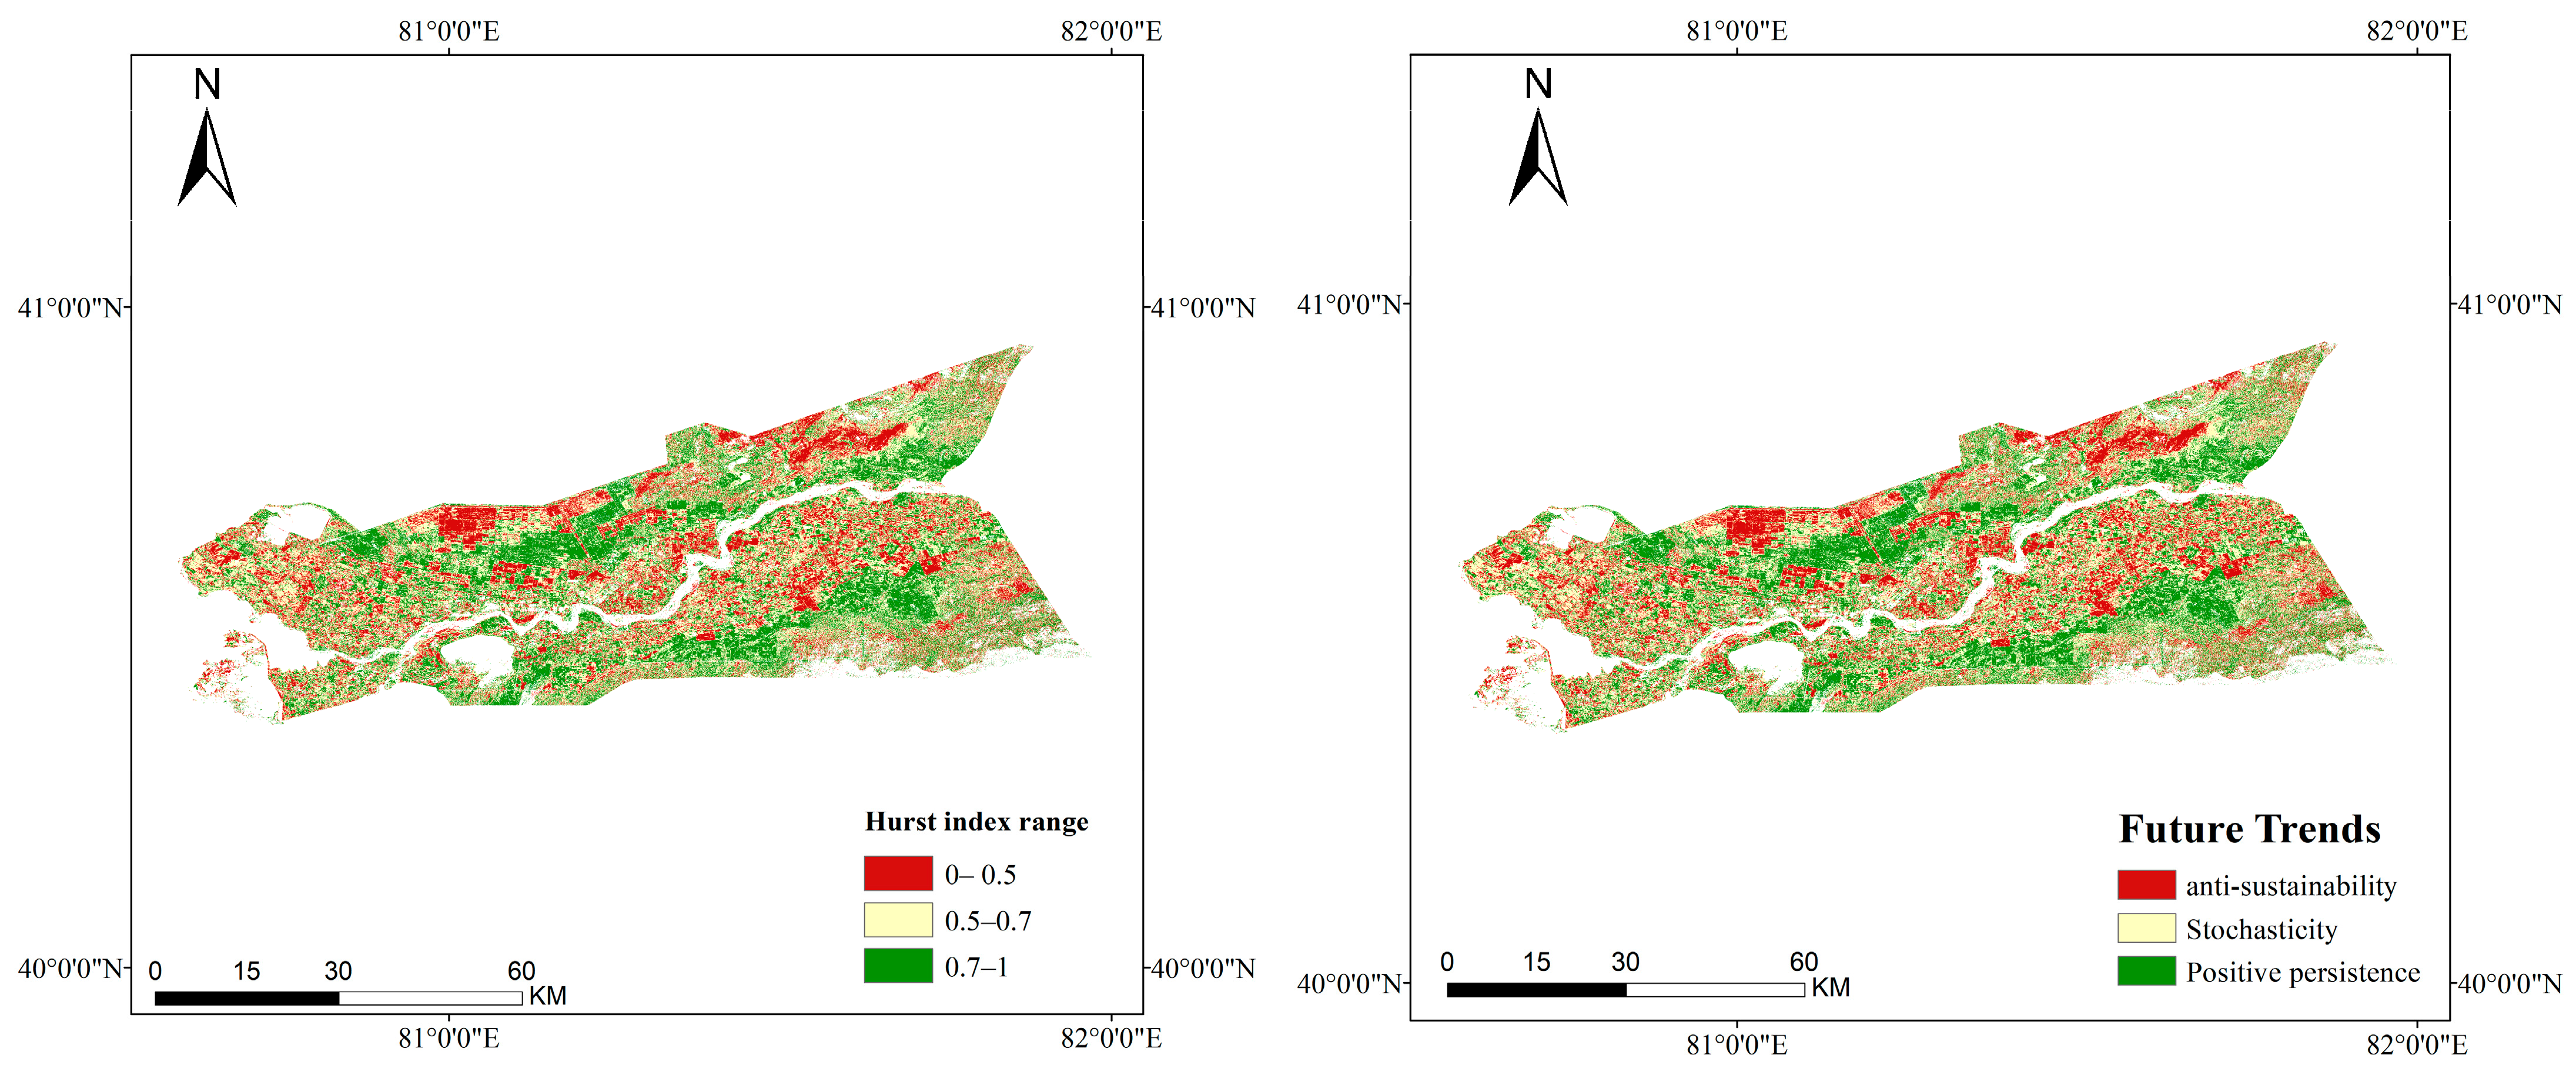
The comprehensive analysis of the coefficient of variance and Hurst index shows that the overall variation trend and persistence of vegetation coverage in the whole research area are positively correlated with each other. In total, 89.52% of the regions with the coefficient of variance below 0.8 are in a relatively stable variation state, and 81.7% of the regions are characterized by medium and strong persistence in the Hurst index, concentrated on both sides of the Tarim River.
(4)
Human activities are the main driving factor for the improvement of vegetation coverage in the Alar Reclamation area; among the natural factors, precipitation is the most important factor affecting the vegetation growth in the research area, because the climate in the research area is mainly arid, with temperature having little influence.
(5)
There is a remote sensing image with long time span and multiresolution on the Google Earth Engine cloud platform, leading to a strong analytical and calculation ability with low time consumption. It is an effective tool to achieve monitoring of vegetation coverage at different scales.

Author Contributions

Conceptualization, X.L. and Z.S.; methodology, X.L.; software, Z.S.; validation, J.Y., J.L. and X.L.; formal analysis, Z.S.; investigation, X.L.; resources, J.Y.; data curation, Z.S.; writing—original draft preparation, X.L. and Z.S.; writing—review and editing, J.Y.; visualization, X.L.; supervision, J.Y.; project administration, J.L.; funding acquisition, J.L. All authors have read and agreed to the published version of the manuscript.

Funding

This research was funded by Corps financial science and technology plan projects under Grants 2021AB022.

Institutional Review Board Statement

Not applicable.

Informed Consent Statement

Not applicable.

Data Availability Statement

The experimental data used to support the findings of this study are available from the corresponding author upon request.

Acknowledgments

The authors would like to show sincere thanks to those technicians who have contributed to this research.

Conflicts of Interest

The authors declare no conflict of interest.

References

  1. Zhang, Y.; Ye, A. Spatial and temporal variations in vegetation coverage observed using AVHRR GIMMS and Terra MODIS data in the mainland of China. Int. J. Remote Sens. 2020, 41, 4238–4268. [Google Scholar] [CrossRef]
  2. Giri, C.; Zhu, Z.; Reed, B. A comparative analysis of the Global Land Cover 2000 and MODIS land cover data sets. Remote Sens. Environ. 2005, 94, 123–132. [Google Scholar] [CrossRef]
  3. Nemani, R.R.; Keeling, C.D.; Hashimoto, H.; Jolly, W.M.; Piper, S.C.; Tucker, C.J.; Myneni, R.B.; Running, S.W. Climate-driven increases in global terrestrial net primary production from 1982 to 1999. Science 2003, 300, 1560–1563. [Google Scholar] [CrossRef] [PubMed]
  4. Carlson, T.N.; Ripley, D.A. On the relation between NDVI, fractional vegetation cover, and leaf area index. Remote Sens. Environ. 1997, 62, 241–252. [Google Scholar] [CrossRef]
  5. Anyamba, A.; Tucker, C.J. Analysis of Sahelian vegetation dynamics using NOAA-AVHRR NDVI data from 1981–2003. J. Arid. Environ. 2005, 63, 596–614. [Google Scholar] [CrossRef]
  6. Piao, S.; Wang, X.; Ciais, P.; Zhu, B.; Wang, T.; Liu, J. Changes in satellite–derived vegetation growth trend in temperate and boreal Eurasia from 1982 to 2006. Glob. Change Biol. 2011, 17, 3228–3239. [Google Scholar] [CrossRef]
  7. Tehrany, M.S.; Pradhan, B.; Jebuv, M.N. A comparative assessment between object and pixel-based classification approaches for land use/land cover mapping using SPOT 5 imagery. Geocarto Int. 2014, 29, 351–369. [Google Scholar] [CrossRef]
  8. Wang, H.; Zhao, X.; Zhang, X.; Wu, D.; Du, X. Long time series land cover classification in China from 1982 to 2015 based on Bi-LSTM deep learning. Remote Sens. 2019, 11, 1639. [Google Scholar] [CrossRef]
  9. Arias, H.A.; Zamora, R.M.; Bolaños, C.V. Metodología para la corrección atmosférica de imágenes Aster, Rapideye, Spot 2 y Landsat 8 con el módulo Flaash del software ENVI. Rev. Geográfica América Cent. 2014, 2, 39–59. [Google Scholar]
  10. Shao, Y.; Lunetta, R.S.; Wheeler, B.; Iiames, J.S.; Campbell, J.B. An evaluation of time-series smoothing algorithms for land-cover classifications using MODIS-NDVI multi-temporal data. Remote Sens. Environ. 2016, 174, 258–265. [Google Scholar] [CrossRef]
  11. Zoungrana, B.J.; Conrad, C.; Thiel, M.; Amekudzi, L.K.; Da, E.D. MODIS NDVI trends and fractional land cover change for improved assessments of vegetation degradation in Burkina Faso, West Africa. J. Arid. Environ. 2018, 153, 66–75. [Google Scholar] [CrossRef]
  12. Gorelick, N.; Hancher, M.; Dixon, M.; Ilyushchenko, S.; Thau, D.; Moore, R. Google Earth Engine: Planetary-scale geospatial analysis for everyone. Remote Sens. Environ. 2017, 202, 18–27. [Google Scholar] [CrossRef]
  13. Gong, L.; He, G.; Liu, W. Long-term cropping effects on agricultural sustainability in Alar oasis of Xinjiang, China. Sustainability 2016, 8, 61. [Google Scholar] [CrossRef]
  14. Li, W.; Jia, S.; He, W.; Raza, S.; Zamanian, K.; Zhao, X. Analysis of the consequences of land-use changes and soil types on organic carbon storage in the Tarim River Basin from 2000 to 2020. Agric. Ecosyst. Environ. 2022, 327, 107824. [Google Scholar] [CrossRef]
  15. Huang, H.; Chen, Y.; Clinton, N.; Wang, J.; Wang, X.; Liu, C.; Gong, P.; Yang, J.; Bai, Y.; Zheng, Y. Mapping major land cover dynamics in Beijing using all Landsat images in Google Earth Engine. Remote Sens. Environ. 2017, 202, 166–176. [Google Scholar] [CrossRef]
  16. Li, F.; Chen, W.; Zeng, Y.; Zhao, Q.; Wu, B. Improving estimates of grassland fractional vegetation cover based on a pixel dichotomy model: A case study in Inner Mongolia, China. Remote Sens. 2014, 6, 4705–4722. [Google Scholar] [CrossRef]
  17. Jiapaer, G.; Chen, X.; Bao, A. A comparison of methods for estimating fractional vegetation cover in arid regions. Agric. For. Meteorol. 2011, 151, 1698–1710. [Google Scholar] [CrossRef]
  18. Gao, L.; Wang, X.; Johnson, B.A.; Tian, Q.; Wang, Y.; Verrelst, J.; Mu, X.; Gu, X. Remote sensing algorithms for estimation of fractional vegetation cover using pure vegetation index values: A review. ISPRS J. Photogramm. Remote Sens. 2020, 159, 364–377. [Google Scholar] [CrossRef]
  19. Da Silva, R.M.; Santos, C.A.; Moreira, M.; Corte-Real, J.; Silva, V.C.; Medeiros, I.C. Rainfall and river flow trends using Mann–Kendall and Sen’s slope estimator statistical tests in the Cobres River basin. Nat. Hazards 2015, 77, 1205–1221. [Google Scholar] [CrossRef]
  20. Leigang, S.; Jianfeng, L.; Quanhong, X. Remote Sensing based temporal and spatial analysis of vegetation cover changes in Bashang Area of Hebei Province. Remote Sens. Nat. Resour. 2014, 26, 167–172. [Google Scholar]
  21. von Wehrden, H.; Wesche, K. Relationships between climate, productivity and vegetation in southern Mongolian drylands. Basic Appl. Dryland Res. 2007, 1, 100. [Google Scholar] [CrossRef]
  22. Hájková, P.; Wolf, P.; Hájek, M. Environmental factors and Carpathian spring fen vegetation: The importance of scale and temporal variation. Ann. Bot. Fenn. 2004, 41, 249–262. [Google Scholar]
  23. Xie, Y.; Qiu, K.; Xu, D.; Shi, X.; Qi, T.; Pott, R. Spatial heterogeneity of soil and vegetation characteristics and soil-vegetation relationships along an ecotone in Southern Mu Us Sandy Land, China. J. Soils Sediments 2015, 15, 1584–1601. [Google Scholar] [CrossRef]
  24. Gui-gang, W.; Ke-fa, Z.; Li, S.; Yan-fang, Q.; Xue-mei, L. Study on the vegetation dynamic change and R/S analysis in the past ten years in Xinjiang. Remote Sens. Technol. Appl. 2011, 25, 84–90. [Google Scholar]
  25. Kalisa, W.; Igbawua, T.; Henchiri, M.; Ali, S.; Zhang, S.; Bai, Y.; Zhang, J. Assessment of climate impact on vegetation dynamics over East Africa from 1982 to 2015. Sci. Rep. 2019, 9, 1–20. [Google Scholar]
  26. Ying, L.; Enke, H.; Hui, Y. Dynamic monitoring and trend analysis of vegetation change in Shendong mining area based on MODIS. Remote Sens. Nat. Resour. 2017, 29, 132–137. [Google Scholar]
  27. Schulz, J.J.; Cayuela, L.; Rey-Benayas, J.M.; Schröder, B. Factors influencing vegetation cover change in Mediterranean Central Chile (1975–2008). Appl. Veg. Sci. 2011, 14, 571–582. [Google Scholar] [CrossRef]
  28. Feike, T.; Mamitimin, Y.; Li, L.; Doluschitz, R. Development of agricultural land and water use and its driving forces along the Aksu and Tarim River, PR China. Environ. Earth Sci. 2015, 73, 517–531. [Google Scholar] [CrossRef]
  29. Zhang, Z.; Xia, F.; Yang, D.; Huo, J.; Wang, G.; Chen, H. Spatiotemporal characteristics in ecosystem service value and its interaction with human activities in Xinjiang, China. Ecol. Indic. 2020, 110, 105826. [Google Scholar] [CrossRef]
Figure 1. Geographical location of the study area.
Applsci 13 05394 g001
Figure 2. Annual FVC change trend in Alar from 1990 to 2020.
Applsci 13 05394 g002
Figure 3. (a) Trends of spring vegetation coverage in Alar from 1990 to 2020. (b) Trends of summer vegetation coverage in Alar from 1990 to 2020. (c) Trends of autumn vegetation coverage in Alar from 1990 to 2020.
Applsci 13 05394 g003aApplsci 13 05394 g003b
Figure 4. Spatial distribution of each seasonal vegetation coverage in 2020.
Applsci 13 05394 g004
Figure 5. Spatial distribution of different levels of vegetation coverage in different stages.
Applsci 13 05394 g005
Figure 6. Hierarchical distribution of the changing trend of vegetation coverage. SD: Significant degradation; BS: Basically stable; SE: Significant enhancement.
Applsci 13 05394 g006
Figure 7. Spatial distribution of vegetation cover variation coefficients in the study area in 2020.
Applsci 13 05394 g007
Figure 8. Spatial distribution of Hurst index and FVC in the future from 1990 to 2020.
Applsci 13 05394 g008
Figure 9. Land-use-type transfer map from 2010 to 2020.
Applsci 13 05394 g009
Table 1. Descriptions about Landsat images in GEE.
LandsatSensorRed BandNear-Infrared BandImage Dataset IDDataset Availability
Landsat 5ETMB3B4LANDSAT/LT05/C01/T1_SR1990-03 to 1998-10
Landsat 7ETM+B3B4LANDSAT/LE07/C01/T1_SR1999-03 to 2012-10
Landsat 8OLI/TIRSB4B5LANDSAT/LC08/C01/T1_SR2013-03 to 2020-10
Table 2. Fractional Vegetation Cover (FVC) classification.
LevelsFVC (%)Classification Characteristics
<20Low vegetation cover (basically no vegetation on the surface, bare soil, bare rock, water, etc.)
20~40Medium–low vegetation cover
40~60Medium vegetation cover
60~80Medium–high vegetation cover
≥80High vegetation cover
Table 3. FVC change stability of Alar Reclamation area from 1990 to 2020.
CV Variation RangeDegree of VariationNumber of PixelsImage Area as a
Percentage
0 < CV ≤ 0.2Stable12,263,55323.82%
0.2 ≤ CV < 0.5Relatively stable22,340,09043.40%
0.5 ≤ CV < 0.8Weakly variable11,477,88922.30%
0.8 ≤ CV < 2.13Highly variable5,396,17110.48%
Table 4. Types of future vegetation trends in the Alar Reclamation area and the proportion of image numbers.
H Value RangeNumber of PixelsImage Area as a Percentage
0 < H < 0.42,483,0595.7%
0.4 < H < 0.55,537,24112.6%
0.5 < H < 0.68,140,30918.5%
0.6 < H < 0.711,019,37925.1%
0.7 < H < 0.810,202,82623.2%
0.8 < H < 16,540,83114.9%
Table 5. Land use transfer matrix for 2000–2020 for the Alar Reclamation Region.
GrasslandCroplandBareArtificial SurfaceForestsWetlandsWater Bodies
Area of different land use types in 2000/(km2)745.882257.67 1379.38 81.9733.10 94.30237.39
Area of different land use types in 2020/(km2)385.78 2028.55904.69 71.0015.6341.51 142.97
Area transfer difference/(km2)360.1229.12474.6910.9717.4752.7994.42
Disclaimer/Publisher’s Note: The statements, opinions and data contained in all publications are solely those of the individual author(s) and contributor(s) and not of MDPI and/or the editor(s). MDPI and/or the editor(s) disclaim responsibility for any injury to people or property resulting from any ideas, methods, instructions or products referred to in the content.

