1. Introduction
IR images are formed by using different temperatures of the target and background. The uncooled IR focal plane array imaging technology has some advantages such as lower weight and power consumption. It is widely used in IR detectors [
1]. Meanwhile, the technique produces IR images with lower contrast, unclear edges, and complex noise under the imaging environment. IR images have a smaller signal-to-noise ratio (SNR) and have no clear texture and details [
2]. To achieve a better result for IR target detection, we must complete noise reduction. The noise of IR images mainly includes uniform noise and Gaussian noise, which are caused by air radiation, the environment, and noise.
The traditional denoising algorithm contains inter-frame and single-frame noise reduction. Single-frame denoising includes transformation-domain filtering, and inter-frame denoising mainly adopts time-domain filtering [
3]. Space filtering covers Gaussian filtering, average filtering, and median filtering. These filterings are unable to use the difference between pixel characters, which causes some details to be ambiguous. The denoising performance is worse under the complex background [
4]. The frequency-domain methods include FFT filtering, butterworth filtering, bilateral filtering, and wavelet filtering. We can segment the noise spectrum and the useful signal spectrum with the above algorithms. As the noise spectrum is located all over the frequency, the signal still mixes the noise, and they cannot be completely segmented [
5]. This article proposes the nonlocal mean filtering and uses nonlocal similarity to compose the Gaussian weight [
6]. It can improve the resolution of the details and edges. Time-domain filtering contains the frame average filtering and weighted time-domain filtering. Several authors have risen the frame average filtering to protect the edge of the image [
7]. This results in image trailing and blurring with the movement of the image. Other authors have considered the moving property and have completed the best match according to the moving trajectory [
8]. Here, the trailing phenomenon was reduced. However, the method needs to finish the frame match with higher computation complexity. The traditional denoising algorithms are limited to concrete real IR images.
Thus far, researchers have fixed their eyes on sparse representation [
9]. The background is represented by an overcomplete dictionary with some sparse coefficients. We can extract the eigenvalue of the useful signal to restore the edges and detail texture in IR images [
10]. This articleraises the sparse 3D transform-domain collaborative filtering (BM3D) to image denoising. This is more suitable for images with white Gaussian noise (WGN) with high time costs. Other researchers have given the solution to replace the
norm with
norm minimization [
11]. This can decrease the hardship of the problem with a limited result [
12]. It was proposed that the sparse representation can attain the eigenvector for reconstructing the original image. This method can recognize details and edges with a high level of complexity. The authors of another study placed the non-local correlation into the sparse representation. They designed a proper sub-director and sub-sparse vector to improve recognition ability and to achieve a high peak signal-to-noise ratio (PSNR) [
13]. Before denoising, a great deal of work must be conducted [
14]. K-means singular value decomposition (KSVD) was used to solve the principal component analysis (PCA) problem. The method is not convex optimization, and it cannot obtain a globally optimal solution [
15]. The over-complete dictionary to learn was adopted. Through a redundant dictionary, a better sparse effect could be achieved. It is more robust in a complex environment [
16]. The nuclear norm model was used to represent sparsity. It is the slack approximate of the convex optimization and it has a better convergence effect on denoising, but it ignores and obscures some details. Article [
17] considers the meaning of the eigenvalue and uses the WNNM model to strengthen the sparsity to achieve better convergence. The important details and texture are kept with the higher complexity. PSNR is better than
dB in some real images and test images compared with the nuclear norm model [
18]. The nonlocal similarity and the whole sparsity were taken into consideration. The sparsity definitions of IR images were optimized for the denoising effect. But It is of higher complexity. The authors proposed a new denoising method called EMD–ITF that was based on empirical mode decomposition (EMD) and the improved thresholding function (ITF). An improved threshold is used to suppress noise and to improve the signal-to-noise ratio (SNR) [
19]. The SNR of the denoising signal exceeds the original signal with
dB. Venish Suthar adopted a reliable method to identify compound faults in bearings when the availability of experimental data was limited [
20]. This can detect compound faults with 100% ten-fold cross-validation accuracy. This is used in some forms of digital signal processing and is suitable for specific signals with noise.
Deep learning is widely used in visible light image denoising, hyperspectral image denoising, and high-resolution image denoising. It is rarely used in infrared data sets. A large number of annotated data sets is needed to utilize hyper-spectrum images and high-resolution images for denoising. DnCNN [
21] integrates local and global features with residual dense blocks in a deeper convolutional neural network (CNN) in image recovery, where more robust characteristics are required. FFDNet [
22] uses a non-uniform noise level map as the input and runs on down-sampled sub-images. The method achieves a better trade-off between computation ability and denoising performance in synthetic and real noisy images. An attention-guided denoising convolutional neural network (ADNet) contains a sparse block, a feature enhancement block, an attention block, and a reconstruction block [
23]. The influences of the shallow layers on deep layers could be enhanced. However, with a high level of noisy images, it suffers from rapid performance degradation. The article [
24] proposes a multi-stage image denoising CNN with the wavelet transform to further remove redundant features. The process refines the obtained features and reconstructs the clean image with improved residual dense architectures. The authors of another study proposed a trust-based security system [
25]. This was utilized to balance the security, transmission performance, and energy efficiency. One article proposed an energy-cost-per-useful-bit (ECPUB) method [
26]. ECPUB can evaluate the energy efficiency and facilitate the balance of network load. A trust management-based and low-energy-adaptive clustering hierarchy protocol outperformed it in prolonging the network lifetime and in balancing energy consumption [
27]. As is known, the number of publicly-annotated infrared data sets is relatively small. The different levels of noise mostly need different CNN models. Deep learning methods usually have some limitations in denoising performance under high-noise environments.
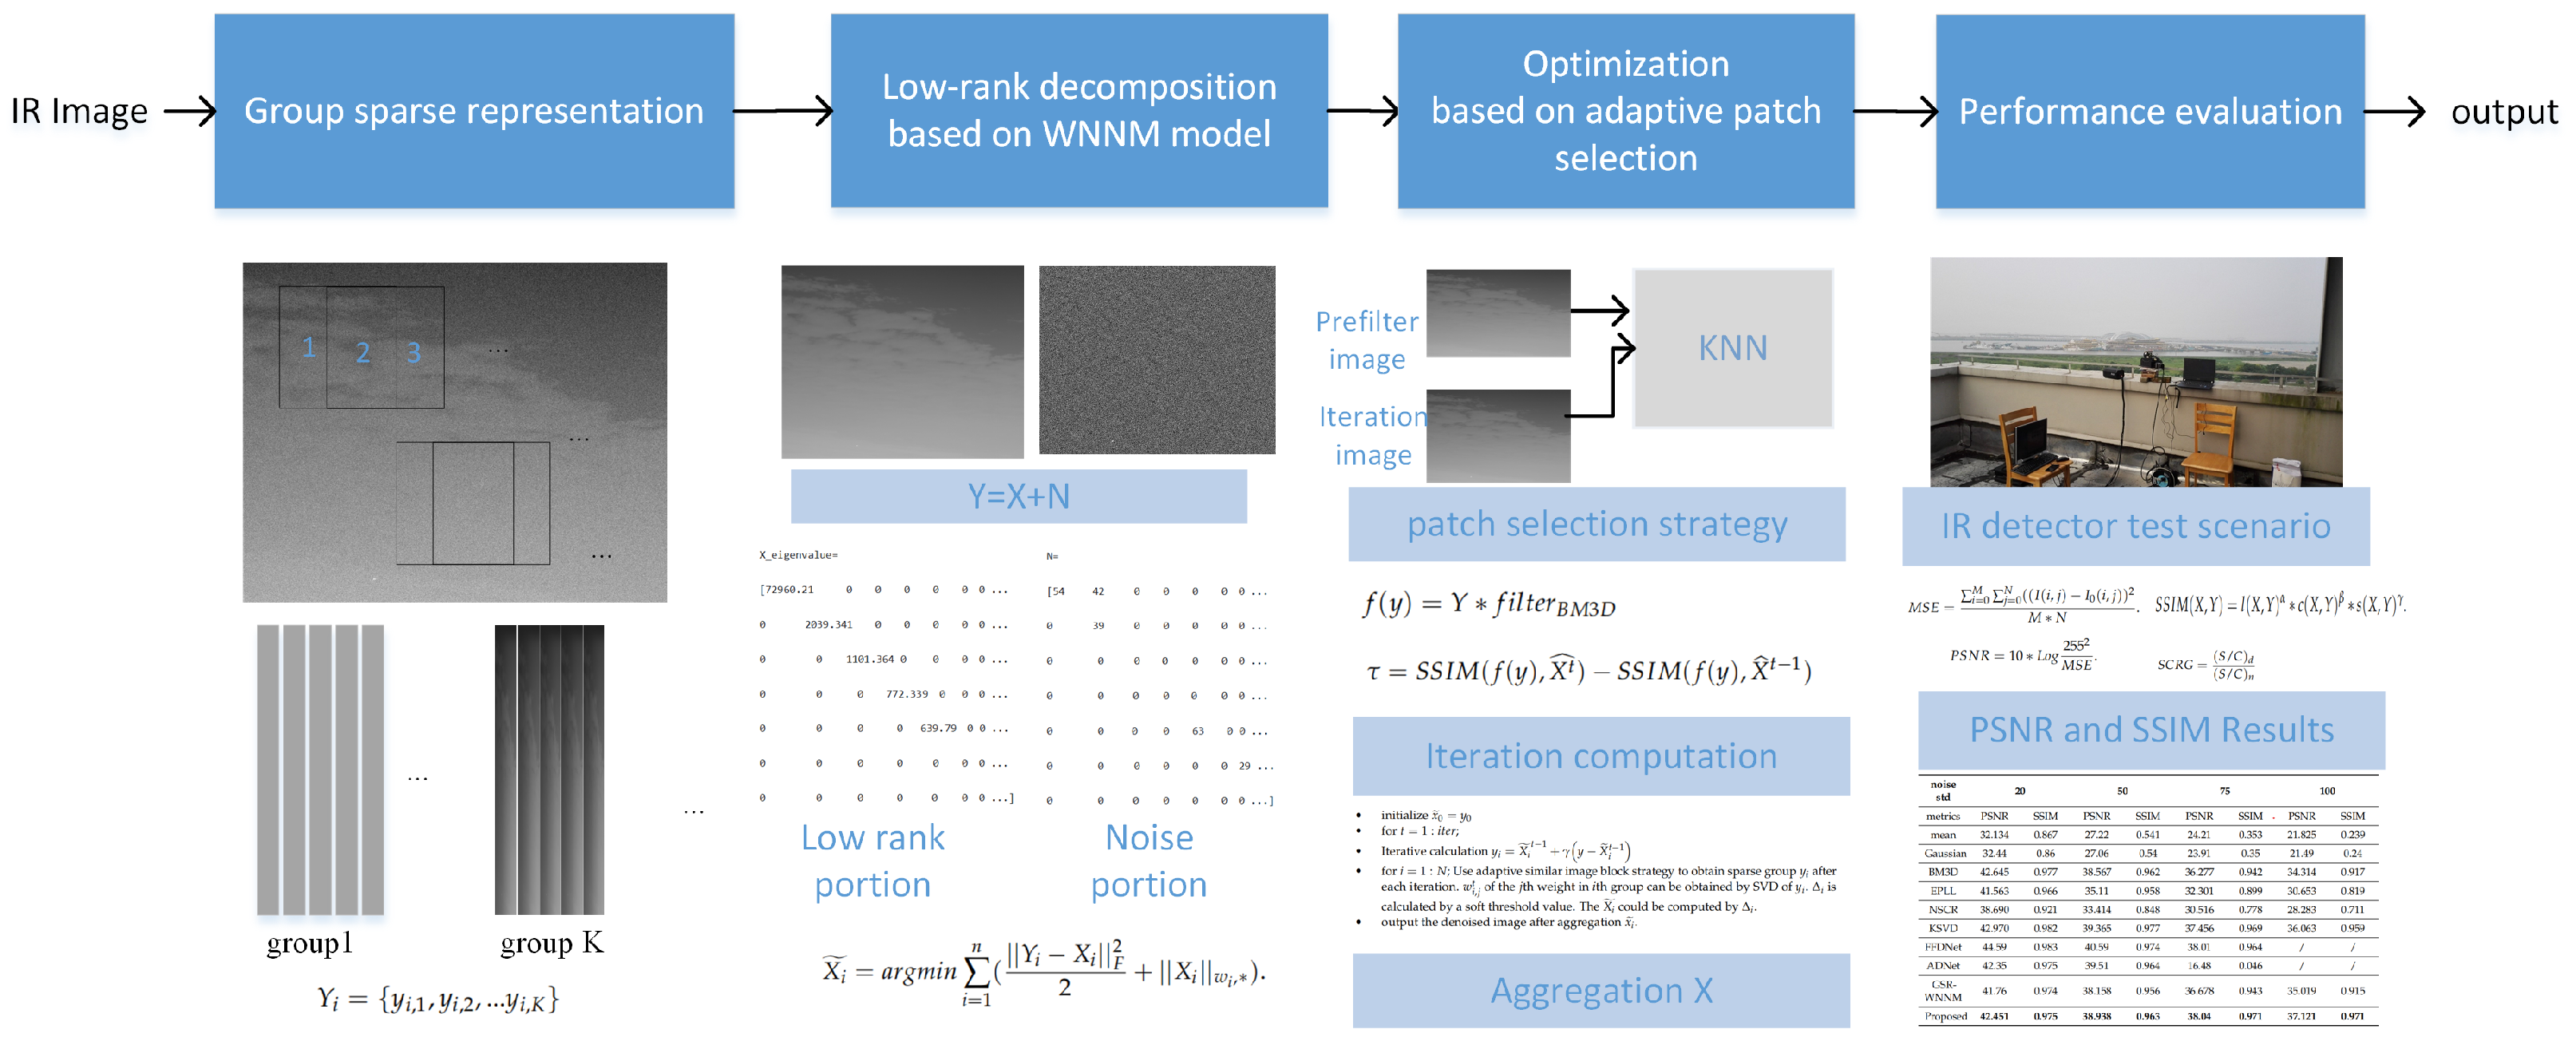
Our article proposes the improved WNNM based on the group sparsity model to the IR single image frame with high WGN. The group has a more similar structure as a result of the adaptive clustering of groups. It has strengthened the sparsity of all groups. The WNNM model could achieve clearer details after multi-iterations. The simulation illustrates that the algorithm can effectively outperform some popular denoising methods in terms of PSNR and SSIM index in typical IR images and real IR sequences. As a result, we can achieve a higher local signal to the clutter ration of the small target in IR images. It is useful for us to detect small targets in IR detection systems for remote sensing.
3. Results
The simulation uses MATLAB R2016a software and runs on a personal computer with Intel core i7 CPU and 16 GB RAM. We test our method in data sets (12) and IR sequences using an IR detector.
The typical gray images are widely used for simulation analysis. In
Figure 1,
Figure 2,
Figure 3,
Figure 4,
Figure 5,
Figure 6,
Figure 7,
Figure 8,
Figure 9,
Figure 10,
Figure 11 and
Figure 12, the pixel size is 256 × 256. Adding Gaussian noise with different std, we adopt a pair of different parameters. The results of the denoising effect are not the same in many experiments. We adjust the parameters to attain better denoising results. Setting the std of WGS as
, separately, we choose the corresponding patch size 6 × 6, 7 × 7, 8 × 8, 9 × 9. Similar patches are designed with
. Additionally, the reference index
and
c are set to be
. The searching windows could be 30 and the error
. The adaptive similar block setting parameter
f is
. Finally, we complete all simulations based on our settings.
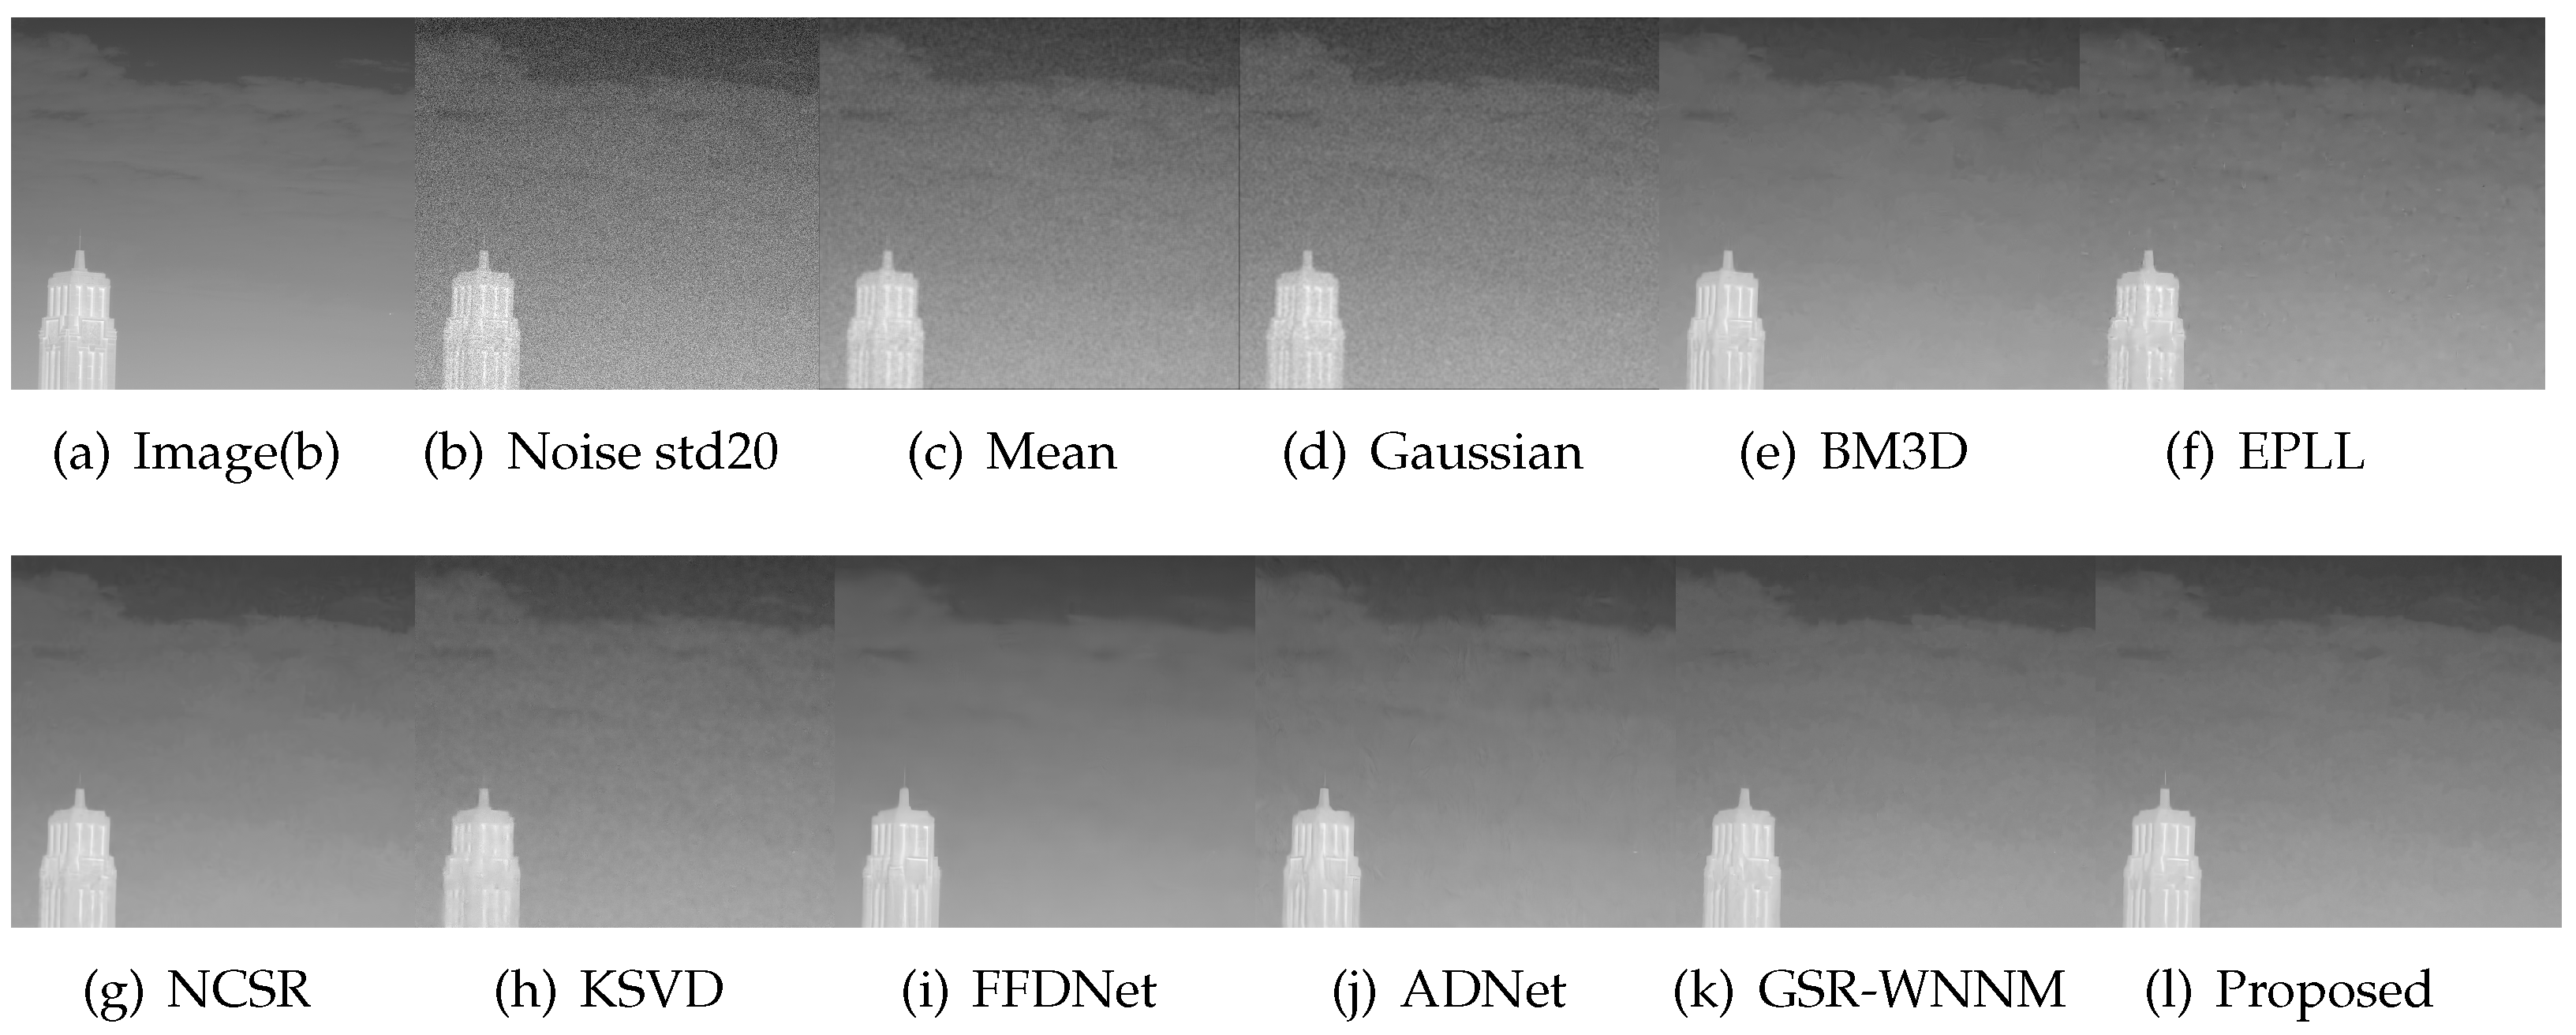
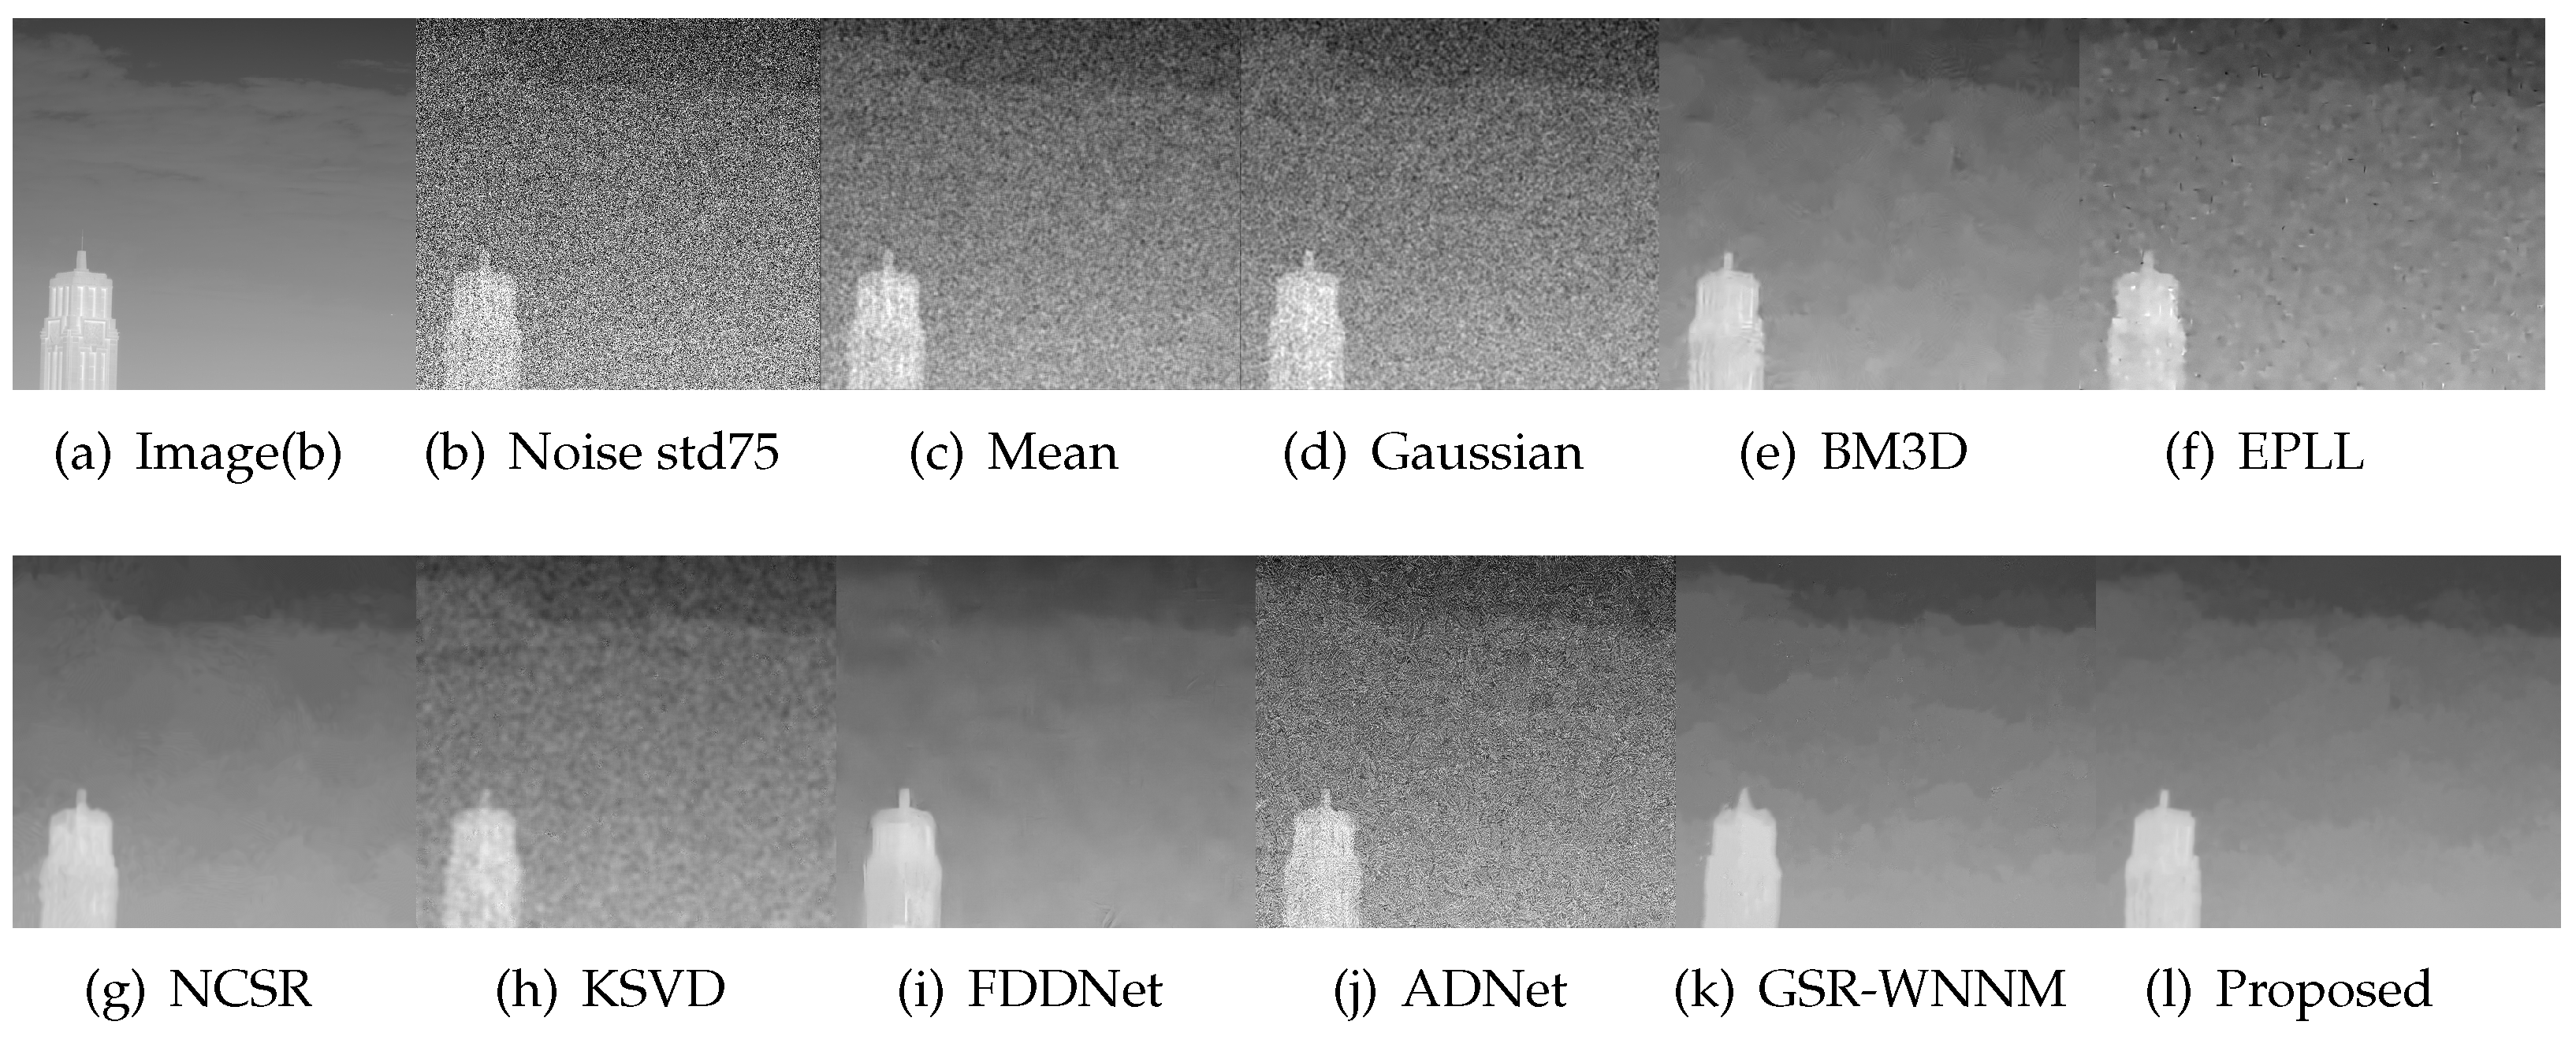
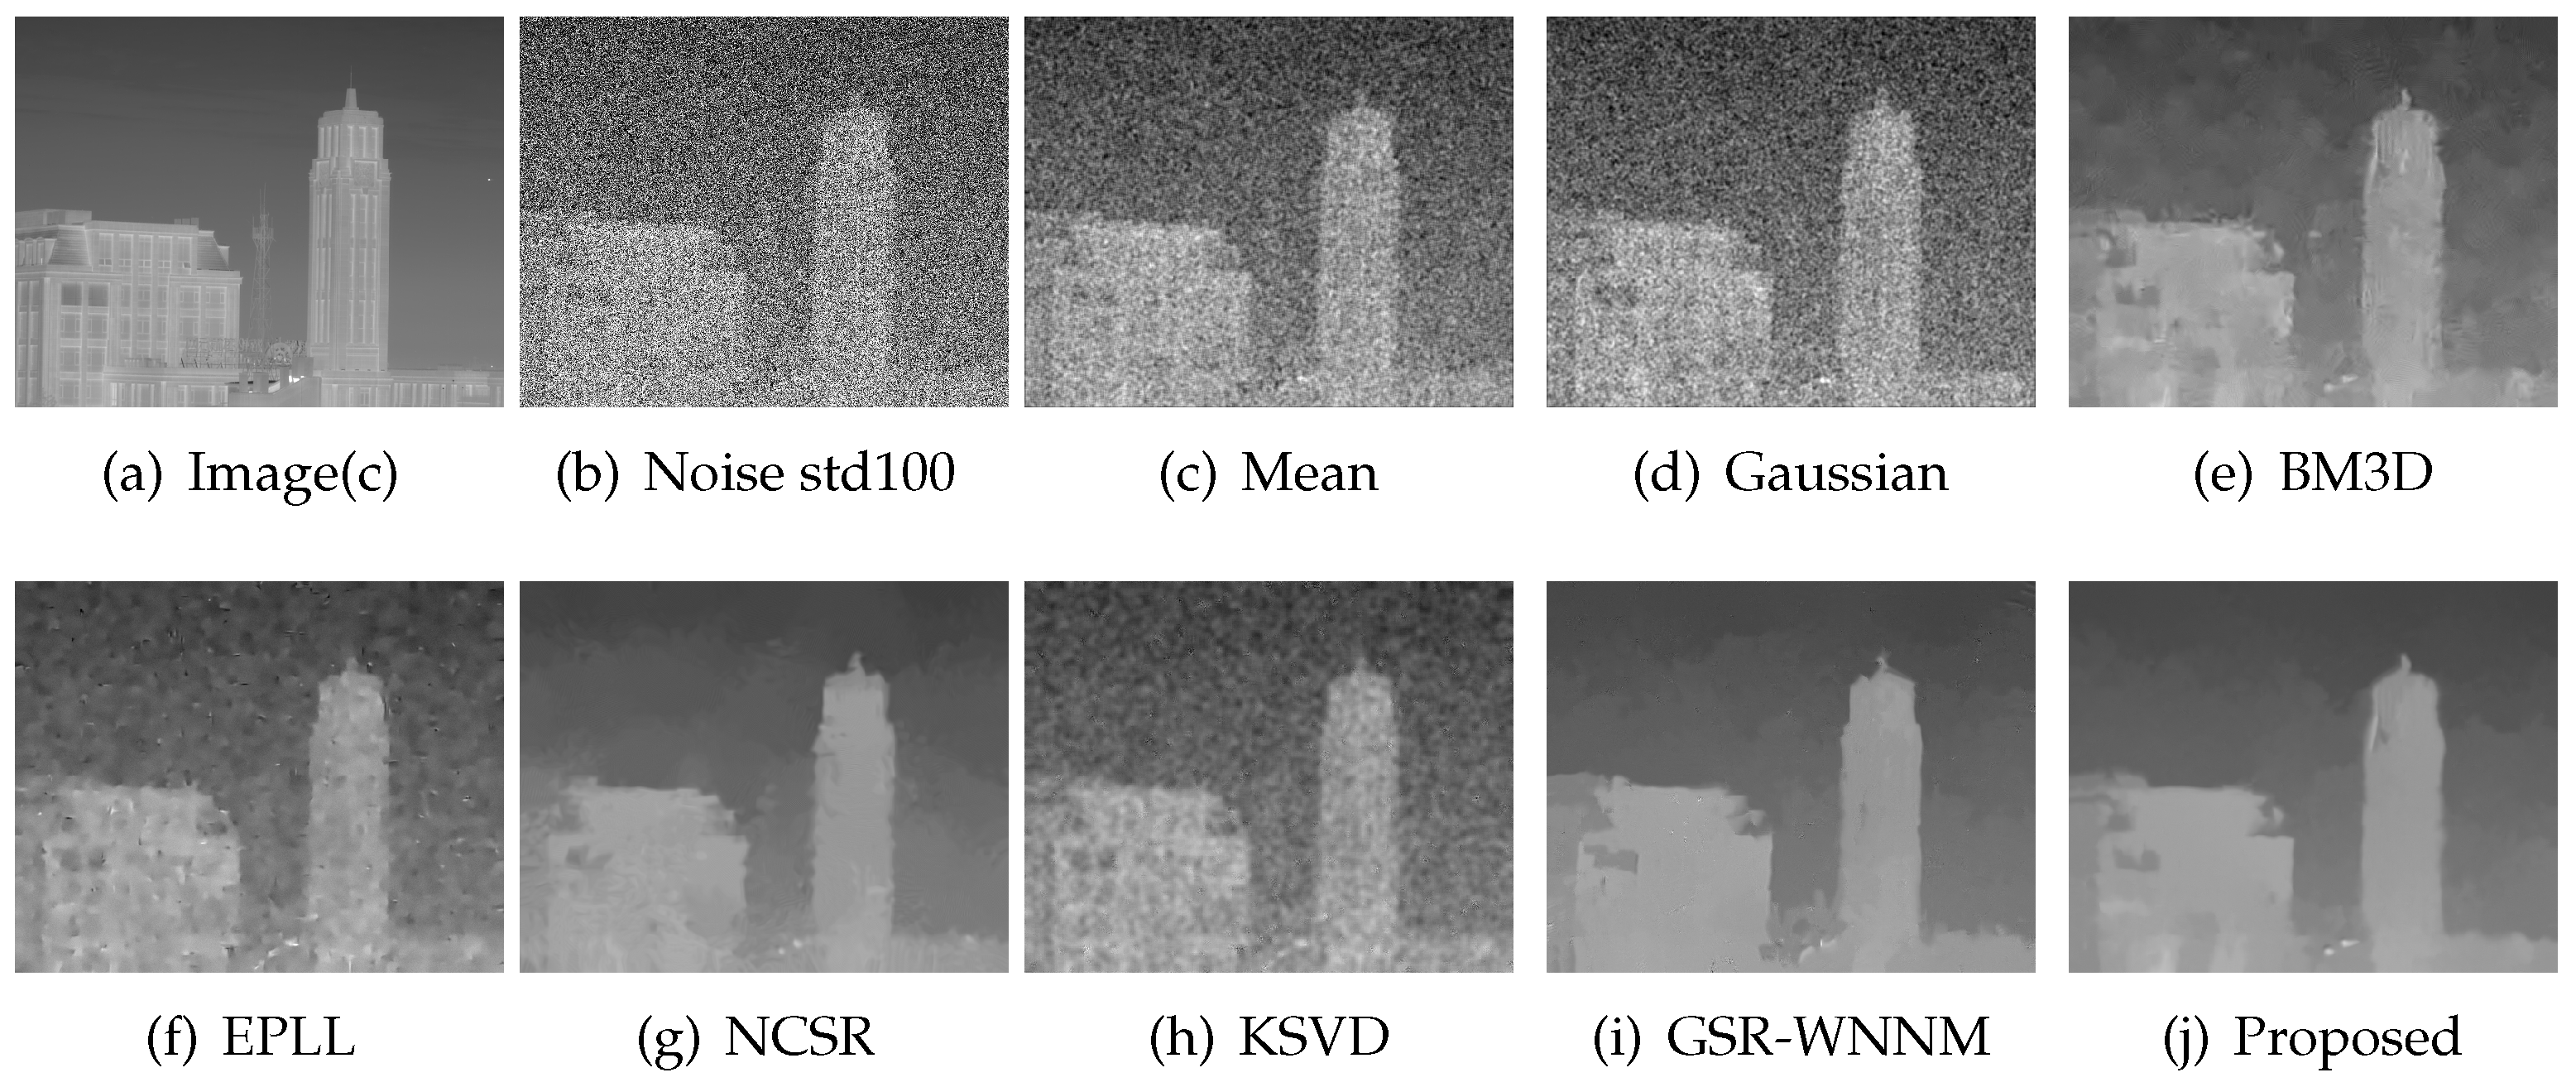
The typical images including
,
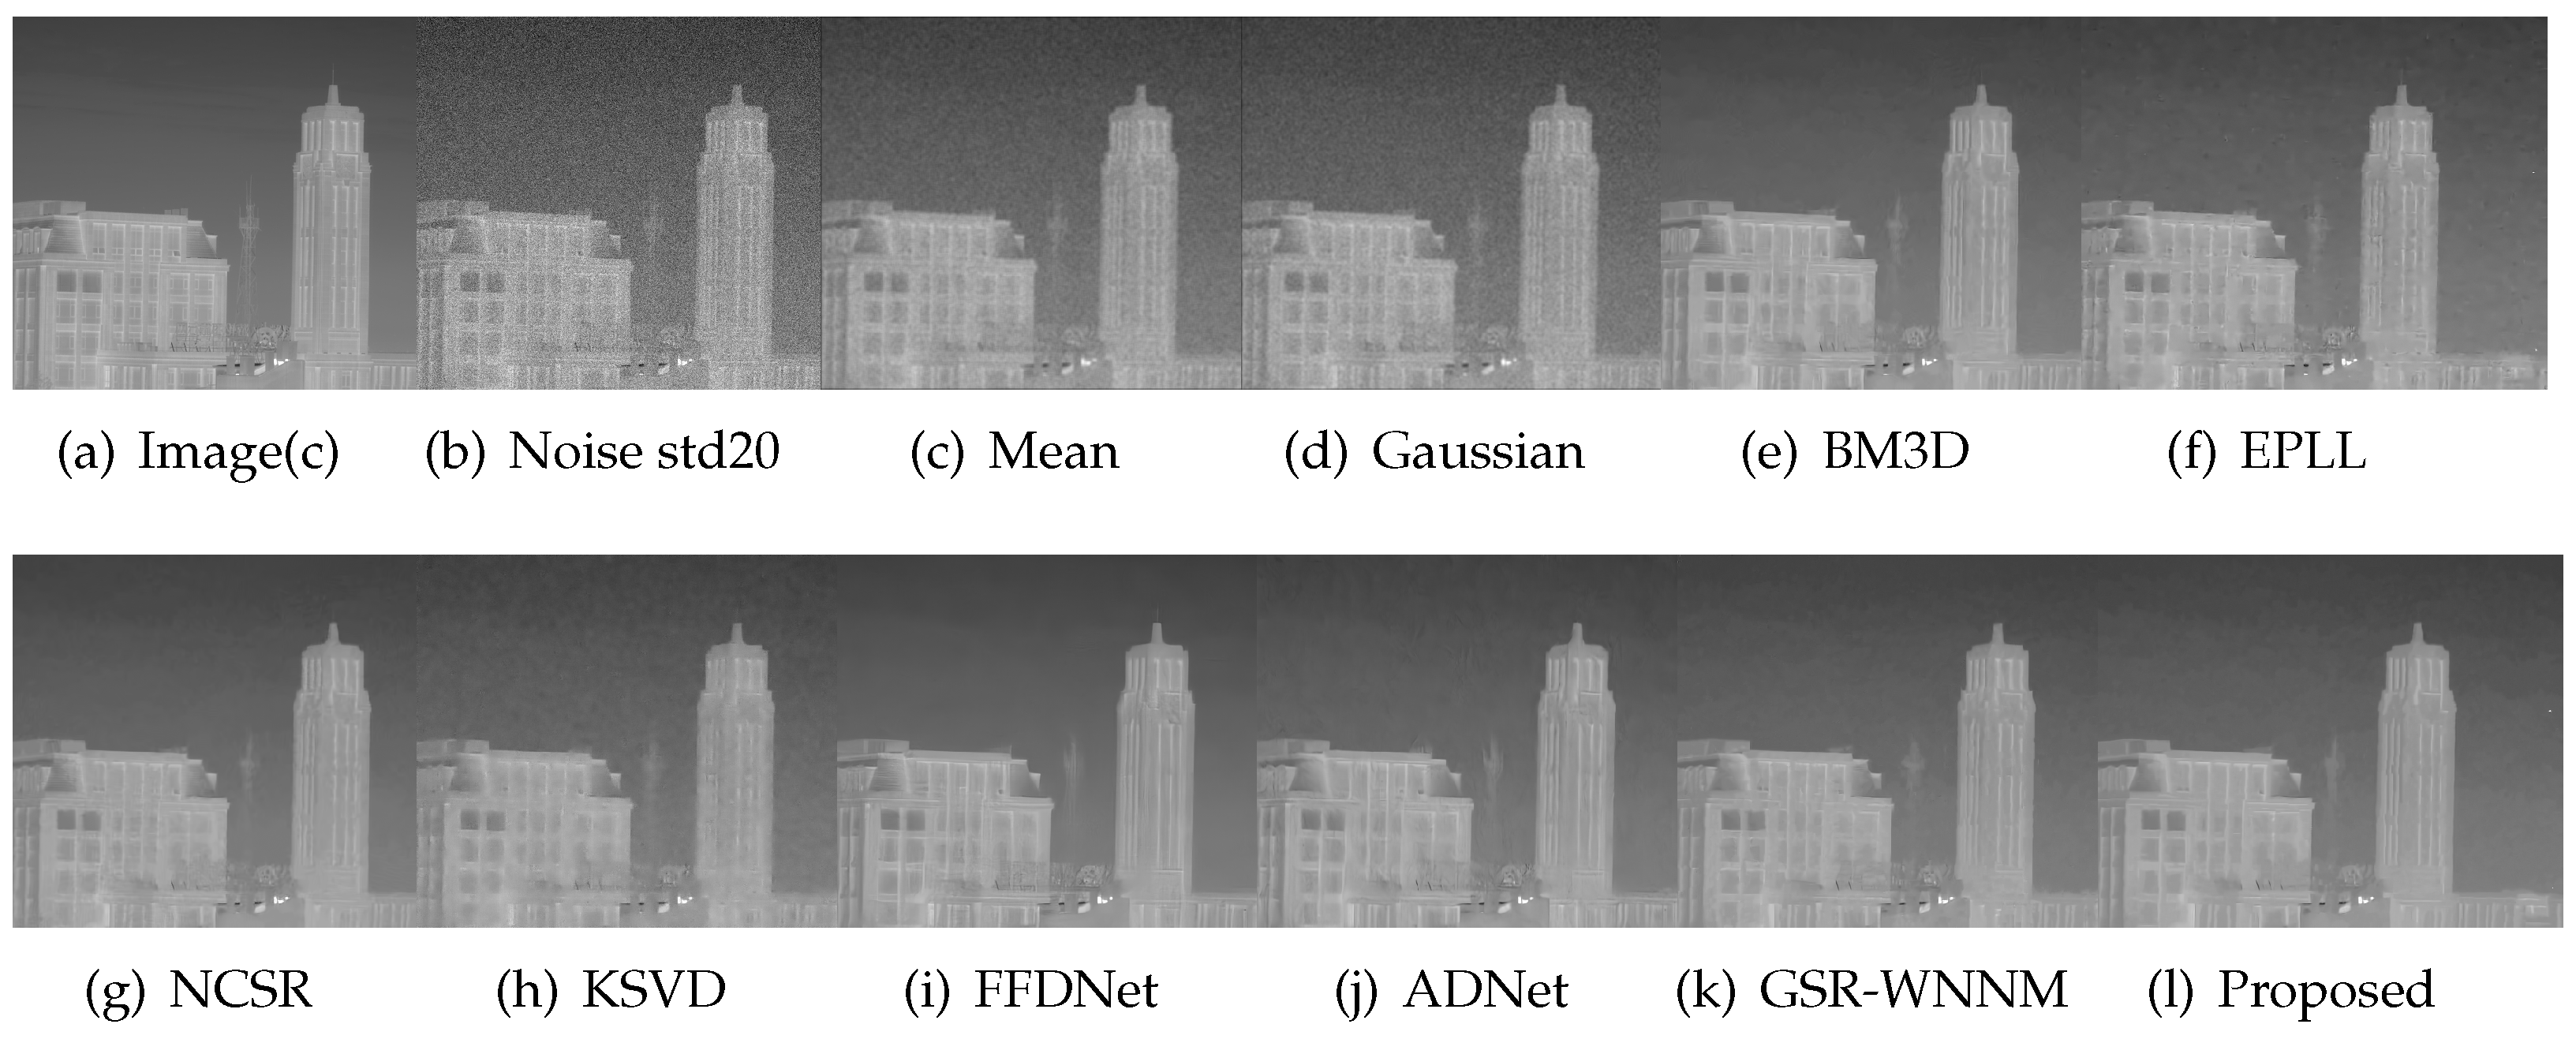
, and
are simulated and compared with the conventional spatial filtering and sparse representation denoising methods. When the noise std is
, image PSNR and SSIM results are compared with Gaussian filtering, mean filtering, BM3D [
10], EPLL [
40], NSCR [
41], KSVD [
14], FFDNet [
22], ADNet [
23], GSR-WNNM [
42], and our proposed method.
Table 2 shows the denoising PSNR and SSIM of image
with different noise std.
Table 3 shows the denoising PSNR and SSIM of image
with different noise std.
Table 4 shows the denoising PSNR and SSIM of image
with different noise std.
Under the same noise std, the proposed algorithm outperforms traditional algorithms in terms of PSNR and SSIM. With the increase in the std of noise, the performances of traditional Gaussian filtering, mean filtering, BM3D, and other algorithms have significantly decreased, but the algorithm proposed in this paper can still have better PSNR and SSIM. Compared with classic deep learning algorithms, our method performs equally well with FFDNet and ADNet under low-noise environments. As the noise increases, the model training performance of deep learning decreases which results in a degradation in performance. Our method, on the other hand, still performs well. Under the condition of different noise std, using the Gaussian filter, mean filter, BM3D, EPLL, NSCR, KSVD, FFDNet, ADNet, GSR-WNNM, and the algorithm in this paper, the image
denoising effects are shown in the
supplementary materials.
With the increase in the Gaussian noise std, the proposed algorithm could attain a better denoising effect and clearer texture details compared with other methods. The simulation results show that the improved algorithm proposed in this paper can adapt to lower SNR infrared images. It improves the PSNR of images, restores image details efficiently, and ensures a higher SSIM of images.
Moreover, we provide some annotations about the flight target in the IR images. We achieve these IR sequences with IR cool mid-wave detector
through outdoor experiments. It occupies the 3∼5 um mid-wave infrared band and produces
resolution image sequences. The single pixel size is 15 um. The target is not larger than
pixels. Each sequence has about 20 frames. With the different std noise, the effect of the denoising of image(a) is depicted in
Figure 2,
Figure 3,
Figure 4 and
Figure 5. The effect of the denoising of image(b) is shown in
Figure 6,
Figure 7,
Figure 8 and
Figure 9. The effect of the denoising of image(c) is displayed in
Figure 10,
Figure 11,
Figure 12 and
Figure 13. It can be seen that our method has a better denoising effect under different complexity backgrounds. Under a high-noise environment, we still have a better recovery effect compared to traditional methods and deep learning methods.
We obtained a comparison of PSNR and SSIM in
Table 5,
Table 6 and
Table 7 with three different complexity image sequences. Compared with traditional algorithms, our algorithm achieves better PSNR and SSIM in all image sequences and has good environmental adaptability. Compared with typical deep learning algorithms, our algorithm has slightly lower PSNR and SSIM in low-noise environments compared to the FFDNet algorithm, which is equivalent to the ADNet algorithm. In high-noise environments, we have achieved higher PSNR and SSIM. The models trained by deep learning algorithms in high noise environments only include standard deviations of 0∼75, and there are limited data, making it difficult to train better models in higher noise environments. The algorithm in this paper is unaffected by the amount of data, and as the complexity of the environment increases, it still achieves good PSNR and SSIM, demonstrating that the algorithm in this paper has stronger environmental adaptability.
Finally, we compute the average local SCRG of the target in the IR sequences containing small targets. The results are shown in
Table 8. It can be seen that the algorithm in this paper still improves the texture clarity of the image in high Gaussian noise environments. We have obtained a higher local SCRG of infrared small targets, which constructs the foundation for subsequent high-performance target detection. It has further verified the denoising performance of the algorithm.
Through the above results, we have proven that our method improves the PSNR, SSIM, and mean local SCRG of small targets among all test images compared with traditional methods under high-noise environments. Additionally, our method could be adaptable to a complex background and high-noise environments. It would lead to a better target detection effect for remote sensing.
4. Discussion
We have compared the performance of our algorithms in public data sets, and our algorithm achieved high PSNR and SSIM in various types of images, achieving clearer image restoration results. With the enhancement of noise, our algorithm still maintains good performance compared with deep learning methods. Then, we remove noise under complex backgrounds with our method in IR image sequences, which effectively improves the PSNR and SSIM of IR image sequences. Additionally, in IR images, we achieve the best local SCRG of the small target. To achieve a better denoising effect, the parameters should be adjusted to match the real environment. In the meantime, as image complexity increases, our method maintains a high performance across all metrics.
Compared with traditional template filtering and sparse representation algorithms, our method outperforms them in regard to PSNR and SSIM in real IR images and public data sets under complex backgrounds.
The deep learning methods could train an ideal model with a large amount of data sets with relatively low noise. It is slightly better than our method among all metrics. However, it does not obtain a good model with higher noise. Our method achieves better average PSNR and SSIM under high noise.
These results have verified that the method with the adaptive GSR model could achieve stable and balanced effects under complex environments.


