
Advanced Rating Method of Airborne Sound Insulation

IBN Bauphysik GmbH & Co. KG, Theresienstr. 28, 85049 Ingolstadt, Germany
Appl. Sci. 2016, 6(11), 322; https://0-doi-org.brum.beds.ac.uk/10.3390/app6110322
Submission received: 15 September 2016
/
Revised: 19 October 2016
/
Accepted: 20 October 2016
/
Published: 26 October 2016
(This article belongs to the Special Issue Noise and Vibration Control in the Built Environment)
Abstract
:This paper describes an advanced calculation scheme based on the loudness level linked to the specific fluctuation strength yielding a weighted normalized loudness level difference as a single number value. This advanced rating method is a useful tool investigating airborne sound insulation. Evidence has been presented that a simple level difference is not a suitable method to exhibit the effects of a given signal to the airborne sound insulation. Additionally, while using a weighted normalized loudness level difference, the effect of different test signals results in a significant influence in the single number value. By analyzing the difference between the standard airborne sound insulation value and the weighted normalized loudness level difference, the sound pressure level that is transmitted through a partition is demonstrated to contain important details concerning the subjective assessment. This study supports findings in the literature that airborne sound insulation performance is significantly dependent on what type of sound signal is used. This paper investigates six different thicknesses of a sand-lime brick using five different sound samples. The study indicates that no single number value can be modeled at this time in relation to a certain construction to fulfill comparable results related to a hearing sensation.
1. Introduction
Acoustic comfort is assessed in general by subjective evaluation. It describes a condition that expresses satisfaction with the acoustical environment. In that sense, building acoustics is an important factor in building design; in particular, the interior walls, partitions, and floors need to be designed to prevent the intrusion of sound from one room into another. In general, rooms for residential purposes, flats, and dwelling houses are supposed to be designed and constructed with the aim to provide reasonable airborne sound insulation [1]. A measure to describe airborne sound insulation is the airborne sound reduction index or the sound level difference; both are descriptors defined in standards.
Protection against noise is such an essential requirement that it has been stated in the European Construction Product Regulation [2]. A major factor arises from disturbances between dwellings due to audible sounds perceived from neighbor activities. The basic characteristics of a sound field are now known; however, so far, how people perceive these measures has hardly been taken into considerations. It is, however, important to be aware of the fact that limits given in standards and regulations cannot guarantee that no unwanted sound transmission occur [3]. The main body of standards of sound insulation in dwellings originated in the early 1950s [4,5]. In Germany the first standard dated as early as 1938 [6]. Meanwhile, living standards have improved significantly. A consequence of this is, among others, that home entertainment systems and other domestic electrical appliances are extensively used. The quality of sound insulation in buildings is generally described as a single number rating of sound insulation.
Neubauer and Kang introduced a concept describing a frequency-dependent weighted normalized loudness level difference [7,8,9]. This concept is intended to be a connection between the objective measure of airborne sound insulation and the psychoacoustic measures of the loudness level and fluctuation strength.
This paper describes the advanced method and discusses the model of a weighted normalized loudness level difference. Some values of the measured and calculated airborne sound insulation for sand-lime bricks of different thicknesses are presented, and computed values of the weighted normalized loudness level differences of the respective sand-lime bricks using different sound samples are discussed. To assess the differences in the evaluation of source signals, electronic filters were generated. The investigation is based on the single number value of the weighted normalized loudness level difference.
2. Calculation Scheme and Method of Assessment
The advanced rating method as introduced by Neubauer and Kang is given as the frequency-dependent weighted normalized loudness level difference, as shown in Equation (1) and is described in detail in [8].
where Lnor(f) is the normalized level difference, and w(f) is a weighting factor
A method for determining a single value of a sound in terms of a loudness level is given in ISO 532 B [10] and in DIN 45631 [11]. The loudness level can be obtained for any sound [12]. The single number quantity for the normalized loudness level difference (Lnor) is written as the quotient of the differences of the total loudness levels (LN), which yields the following:
where the level difference of the idealized (i.e., hypothetical or computed) airborne sound insulation has subscript 0 and the measured has subscript m. The level LN1 is the loudness level in the source room, and LN2 is the loudness level in the receiving room.
The idealized airborne sound insulation to obtain (LN2,0) may be found using a prediction model as provided by, e.g., EN 12354 [13], or by assuming a reference curve, e.g., ISO 717-1 [14].
The total specific fluctuation strength is calculated as the sum of all partial fluctuation strength yielding Fls’. The single number quantity of the weighting (w) is then the following:
The multiplication of Equations (2) and (3) yields a single number quantity for the weighted normalized loudness level difference (Lnor, w) and is written as the following:
3. Measured and Calculated Values
3.1. Airborne Sound Insulation
To investigate a construction without the influence of a flanking transmission, measurements taken in a laboratory were used. In this study, six different sand-lime brick thicknesses were studied. The values of the measured and calculated weighted sound reduction index (Rw) for the sand-lime bricks of different thicknesses are shown in Table 1.
Table 1 shows measured and calculated Rw-values, the surface density m’, the thickness of the sand-lime brick t, the critical frequency fc, and the respective normalized and weighted normalized loudness level difference Lnor and Lnor,w when using pink noise as a source signal. The standardised method assessing airborne sound insulation, which takes into account the dependence of sound insulation on the incident spectrum according to ISO 717-1, provides two basic spectrum adaptation terms, C and Ctr, which are also given in Table 1. C is the spectrum adaptation term for A-weighted pink noise, and the spectrum adaptation term for A-weighted urban traffic noise is Ctr.
3.2. Sound Signals
To quantify the sound insulation effect of different sound signals and to allow a numerical investigation of the results, a series of measurements were carried out. The influence using different signals was investigated via two categories of signals, namely, steady-state and non-steady-state signals.
The steady-state signals are the broadband noise signals, “pink noise” (PN) and “white noise” (WN). These signals were chosen because they are recommended in the standards for measuring airborne sound insulation.
The non-steady-state signals, i.e., the transient signals, were music samples, namely, rap (Eminem: “Lose Yourself”) (E) and classic music (Beethoven: Symphony Nr. 9: “Poco Allegro, Stringendo Il Tempo, Sempre Piu Allegro—Prestissimo”) (B). This type of music has also been investigated earlier [15,16,17].
Additionally, a sound sample called “party sound” was used as a source signal. This sound was a combination of people talking and laughing and dance music.
The time spectra of the used signals are shown in Figure 1.
For the investigated sound source signals, the psychoacoustic parameters loudness level and specific fluctuation strength were calculated, and the results are listed below in Table 2.
3.3. Sound Level of Interest
After transmission of the source signal (L1) through a structure or partition (Rw, DnT), the sound heard by a listener is the receiving sound signal (L2). The filtered level (L2) contains all the information of the airborne sound insulation characterized by the weighted apparent sound reduction index (R’w) as it is the transmitted sound signal. The sound level of interest (L2) is, in this study, the electronically filtered sound sample, which is obtained using a filter function representing the sound insulation (Rw) of interest. The filter function, i.e., the transfer function used in the software, is generated by modeling the R-values as the coefficients of a built transfer function. The phon is a unit of perceived loudness level (LN), which is a subjective measure of the strength of a sound so that the measure of sound insulation is written in terms of a loudness level. Thus, the heard sound, which is the sound level of interest (L2), is assessed in terms of a loudness level LN.
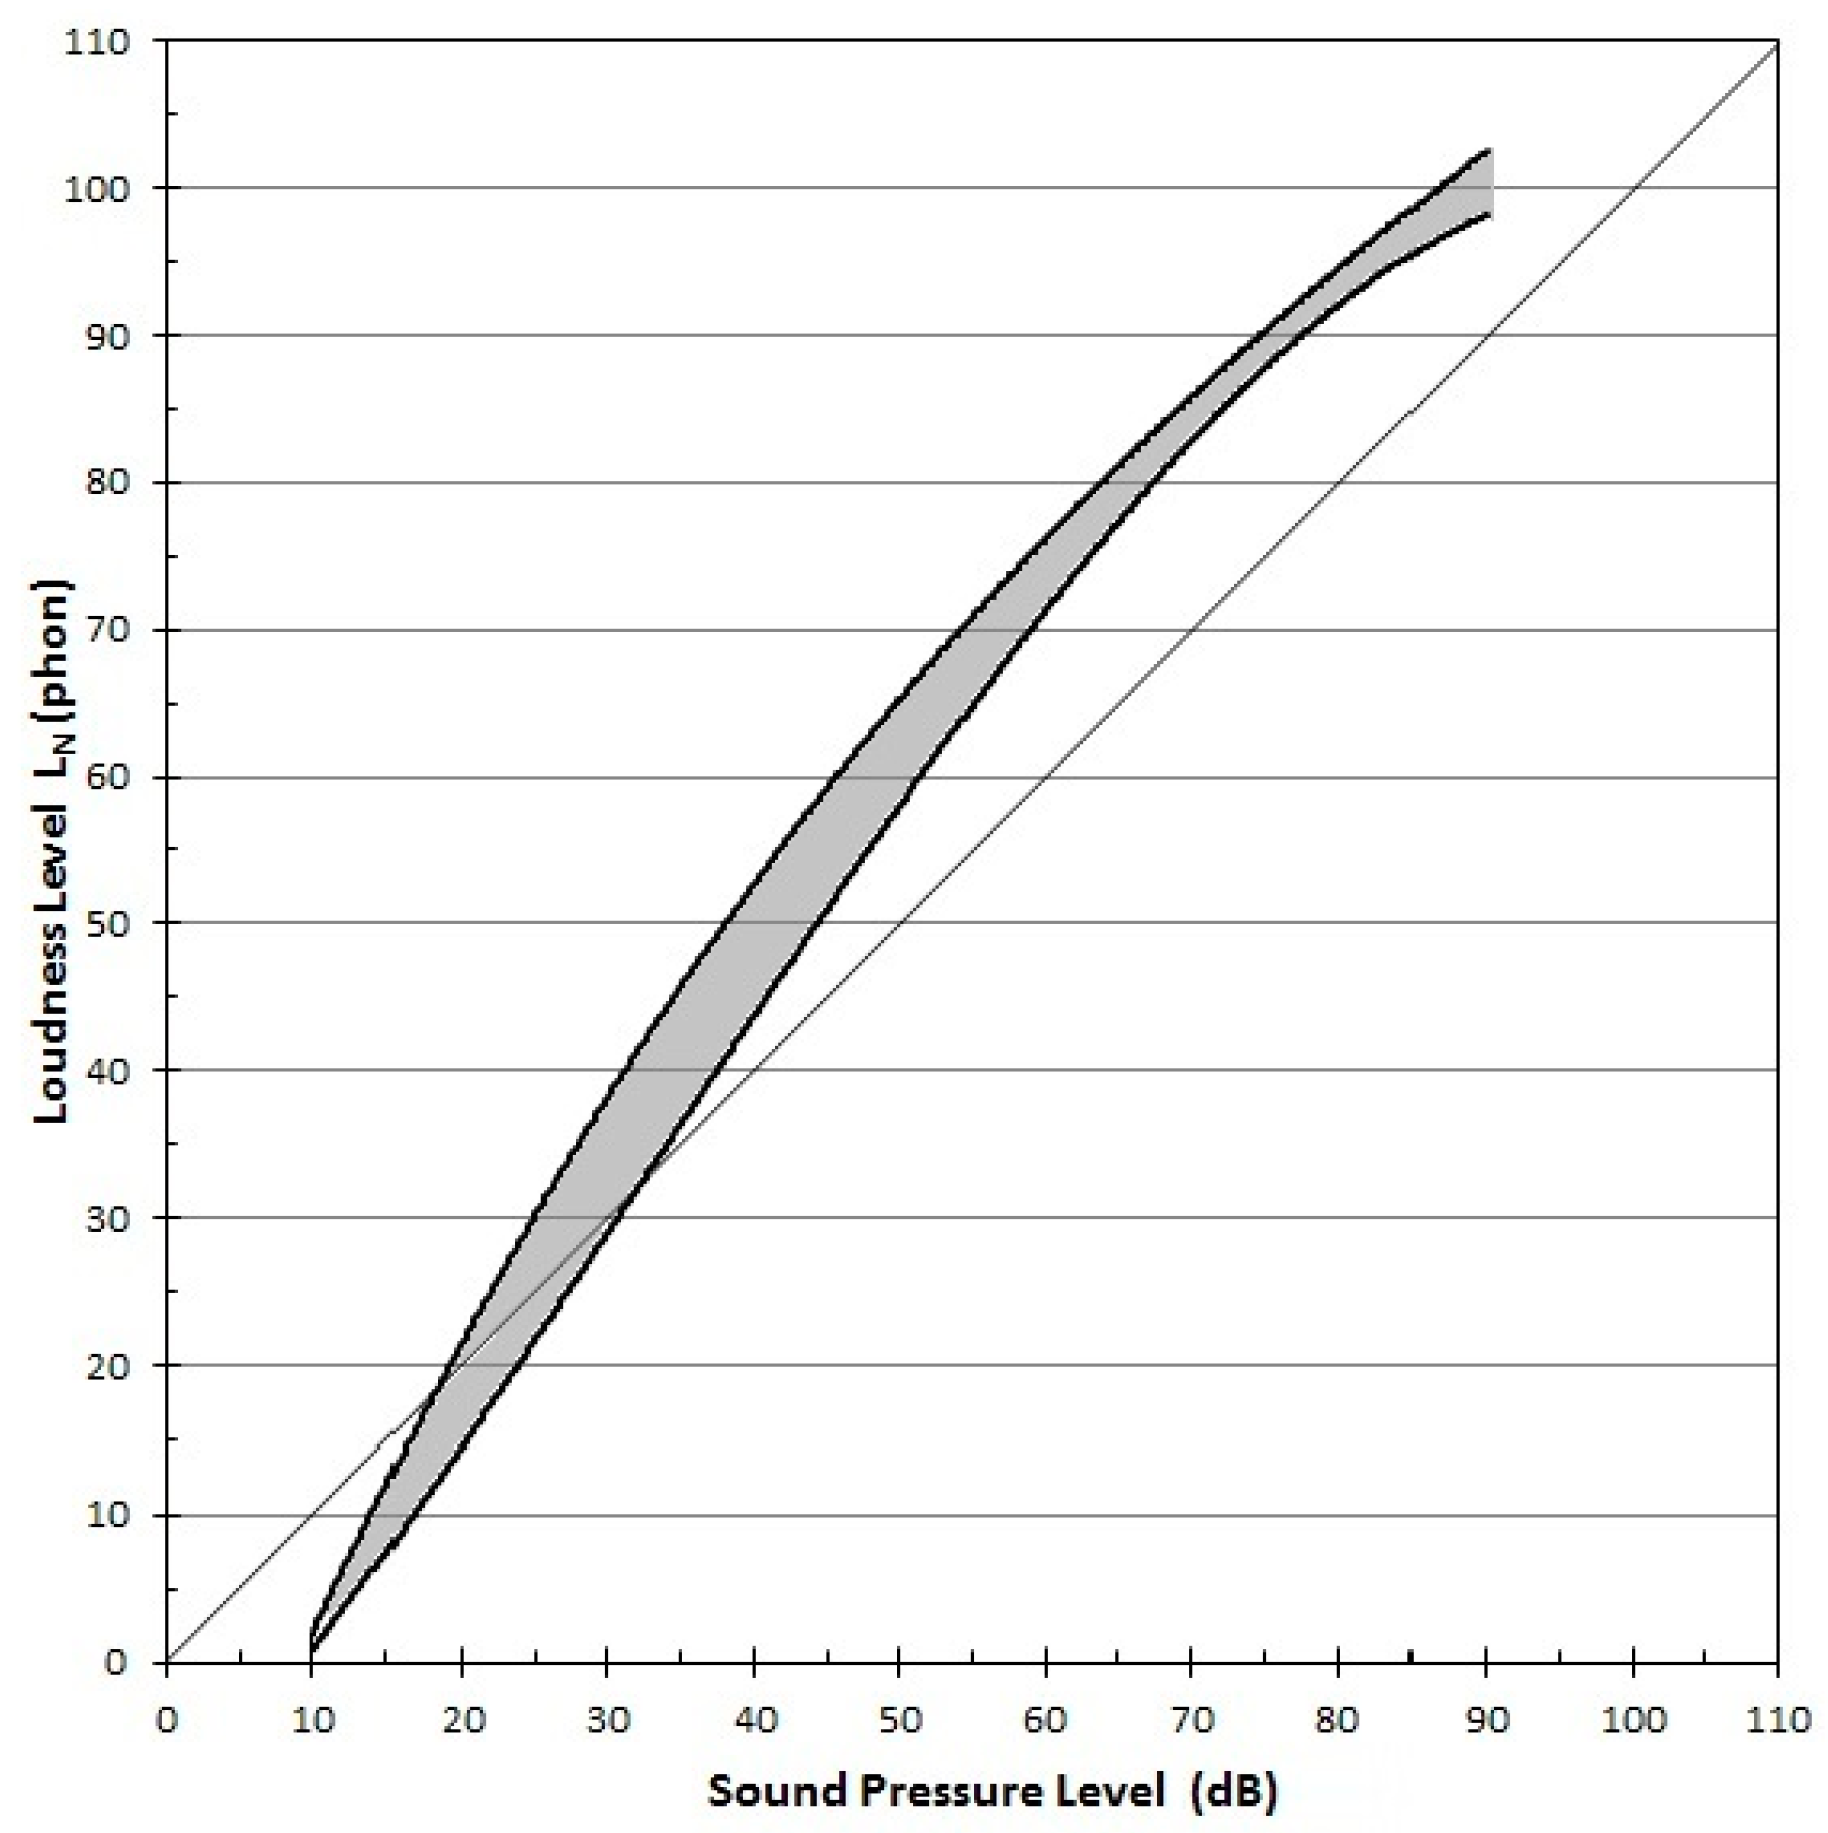
If the loudness level (LN) of the sound signals used in this study is calculated for different sound pressure levels, it is observed that there is no linear correlation between both measures. This is illustrated in Figure 2, where the loudness level is depicted over sound pressure level.
From Figure 2, it is seen that the loudness level is not linearly related to the sound pressure level and is dependent on the type of signal. Even for an equal sound pressure level, the calculated loudness level differs in its absolute value depending on the type of signal. Inspection of this data shows that varying the sound signal, i.e., using a broadband noise signal and a transient signal, leads to somewhat different results, allowing the sound pressure level to remain constant. This means that the loudness of a broadband sound and that of a transient signal are different. This is in agreement with the literature [12].
The calculated psychoacoustic parameter specific fluctuation strength (Fls’) is also not a linear function and is also dependent on the type of signal and on the level of the sound signal. In Figure 3, the region of the specific fluctuation strength (Fls’) of the sound signals used in this study is depicted as a function of sound pressure level.
It is seen that the broadband noise signal has little specific fluctuation strength, whereas the transient signal, i.e., music-type signal, spreads with increasing sound pressure level. This means that the specific fluctuation strength depends on the level of the signal. For very low sound pressure levels, i.e., below approximately 10 dB, both signal types tend to be close to zero. The smallest values are observed using white noise, and the maximum values are identified for the music-type signal E. The deviation of the studied signal types, i.e., the difference between a broadband noise signal and a music-type signal, was observed to be as large as a factor of approximately 100.
3.4. Weighted Normalized Loudness Level Difference
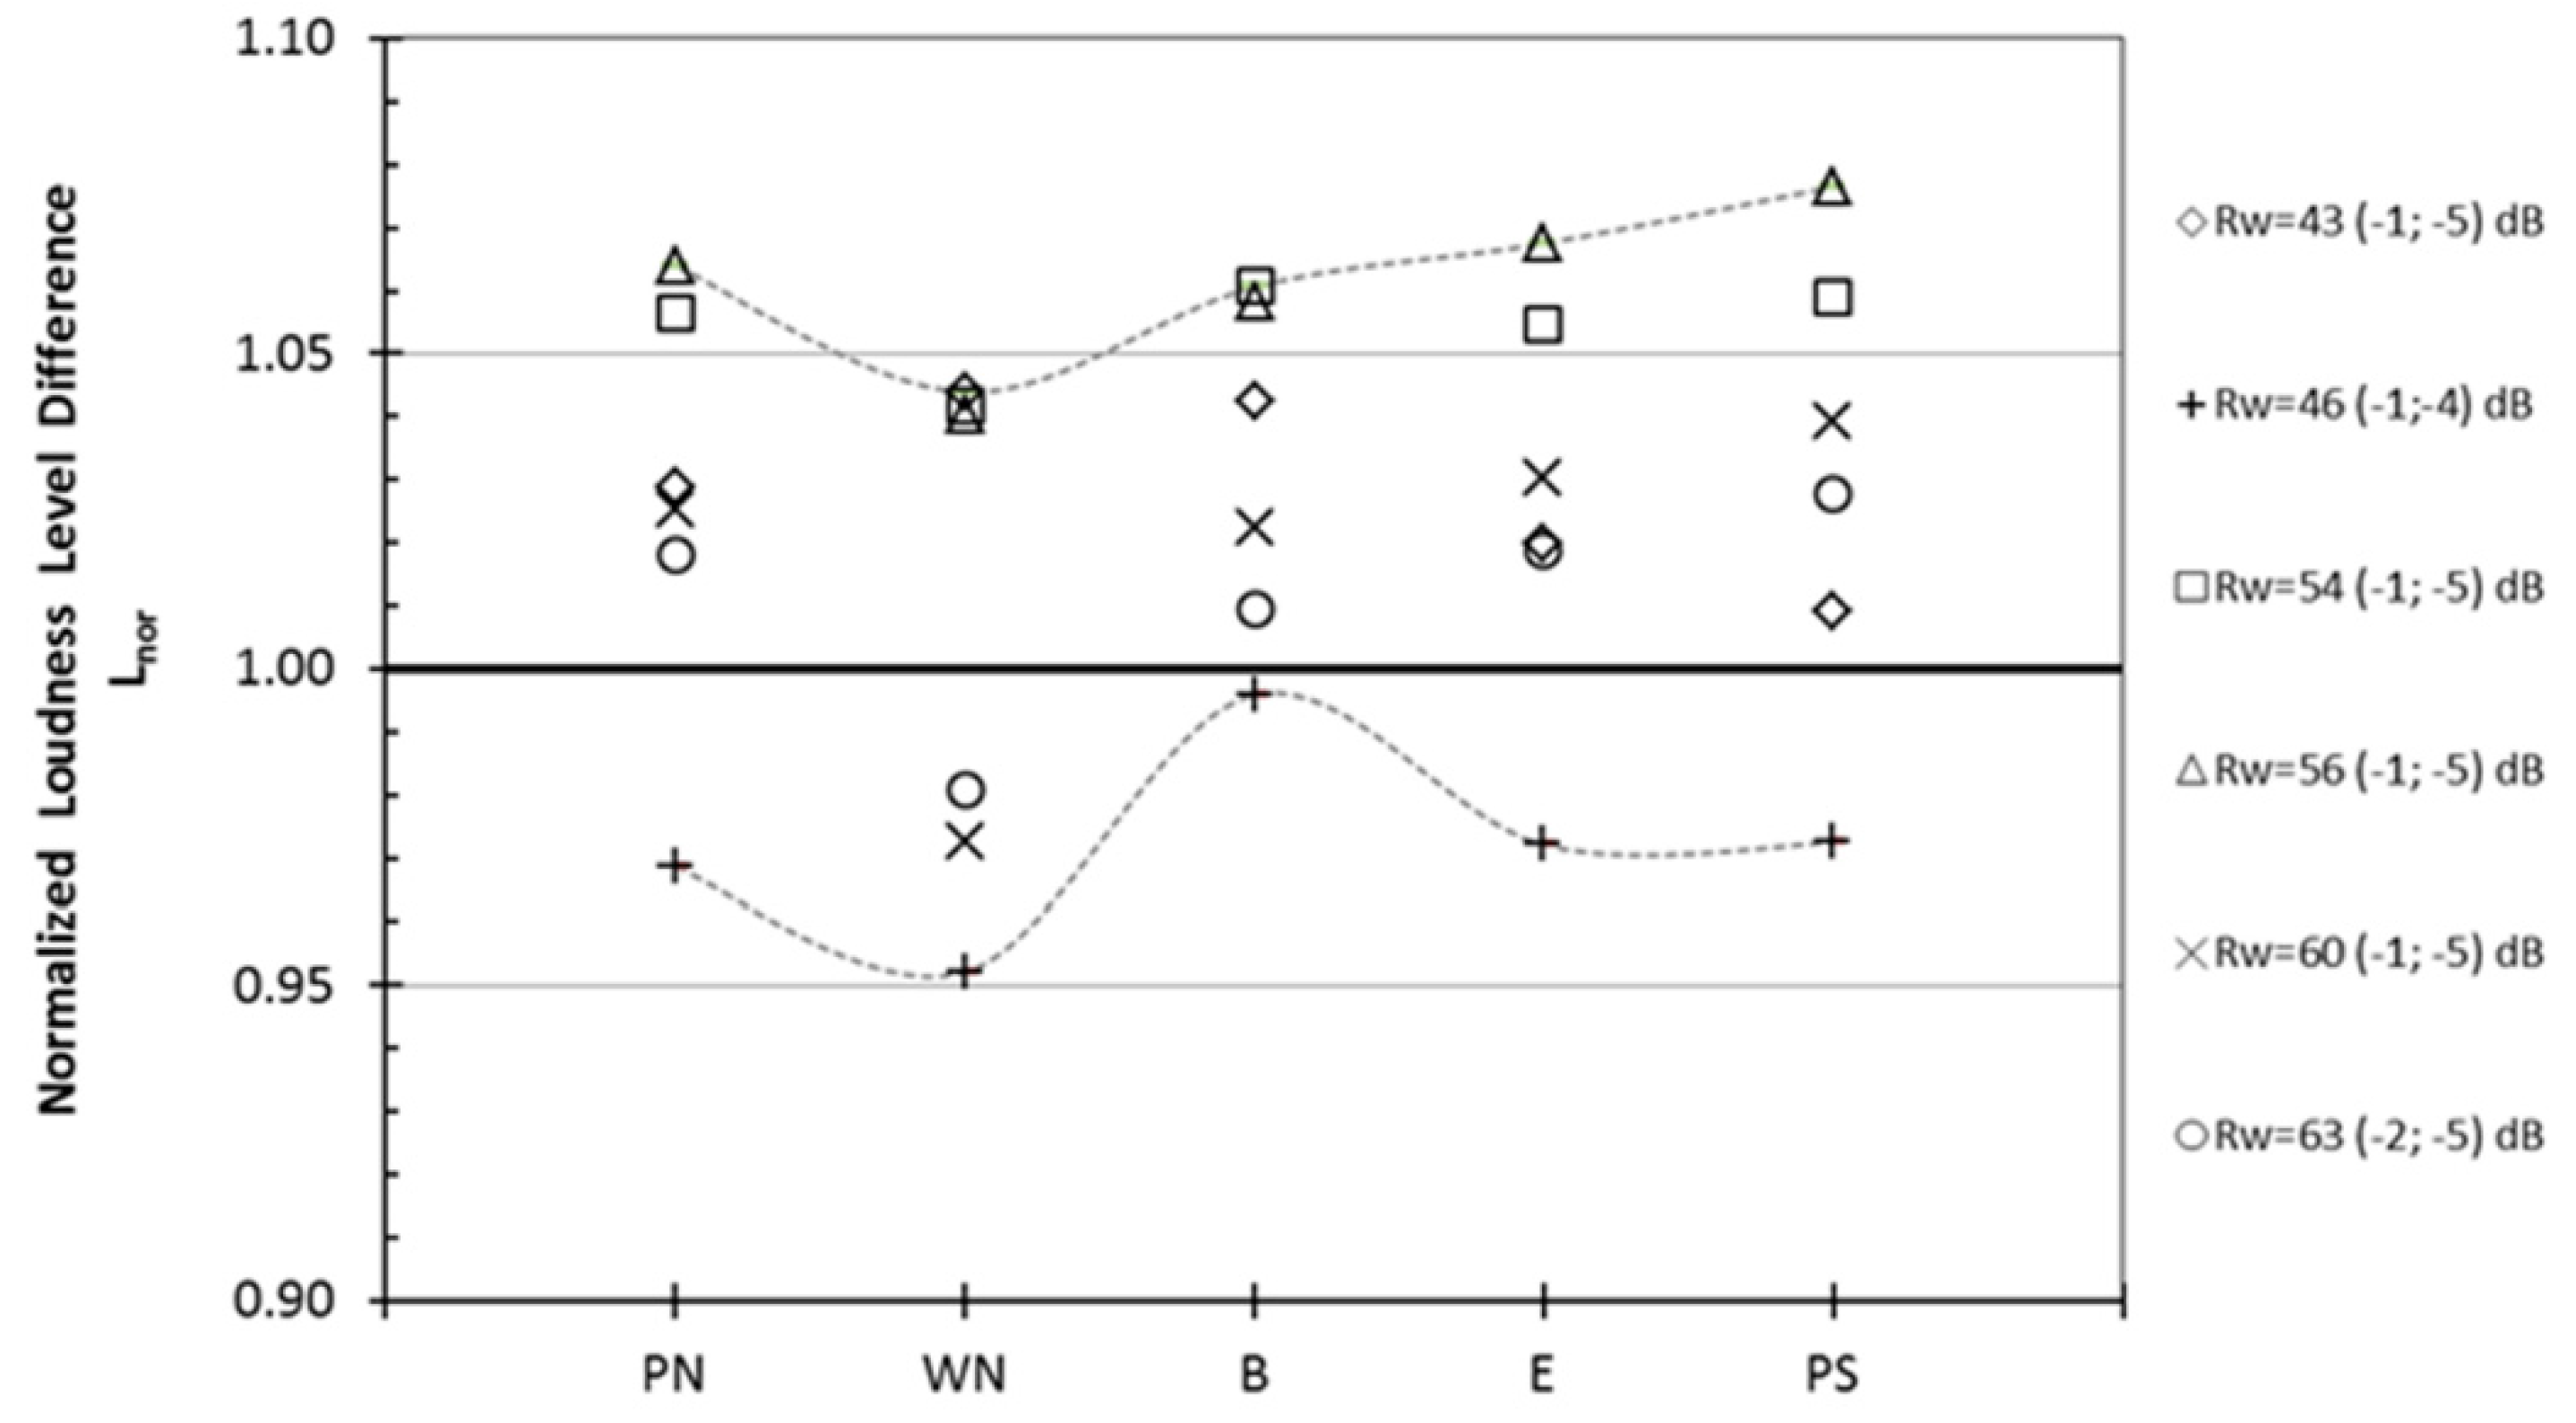
The computed normalized loudness level difference (Lnor) for different sound samples is presented in Figure 4. Analyzing Equation (2), it is clear that a value greater than 1 indicates that the measured airborne sound insulation (Rw) performs better than the calculated insulation.
The computed values of the weighted normalized loudness level differences of the respective sand-lime bricks of different thicknesses are presented in Table 3, and the results are depicted graphically in Figure 5.
Table 3 shows the Lnor,w-values for different thicknesses of the sand-lime brick, and different sound signals.
Figure 5 shows the weighted normalized loudness level difference (Lnor,w) for different sound samples. Analyzing Equation (4) reveals that results greater than 1 indicate a tendency that theoretical values are overestimated in comparison to measurements.
4. Analysis of Results
The range of measured weighted sound reduction index (Rw) with surface density 130–614 kg/m² varies between 43–63 dB (Table 1). The range of respective spectrum adaptation terms (C; Ctr) is −1 dB. A comparison with calculated values reveals that there is a maximum difference in airborne sound insulation of 3 dB.
The time signals used to compute the loudness level had a sound pressure level of 85 dB and duration of 90 s. In theory, it should be clear that computing the airborne sound insulation using different sound signals should reveal no difference. This is only true if sound pressure level differences or even loudness level differences are concerned [8].
Comparing results in Table 3 where the weighted normalized loudness level difference is depicted reveals that a minimum value (0.862) was observed using pink noise insulated by a construction of sand-lime brick with a thickness of 240 mm, while a maximum value (1.081) was observed for the “party sound” sample insulated by a construction of sand-lime brick with a thickness of 300 mm. It is seen in Table 3 that the “party sound” sample, followed by the music sample E, yielded the highest mean values. The broadband noise samples (pink and white noise) yielded the smallest values.
In Figure 5, it is seen that the music sound sample B yielded the smallest values, whereas the broadband noise signal “pink noise” showed large variation in response. This is also indicated by the calculated standard deviation of the mean for pink noise, which was ±0.074, whereas B yielded the smallest standard deviation: ±0.010 (Table 3). This result showed clearly that different sounds yield different weighted normalized loudness level differences indicating a large scattering of measured and predicted results.
5. Discussion
The results of Figure 4 (normalized loudness level difference) indicate that the measured airborne sound insulation (Rw), for most of the investigated constructions, performs better than indicated by the calculation. This result turns completely if we analyze results in Figure 5 (weighted normalized loudness level difference), which reveals that for most of the investigated constructions, theoretical values tend to be overestimated in comparison to measurements. This indicates that a loudness level difference does not adequately describe the effect of a transient signal in a hearing related measure. From comparing the psychoacoustic values of loudness level and specific fluctuation strength, it is clear that no linear relation exists for a specific sound sample. This means that no single number value can be modeled at this time in relation to a certain construction. This becomes very clear by inspection of Figure 5. The main reason for this is that the sound signal (i.e., the type of signal) plays a major part in the perception of a sound sample (as demonstrated by psychoacoustic data), although, as was shown in this study, a construction can be found for a particular sound signal and sound insulation.
6. Conclusions
This paper showed the effects of different sound signals on airborne sound insulation by relating objective measures of a sound pressure level difference and subjective related measures, i.e., loudness level and specific fluctuation strength. The study supports results presented earlier [8] that an index of sound insulation expressed as a single number rating (such as the weighted sound reduction index) cannot provide a reliable measure of the perceived efficacy of the insulation.
The computed efficacy of airborne sound insulation was investigated, revealing that an objective measure of efficacy is dependent on the type of sound signal. As shown by the comparison of calculated values with experimental results, the difference in weighted normalized loudness level demonstrated dependence on signal characteristics and on the type of airborne sound insulation.
This study supports the advanced calculation scheme of a loudness-based model. It has been shown that it is feasible to transform the objective measure of a sound pressure level into a loudness level and form, together with the specific fluctuation strength, a subjectively related evaluation. This new measure of a weighted normalized loudness level difference permits evaluating a construction in terms of an objective and subjectively related measure.
Conflicts of Interest
The author declares no conflict of interest.
References
- The Building Regulation. Approved Document E. UK Regulation, into force since 1 July 2003. Available online: https://www.gov.uk/government/publications/resistance-to-sound-approved-document-e (accessed on 15 September 2016).
- Construction Products Regulation (CPR). Regulation No. 305/2011 of the European Parliament and of the European Council of 9 March 2011, Official Journal of the European Communities. 4.4.2011. L 88/5. Available online: http://eur-lex.europa.eu/legal-content/EN/TXT/HTML/?uri=CELEX:32011R0305&from=EN (accessed on 15 September 2016).
- Noise. Technical Handbooks 2013 Domestic—Noise, The Scottish Government Publications. Section 5—Noise. Available online: http://www.gov.scot/Resource/0045/00459728.pdf http://eur-lex.europa.eu/legal-content/EN/TXT/HTML/?uri=CELEX:32011R0305&from=EN (accessed on 15 September 2016).
- Rasmussen, B.; Rindel, J.H. Concepts for Evaluation of Sound Insulation of Dwellings—From Chaos to Consensus? In Proceedings of the 4th European Congress on Acoustics (Forum Acusticum), Budapest, Hungary, 29 August–2 September 2005.
- Neubauer, R.O.; Scamoni, F. Die Akustische Klassifikation in Italien und Deutschland: Perspektiven und Möglichkeiten. (In German). In Proceedings of the Conference on Acoustics EUROREGIO, Merano, Italy, 22 March 2013; pp. 1–4.
- DIN 4110:1938. Technische Bestimmung für die Zulassung neuer Bauweisen. (Technical Specification for the Approval of New Construction Methods); Beuth Verlag: Berlin, Germany. (In German)
- Neubauer, R.O.; Kang, J. Airborne Sound Insulation Based on a Model of Loudness. In Proceedings of the 21st International Congress on Sound and Vibration (ICSV), Beijing, China, 13–17 July 2014.
- Neubauer, R.O.; Kang, J. Airborne sound insulation in terms of a loudness model. Appl. Acoust. 2014, 85, 34–45. [Google Scholar] [CrossRef]
- Neubauer, R.O.; Kang, J. A Model Based on Loudness Level to Describe Airborne Sound Insulation. In Proceedings of the 43rd International Congress on Noise Control Engineering (InterNoise), Melbourne, Australia, 16–19 November 2014.
- ISO 532/R. Acoustics- Method for Calculating Loudness Level; International Organization for Standardization: Geneva, Switzerland, 1975; (Standard confirmed in 2012). [Google Scholar]
- DIN 45631/A1:2010-03. Berechnung des Lautstärkepegels und der Lautheit aus dem Geräuschspektrum-Verfahren nach E. Zwicker-Änderung 1: Berechnung der Lautheit zeitvarianter Geräusche; Beuth Verlag: Berlin, Germany. (In German)
- Fastl, H.; Zwicker, E. Psychoacoustics: Facts and Models, 3rd ed.; Springer: Berlin, Germany, 2007. [Google Scholar]
- EN 12354-1:2000. Building Acoustics. Estimation of Acoustic Performance in Buildings from the Performance of Elements (Part 1: Airborne Sound Insulation between Rooms); European Committee for Standardization (CEN): Brussels, Belgium, 2016. [Google Scholar]
- ISO 717-1:2013. Acoustics—Rating of Sound Insulation in Buildings and of Building Elements, Part 1: Airborne Sound Insulation; International Organization for Standardization: Geneva, Switzerland, 2013. [Google Scholar]
- Neubauer, R.O.; Kang, J. What Describes the Airborne sound Insulation in Technical and Subjective Regard? In Proceedings of the 6th Forum Acusticum, Aalborg, Denmark, 26 June–1 July 2011; pp. 1783–1787.
- Neubauer, R.O.; Kang, J. Time Structure of the Signal in Airborne Sound Insulation. In Proceedings of the 9th European Conference on Noise Control (EuroNoise), Prague, Czech Republic, 10–13 June 2012.
- Neubauer, R.O.; Kang, J. Airborne Sound Insulation as a Measure for Noise Annoyance. In Proceedings of the 21st International Congress on Acoustics (ICA), Montréal, QC, Canada, 2–7 June 2013.
Figure 1.
Time signal of white noise (WN), pink noise (PN), Eminem (E), Beethoven (B), and Party Sound (PS) with equivalent continuous sound pressure level of 85 dB and duration of 90 s.
Figure 1.
Time signal of white noise (WN), pink noise (PN), Eminem (E), Beethoven (B), and Party Sound (PS) with equivalent continuous sound pressure level of 85 dB and duration of 90 s.

Figure 2.
Loudness level (LN) as a function of sound pressure level for different sound signals including transient and steady state signals. The shaded area characterizes the region for the loudness level (LN). The straight line corresponds to the following relationship: sound pressure level = loudness level.

Figure 3.
Specific fluctuation strength (Fls’) as a function of sound pressure level. The shaded area characterizes the region for the specific fluctuation strength (Fls’).
Figure 3.
Specific fluctuation strength (Fls’) as a function of sound pressure level. The shaded area characterizes the region for the specific fluctuation strength (Fls’).

Figure 4.
Normalized loudness level difference (Lnor) for different sound samples calculated for a single wall construction of sand-lime brick of thickness ranging from 70 to 300 mm and calculated sound reduction index Rw (C; Ctr). The upper and lower dotted grey lines indicate the region for the individual results. PN stands for pink noise, WN for white noise, B for Beethoven, E for Eminem, and PS for Party Sound.

Figure 5.
Weighted normalized loudness level difference (Lnor,w) for different sound samples calculated for a single wall construction of sand-lime brick of thickness ranging from 70 to 300 mm and calculated sound reduction index Rw (C; Ctr). The upper and lower dotted grey line indicates the region for the individual results. PN stands for pink noise, WN for white noise, B for Beethoven, E for Eminem, and PS for Party Sound.


| t (mm) | 70 mm | 115 mm | 150 mm | 175 mm | 240 mm | 300 mm | ||||||
|---|---|---|---|---|---|---|---|---|---|---|---|---|
| Meas. | Calc. | Meas. | Calc. | Meas. | Calc. | Meas. | Calc. | Meas. | Calc. | Meas. | Calc. | |
| Rw (dB) | 43 | 42 | 46 | 45 | 54 | 51 | 56 | 54 | 60 | 59 | 63 | 63 |
| C (dB) | −1 | −1 | −1 | 0 | −1 | 0 | −1 | −1 | −1 | −1 | −2 | −1 |
| Ctr (dB) | −5 | −3 | −4 | −3 | −5 | −4 | −5 | −5 | −5 | −5 | −5 | −6 |
| m' (kg/m2) | 130 | 180 | 285 | 341 | 475 | 614 | ||||||
| fc (Hz) | - | 423 | - | 237 | - | 200 | - | 173 | - | 127 | - | 104 |
| Lnor (-) | 1.029 | 0.969 | 1.057 | 1.064 | 1.025 | 1.018 | ||||||
| w (-) | 1.047 | 0.996 | 0.889 | 0.858 | 0.841 | 0.889 | ||||||
| Lnor,w (-) | 1.078 | 0.964 | 0.940 | 0.912 | 0.862 | 0.905 | ||||||
1 The calculation of the respective airborne sound insulation was performed using the software INSUL 8.0.
Table 2.
Psychoacoustic factors of the unprocessed signals: sound pressure level (L), loudness level (LN), and specific fluctuation strength (Fls’) 1.
| Sound Sample | L (dB) | LN (Phon) | Fls’ (Vacil) |
|---|---|---|---|
| White Noise | 85 | 98.5 | 0.0166 |
| Pink Noise | 85 | 99.1 | 0.0225 |
| Beethoven | 85 | 97.2 | 0.1182 |
| Eminem | 85 | 94.8 | 0.223 |
| Party Sound | 85 | 94.8 | 0.129 |
1 The calculations of the respective loudness level (LN) and specific fluctuation strength (Fls’) were done using the software ArtemiS V11, HEAD acoustics.
Table 3.
Calculated weighted normalized loudness level differences. The different signal types are indicated by PN for pink noise, WN for white noise, B for Beethoven, E for Eminem, and PS for Party Sound.
| Thickness mm | Weighted Normalized Loudness Level Difference (Lnor,w) for Different Thicknesses and Different Sound Signals | ||||
|---|---|---|---|---|---|
| WN | PN | E | B | PS | |
| 70 | 1.060 | 1.078 | 1.041 | 0.987 | 1.079 |
| 115 | 0.901 | 0.964 | 1.005 | 0.996 | 1.069 |
| 150 | 0.929 | 0.940 | 0.987 | 0.983 | 1.009 |
| 175 | 0.925 | 0.912 | 0.977 | 0.998 | 0.970 |
| 240 | 0.897 | 0.862 1 | 0.990 | 1.004 | 0.975 |
| 300 | 1.033 | 0.905 | 1.038 | 1.010 | 1.081 1 |
| Mean | 0.957 | 0.943 | 1.006 | 0.996 | 1.030 |
| Standard deviation | 0.071 | 0.074 | 0.027 | 0.010 | 0.052 |
1 The bold and italic numbers in Table 3 are the minimum and maximum values.
© 2016 by the author; licensee MDPI, Basel, Switzerland. This article is an open access article distributed under the terms and conditions of the Creative Commons Attribution (CC-BY) license (http://creativecommons.org/licenses/by/4.0/).
Share and Cite
MDPI and ACS Style
Neubauer, R.O. Advanced Rating Method of Airborne Sound Insulation. Appl. Sci. 2016, 6, 322. https://0-doi-org.brum.beds.ac.uk/10.3390/app6110322
AMA Style
Neubauer RO. Advanced Rating Method of Airborne Sound Insulation. Applied Sciences. 2016; 6(11):322. https://0-doi-org.brum.beds.ac.uk/10.3390/app6110322
Chicago/Turabian StyleNeubauer, Reinhard O. 2016. "Advanced Rating Method of Airborne Sound Insulation" Applied Sciences 6, no. 11: 322. https://0-doi-org.brum.beds.ac.uk/10.3390/app6110322
Note that from the first issue of 2016, this journal uses article numbers instead of page numbers. See further details here.