1. Introduction
Due to their high expectations for the quality of their housing, the residents of multi-residential buildings demand regulations regarding the levels of indoor noise such as floor impact noise, airborne noise through walls, and water supply and drainage noises. Especially in Korea, the level of this requirement is higher than those of other countries because more than 50% of people reside in multi-residential buildings with high property prices. The Korean government has consequently enacted several noise regulations regarding the allowable indoor noise level and classifications for floor impact noise, the sound insulation of walls, and transport noise.
In contrast to the above noise regulations, water supply and drainage noises from bathrooms are evaluated by a Korean certification tool named G-SEED (Green Standard for Energy and Environmental Design) [
1], which assigns different points for each tier in the evaluation of the sustainability of a building. In G-SEED, the sustainability of the water supply and drainage noises is mainly determined by whether pipes and construction methods that result in the generation of low noise levels have been applied or not, rather than the noise level.
The noise generated from sanitary wares such as a water closet is unpleasant for residents living on lower floors. In Korea, water supply and drainage noises result in one of the main noise complaints because the drain-pipe system is installed through the penetration of a slab between the upper and lower floors in most multi-residential buildings. The penetrated vertical pipe is then connected to horizontal pipes that are installed above the ceiling. The pipe system draining the fluctuating fluid consequently comprises a vulnerable structure that transmits sound energy with structure-borne and airborne paths [
2,
3,
4,
5].
In Korea, multi-residential buildings have been built with various floor plans. Generally, the number of bathrooms is one for floor plans with two bedrooms or fewer, while more than two are built for floor plans with more than three bedrooms. In housing units with more than two bathrooms, one bathroom is generally attached to a master bedroom. The water supply and drainage noises can therefore be transmitted easily through an adjacent bedroom, which causes noise annoyances during rest periods, as well as sleep disturbances at night.
In this study, a series of field measurements was therefore carried out to investigate the current situation regarding water supply and drainage noises in terms of the bathrooms and adjacent rooms of 14 types of floor plans for multi-residential buildings in Korea. This measurement campaign was conducted as a preliminary study for the proposal of an acoustic-design guideline so that a certain noise level can be satisfied for the water supply and drainage in the bathrooms and adjacent rooms of multi-residential buildings.
2. Literature Review on Noise Criteria and Regulations
2.1. Korea
In Korea, national regulations and recommendations for indoor noise levels with respect to water supply and drainage noises in multi-residential buildings are currently absent, although a KS (Korean Standard) [
6,
7] that is related to the method for measurement and evaluation has been issued. On the other hand, national regulations on acceptable indoor noise levels are implemented for floor impact noise and airborne noise from neighbors [
8,
9]. The minimum requirement for the indoor noise level from external traffic noise is also managed by a relevant national regulation [
10]. As described in
Table 1, the regulations for the indoor noise level in L
eq (equivalent continuous A-weighted sound-pressure level) during the daytime ranges between 43 dBA and 45 dBA, while the 5 dBA for night-time is stricter. Impulsive noise such as floor-impact noise is regulated at less than 57 dBA in L
max (maximum A-weighted sound-pressure level) during the daytime.
The G-SEED is a Korean certification system that was created to accomplish the construction of environmental-friendly buildings. Within G-SEED, the measures for the reduction of water supply and drainage noises are assessed according to four tiers, as described in
Table 2. The tier in
Table 2 is determined by checking whether building elements and construction methods that generate low noise levels have been applied or not. The highest point is four, and is given to the construction method called “in-floor type”, whereby the pipes on the slab are installed at the same floor.
In Korea, the field measurements of water supply and drainage noises are carried out based on KS F 2870 (supply noise) and KS F 2871 (drainage noise). The standards describe factors such as the location and height of microphones, room conditions, and background-noise correction. Alternatively, KS F 2872 [
11] is the rating method for water supply noise based on the NC-curve and A-weighted SPL (sound-pressure level).
2.2. ISO and ASHRAE
Recently, researchers involved with the ISO/TC 43/SC 2/WG 29 proposed the 2nd ISO/CD 19488 [
12] titled “Acoustic classification of dwellings”. The ISO standard is a guideline to facilitate the national implementation of the acoustic classification scheme for residential buildings. The classification scheme specifies the criteria in habitable rooms in dwellings from indoor service equipment producing intermittent noise or irregular noise such as water supply and drainage noises from neighboring spaces, with the six classes described in
Table 3. The specified classes are related to in situ measurements, either in the frequency bands in accordance with ISO 16032 [
13], or directly in the A-weighted maximum F SPL in accordance with ISO 10052 [
14]. The lowest class is F, indicating that the minimum limit is less than 46 dBA in habitable rooms.
The ASHRAE (American Society of Heating, Refrigerating, and Air-Conditioning Engineers, Piscataway, NJ, USA) also suggests a recommended A-weighted SPL as a slow response for various transient plumbing-noise sources in residential buildings, as described in
Table 4 [
15]. It is evident that the acceptable noise level in the bathroom is less than 45 dBA, while the threshold is 35 dBA in rooms.
3. Methodology
3.1. Description of the Studied Housing Units
Field measurements of the water supply and drainage noises from the bathroom were carried out in 14 types of housing units with different floor areas and plans. The floor areas considered in this study are 33 m
2, 36 m
2, 46 m
2, 59 m
2, 74 m
2, and 84 m
2, and they represent the area for exclusive use. Different floor plans with the same floor area were also selected to examine the characteristics of the sound propagation from the bathroom to the adjacent room. The type of housing unit is distinguished by a symbol that indicates the floor area with a number and a plan in an upper-case letter (e.g., 59A = A type of 59 m
2). The number of bathrooms in the housing units with a small floor area between 33 m
2 and 46 m
2 is one, while the housing units with a large floor area between 59 m
2 and 84 m
2 contain two bathrooms that are attached to the living room and bedroom.
Figure 1 shows the 14 floor plans of the studied housing units with different floor areas.
For each type of housing unit, the measurements were also conducted on different floors to examine the fluctuation in noise level due to the altitude of the bathroom in multi-residential buildings with a maximum of 28 floors. The floor in the multi-residential buildings was selected by including the ground, middle, and top floors. Although it depends on the total floors of a multi-residential building, the number of selected properties is between four and six units with a step of the fifth floor.
Table 5 lists the numbers of bathrooms and properties that were measured in the buildings. As described in
Table 5, the total number of the studied housings where the noise level in the bathroom of the lower floor was measured according to the use of sanitary wares including the water closet, basin, and bath is 64 (113 bathrooms). Additional measurements for the noise level in 11 properties (19 bathrooms) with different floor plans were also carried out on the middle floor of the building, as follows: (1) noise level in the bathroom of the upper floor; and (2) noise level in the adjacent living room and bedroom of the lower floor.
Table 6 summarizes the locations for the noise level measurements.
Although the 2nd ISO/CD 19488 suggests a normalization of the RT in the noise level, the RT measurements for the living room and bedroom are omitted here to examine the current situation in situ, which is the method suggested in the Korean standard. It is expected, however, that the influence of the RT in the normalizing of the noise level is approximately from 2.6 dB to 5.8 dB, based on the previous work that shows that the RT in the unoccupied rooms is between 0.9 s and 1.9 s at 500 Hz [
16].
3.2. Description of the Studied Bathrooms
In this study, the measurements were conducted for the bathrooms for which the UBR (unit bathroom) system and wet construction method have been applied. The UBR system is the prefabricated bathroom for which preassembled elements such as finishes, sanitary wares, concealed pipes, conduits, ceiling, bathroom cabinets, and a shower screen are installed. The UBR system is installed in consideration of the advantages in terms of time- and human power-saving, waterproofing, and soundproofing. In spite of the advantages of the UBR system, most multi-residential buildings in Korea have bathrooms using the wet construction method due to the feasibility of the interior design and the high level of impact noise on lightweight walls from the UBR system. Among the studied housing units with 14 different floor plans, the UBR system had been installed in three of the housing units with small floor areas between 33 m
2 and 46 m
2, while 11 housing units with relatively large floor areas above 59 m
2 had been built using the wet construction method. As given in
Table 7, the width (W) and depth (D) of the bathrooms are from 2110 mm to 2500 mm and 1600 mm to 1790 mm, respectively, indicating similar sizes, although the floor areas are different. The heights (D) are different according to the construction methods: 2080 mm for the UPR system and 2270 mm for the wet construction method.
Figure 2a,b show the cross-sections of the bathrooms for which the UBR system and wet construction method were applied, respectively. It can be seen that the thickness of the floor slab is 150 mm for both construction methods. The thicknesses of the air cavity between the slab and the ceiling are 455 mm and 255 mm for the UBR system and the wet construction method, respectively. The ceilings of both construction methods are covered by 2.5 mm PVC (polyvinyl chloride) panels without acoustic absorbers, and they hang on lightweight steel frames. The nominal diameter of the PVC pipes connected to the water closet is 100 mm, with a weight of 1737 g/m and a thickness of 3.1 mm. PVC pipes with a 50 mm nominal diameter are used to drain water from the basin and bathtub. The vertical and horizontal pipes for the water closet were connected with 90-degree elbows that are designed to generate low noise levels. The tilting angle of the horizontal pipe is 5 degrees. The water supply pressure is less than 2.5 kgf/m
2. The water closet installed in the housing units is a siphon type containing a six-liter water cistern. As shown in
Figure 2b, the floors of the bathrooms for which the wet construction method was applied have multiple layers consisting of floor tiles, cement mortar, thermal insulator, and waterproofing. The wall of the bathroom facing the living room and bedroom was built with 190 mm thick masonry.
3.3. Experimental Setup
The noise levels for the water supply and drainage were measured in the bathroom and adjacent room of the multi-residential buildings. The equipment used for the measurement included a four-channel Harmonie system (0.1 dB) with ½” microphone (G.R.A.S. Type 40AF) and preamplifiers (G.R.A.S. Type 26AG), and the NA-28 portable sound level meter (RION). In the adjacent room including the bedroom and living room, the four-channel Harmonie system and one NA-28 were located at a height of 1.2 m. Four microphones were set up at the corner positions 0.75 m from the room surfaces. One microphone was placed at the center of the room. The noise level in the room was the average value measured over the five microphones. No furniture or other obstacles were in the room. The noise levels in the upper and lower bathrooms were measured using one NA-28 simultaneously located at the center position of each bathroom with a height of 1.2 m. One NA-28 was also located 1 m from the door. In total, eight microphones were used simultaneously for the noise-level measurements for 11 housings with different floor plans, while only one NA-28 was installed in the bathroom of the lower floor for the remaining properties (
N = 53).
Figure 3 shows the experimental setup for the measurements in the bathroom and adjacent rooms of the lower floor. The views of the experimental setups in the bathroom and living room are also shown in
Figure 4.
The water supply and drainage noises were generated by three consecutive operations of each sanitary ware including the water closet, basin, and bathtub. After the bathtub and basin were filled full of water, the water was drained through the pipe.
The background noises in the bathroom and adjacent rooms are below 25 dBA for the measurements at night-time. This leads to a high S/N (signal-to-noise) ratio over 10 dBA, indicating an insignificant influence of the background noise on the measurement results.
The noise level was measured in LAFmax, as recommended in the 2nd ISO/CD 19488, and in consideration of the fluctuating characteristics of the water supply and drainage noises. The RT in the adjacent rooms was not normalized to examine the noise level in situ.
4. Results
4.1. Time History of Water Supply and Drainage Noises
The use of the sanitary wares in the bathroom of the upper floors generates water supply and drainage noises in the bathroom and adjacent room of the lower floors through structure-borne and airborne transmissions. The time history of the noise generated by the use of each sanitary ware comprises the different characteristics of operation time and fluctuation due to the difference of the amount of used water, the flow velocity, and the diameter and shape of the pipe, among others. In the bathroom, the main sanitary wares include the water closet, basin, and bathtub.
Figure 5 shows the time history of the water supply and drainage noises that were measured in different locations simultaneously including in the bathrooms of the upper and lower floors, in front of a closed door, and in the adjacent living room. The time history of the noise from the use of the water closet shows that the water drainage noise generates the peak level during the operation time for about 7 s from the initial usage. After the drainage, water is supplied to the cistern with a low fluctuation of the noise level for approximately 32 s. In all of the measurement locations, the water drainage noise generates the peak noise level due to a siphon, indicating that the maximum noise level is mainly determined during the water drainage. The water supply and drainage noises from the use of the basin and bathtub also generate continuous noise during the water supply, while the noise fluctuates during the water drainage. The difference between the noise levels of the bathrooms of the upper and lower floors is approximately 40 dBA.
Figure 6 shows the time history of the water supply and drainage noises from the use of the water closets installed in 19 bathrooms of 11 housings with different floor plans (11 bathrooms attached to the living room, and eight bathrooms attached to the bedroom). Here, the shortest operation time of the water supply and drainage is approximately 28 s for the bathroom attached to the bedroom of the 84A type, while it is approximately 47 s for the bathroom attached to the living room of the 59A type.
4.2. Noise Level in the Bathroom
The water supply and drainage noises were measured in the bathrooms of the upper (
N = 19) and lower (
N = 113) floors according to the use of the sanitary wares including the water closet, basin, and bathtub.
Figure 7 shows an example of the frequency spectrum in one octave band for the water supply and drainage noises measured in the bathrooms of the upper and lower floors for the 59A type. The frequency spectrum was analyzed for the noise level measured in L
AFmax during the operation time of each sanitary ware. The results show that the use of the water closet generates a relatively high noise level in the bathrooms of the upper and lower floors compared to the basin and bathtub. Generally, the three sanitary wares produced strong sound energies at middle and high frequencies above 500 Hz in the bathroom. It is expected that the high noise levels at the middle and high frequencies cause more sensitive subjective responses due to the use of the sanitary wares.
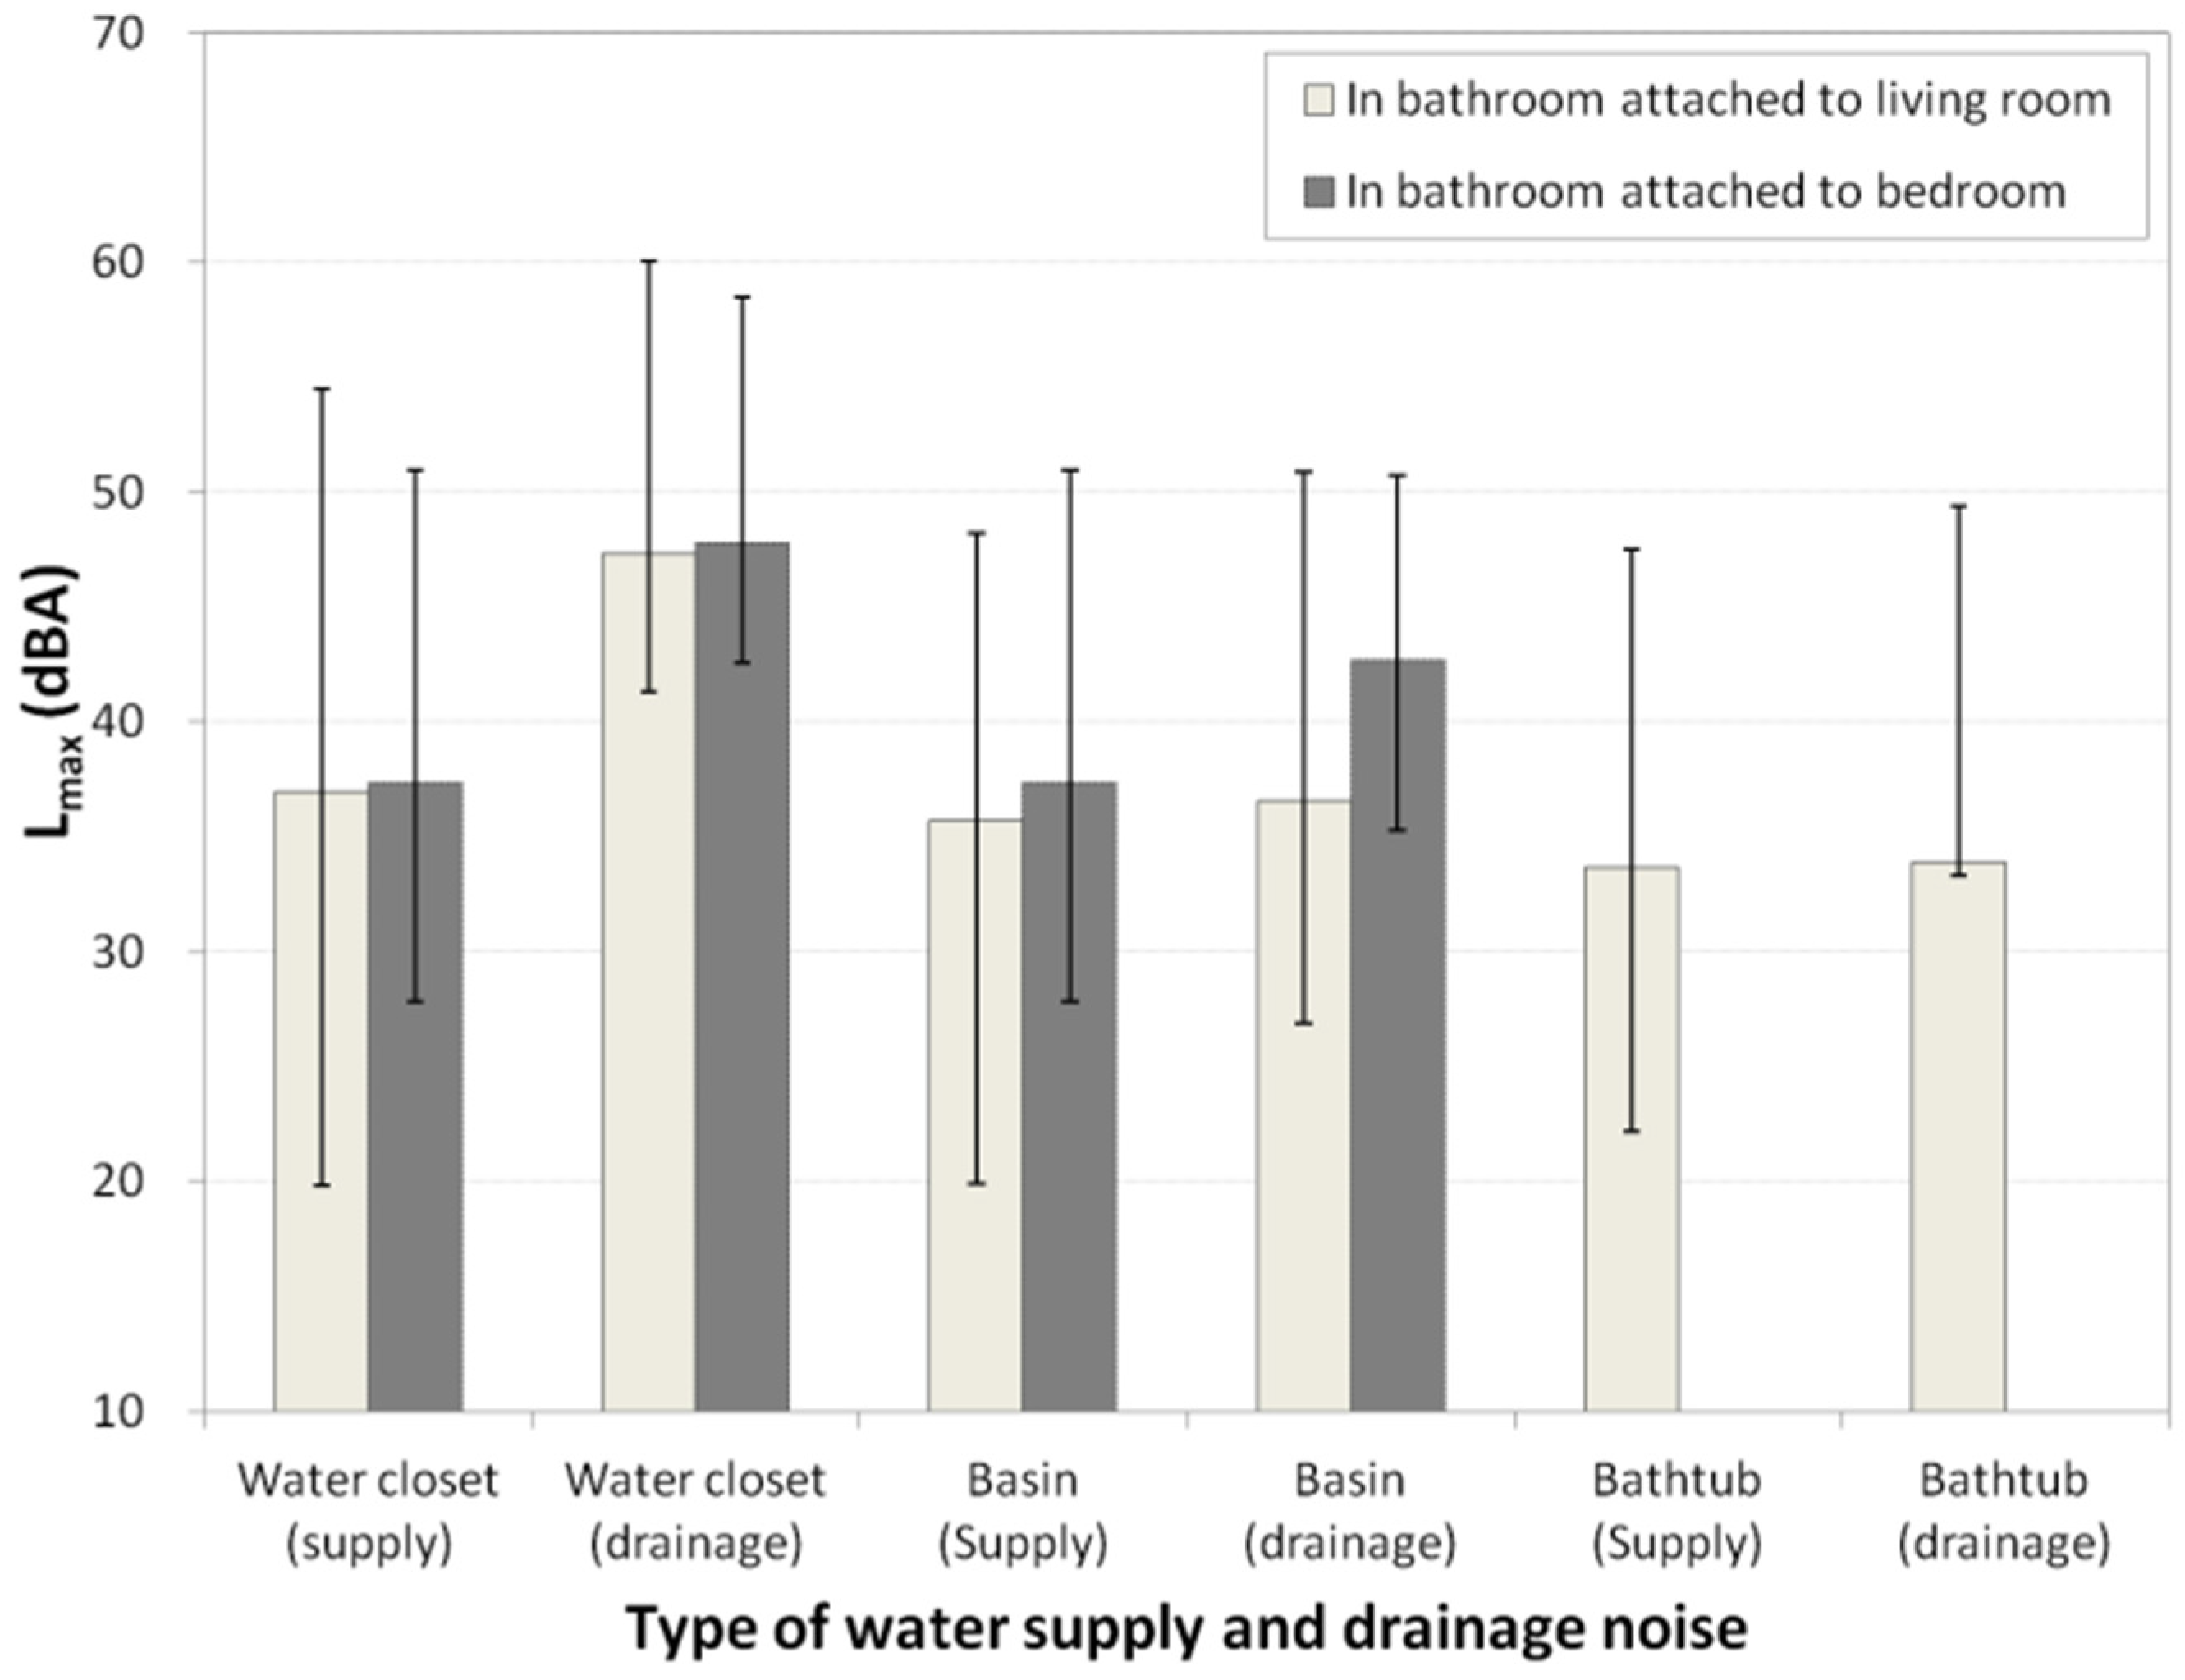
Figure 8 shows the average noise level from the use of each sanitary ware measured in the bathrooms of the lower floor attached to the living room (
N = 64) and bedroom (
N = 49). The results show that the highest noise level is 47.8 dBA for the water drainage from the use of the water closet in the bathroom attached to the bedroom. The noise level of the second ranking is 42.7 dBA for the water drainage from the use of the basin in the bathroom attached to the bedroom. The water supply noise shows similar levels approximately between 33.7 dBA and 37.0 dBA for all of the sanitary wares. The deviation bar indicating the range between the maximum and minimum noise levels implies that the noise level is different according to the studied housings with different plans.
The graph in
Figure 9 shows the frequency distribution and cumulative percentage of the maximum noise level in 113 bathrooms of the lower floor according to the water supply and drainage noises of the three sanitary wares. It can be seen that the maximum noise level is concentrated between 46 dBA and 50 dBA. The lowest value of the maximum noise level is 41.3 dBA, whereas the highest value is 60.1 dBA. The average value of the maximum noise levels measured in the 113 bathrooms is 47.7 dBA. The results indicate that most of the residents living in the lower floor can recognize the noise in the bathroom due to the use of the sanitary wares in the upper floor because the S/N ratio is approximately 30 dBA if the background-noise level is assumed to be 20 dBA.
One of the major factors determining the noise level could be the construction method of the bathroom. In this study, the UBR system has been applied to the floor plans with a small floor area less than 46 m
2, while the wet-construction method was applied for the larger floor plans.
Figure 10 shows the average noise level for the water supply and drainage of each sanitary ware according to the construction methods, including the UBR system (
N = 15) and the wet-construction method (
N = 97). The results in
Figure 10 indicate that the UBR system generates a noise level that is lower than that of the wet-construction method for all of the operational conditions of each sanitary ware. The highest value of the noise level for the UBR system is 42.8 dBA for the water drainage of the water closet, while it is 48.2 dBA for the wet-construction method. It is also noted that the UBR system has a rather low deviation between the maximum and minimum noise levels compared with the wet-construction method. This implies that the UBR system is advantageous for the management of construction quality in terms of sound insulation.
In multi-residential buildings, the noise level could change due to the different altitudes of the properties in the multi-residential buildings, thereby affecting the water supply pressure and drainage velocity. The influence of the altitude on the variation of the noise level was therefore examined by dividing the total floors as groups of low (10 floors or fewer,
N = 60) and high (11 floors or more,
N = 53) floors, as shown in
Figure 11. The results show that the noise levels measured at the low and high floors are similar to each other for all of the operational conditions. This indicates that the altitude of the housing is a manageable design factor affecting the variation of the noise level.
4.3. Noise Level in the Adjacent Room
The noise levels in the living room and bedroom due to the water supply and drainage in the bathroom form one of the important criteria affecting the indoor environmental quality of multi-residential buildings.
Figure 12 shows an example of the frequency spectrum for the water supply and drainage noises from the use of the water closet measured in different locations including the bathroom, in front of the door, and in the adjacent room of the lower floor for the 59B type; here, the door of the bathroom was closed. The results show that the noise levels in both of the adjacent rooms decreased by approximately 10 dBA at the middle frequencies compared with those in the bathroom, while those in front of the door and in the adjacent rooms are similar. It is noted that the overall noise levels in both rooms are strongly determined at 500 Hz and 1000 Hz.
Figure 13 is a graph showing the noise levels measured in the living room (
N = 11) and bedroom (
N = 8) of 11 different floor plans according to the different operational conditions of each sanitary ware. The sanitary ware generating the highest noise level is the drainage noise from the water closet for both rooms. The average noise level for the water drainage from the water closet in the bedroom is 39.1 dBA, while it is 34.3 dBA in the living room. Generally, the noise level in front of the door is slightly higher than those in the adjacent rooms.
Figure 14 shows the frequency distribution and cumulative percentages of the maximum noise levels in the living room and bedroom of the lower floor according to the water supply and drainage noises of the three sanitary wares. The results show that the noise level is concentrated at about 37 dBA, which leads to an average noise level of 37.8 dBA. This result indicates that the water supply and drainage noises could be noticeable, especially at night-time when the background noise is low. Based on the 2nd ISO/CD 19488, it is expected that the average noise level in the rooms meets Class C (living room) and Class D (bedroom) if the RT is normalized.
5. Discussion
Although the focus of this study is the noise levels in situ due to the sanitary wares in the bathroom and adjacent rooms, the final goal of this study is a practical guideline suggestion regarding a way that the noise and vibration transmitted from the bathroom to the adjacent rooms can be controlled to satisfy each class limit described in the 2nd ISO/CD 19488 or the national regulation. Based on the data measured in this study, additional measurements for vibration and sound intensity will be carried out to examine the contribution of the sound energies transmitted through the floor, ceiling, wall, door, and leakages. A laboratory-based experiment is also needed to discover the noise-reduction design factors including the air cavity between the ceiling and floor, the absorber, the sound insulation of the PVC panels covering the ceiling, the vibration isolation of the pipe, the amount of used water, the water pressure, and the lengths and tilting angles of the pipes. Although EN 12354-5 [
17] suggests a prediction method of sound levels due to the service equipment, a developed prediction method will also need to be suggested considering the Korean situation. Moreover, a prediction of the sound propagation from the bathroom to the adjacent rooms needs to be carried out in consideration of the various design factors such as the existence of a dressing room, the location of the bathroom, and the distance between the bathroom and the living room.
6. Conclusions
In this study, a series of field measurements were carried out to examine the current situation regarding the water supply and drainage noise in the bathrooms of the multi-residential buildings of Korea. The number of studied housings is 64, and they comprise 14 different floor plans. The water supply and drainage noise were measured in the bathrooms of the lower floor according to the different operations of each sanitary ware including the water closet, basin, and bathtub. The noise levels were also measured in the bathrooms of the upper floor and the adjacent rooms of the lower floor for 11 housing units with different floor plans. The measurement parameters in this study are therefore as follows: (1) noise level in the bathroom of the lower floor (N = 113); (2) noise level in the bathroom of the upper floor (N = 19); and (3) noise levels in the living room (N = 11) and bedroom (N = 8) of the lower floor. The time history of the measured SPL from the use of each sanitary ware displayed strongly fluctuating noise levels for the water drainage, while it is rather continuous for the water supply. Also, the water supply and drainage noises produce relatively high SPL values at 500 Hz and 1000 Hz, respectively, compared with the other frequencies.
The measurement results in the bathrooms of the lower floor (N = 113) showed that the highest noise level is 47.8 dBA on average for the water drainage noise from the use of the water closet. The second ranking comprises 42.7 dBA for the water drainage noise from the use of the basin, and then 33.9 dBA was measured for the water drainage noise from the use of the bathtub. The water supply noise ranged between 33.7 dBA and 37.0 dBA. The above results suggest that the priority for noise control is in the order of water drainage from the water closet, water drainage from the basin, and water supply to the sanitary wares, as well as water drainage from the bathtub. The frequency distribution and cumulative percentages of the water supply and drainage noises in the bathrooms of the lower floor suggested that the maximum noise level is concentrated between 46 dBA and 50 dBA, thereby deriving the average noise level of 47.7 dBA. The minimum and maximum noise levels ranged between 41.3 dBA and 60.1 dBA. According to the different construction methods of the bathrooms, the UBR system produced a noise level that is lower than that of the wet-construction method for all of the operational conditions of each sanitary ware. The highest noise level for the UBR system is 42.8 dBA, while it is 48.2 dBA for the wet-construction method. The altitude of the housing has an insignificant influence on the variation of the noise level.
The highest noise levels in the living room (N = 11) and bedroom (N = 8) of the lower floor are 34.3 dBA and 39.1 dBA, respectively, for the water drainage noise from the use of the water closet. The frequency distribution and cumulative percentages of the maximum noise level in the adjacent rooms was concentrated at approximately 37 dBA, thereby deriving the average noise level of 37.8 dBA.
The overall results suggest that the current situation of water supply and drainage noise in the multi-residential buildings of Korea meets Class C (living room) and Class D (bedroom) of the 2nd ISO/CD 19488, although some of the measurement data from the rooms are outside of the minimum limit; however, it is still necessary to develop the acoustic guidelines to satisfy the higher class for the creation of a comfortable residential environment.
Acknowledgments
This work was supported by the 2016 Research Fund of Korea Land and Housing Corporation (R201605003).
Author Contributions
Hong-Seok Yang conceived and designed the experiments; Hong-Seok Yang and Hyun-Min Cho performed the experiments; Hong-Seok Yang and Myung-Jun Kim analyzed the data; and Hong-Seok Yang wrote the paper.
Conflicts of Interest
The authors declare no conflicts of interest.
References
- G-SEED Green Standard for Energy and Environmental Design. Available online: http://www.g-seed.or.kr/english (accessed on 19 September 2016).
- Fuchs, H.V. Generation and control of noise in water supply installations: Part 1: Fundamental aspects. Appl. Acoust. 1983, 16, 325–346. [Google Scholar] [CrossRef]
- Fuchs, H.F. Generation and control of noise in water supply installations. Part 2: Sound source mechanisms. Appl. Acoust. 1993, 38, 59–85. [Google Scholar] [CrossRef]
- Fuchs, H.V. Generation and control of noise in water supply installations Part 3: Rating and abating procedures. Appl. Acoust. 1993, 39, 165–190. [Google Scholar] [CrossRef]
- Prek, M. The impact of geometrical parameters on hydrodynamic noise generation. Appl. Acoust. 2000, 60, 343–351. [Google Scholar] [CrossRef]
- Korea Standard (KS). KS F 2870:2006. Field Measurements of Water Supply Noise in Apartment Bathroom; Korea Standard (KS): Seoul, Korea, 2006. [Google Scholar]
- Korea Standard (KS). KS F 2871:2006. Field Measurements of Drainage Noise in Apartment Bathroom; Korea Standard (KS): Seoul, Korea, 2006. [Google Scholar]
- The Ministry of Land Infrastructure and Transport. Criteria for the Interlayer Floor Impact Sound Regulation in Multi-Residential Buildings; Notification on 2014-446; The Ministry of Land Infrastructure and Transport: Sejong-si, Korea, 2014.
- The Ministry of Land Infrastructure and Transport. Sound Insulation of the Wall Structure and Management Regulation; Notification on 2015-844; The Ministry of Land Infrastructure and Transport: Sejong-si, Korea, 2015.
- The Ministry of Land Infrastructure and Transport. Regulations on Housing Construction Standards; Notification on 2014; The Ministry of Land Infrastructure and Transport: Sejong-si, Korea, 2014.
- Korea Standard (KS). KS F 2872:2008. Rating of Water Supply Noise in Apartment Bathroom; Korea Standard (KS): Seoul, Korea, 2008. [Google Scholar]
- International Organization for Standardization. ISO/2ndCD 19488:2016. Acoustics—Acoustic Classification of Dwellings; International Organization for Standardization: Geneva, Switzerland, 2016. [Google Scholar]
- International Organization for Standardization. ISO 16032:2014. Measurement of Sound Pressure Level from Service Equipment in Buildings-Engineering Method; International Organization for Standardization: Geneva, Switzerland, 2014. [Google Scholar]
- International Organization for Standardization. ISO 10052:2004. Field Measurements of Airborne and Impact Sound Insulation and of Service Equipment Sound-Survey Method; International Organization for Standardization: Geneva, Switzerland, 2004. [Google Scholar]
- American Society of Heating, Refrigerating and Air-Conditioning Engineers, Inc. Chapter 48. Noise and vibration. In ASHRAE Handbook; American Society of Heating, Refrigerating and Air-Conditioning Engineers, Inc.: Atlanta, GA, USA, 2011. [Google Scholar]
- Kim, M.J.; Lee, B.K. Field measurement and evaluation of the reverberation time in residential buildings. J. Korean Soc. Living. Environ. Syst. 2006, 13, 213–221. [Google Scholar]
- BSI Group. EN 12354–5:2009. Building Acoustics—Estimation of Acoustic Performance of Building from the Performance of Elements—Part 5: Sounds Levels Due to the Service Equipment; BSI Group: London, UK, 2009. [Google Scholar]
Figure 1.
The 14 floor plans of the studied housing units with different floor areas: (a) 33 type; (b) 36 type; (c) 46 type; (d) 59A type; (e) 59B type; (f) 59C type; (g) 74A type; (h) 74B type; (i) 74C type; (j) 84A type; (k) 84B1 type; (l) 84B3 type; (m) 84C type; (n) 84D type.
Figure 1.
The 14 floor plans of the studied housing units with different floor areas: (a) 33 type; (b) 36 type; (c) 46 type; (d) 59A type; (e) 59B type; (f) 59C type; (g) 74A type; (h) 74B type; (i) 74C type; (j) 84A type; (k) 84B1 type; (l) 84B3 type; (m) 84C type; (n) 84D type.
Figure 2.
Cross-sections of bathrooms for which the (a) UBR system and (b) wet construction method had been applied.
Figure 2.
Cross-sections of bathrooms for which the (a) UBR system and (b) wet construction method had been applied.
Figure 3.
Illustration of the experimental setup for the measurement in the bathroom and adjacent rooms of the lower floor (59A type).
Figure 3.
Illustration of the experimental setup for the measurement in the bathroom and adjacent rooms of the lower floor (59A type).
Figure 4.
Views of the experimental setups in (a) the bathroom and (b) the living room.
Figure 4.
Views of the experimental setups in (a) the bathroom and (b) the living room.
Figure 5.
Time history of water supply and drainage noises from the use of sanitary wares including the (a) water closet, (b) basin, and (c) bathtub measured at different locations (only a part of the time history has been shown due to long-time operation).
Figure 5.
Time history of water supply and drainage noises from the use of sanitary wares including the (a) water closet, (b) basin, and (c) bathtub measured at different locations (only a part of the time history has been shown due to long-time operation).
Figure 6.
Time history of the noise from the use of the water closet installed in 19 bathrooms of 11 housings with different floor plans (longest time with red dot: bathroom attached to the living room of the 59A type; shortest time with green dot: bathroom attached to the bedroom of the 84A type).
Figure 6.
Time history of the noise from the use of the water closet installed in 19 bathrooms of 11 housings with different floor plans (longest time with red dot: bathroom attached to the living room of the 59A type; shortest time with green dot: bathroom attached to the bedroom of the 84A type).
Figure 7.
Frequency spectrum of the water supply and drainage noises (LAFmax) from the use of the sanitary wares in the bathrooms attached to the living room of the upper and lower floors for the 59A type: (a) water closet; (b) basin; (c) bathtub.
Figure 7.
Frequency spectrum of the water supply and drainage noises (LAFmax) from the use of the sanitary wares in the bathrooms attached to the living room of the upper and lower floors for the 59A type: (a) water closet; (b) basin; (c) bathtub.
Figure 8.
Average noise level for each sanitary ware measured in the bathrooms of the lower floor attached to the living room (N = 64) and bedroom (N = 49). The deviation bar indicates the range between the maximum and minimum noise levels measured in the different bathrooms.
Figure 8.
Average noise level for each sanitary ware measured in the bathrooms of the lower floor attached to the living room (N = 64) and bedroom (N = 49). The deviation bar indicates the range between the maximum and minimum noise levels measured in the different bathrooms.
Figure 9.
Frequency distribution and cumulative percentages of water supply and drainage noises (LAFmax) in the bathrooms of the lower floor from the use of the sanitary wares (N = 113).
Figure 9.
Frequency distribution and cumulative percentages of water supply and drainage noises (LAFmax) in the bathrooms of the lower floor from the use of the sanitary wares (N = 113).
Figure 10.
Average noise level for each sanitary ware according to the construction methods including the UBR system (N = 15) and wet-construction method (N = 97). The deviation bar indicates the range between the maximum and minimum noise levels measured in the different bathrooms.
Figure 10.
Average noise level for each sanitary ware according to the construction methods including the UBR system (N = 15) and wet-construction method (N = 97). The deviation bar indicates the range between the maximum and minimum noise levels measured in the different bathrooms.
Figure 11.
Water supply and drainage noises (LAFmax) according to the groups of low (N = 60) and high (N = 53) floors.
Figure 11.
Water supply and drainage noises (LAFmax) according to the groups of low (N = 60) and high (N = 53) floors.
Figure 12.
Frequency spectrum of water supply and drainage noises from the use of the water closet measured in the (a) living room and (b) bedroom of the lower floor for the 59B type.
Figure 12.
Frequency spectrum of water supply and drainage noises from the use of the water closet measured in the (a) living room and (b) bedroom of the lower floor for the 59B type.
Figure 13.
Noise levels measured in the living room (N = 11) and bedroom (N = 8) according to the different operational conditions of each sanitary ware in 11 different floor plans: (a) living room; (b) bedroom.
Figure 13.
Noise levels measured in the living room (N = 11) and bedroom (N = 8) according to the different operational conditions of each sanitary ware in 11 different floor plans: (a) living room; (b) bedroom.
Figure 14.
Frequency distribution and cumulative percentages of water supply and drainage noises (LAFmax) in the living room (N = 11) and bedroom (N = 8) of the lower floor from the use of the sanitary wares.
Figure 14.
Frequency distribution and cumulative percentages of water supply and drainage noises (LAFmax) in the living room (N = 11) and bedroom (N = 8) of the lower floor from the use of the sanitary wares.
Table 1.
Korean regulation on acceptable indoor noise level for different noise sources.
Table 1.
Korean regulation on acceptable indoor noise level for different noise sources.
| Type of Noise Sources | Noise Index | Indoor Noise Level (dBA) |
|---|
| Daytime (06:00 to 22:00) | Night-Time (22:00 to 06:00) |
|---|
| Structure-borne noise (e.g., floor-impact noise) | Leq | 43 | 38 |
| Lmax | 57 | 52 |
| Airborne noise (e.g., TV noise from neighbor) | Leq | 45 | 40 |
| Road traffic noise | Leq | 45 |
| Water supply and drainage noise | None | None |
Table 2.
Criteria and credits in G-SEED for measures to reduce water supply and drainage noises.
Table 2.
Criteria and credits in G-SEED for measures to reduce water supply and drainage noises.
| Tier | Criteria | Weighting Factors |
|---|
| 1 | 9 points or above | 1.0 |
| 2 | 7 to 8 points | 0.75 |
| 3 | 5 to 6 points | 0.5 |
| 4 | 4 points and below | 0.25 |
| - Dwelling-water-supply pressure less than 2.5 kgf/cm2: 3 points |
| - Low-flow toilet less than 6 L, single-flush (or 9 L/5 L, dual-flush): 2 points |
| - Installation of buffer at pipe-crossing slabs: 1 point |
| - Low-noise drainage pipe: 2 points |
| - In-floor type for water supply and drainage pipes: 4 points |
| - Noise-reduction measure for air ducts: 2 points |
Table 3.
Class limits for service equipment noise from neighboring spaces (The 2nd ISO/CD 19488).
Table 3.
Class limits for service equipment noise from neighboring spaces (The 2nd ISO/CD 19488).
| Type of Space and Sources | Quantity | Class A | Class B | Class C | Class D | Class E | Class F |
|---|
| In habitable rooms in dwellings from service equipment, producing intermittent or irregular noise from neighboring spaces | LAF,max,nT (1) | ≤26 | ≤30 | ≤34 | ≤38 | ≤42 | ≤46 |
Table 4.
Recommended maximum A-weighted SPL for various transient plumbing-noise sources in buildings (ASHRAE handbook).
Table 4.
Recommended maximum A-weighted SPL for various transient plumbing-noise sources in buildings (ASHRAE handbook).
| Receiving Room | LAmax (Slow Response) (dB) |
|---|
| Residential bedroom, living room, dining room | 35 |
| Residential bathroom, kitchen | 45 |
Table 5.
The number of lower-floor bathrooms (N = 113) and properties (N = 64) studied.
Table 5.
The number of lower-floor bathrooms (N = 113) and properties (N = 64) studied.
| Type of Housing Unit | No. of Bathrooms (A) | No. of Properties with the Receiving Bathroom (B) | No. of Studied Bathrooms (A × B) |
|---|
| 33 | 1 | 5 (1st, 5th, 13th, 16th, 19th floors) | 5 |
| 36 | 1 | 5 (1st, 6th, 13th, 20th, 27th floors) | 5 |
| 46 | 1 | 5 (1st, 6th, 13th, 20th, 27th floors) | 5 |
| 59A | 2 | 5 (3rd, 6th, 10th, 15th, 20th) | 10 |
| 59B | 2 | 5 (3rd, 6th, 10th, 15th, 19th) | 10 |
| 59C | 2 | 5 (3rd, 6th, 10th, 15th, 20th) | 10 |
| 74A | 2 | 4 (1st, 5th, 10th, 14 floors) | 8 |
| 74B | 2 | 5 (1st, 5th, 10th, 15th, 19th floors) | 10 |
| 74C | 2 | 4 (1st, 5th, 15th, 19th floors) | 8 |
| 84A | 2 | 3 (10th, 15th, 19th floors) | 6 |
| 84B1 | 2 | 4 (1st, 5th, 10th, 14th floors) | 8 |
| 84B3 | 2 | 4 (1st, 5th, 15th, 19th floors) | 8 |
| 84C | 2 | 5 (1st, 5th, 16th, 19th, 24th floors) | 10 |
| 84D | 2 | 5 (3rd, 6th, 12th, 17th, 25th) | 10 |
Table 6.
Measured location and number of properties for each measurement parameter.
Table 6.
Measured location and number of properties for each measurement parameter.
| Measurement Parameter | Location | No. of Properties |
|---|
| Noise level | In the bathroom of the lower floor | 64 properties (113 bathrooms) |
| In the bathroom of the upper floor | 11 properties (19 bathrooms) |
| In the adjacent living room and bedroom of the lower floor |
Table 7.
Dimensions and construction methods for the bathrooms in each housing unit.
Table 7.
Dimensions and construction methods for the bathrooms in each housing unit.
| Type of Housing Unit | Dimension of the Bathroom (W × D × H (mm)) | Construction Method |
|---|
| Bathroom Attached to the Living Room | Bathroom Attached to the Bedroom |
|---|
| 33 | 2440 × 1740 × 2080 (3.11 m2) | - | UBR system |
| 36 | 2380 × 1740 × 2080 (3.06 m2) | - | |
| 46 | 2110 × 1710 × 2080 (3.61 m2) | - | |
| 59A | 2240 × 1790 × 2270 (3.62 m2) | 2290 × 1640 × 2270 (3.02 m2) | Wet construction |
| 59B | 2240 × 1790 × 2270 (3.88 m2) | 2240 × 1640 × 2270 (3.07 m2) | |
| 59C | 2240 × 1790 × 2270 (3.89 m2) | 2480 × 1730 × 2270 (3.00 m2) |
| 74A | 2340 × 1790 × 2270 (3.95 m2) | 2340 × 1600 × 2270 (3.56 m2) |
| 74B | 2340 × 1790 × 2270 (3.79 m2) | 2230 × 1790 × 2270 (3.83 m2) |
| 74C | 2390 × 1740 × 2270 (4.00 m2) | 2340 × 1600 × 2270 (3.58 m2) |
| 84A | 2420 × 1790 × 2270 (3.80 m2) | 2390 × 1740 × 2270 (3.99 m2) |
| 84B1 | 2420 × 1600 × 2270 (3.87 m2) | 2500 × 1620 × 2270 (4.06 m2) |
| 84B3 | 2340 × 1590 × 2270 (3.73 m2) | 2430 × 1650 × 2270 (4.01 m2) |
| 84C | 2180 × 1740 × 2270 (3.79 m2) | 2340 × 1620 × 2270 (3.80 m2) |
| 84D | 2340 × 1790 × 2270 (3.72 m2) | 2340 × 1790 × 2270 (4.05 m2) |
© 2016 by the authors; licensee MDPI, Basel, Switzerland. This article is an open access article distributed under the terms and conditions of the Creative Commons Attribution (CC-BY) license (http://creativecommons.org/licenses/by/4.0/).


