
Polarization Sensitive Optical Coherence Tomography: A Review of Technology and Applications

Medical University of Vienna, Center for Medical Physics and Biomedical Engineering, Waehringer Guertel 18-20, 4L, 1090 Vienna, Austria
Appl. Sci. 2017, 7(5), 474; https://0-doi-org.brum.beds.ac.uk/10.3390/app7050474
Submission received: 10 February 2017
/
Revised: 13 April 2017
/
Accepted: 25 April 2017
/
Published: 4 May 2017
(This article belongs to the Special Issue Development and Application of Optical Coherence Tomography (OCT))
Abstract
:Polarization sensitive optical coherence tomography (PS-OCT) is an imaging technique based on light scattering. PS-OCT performs rapid two- and three-dimensional imaging of transparent and translucent samples with micrometer scale resolution. PS-OCT provides image contrast based on the polarization state of backscattered light and has been applied in many biomedical fields as well as in non-medical fields. Thereby, the polarimetric approach enabled imaging with enhanced contrast compared to standard OCT and the quantitative assessment of sample polarization properties. In this article, the basic methodological principles, the state of the art of PS-OCT technologies, and important applications of the technique are reviewed in a concise yet comprehensive way.
1. Introduction
Optical coherence tomography (OCT) is an imaging modality providing 2D and 3D images with micrometer scale resolution [1,2,3]. Often considered an optical analog of ultrasound imaging, OCT detects light backscattered from sample structures. However, since the speed of light is much greater than that of sound, subtle differences in time delays corresponding to optical path lengths from different scatter locations within the sample cannot easily be measured in a direct way. For instance, the time delay corresponding to an optical path length of 10 µm is only on the order of ~30 fs. In order to assess such short delay times, OCT employs the interference of low coherent light [4,5]. Low-coherent light sources span a broad wavelength range, usually covering several tens of nanometers when used for OCT. Before the light interacts with the sample, it is split into two. One portion is directed onto the sample, while the other portion—the so-called reference beam—travels a defined path length before being recombined and interfered with the light beam scattered by the sample. Now, since low-coherent light consists of a continuum of wavelengths, the interference spectrum will be subject to modulations which depend on the path length difference between the sample beam and the reference beam. From the interference signal in the time or spectral domain, the axial position of scattering structures within the sample can be reconstructed [4,5]. The respective depth profile (backscatter intensity vs. depth) is called an axial scan (A-scan) and forms the basic unit of OCT images. By scanning the beam laterally across the sample, two- and three-dimensional images can be assembled from the acquired A-scans. OCT is a rapid imaging method providing 3D data comprising up to several millions of axial scans within few seconds [6]. The axial resolution of OCT is usually in the order of a few micrometers and, despite the high imaging speeds, the interferometric approach enables detection sensitivities of reflected light signals as low as 10−10 of the input.
During the past 25 years since its invention, OCT experienced a multitude of technological advances leading to higher imaging speeds, improved resolution, and novel contrast mechanisms. One so-called functional extension of OCT is polarization sensitive (PS) OCT. PS-OCT adds polarization contrast to the technique. While the standard OCT is based solely on the intensity of light backscattered or reflected by the sample, PS-OCT also detects its polarization state. Since the polarization state can be measured for every pixel in a depth scan, PS-OCT can enhance the image contrast and also enables quantitative measurements of a sample’s polarization properties. These properties are often linked to the micro- or even ultrastructure of the sample which themselves are below the optical resolution limit of OCT [7]. Hence, the detection of changes of polarization properties—be they due to disordered microstructure in pathological tissue or due to stress and strain in a technical sample—may provide access to quantities and markers that are of interest for a broad variety of applications.
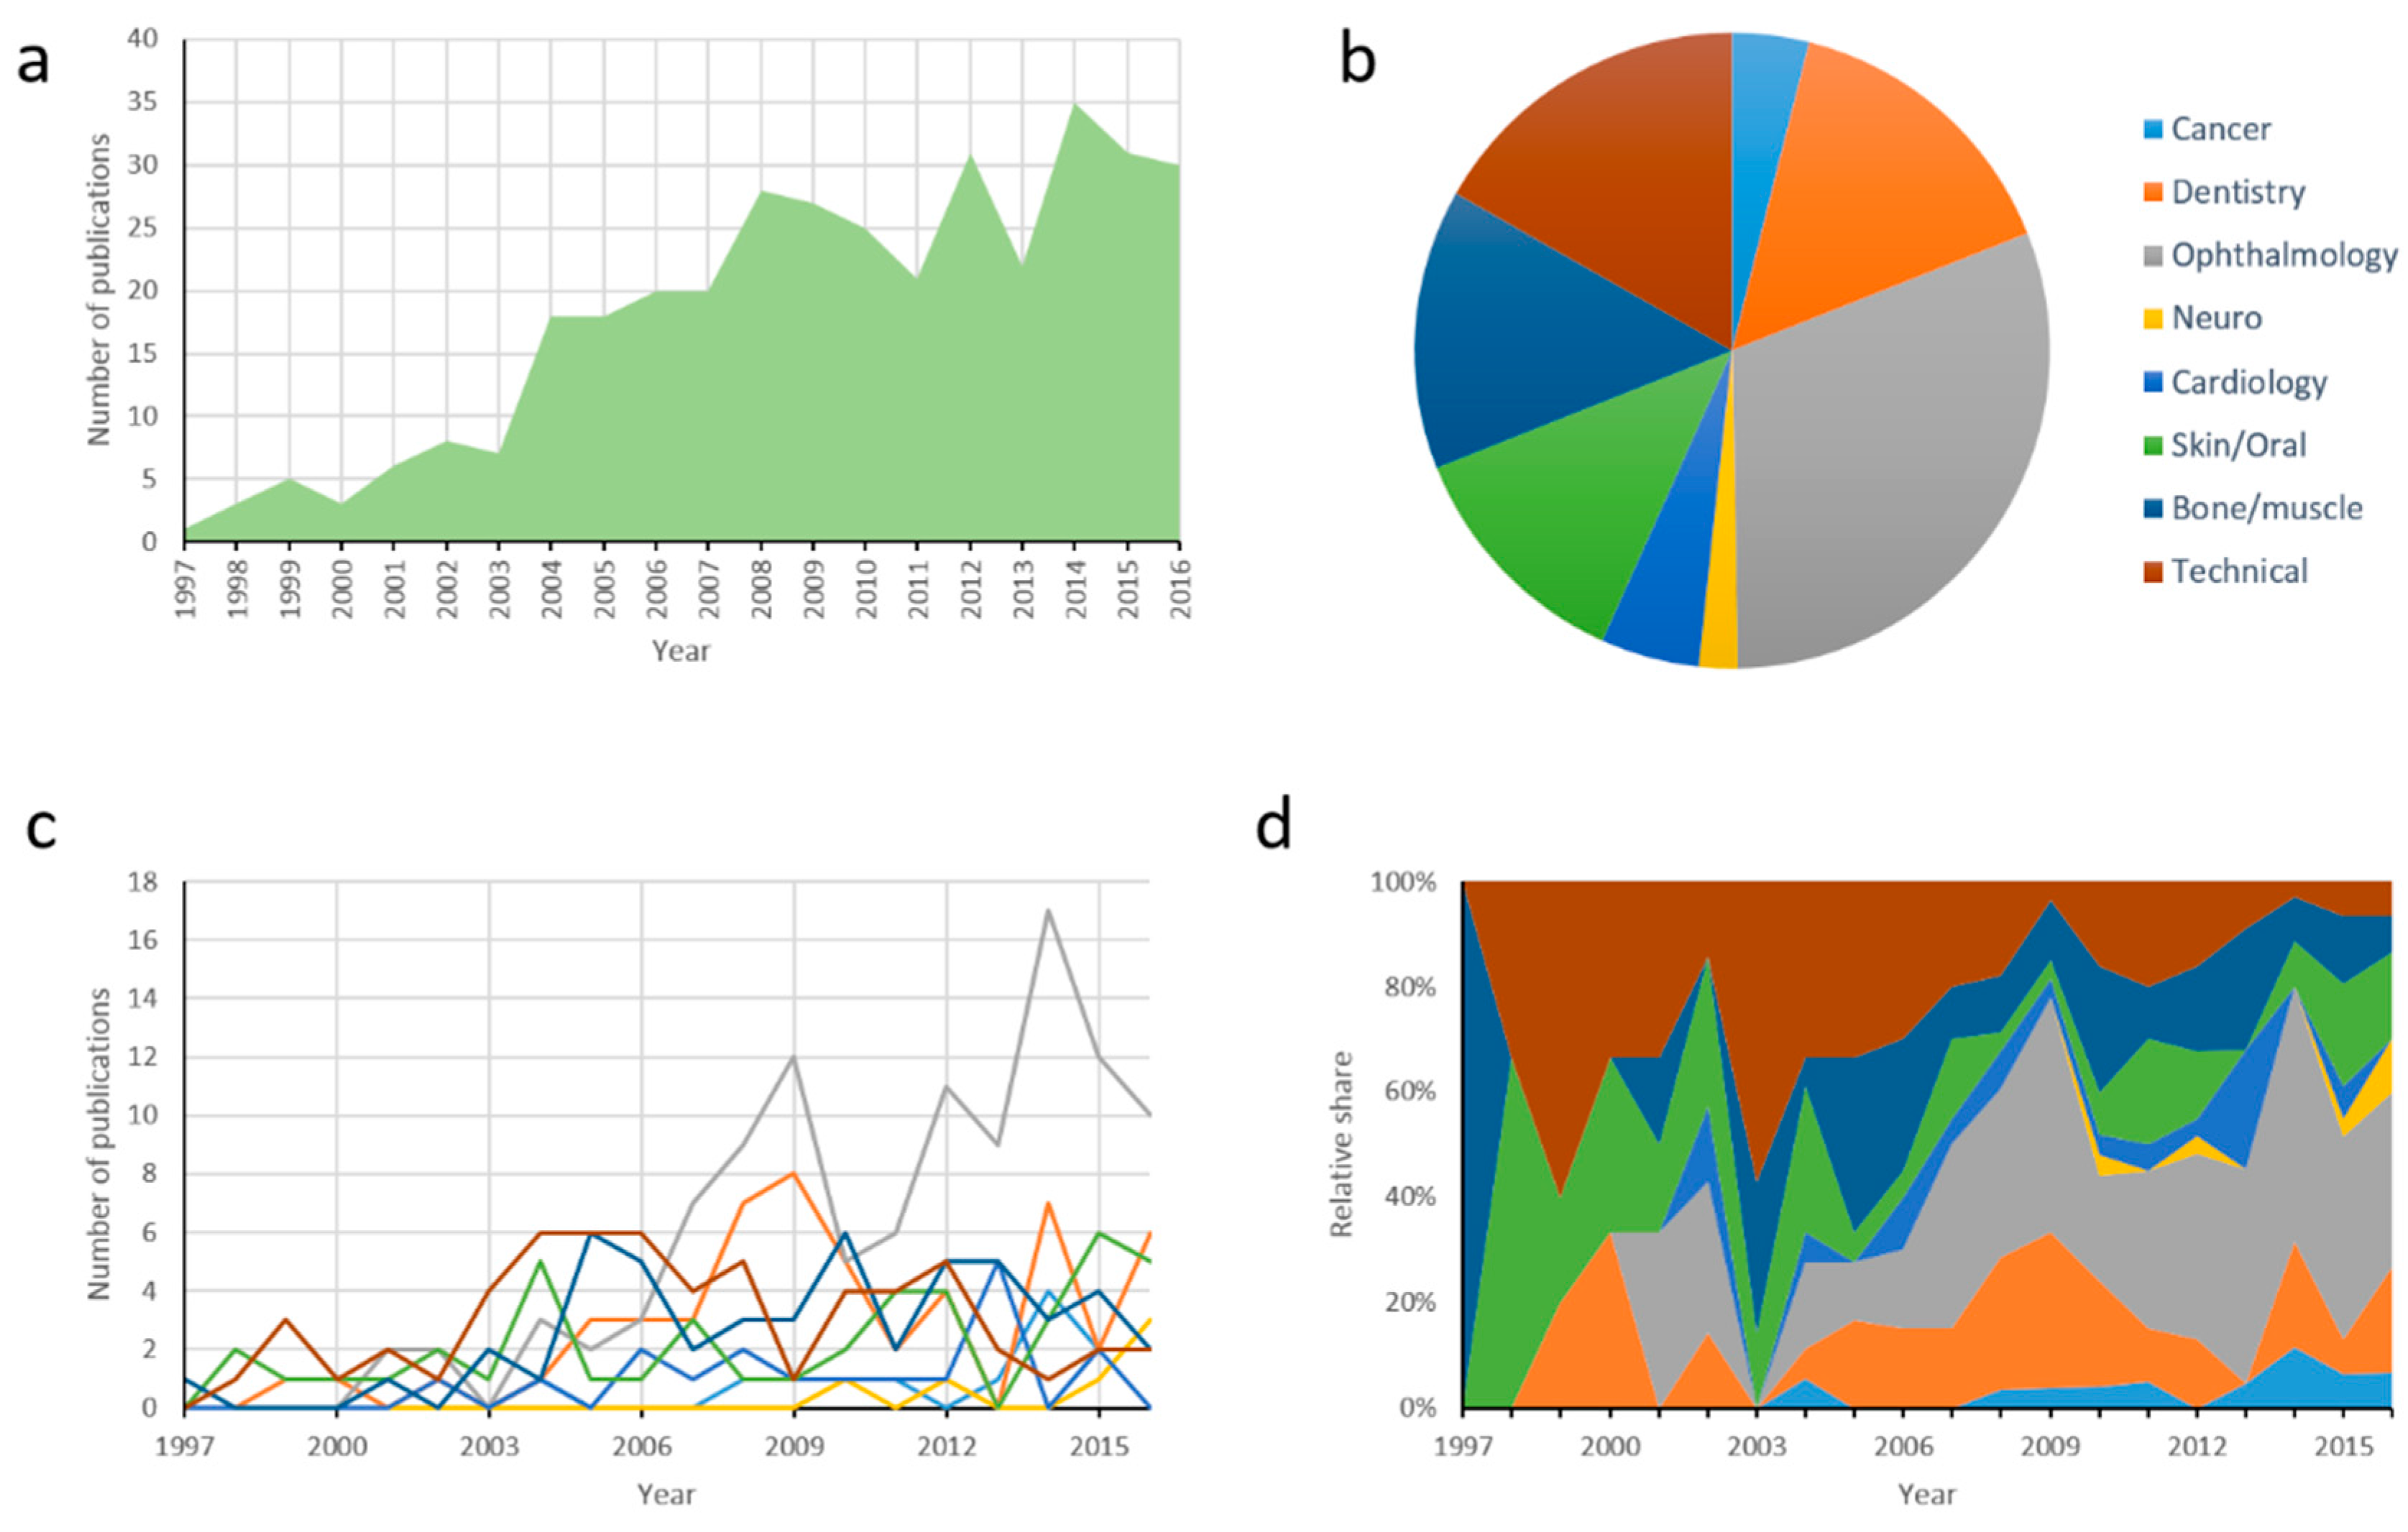
PS-OCT has been applied in many biomedical as well as non-medical fields. Figure 1 shows results of a search for scientific publications on PS-OCT using the free literature search engine PubMed (https://0-www-ncbi-nlm-nih-gov.brum.beds.ac.uk/pubmed/). In Figure 1a, the number of publications per year was plotted beginning with the first article on PS-OCT published in 1997 [8]. A rising trend of published documents per year can be observed, peaking with more than 30 publications per year for the last three years. The set of 360 publications was classified into seven medical fields and one non-medical field. The latter included articles primarily focusing on technological aspects or on measurements of technical (i.e., non-biological) samples. Figure 1b shows a pie chart with the break-up into the eight fields. The most prominent field was ophthalmology including roughly a third of all publications, followed by the ‘technical’ publications, reports on dental applications, PS-OCT in bones, cartilage, muscles and tendons, and skin imaging. Further fields of application were imaging of cardiac and vascular tissue, of cancerous tissue, and of neural tissue. The evolution of the eight groups over the past 20 years is shown in Figure 1c. Here, an increasing number of research papers on PS-OCT in the eye during the last decade can be observed. The relative share of publications grouped in the respective fields is shown in Figure 1d.
This review paper strives to provide an overview of the state of the art in PS-OCT. While other review papers provided a more in-depth discussion of the physical principles of the technique [9,10], this article is particularly focusing on applications of PS-OCT. In the following, we will first introduce basic concepts for describing polarization of light as well as commonly used technical approaches for realizing PS-OCT. Then, using the eight categories mentioned above, we will discuss important applications of PS-OCT in the biomedical field and for non-biomedical use.
2. Principles of Light Polarization and PS-OCT
2.1. Polarization of Light
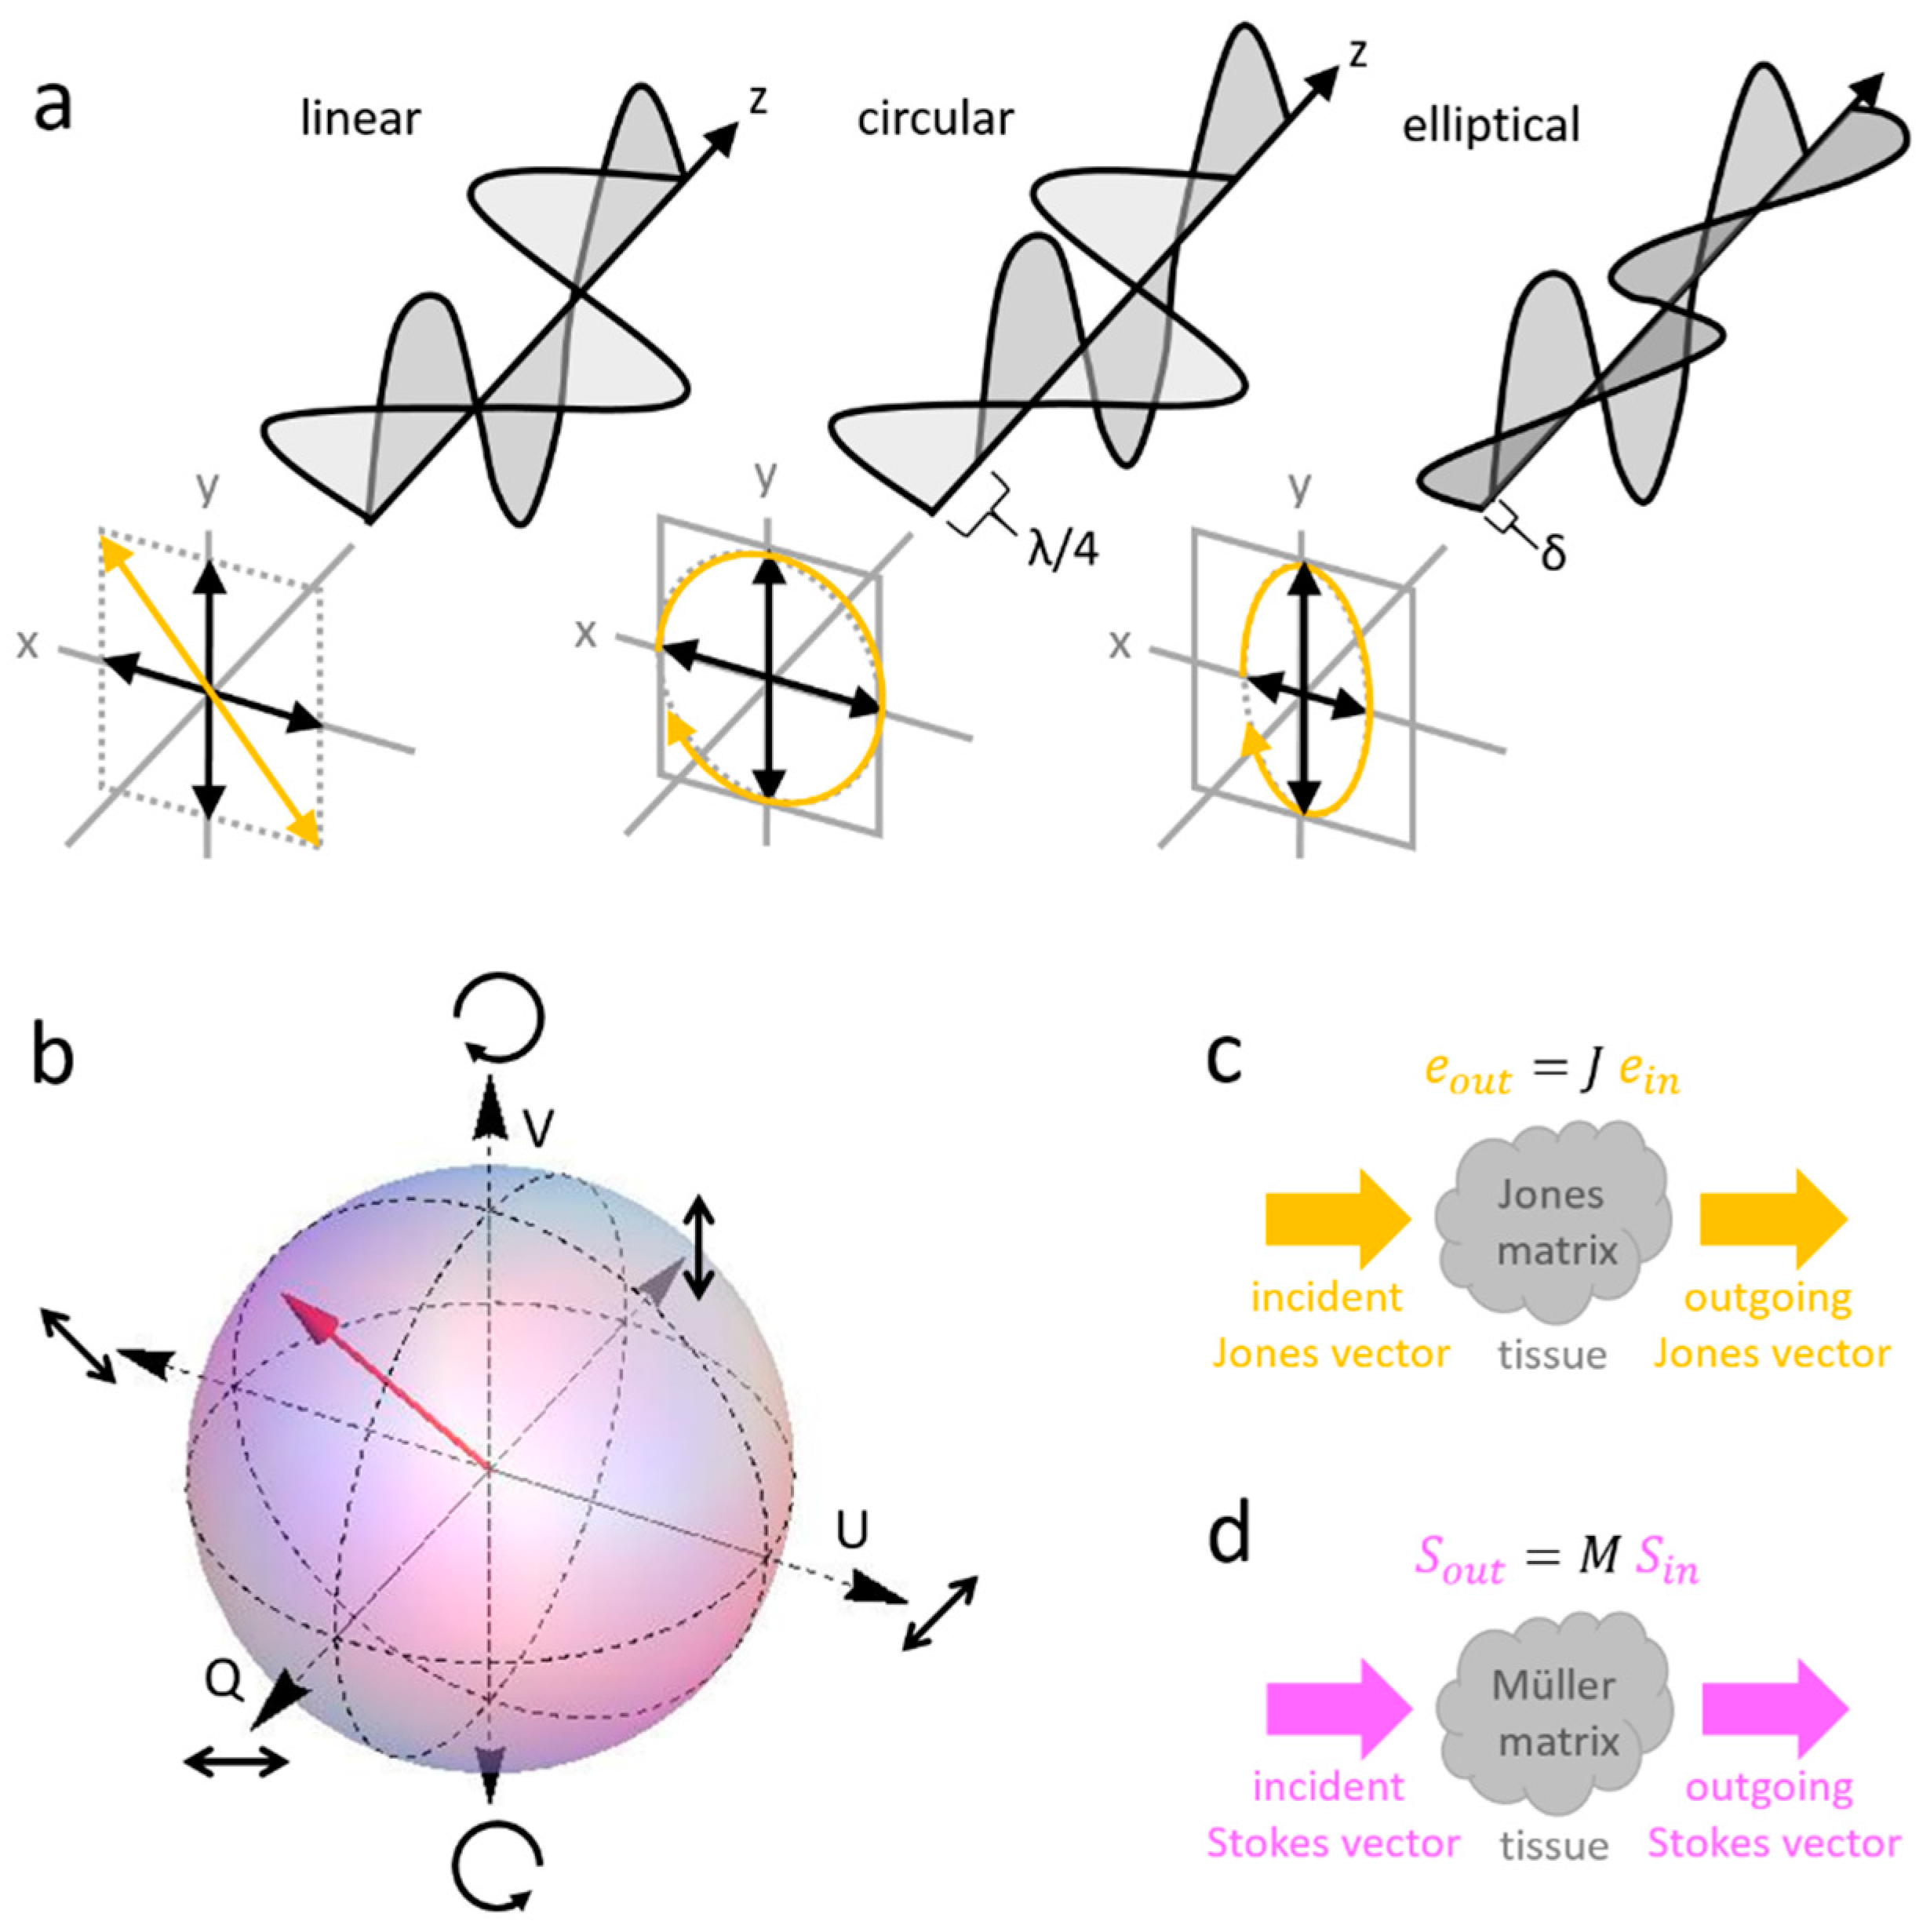
Polarization of light describes the geometrical orientation of the oscillations of electromagnetic waves. When considering a light beam as a transverse wave propagating in z-direction, its electric field vector and magnetic field will not only be perpendicular to each other but also be perpendicular to z. At any spatial coordinate and time point, such a wave can be characterized by the complex-valued field components ex,y describing the oscillations in x- and y-direction, respectively. For a monochromatic plane wave travelling in z-direction, these two complex-valued components form the so-called Jones vector [11]. Depending on the amplitudes of ex and ey and on their respective phase delay δ, different states of polarization will be observed, as illustrated in Figure 2a. A Jones vector having a relative delay of 0° or 180° (i.e., half a wave) describes a linear polarization state. In case this linear state oscillates only in x-direction or only in y-direction, it is termed a horizontal or vertical linear state, respectively. When the x- and y-amplitudes are equal, the state is linear with an orientation of +45° for δ = 0° and linear with an orientation of −45° for δ = 180°. If the amplitudes in x- and y-direction are equal but δ is a quarter of a wave (i.e., δ = ±90°), the Jones vector will describe a right- or left-hand circular polarization state. In the general case of arbitrary δ and amplitudes, the wave will be in an elliptical polarization state.
As an alternative to describing polarization states by Jones vectors, a three-dimensional space spanned by horizontal/vertical linear state, +45°/−45° linear state, and right-/left-hand circular state can be used (Figure 2b). Four-component, real-valued vectors [I Q U V]T, so-called Stokes vectors, describe polarization states in this space [12]. Here, I corresponds to the intensity of light, and Q, U, and V are the components along the three above-mentioned axes. Unlike Jones vectors, Stokes vectors enable the characterization of light depolarization. In case of fully polarized light, I corresponds to the length of the vector [Q U V], i.e., . Then, the light’s degree of polarization equals unity. In case of depolarization, DOP is less than unity, and equals zero for completely depolarized light. The unit sphere in Figure 2b is called a Poincaré sphere.
In order to describe the interaction of light with an optical element (or a sample investigated by a PS-OCT system), an operator acts on the polarization vector of the interrogating light beam. In Jones calculus, this operator is a complex-valued 2 × 2 matrix called Jones matrix (J) [11]. The evanescent light beam is represented by , where is the input Jones vector (Figure 2c). If the light beam traverses several optical elements (or sample structures), the resulting Jones vector can be calculated by multiplying a cascade of Jones matrices to the input vector, where through represent the polarization properties of N elements (or sample layers). Analogously, real-valued 4 × 4 matrices—so-called Müller matrices (M)—are used to describe the interaction of Stokes vectors with optical elements by the Stokes–Müller formalism: (see Figure 2d) [12].
Different approaches of PS-OCT enable the pixelwise measurement of Jones vectors, Jones matrices, Stokes vectors, or Müller matrices. Since the display and interpretation of these multidimensional quantities is often not straight-forward (or even impossible), PS-OCT imagery usually displays physical polarization measures directly related to relevant sample properties.
2.2. Polarization Effects
The polarization state of a light beam can be affected by interaction with optical components or sample structures [7]. In the following, four polarization effects will be described which are relevant for PS-OCT imaging.
- Preserved polarization. Many optical components and materials do not (or only negligibly) change the polarization state of light traversing them, i.e., and . Their interaction can be described by and .
- Birefringence. In birefringent media, differently oriented polarization states experience different speeds of light. When these basis polarizations are orthogonal linear polarizations (as in Figure 2a along the x- and y-axes), the effect is referred to as linear birefringence. Birefringence may also be circular or elliptical for respective different bases (eigenvectors); in this review, however, we restrict our discussion to linear birefringence. Linear birefringence occurs for instance in retarders such as wave plates, in crystals, and in many tissues with an oriented (e.g., fibrous) microstructure. Birefringence—i.e., the difference Δn of the refractive indices along the two axes–produces a phase retardation δ, which is proportional to the length L of the retarder, δ = Δn·L. The retardation δ of a quarter wave plate (QWP) for example amounts to 90° (π/2 rad). If aligned with its slow and fast axes at 45° with respect to the x- and y-axes, the QWP would render a horizontal or vertical linear state into a circular polarization state (Figure 2a, center). The Jones matrix of a retarder with a retardation δ and aligned with an orientation ϑ = 0 is represented byIf an optical element such as a retarder is rotated by an angle ϑ, its Jones matrix is transformed into where is a rotation matrix. In Stokes-Müller formalism, the propagation of light through birefringent tissue is represented by a circular rotation of the Stokes vector tip on the Poincaré sphere. PS-OCT approaches based on Jones calculus or Stokes-Müller formalism enable depth-resolved measurements of phase retardation and of birefringent axis orientation [8,13,14,15,16].
- Diattenuation. Diattenuation (or dichroism) refers to a polarization dependent attenuation in an optical medium. When the axes of a diattenuating optical element or structure are aligned with the x- and y-direction, its Jones matrix is represented bywhere and correspond to the respective signal attenuation with attenuation coefficients µa and the length L. Similar to the linear birefringence, the Jones matrix for a diattenuating element oriented at ϑ can be computed by sandwiching Equation (2) by rotation matrices. An extreme case of a diattenuating element with and is a linear polarizer which only transmits light along axis 1. It should be noted that diattenuation in biological tissue is usually very weak and thus is often assumed negligible for PS-OCT [16,17], although attempts have been made to quantify diattenuation using PS-OCT [15,17,18].
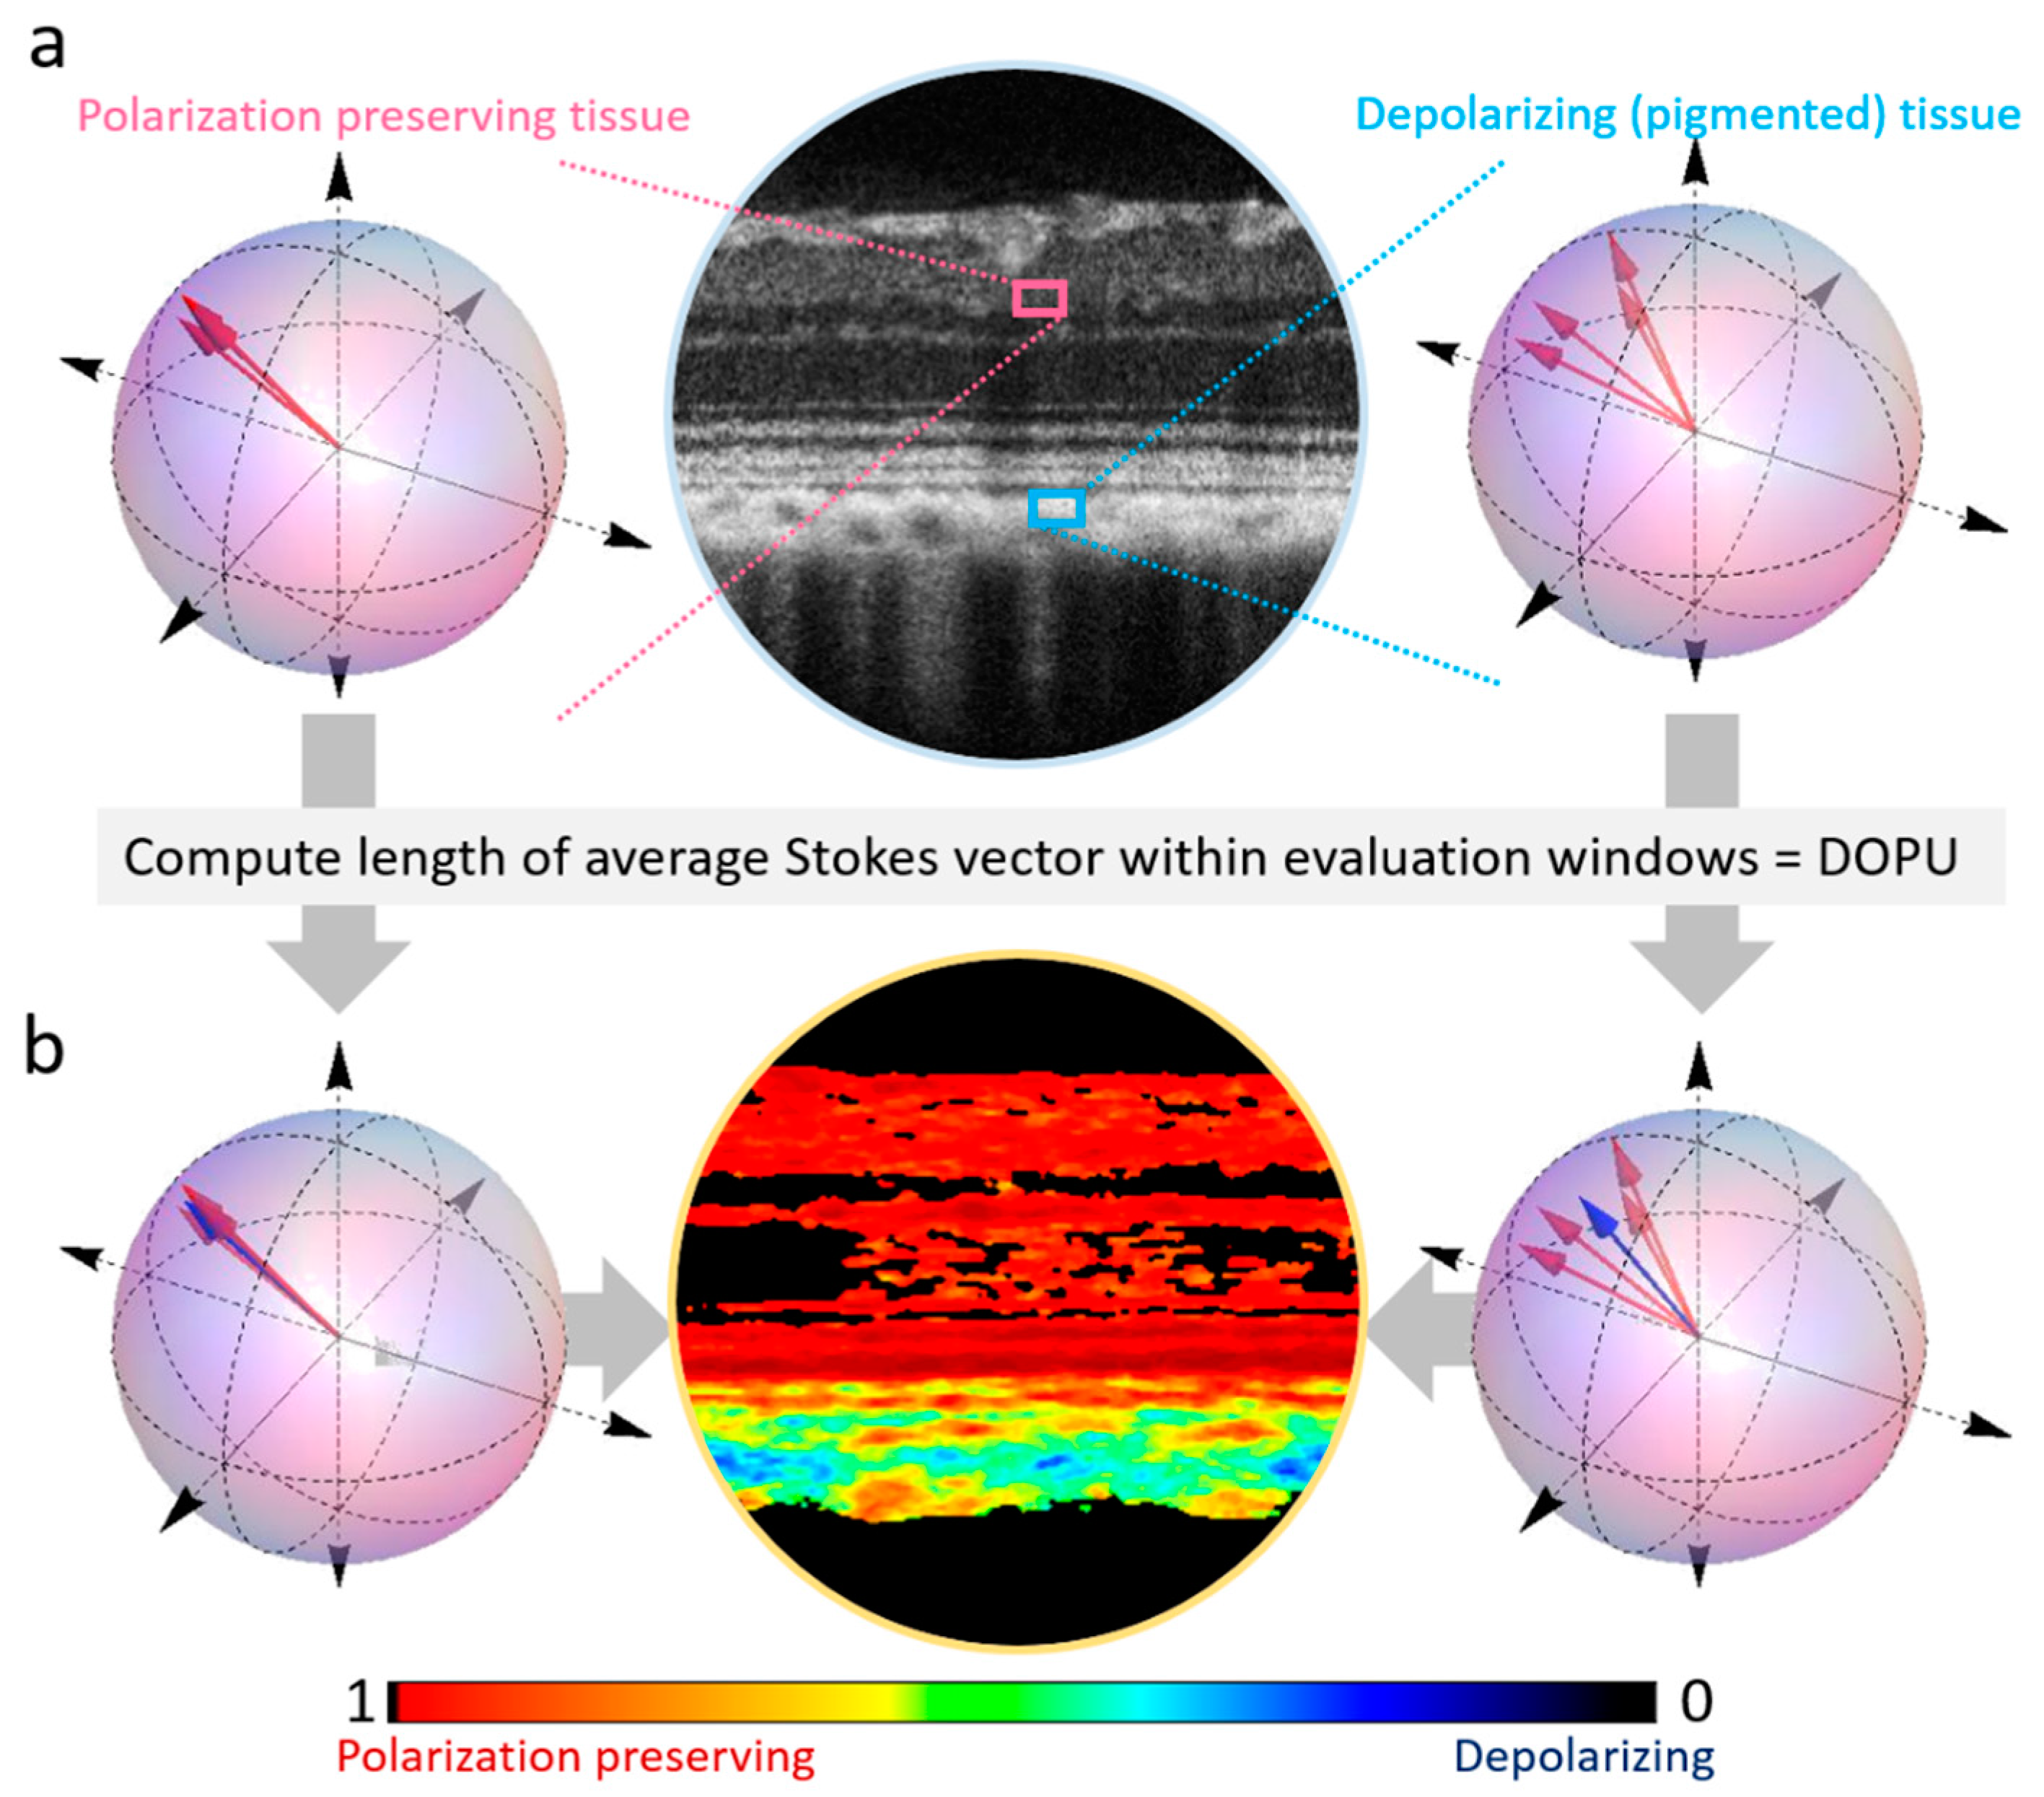
- Depolarization. Depolarization or polarization scrambling refers to a more or less random change of the incident polarization state at spatially adjacent sample locations. Using Stokes–Müller polarimetry, depolarization can be described by the DOP discussed in Section 2.1. However, owing to the coherent detection in OCT, DOP will always equal unity in any pixel of a PS-OCT dataset [9]. Therefore, in order to analyze polarization scrambling using PS-OCT, the randomization of polarization states among neighboring speckles is investigated [19,20]. The Stokes vectors of adjacent speckles will be more or less parallel in polarization preserving or weakly birefringent media, while they will point in different directions in depolarizing media (Figure 3a). For the purpose of depolarization assessment, the average Stokes vector can be calculated within a small kernel including several speckles (Figure 3b). Typical kernel sizes for this calculation are on the order of ~100 pixels spanning 2–3 times the axial resolution in depth and 2–3 times the transverse resolution laterally [20]. Note also that pixels with low reflectivity (i.e., less than several decibels above the noise floor) are usually excluded from the analysis. The length of the average normalized Stokes vector is referred to as the degree of polarization uniformity (DOPU) [20]:where the overbar indicates the ensemble average and denotes the average Stokes vector length for normalization. As shown in Figure 3b, DOPU or the average Stokes vector length will be close to unity in polarization preserving tissue, while it will be lower in the case of polarization scrambling where the orientation of the Stokes vectors is more diverse. In DOPU images, DOPU values at every spatial coordinate are color-coded. Recently, advanced depolarization measures have been developed including DOPU with noise floor normalization [21], spectral DOPU [22], the depolarization index independent of the incident polarization state [23], and the differential depolarization index providing a larger dynamic range for depolarization mapping [24]. Different mechanisms can cause polarization scrambling, and the actual cause of depolarization observed in DOPU images has not always been completely clarified. In biological tissues, depolarization can be caused by multiple scattering or by scattering at non-spherical particles such as melanin granules [25]. Since the strength of depolarization is proportional to the concentration of polarization scrambling scatterers, depolarization measures such as DOPU may for instance enable a quantitative assessment of the melanin concentration in ocular tissues [26].
In general, polarization effects may be subject to dispersion, that is, their strength depends on wavelength. Since OCT is based on broadband light covering a wide range of wavelengths, efforts have been made to mitigate effects such as polarization mode dispersion in PS-OCT systems based on optical fibers [18,27,28,29,30].
2.3. Brief Basics of OCT
OCT is based on low coherence interferometry, i.e., the interference of broad band light [1,4]. A multitude of different interferometer designs have been used for OCT. A sketch of a basic Michelson interferometer is shown in Figure 4a. Here, light from a low coherent light source such as a superluminescent diode or a broadband laser is split into one beam that is directed on the sample and another beam that serves as a reference. After the beam splitter, the beam in the sample arm is directed onto the sample, whereas the reference beam is reflected by a mirror. Light backscattered and reflected by the sample and light reflected by the reference mirror is recombined at the beam splitter. The sample and reference beam interfere and their interference signal is detected at the interferometer exit. The interference signal in the time domain can be described by
Here, is proportional to the intensity of the reference beam and is proportional to the intensity of light backscattered or reflected by the sample. The third term contains the interference information. Its first component indicates that the strength of the interference signal will scale with both the sample and the reference amplitude. The high sensitivity of OCT is based on the fact that even weak light scatter signals from the sample can be amplified by a strong reference signal The second component contains the complex degree of coherence which is inversely related to the spectral bandwidth of the light source (via the Fourier transform of the spectral density). For broad bandwidth sources common in OCT, will only be greater than zero for a shallow depth around every scattering sample interface along the propagation direction z. Hence, the high resolution of OCT is contained in this term. The third component describes a sinusoidal modulation of the interference signal along z. Here is the central wavenumber of the spectrum. In order to acquire depth scans in time domain OCT, the signal intensity is recorded at the interferometer exit while the reference mirror is axially translated in beam direction z.
Most modern OCT systems rely on frequency (or Fourier) domain detection of the interference signal [5,31]. In such Fourier domain OCT systems, the reference mirror position is fixed and the interference spectrum is acquired. This can be achieved by using a spectrometer at the interferometer exit which disperses the interference signal into its spectral intensity components. Alternatively, a broadband wavelength-swept light source can be used to rapidly tune the spectrum with a narrow instantaneous bandwidth. In this case, the interference spectrum is recorded as a function of time by a detector at the interferometer exit. For each interface, the acquired spectral interference signal
contains three terms, similar to Equation (4). The first two terms contain the spectral densities returning from the reference arm (R) and the sample arm (S). Via the last term again is proportional to the spectral densities of the reference beam and the sample beam. Note that the last term is subject to a modulation across wavenumber k, whose modulation frequency is proportional to the path length difference between the light path to sample interface and the light path to the reference mirror, . The factor 2 accounts for the double pass through the interferometer arms. Since every path length difference is encoded by a different spectral modulation frequency, the interference signals from multiple depth locations can be recorded simultaneously. A frequency analysis using the Fourier transform then provides the axial depth scan similar to Equation (4).
2.4. Technical Approaches to PS-OCT
During the past 25 years, a great variety of PS-OCT layouts has been devised. PS-OCT schemes differ in terms of optical technology (fiber optics vs. bulk optics), number of input states, number of detected variables, and reconstruction algorithm. The use of free-space beams in bulk optics permits defined polarization states at any location within the interferometer. Fiber optics provide easier system alignment, but the polarization of light will in general be influenced by birefringence and polarization mode dispersion in optical fibers. PS-OCT has been performed with as little as one input state and one detected intensity signal. Such settings correspond to regular OCT, however with altered reference polarization for cross-polarization imaging [32,33] or for imaging with variable reference polarization [34]. In contrast, the most comprehensive PS-OCT approaches detected up to 16 elements of the sample’s Müller matrix—in every single image pixel [35,36,37,38]. In the following, we are going to describe two major categories of PS-OCT schemes: PS-OCT with a single circular input stage and PS-OCT based on sample illumination by multiple polarization states.
2.4.1. PS-OCT with a Single Circular Input State
PS-OCT with a single circular input state relies on a polarization sensitive low coherence interferometer design devised by Hee et al. in 1992 [13]. The basic scheme using a Michelson interferometer is shown in Figure 4b. Light from a low coherent light source is linearly polarized before being split up into a reference arm (top) and a sample arm (right). In the sample arm, the beam passes a QWP oriented at 45° which renders the original linear polarization into a circular polarization state and then illuminates the sample. Sample illumination by circular light offers sensitivity to any transverse orientation of birefringent media. If linearly polarized light were used for sample illumination, the sample’s fast or slow birefringent axis could align with the interrogating linear polarization such that no birefringence would be observed. In the case of circular sample illumination shown in Figure 4b, a birefringent sample will in general produce an elliptical state. The reflected or backscattered light will transmit the QWP again and interfere with the reference beam at the beam splitter. Due to double passing a QWP oriented at 22.5° in the reference arm, the reference beam is a linearly polarized light beam oscillating at 45° which provides equal intensity components in the horizontal and vertical orientation, respectively. At the interferometer exit, the OCT light beam is split up into its horizontal (H) and vertical (V) component, which are detected by separate detection units. By the respective amplitudes AH,V and the relative phase difference ΔΦ, Jones vectors are detected for every image pixel. These Jones vectors enable the calculation of the sample’s birefringent properties, namely of phase retardation δ [13,39] and fast birefringent axis orientation ϑ [14] as well as sample reflectivity R:
Since δ = Δn·L accumulates as a function of the light path L travelled in a birefringent material, phase retardation measurements are cumulative. However, the measurement of δ is restricted to 0–90° due to the arctangent, which leads to cumulative retardation images with a banded structure caused by increasing and artificially decreasing δ in strongly birefringent samples (cf. Figure 9 and Figure 10). From the detected amplitudes AH,V and the relative phase difference ΔΦ, the Stokes vector elements can also be calculated for every image pixel [19]. These may then serve as the input for depolarization images, for instance based on DOPU [20].
The beauty of the above scheme lies in its simplicity. Most implementations were done using free-space optics [14,40,41,42,43,44], however fiber optic prototypes have also been reported based on polarization maintaining (PM) fiber optics [45,46,47,48,49,50,51,52] and regular single mode fibers [53,54,55].
2.4.2. PS-OCT Based on Multiple Input States
PS-OCT systems using multiple polarization states as an input may provide access to additional polarization quantities. The scheme described in Section 2.4.1 is based on a single circular input state and relies on the assumptions that the sample is not diattenuating (which is a valid assumption for most biological tissues [17,56]) and that the axis orientation of the birefringent structure does not change along depth [43,44]. A method to overcome the latter limitation for retinal PS-OCT has been developed to remove the impact of corneal birefringence on birefringence measurements in the back of the eye [57]. Nevertheless, for applications such as PS-OCT in samples with strongly varying birefringent fiber orientations or for many approaches based on single-mode fiber optics, implementations based on multiple polarization states can provide access to Stokes vector quantification, Jones matrix characterization, and Müller matrix measurements [15,16,17,35,36,37,38,58,59,60,61,62,63].
In order to provide measurements of several polarization states, different approaches have been proposed, only a few of which are described here. By adding a polarization modulator (e.g., an electrooptic modulator) in the source arm, different input states can be produced in a sequential manner. In a commonly used scheme depicted in Figure 4c, a consecutive pair of polarization states corresponding to Stokes vectors perpendicular in a Poincaré sphere representation is generated at the input of the interferometer. From the polarization states detected at the output of the interferometer, depth-resolved Stokes vectors can be computed [64,65]. The retardation induced by birefringent tissue is related to the angle of rotation of Stokes vectors on the Poincaré sphere. By computing this angle between the Stokes vectors at the sample surface and those within the tissue, cumulative phase retardation can be computed at any sample position [66,67]. Furthermore, the direction of the optic axis can be determined from rotations of the pair of perpendicular Stokes vectors on the Poincaré sphere [68]. In such dual-input PS-OCT systems, polarization parameters such as retardation, axis orientation, and diattenuation can also be assessed using the Jones formalism. In this approach, the measured polarization states in the sample originating from the pair of input polarization states are used to reconstruct the Jones matrix in every image pixel. An eigenvalue analysis of these measured Jones matrices enables the calculation of phase retardation and diattenuation [15,16]. The Jones matrix approach to PS-OCT also enables the measurement of the optic axis orientation [15,16]. Depth-resolved measurements of the birefringent axis orientation have recently gained interest for mapping the orientation of birefringent fibers in PS-OCT based tractography of collagenous tissue [69,70].
Alternatively, using a Mach–Zehnder type interferometer, only the polarization state in the sample arm can be varied [71,72] from one scan to the next. By multiplexing two different states using a passive polarization delay unit as shown in Figure 4d, the four elements of a Jones matrix can be measured simultaneously [18,73,74]. In that case, the sample beam is split into two orthogonal input Jones vectors which travel different path lengths in the sample arm and therefore generate signals at different depths in the OCT image. These two input vectors provide an orthogonal system and their response—i.e., the two Jones vectors measured via multiplexing—readily provides a Jones matrix [15]. Jones matrix OCT relates the Jones matrix measured at each sample position to a reference matrix (e.g., at the surface of the sample), thereby yielding a unitary transformation of the sample matrix [15,16,75]
Here the tilde denotes the unitary transformation. From , the polarization properties can be computed. As such, Jones matrix PS-OCT can not only measure phase retardation but also diattenuation [15], local birefringence [16], and local optic axis orientation [76]. Compared to cumulative retardation measurements, local measurements of birefringent properties provide a more intuitive approach to tissue architecture and composition. For instance, in collagenous tissue such as skin, local birefringence can be used for the depth-resolved assessment of the collagen content [77,78]. Different applications of birefringence imaging of collagen in healthy and diseased tissues will be discussed in Section 3.
2.5. Recent Advances in PS-OCT Technology
The development of PS-OCT has greatly advanced since Hee and coworkers first presented birefringence-sensitive ranging [13]. Not only have PS-OCT devices become faster and the detection schemes become more sophisticated, as briefly described in the previous section, but also the analysis of PS-OCT images has improved a lot.
The first PS-OCT prototypes provided axial scan rates on the order of several hertz [8,13,14]. Later rapid reference scanning schemes [79,80] and advanced beam scanning approaches such as transverse-scanning PS-OCT [40] sped up the technique to several frames (B-scans) per second. The advent of Fourier domain OCT (or: frequency domain OCT), which computes A-scan signals by a Fourier transform of the interference spectrum, provided a huge increase in detection sensitivity and the possibility to scan even faster since no more mechanical reference mirror movement was required to perform depth scanning [5,81,82,83]. First high-speed PS-OCT systems with spectrometer-based detection provided scan rates of several tens of A-scans per second [41,68]. These spectral domain (SD) PS-OCT prototypes employed two spectrometer cameras, one for each orthogonal polarization channel. In order to reduce system complexity, cost, and alignment efforts, SD PS-OCT approaches based on single camera detection were developed [42,49,84,85,86,87,88,89].
Fourier domain OCT can also be performed by using a frequency-swept laser and a high-speed detector, such that interference spectra are acquired as a function of time rather than in parallel with a spectrometer [90,91,92]. This variant of OCT is usually called swept-source (SS) OCT and sometimes also referred to as optical frequency domain imaging (OFDI) or time-encoded frequency domain OCT. Providing the same sensitivity and speed advantages as spectrometer-based Fourier domain OCT, SS-OCT was soon expanded by polarization sensitivity [47,71,75,93,94,95,96,97]. In particular the advent of commercial laser technology providing longer imaging ranges led to the development of PS-OCT at ultrahigh imaging speeds of 100,000 axial scans per second [18,54,73,74,98]. Even higher imaging speeds were achieved by experimental swept lasers operating at several hundred kilohertz [50,99,100,101,102].
While PS-OCT technology has greatly advanced, there are still some limitations to the technique. Being an optical method, its applicability is limited to imaging of superficial locations in tissues and other objects. Further, PS-OCT has been used for qualitative imaging mostly; the exploitation of quantitative measurements however bears great potential for diagnostics and other applications, as will be demonstrated in the next sections. PS-OCT was also combined with other functional OCT extensions such as Doppler OCT or OCT angiography [30,68,80,103,104,105]. Such combinations may not only improve the contrast for vascular tissue components but also provide additional, complementary insight into disease patterns [30,103,105,106]. In order to perform PS-OCT beneath the body surface, endoscopic and needle-based PS-OCT was developed [28,29,107,108,109,110,111,112]. To further increase the contrast and image range, PS-OCT has been combined with other technologies such as ultrasound and fluorescence imaging [113,114].
In parallel to the impressive evolution of PS-OCT hardware, PS-OCT image processing also underwent massive improvements. Real-time display of PS-OCT data was enabled by parallel computing [115]. Computational methods were devised for removing polarization artifacts in order to produce clearer PS-OCT images [21,27,28,29,57,116,117]. As PS-OCT is an interferometric technique based on coherent light, images are subject to speckling which sometimes obscures structural details. The size of speckles can be kept small by using broadband light sources and optics providing high transverse resolution [46,118]. In image processing, speckle noise can be reduced by image averaging and dedicated algorithms [119,120]. PS-OCT also enables the segmentation of structures based on common polarization properties and the determination of interfaces between different tissue segments based on changing polarization properties. Segmentation and image feature assessment was developed based on depolarization [20,103,121,122,123,124,125] and birefringence [98,116,126,127,128,129]. Practical examples of PS-OCT applications will be shown in the following sections.
3. PS-OCT Applications
3.1. PS-OCT in the Eye
OCT is most established in ophthalmology, where it has become a standard diagnostic method in everyday clinical routine [130]. Also PS-OCT has been successfully applied for ophthalmic imaging using experimental prototypes [131]. The eye features a variety of tissues exhibiting birefringence or depolarization, which enable PS-OCT to provide additional contrast for discerning, segmenting, and quantifying ocular structures. Birefringence can be found in fibrous tissues such as the retinal nerve fiber layer (RNFL), the sclera (i.e., the white outer shell of the eye), the cornea, as well as in extraorbital muscles and tendons. Depolarization is pronounced in structures containing melanin pigments such as the retinal pigment epithelium (RPE), the choroid, and the pigment epithelium of the iris. Other structures such as the photoreceptor layer, conjunctive tissue, and the stroma of the iris are rather polarization preserving and do not markedly influence the polarization state of light.
The RNFL consists of the axons of the retinal ganglion cells. Since the RNFL is damaged in glaucoma—the second leading cause of blindness worldwide [132]—and since RNFL birefringence is connected to layer integrity [133,134], the polarization properties of the RNFL were investigated as potential diagnostic markers for glaucoma. PS-OCT based assessment of the RNFL’s birefringent properties might be particularly interesting since it was shown that polarization changes in experimental glaucoma can be observed earlier than RNFL thickness changes [135]. Peripapillary RNFL thickness is currently a key OCT parameter for glaucoma diagnostics in state-of-the-art clinical routine [136]. In the vein of earlier scanning laser polarimetry approaches [137,138,139], PS-OCT was applied to investigate the RNFL using PS-OCT. After initial experiments in the primate retina [140], RNFL birefringence was measured in vivo in the human eye by performing circular scans around the optic nerve head [79,141]. Faster Fourier domain PS-OCT later enabled 2D mapping of RNFL birefringence and retardation as well as comparisons to scanning laser polarimetry [18,73,142,143,144,145]. Exemplary PS-OCT fundus images mapping reflectivity and RNFL retardation in a human eye are shown in Figure 5. Also in preclinical research, PS-OCT was used to investigate the birefringence properties of the RNFL and their relation to the intraocular pressure, which is an important parameter for glaucoma, in animals [135,146,147,148]. Aside from measuring their birefringence, PS-OCT was also demonstrated for tracing nerve fiber bundles in the RNFL [149].
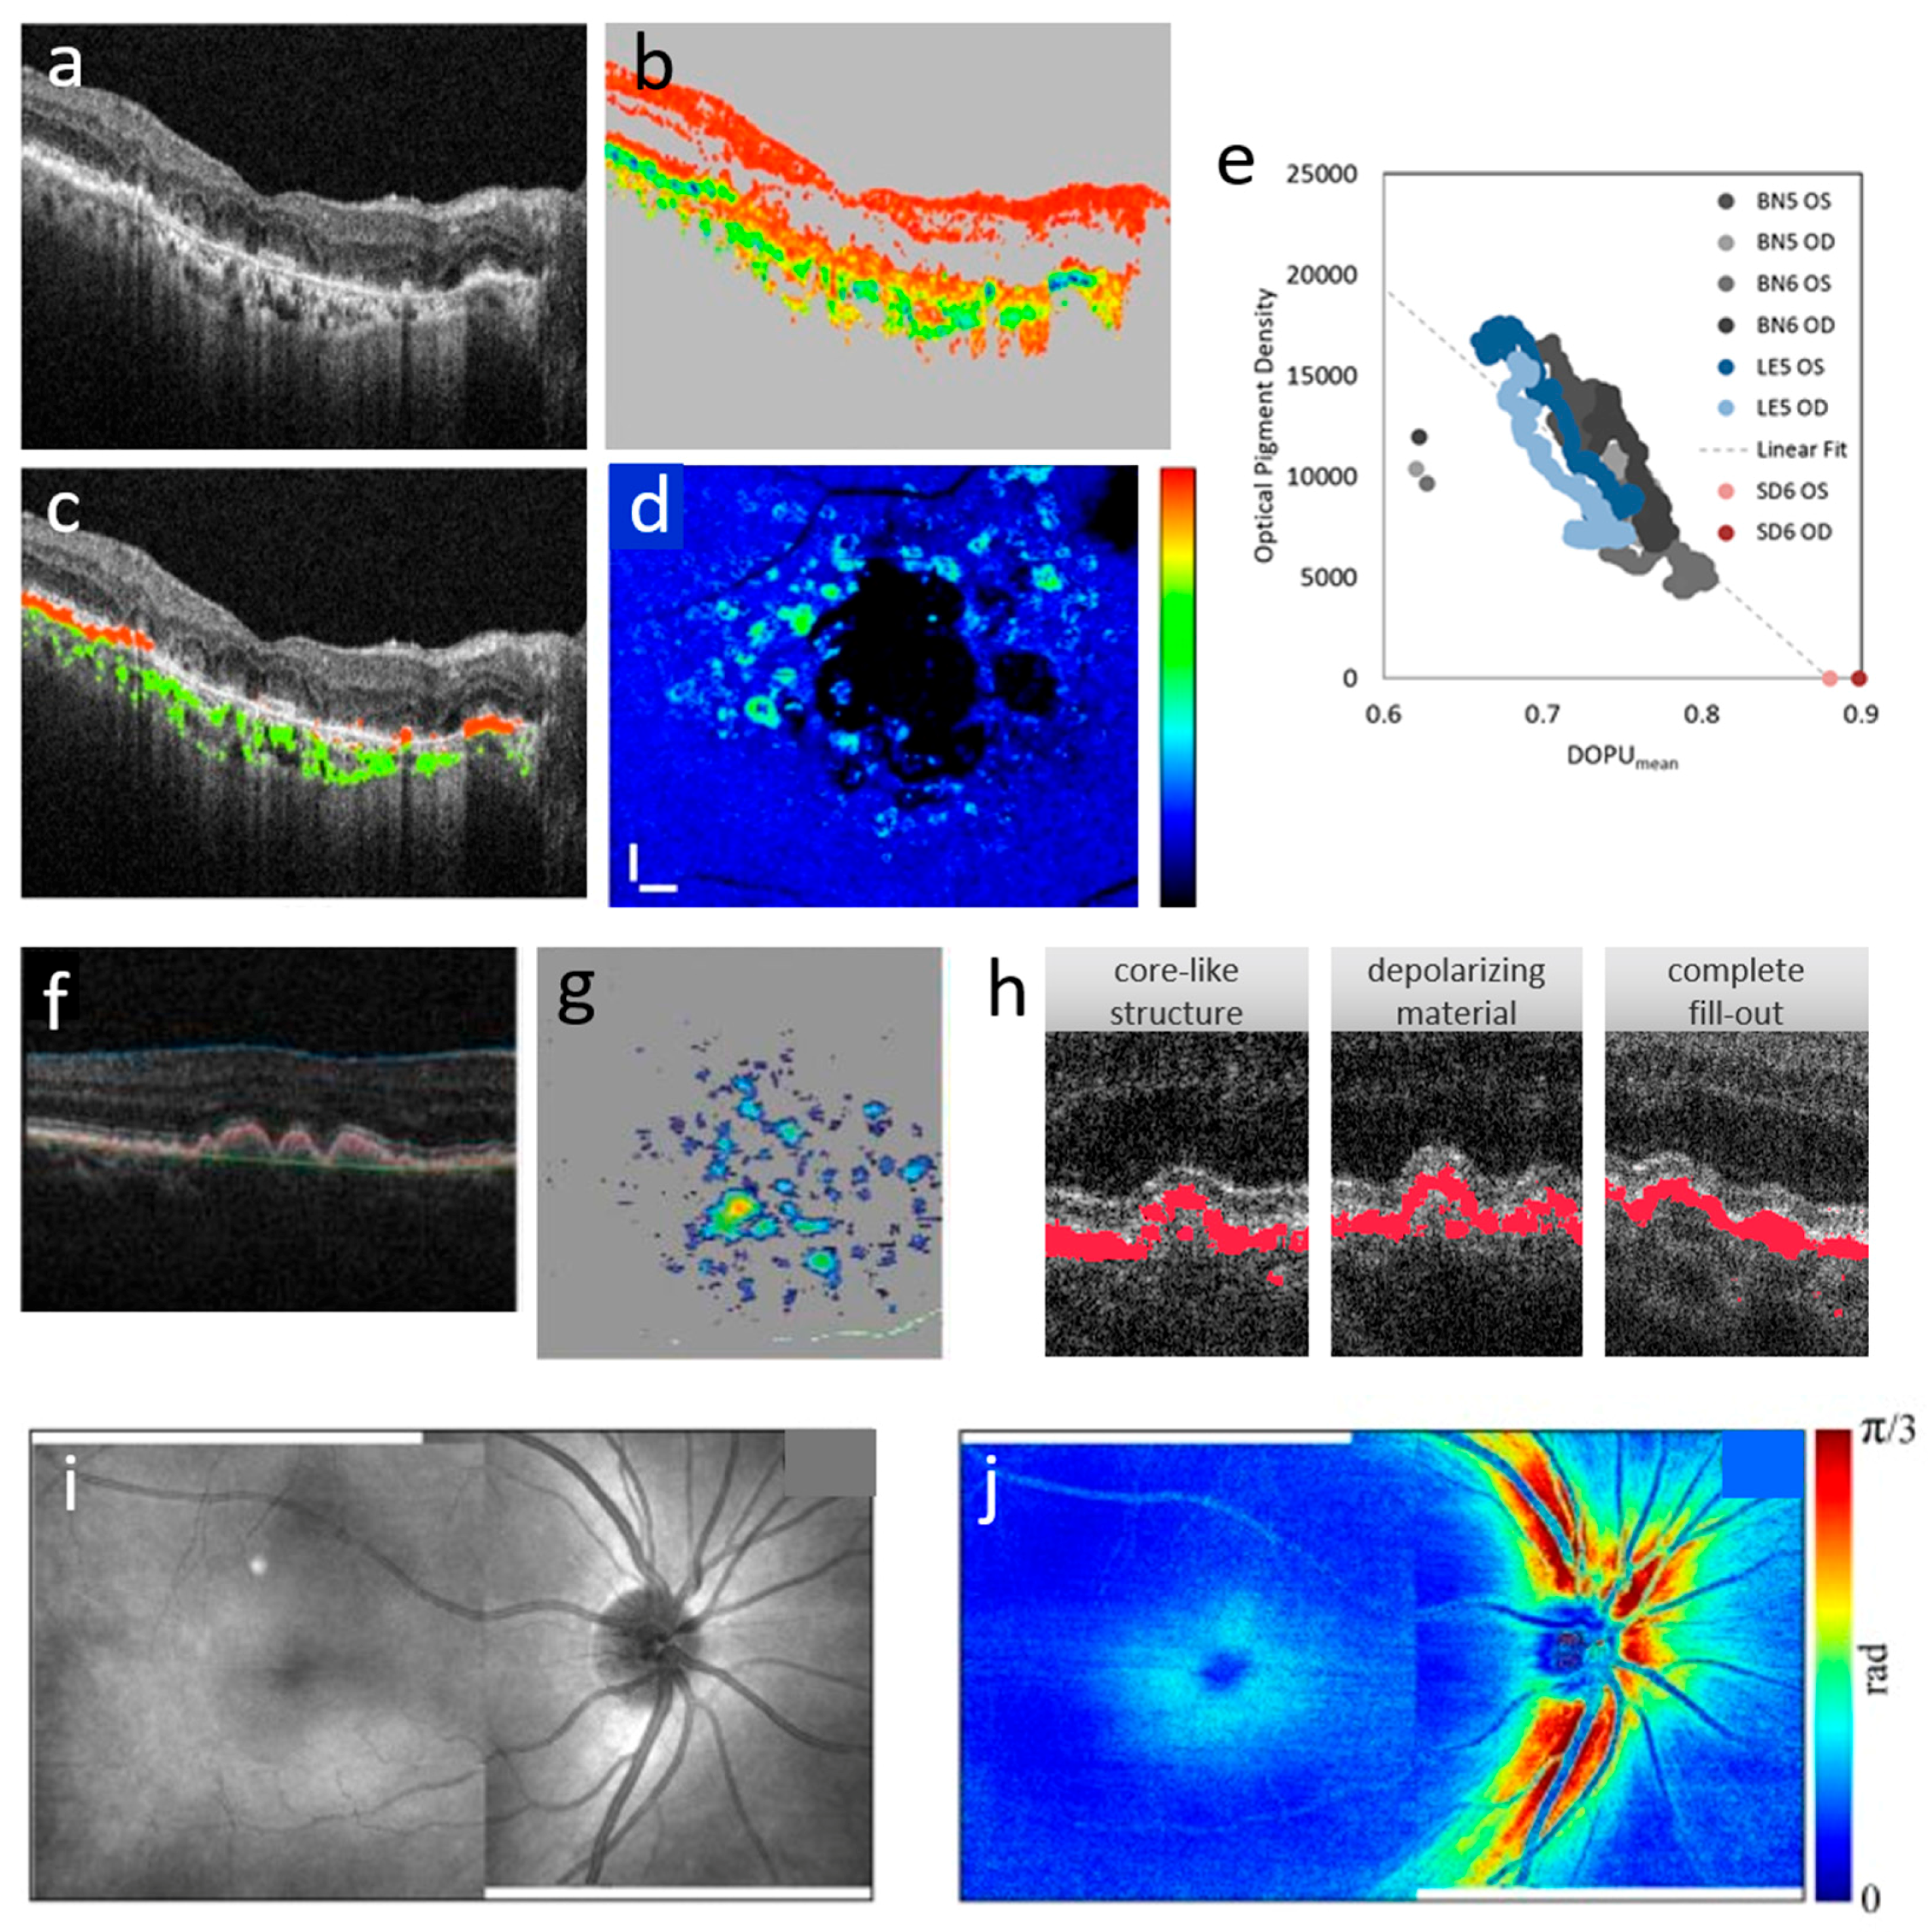
PS-OCT images of the human retina exhibit strong depolarization in pigmented structures such as the RPE [150,151]. In the RPE, this depolarization is most pronounced around the fovea [152] and correlates with the pigmentation status, i.e., it is reduced or even absent in albino patients [25,153]. Comparative measurements of PS-OCT and histology in rat eyes have revealed a correlation between DOPU and the density of melanin pigments in the RPE and choroid (Figure 5e) [26]. Depolarization has proven a particularly useful contrast for the assessment of the RPE in clinical cases, where it is often hard to distinguish ocular structures in pathological eyes [20,103,154,155]. Based on DOPU images, algorithms were developed to assess areas and volumes of lesions quantitatively [121]. In age-related macular degeneration (AMD), PS-OCT was not only used to distinguish drusen characteristics but also to quantify the area and volume of drusen during disease progression (Figure 5f–h) [122,124,156]. In late stage non-exudative (dry) AMD, PS-OCT enables the assessment of atrophic areas lacking RPE (Figure 5a–d) [121,157,158]. In exudative diseases such as wet AMD, central serous chorioretinopathy, and diabetic macular edema, PS-OCT was demonstrated for imaging and identifying fibrotic scars, hard exudates, as well as pigment epithelial features [123,159,160,161,162]. Finally, PS-OCT also proved useful to enhance contrast for imaging pathologic structures in less common retinal diseases such as macular telangiectasia and Stargardt disease [163,164].
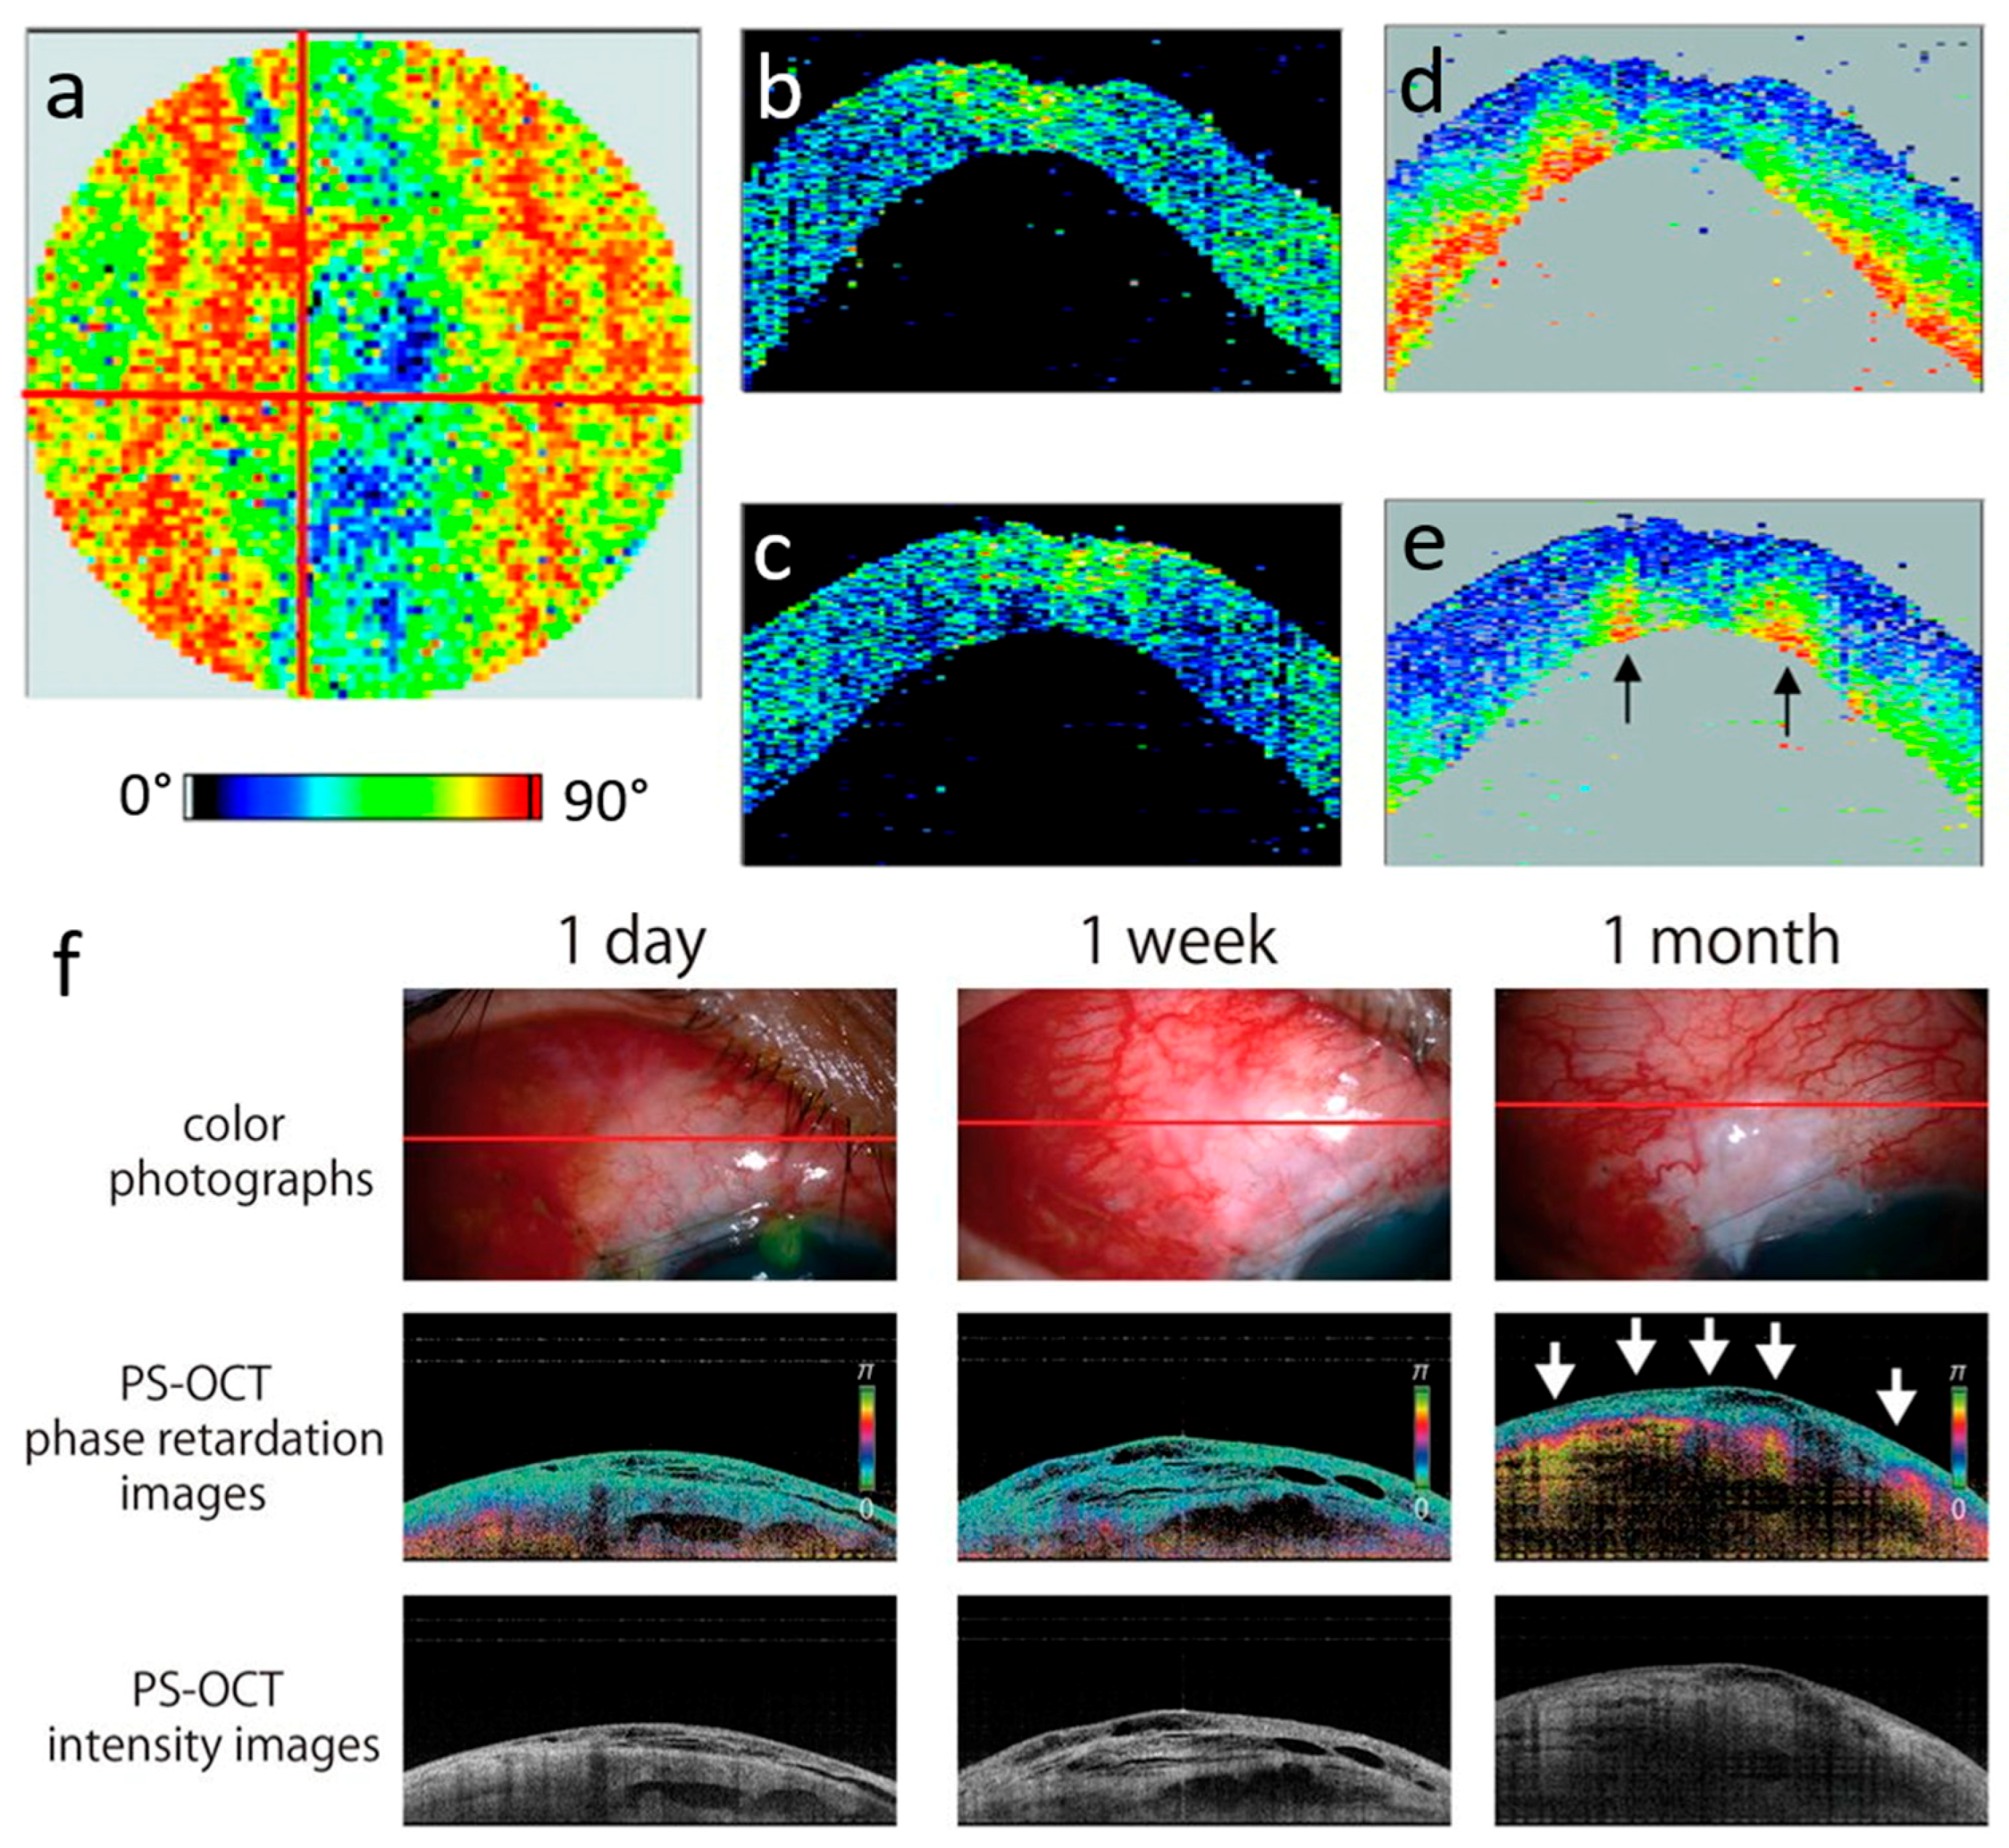
PS-OCT of the anterior eye markedly improves the contrast for birefringent, collagenous tissues such as the cornea, sclera, and tendons as well as for the trabecular meshwork [40,84,94,127]. The additional contrast has been exploited for automated, feature-based tissue discrimination [126]. Substantial changes in the birefringent appearance of the cornea can be observed in keratoconus as shown in Figure 6a–e, such that PS-OCT was proposed as a diagnostic method for this disease [128,165]. Since corneal birefringence depends on the microstructure, PS-OCT was also proposed for imaging changes during corneal crosslinking therapy [166]. After trabeculectomy, which is a surgical procedure for glaucoma treatment, the evolution of filtering blebs was monitored by PS-OCT (Figure 6f) [167,168,169]. In the sclera, PS-OCT was used to image necrotizing scleritis [170] and to study birefringence changes related to increased intraocular pressure [148,171].
3.2. PS-OCT in Skin and Oropharyngeal Tissue
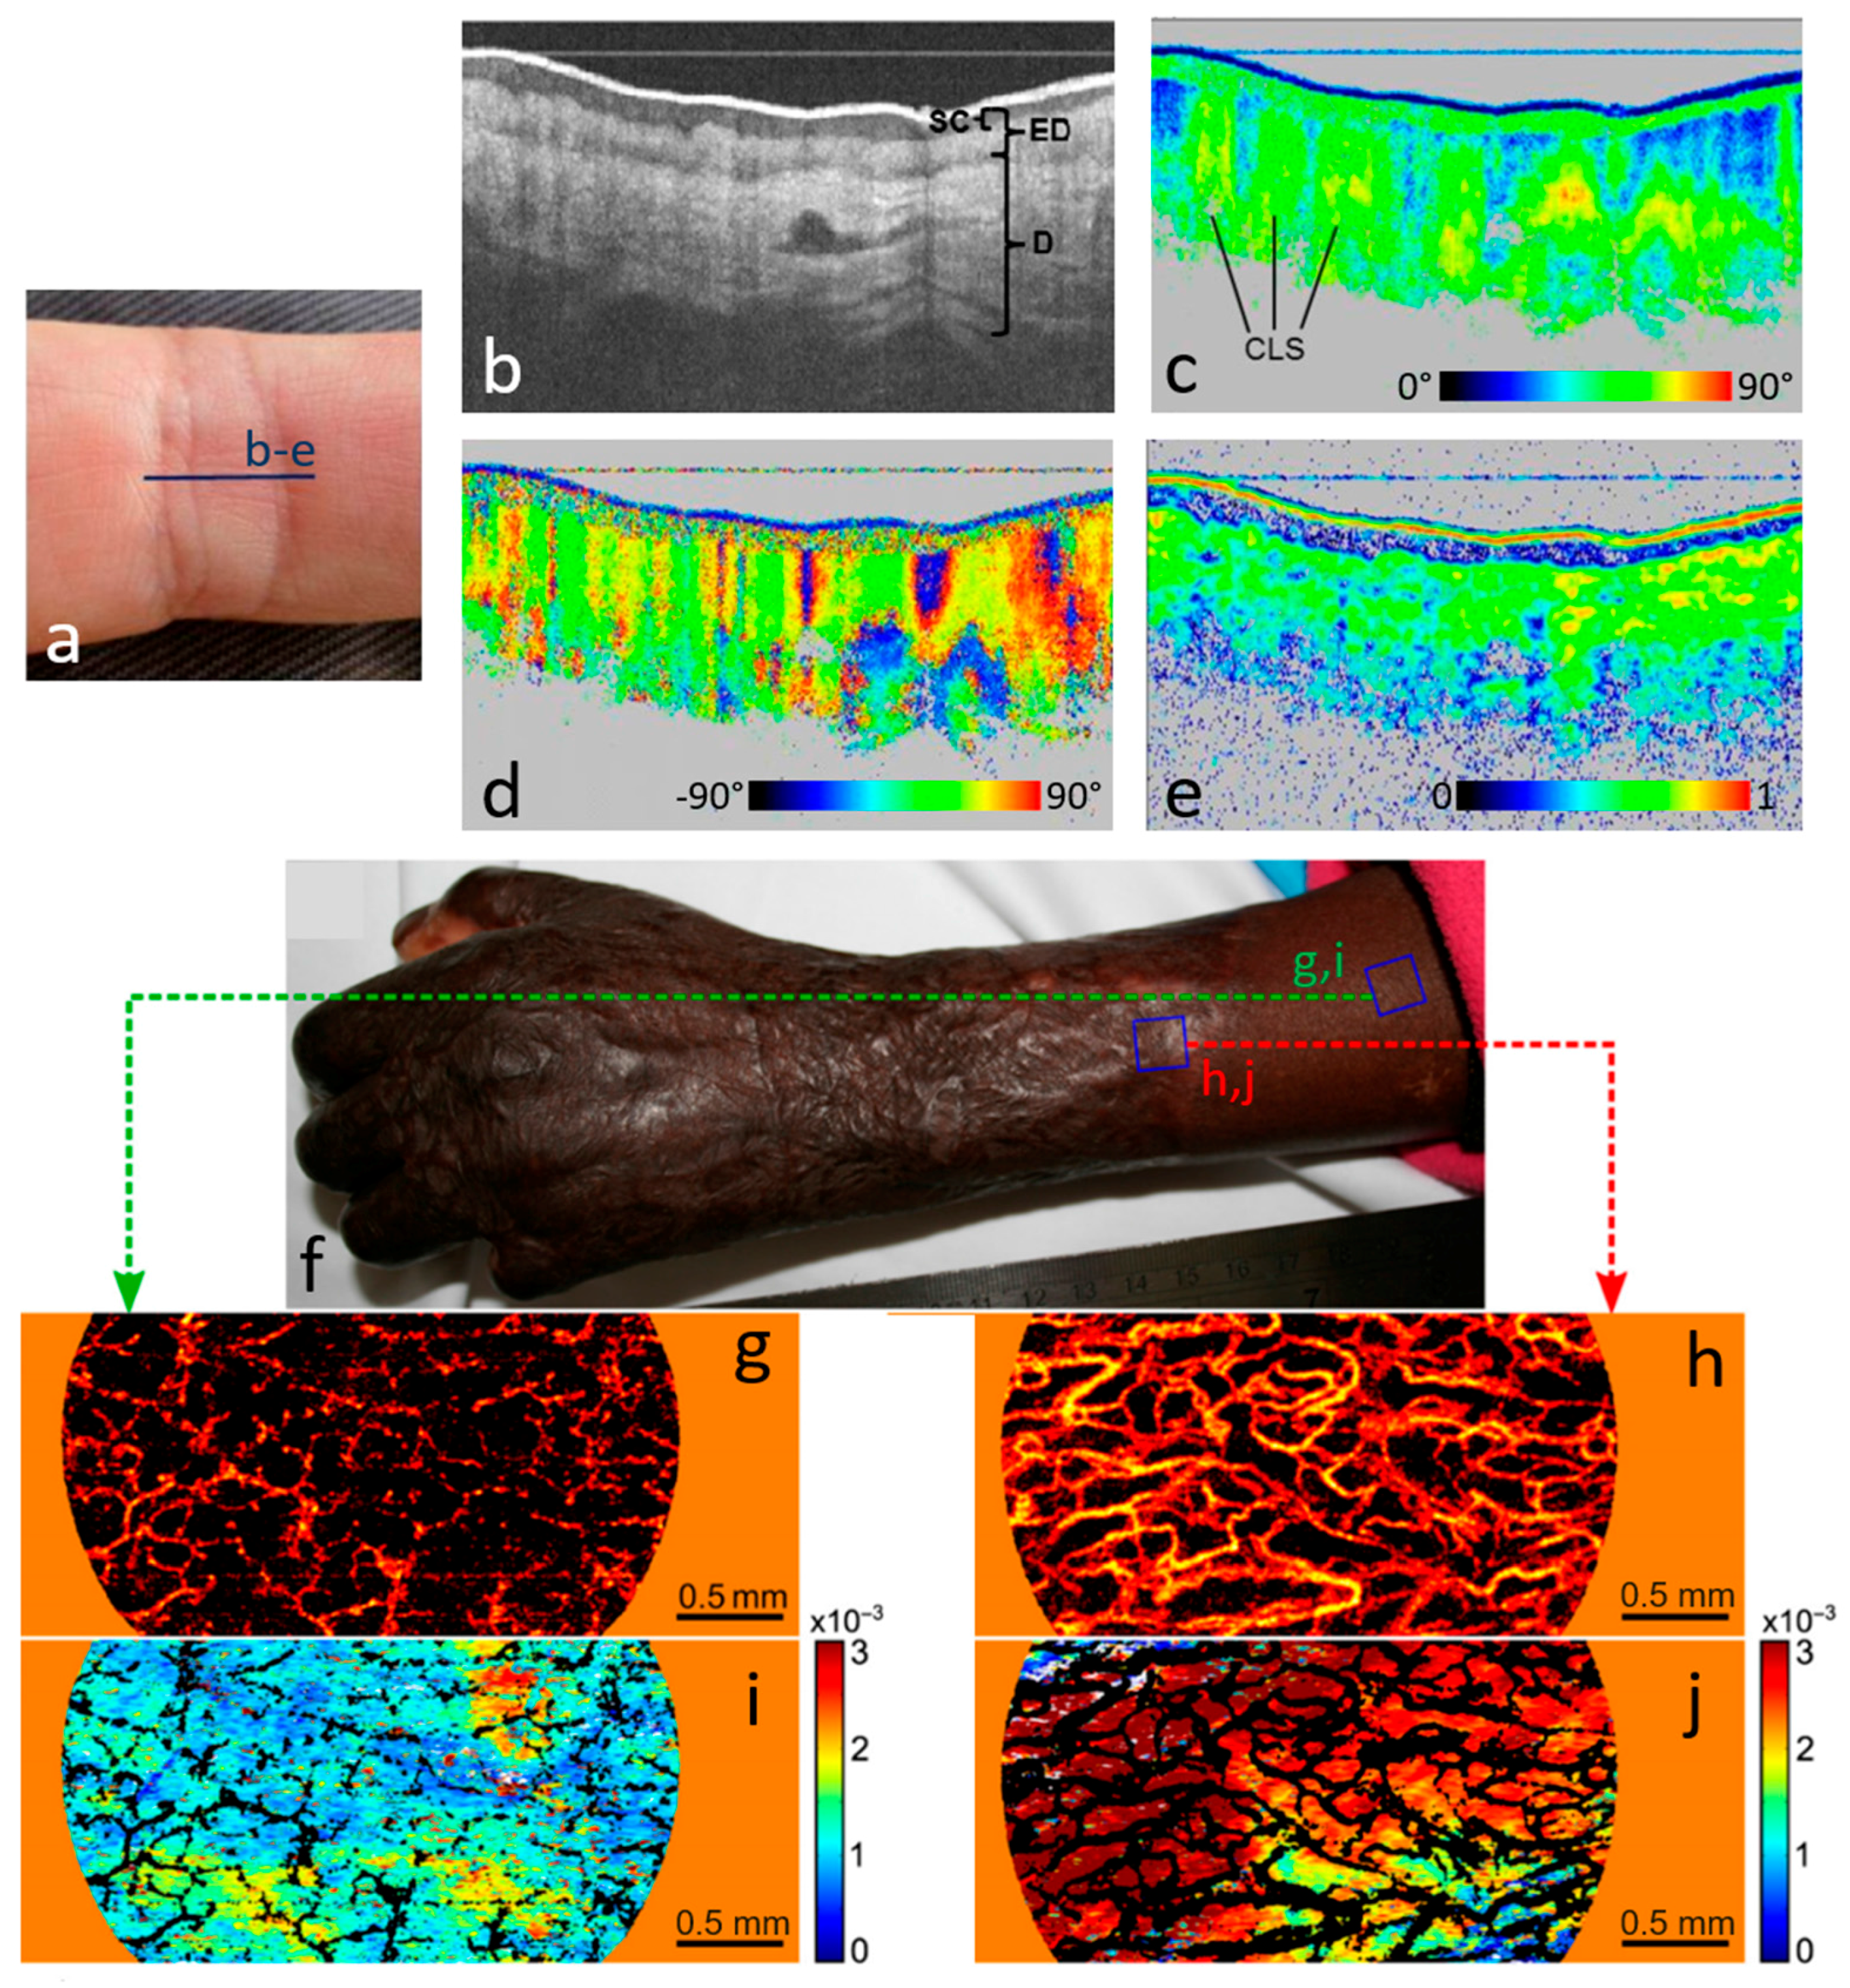
Since the imaging regime of OCT is usually restricted to superficial layers of scattering structures (unless special probes such as catheters are used), skin is a preferred candidate for OCT imaging. Using PS-OCT, dermal layers with different scattering and polarization properties can be observed, including stratum corneum, dermis, and epidermis (Figure 7) [50,64,172,173]. Oral and laryngeal tissue have also been imaged by PS-OCT. In the oropharyngeal tract, PS-OCT was demonstrated for investigating the mucosa of the vocal fold and for detecting lesions in the buccal mucosa based on increased birefringence [174,175].
Via dermal birefringence, PS-OCT provides access to tissue alterations caused by deformation, scarring, and burns [106,177,178,179]. Figure 7j shows an example of scarred skin exhibiting significantly higher birefringence than normal skin (Figure 7i). Additionally, wound healing processes including collagen restoration can be followed with PS-OCT [180,181]. Moreover, Stokes vector based depolarization imaging can reveal multiple scattering as well as pathological conditions in skin such as cancer [19,24,58], as will be discussed in the next section.
3.3. PS-OCT in Cancerous Tissue
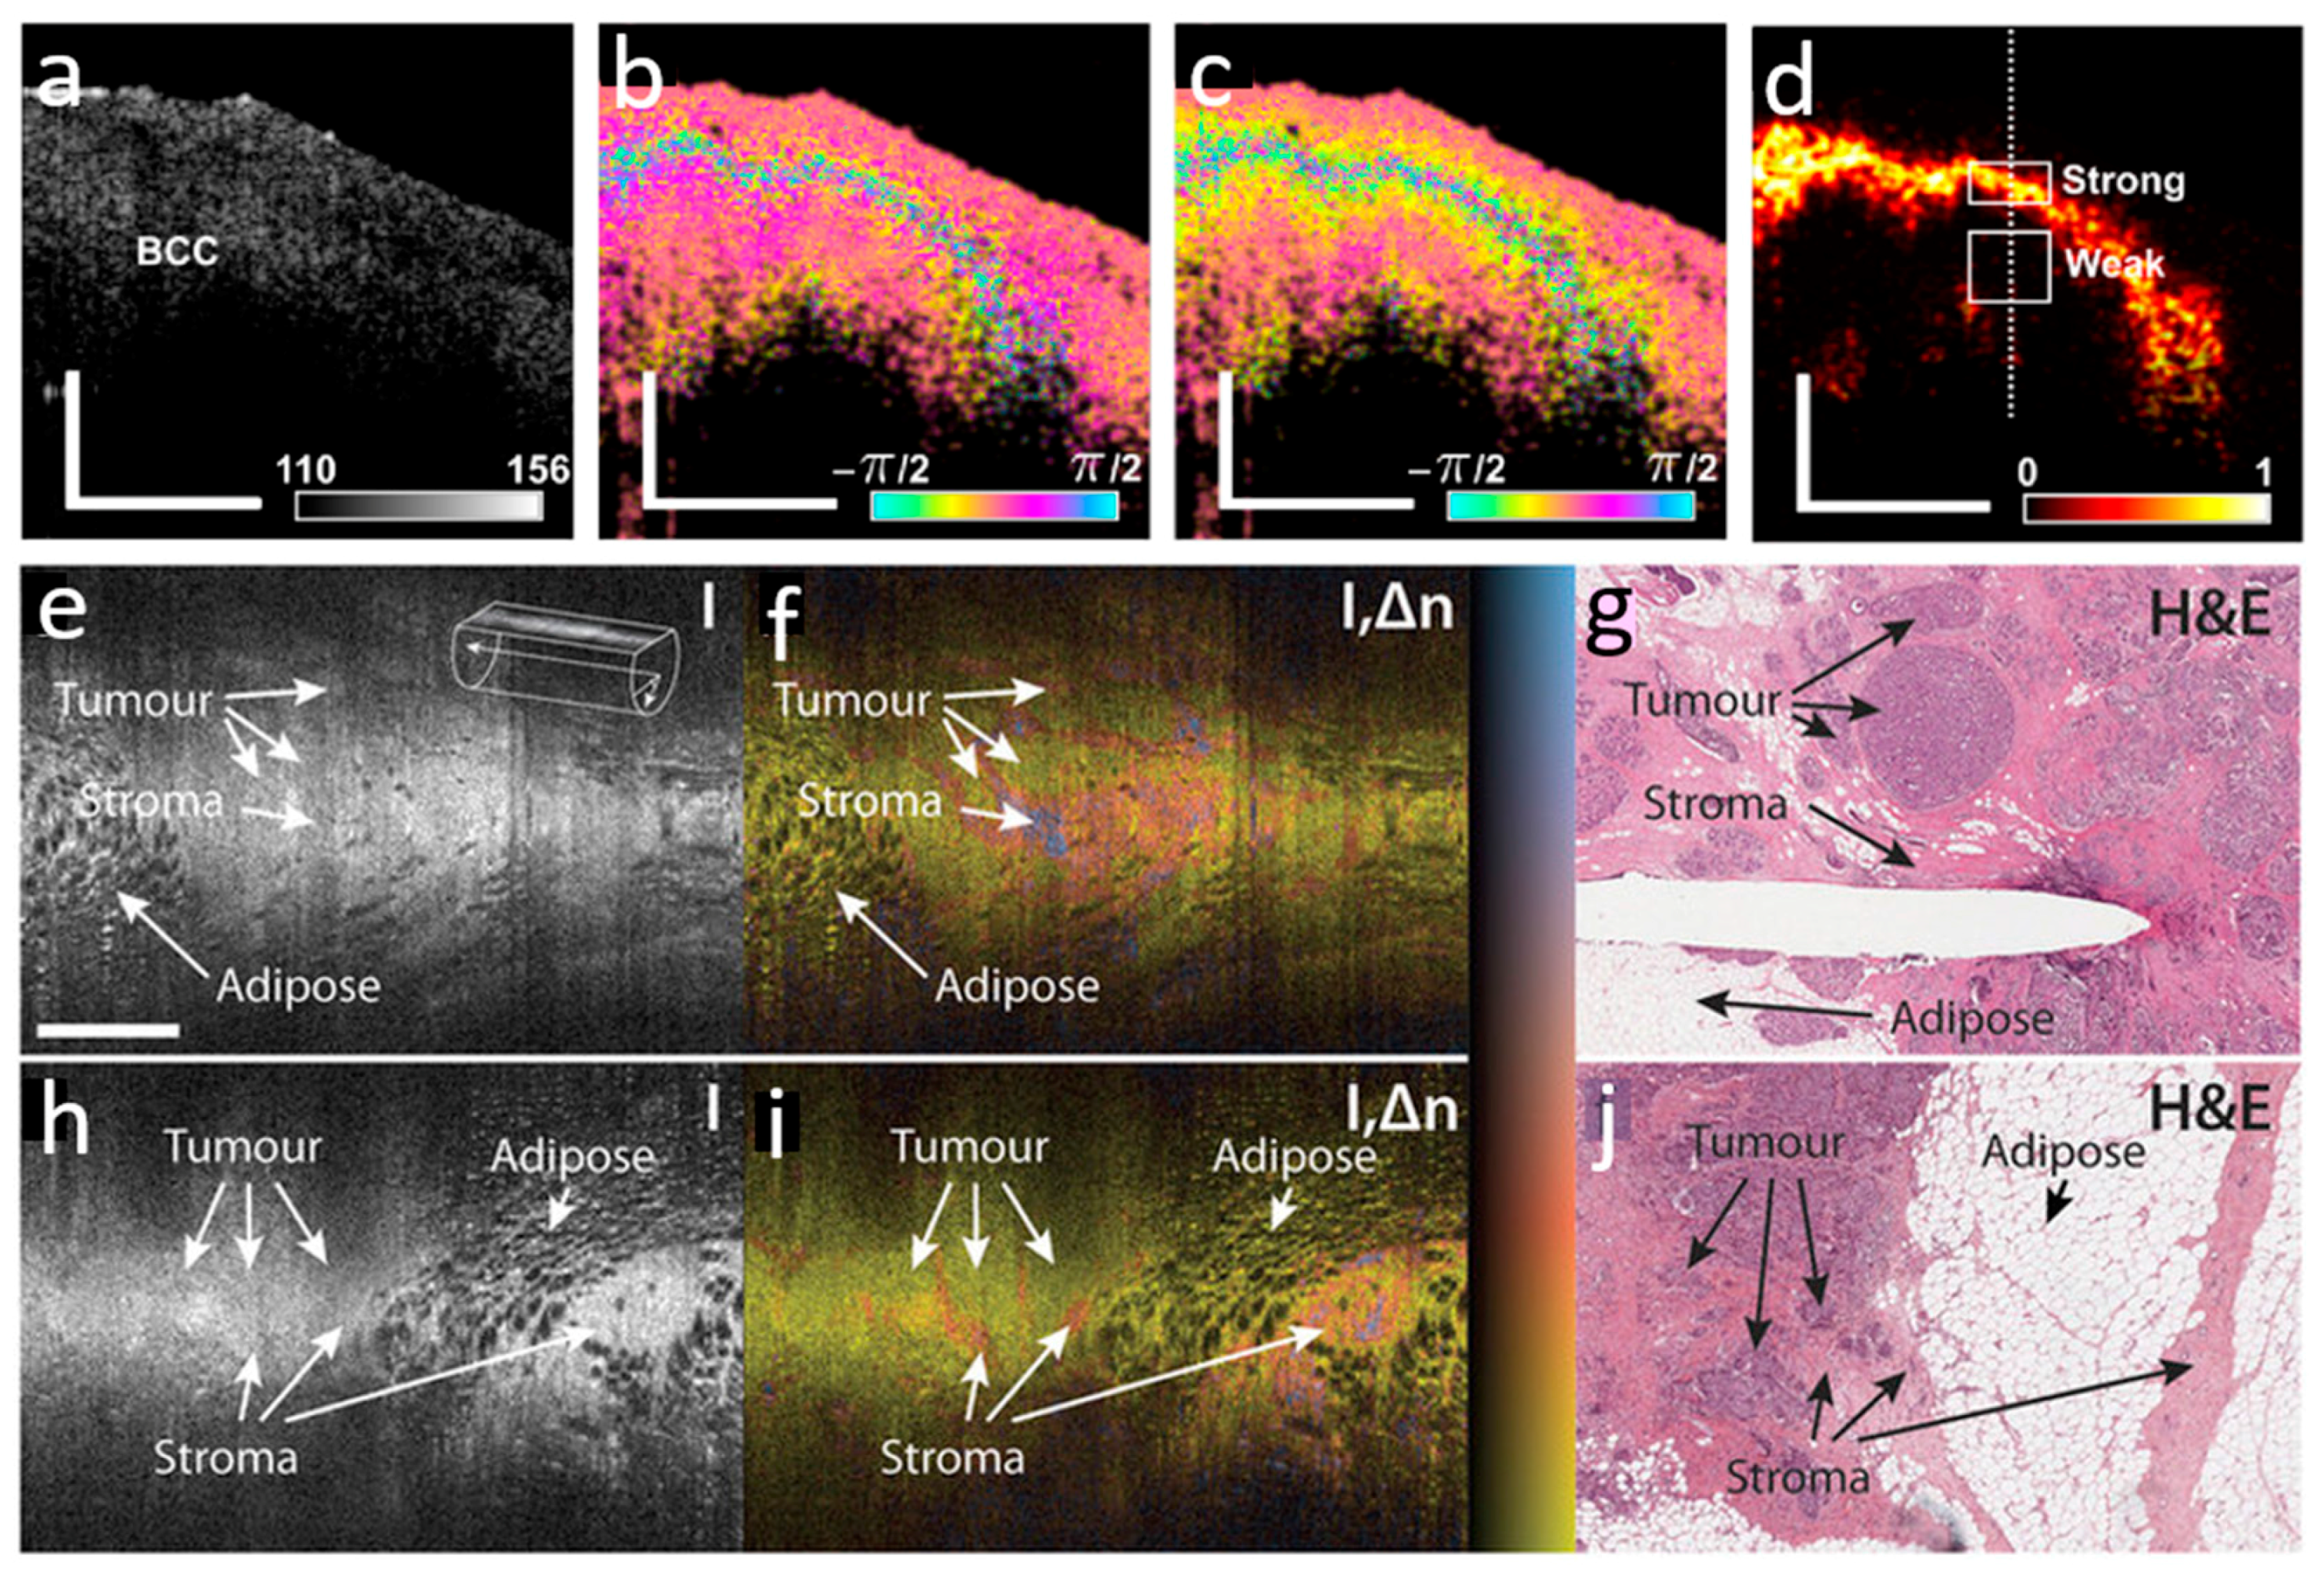
Cancer alters tissue microstructure. This alteration can change the optical properties of affected tissues. PS-OCT has been applied for imaging cancerous tissues in several organs. Altered birefringence and depolarization characteristics enabled imaging and identification of skin lesions such as basal cell carcinoma (Figure 8a–d) [24,182,183].
Further promising results of PS-OCT based cancer imaging were reported in larynx, ovaries, and bladder [32,184,185]. Several groups also successfully studied PS-OCT for imaging breast cancer [112,186,187]. Figure 8 shows exciting results of PS-OCT imaging, which enabled the differentiation of tumor from surrounding tissue. Using intraoperative scanning of excised tissue or in situ needle-based imaging (cf. Figure 8e–j), PS-OCT could represent a promising method for reliably demarking malignant breast tumors, thus reducing the re-excision rate due to positive margins.
3.4. PS-OCT in Muscles, Tendons, Cartilage, and Bone
Tendon was the first biological tissue imaged by PS-OCT [8]. Being collagen-rich structures, tendons and muscles exhibit strong birefringence, which enables an easy discrimination from surrounding supportive tissue by PS-OCT.
Since the integrity of collagen is an indicator for structural stability and pathologic state, PS-OCT was suggested for collagen assessment in tendons and ligaments [189]. Consequently, PS-OCT was used to visualize the evolution of the collagen fiber alignment via birefringence in tissue-engineered tendons in response to varying growth environments and to investigate degenerative changes related to rupture in Achilles tendons [190,191]. Lately, the influence of proteoglycans—which are essential components of the tendon extracellular matrix associated with tendinopathies—on the optical properties of tendons have been studied by PS-OCT [192]. In skeletal muscle of genetically-altered (mdx) mice, exercise-induced ultrastructural changes were detected by PS-OCT in in vivo animals [193]. Compared to wildtype controls, the highly birefringent properties of skeletal muscles markedly decreased in mdx mice, thus suggesting a relationship between the degree of birefringence detected using PS-OCT and the sarcomeric ultrastructure present within skeletal muscle. PS-OCT was also shown to be capable of detecting muscle necrosis in dystrophic mdx mice [194].
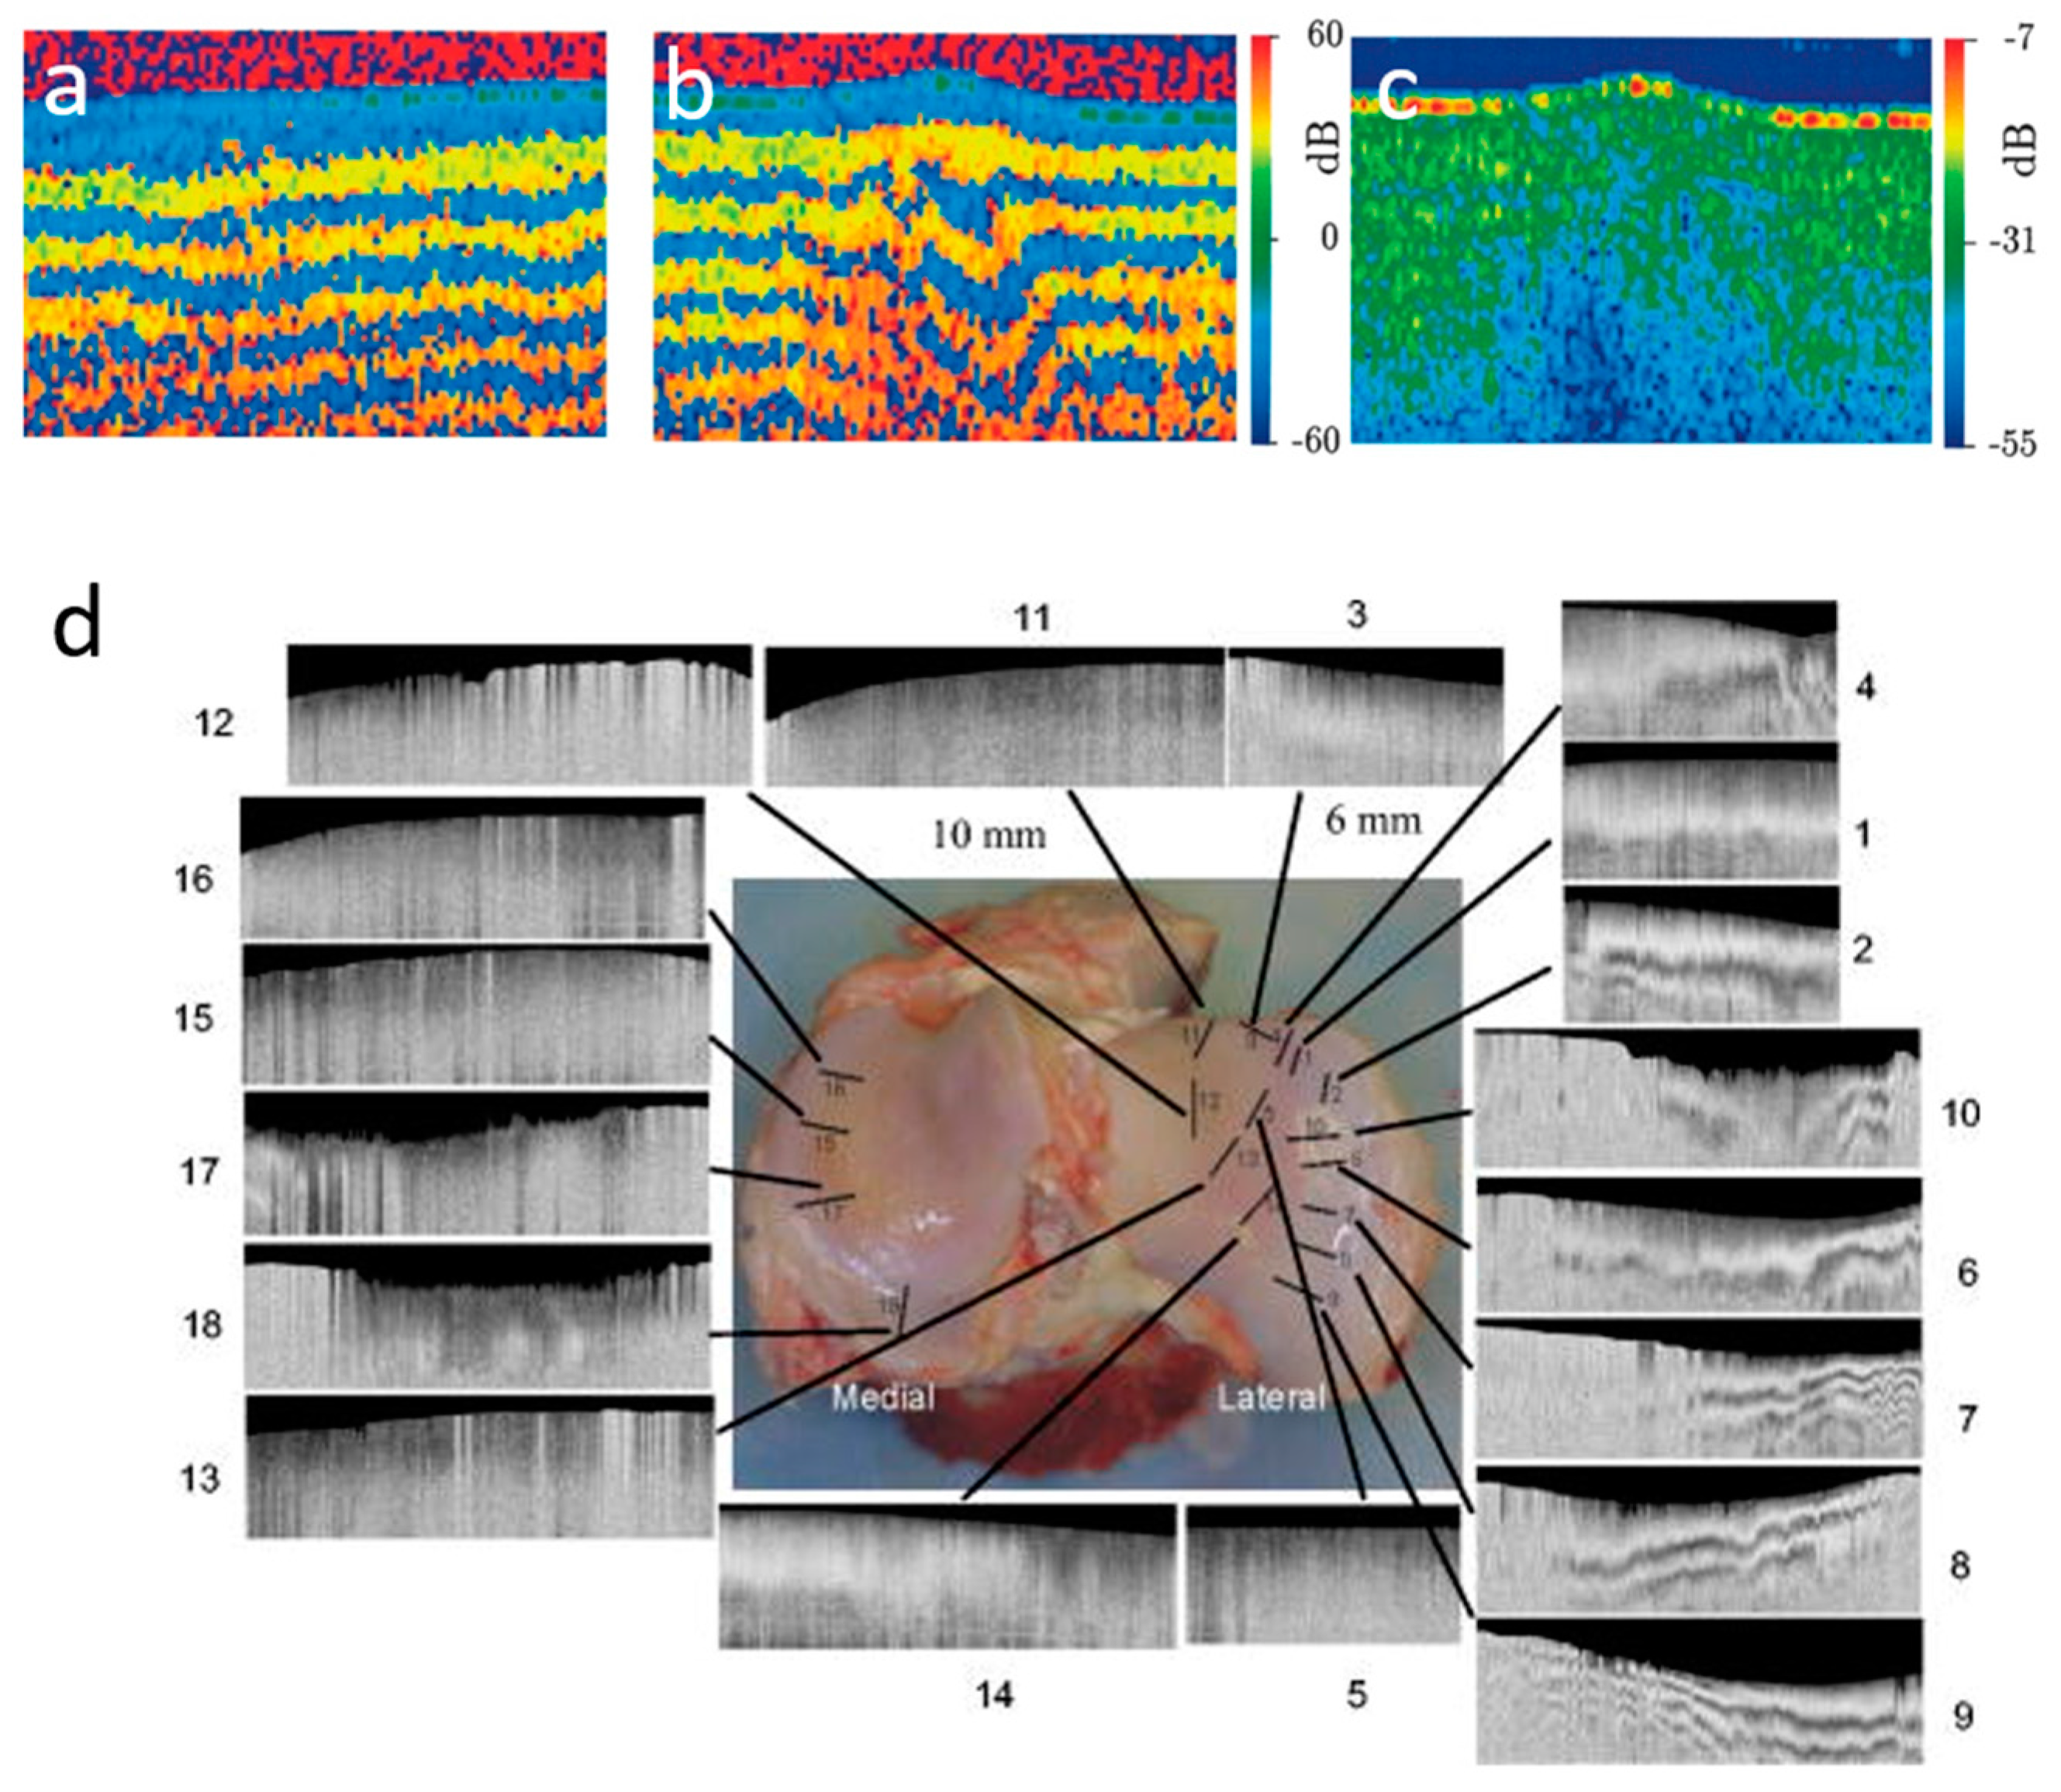
In cartilage, PS-OCT can detect areas of enhanced or reduced birefringence in hyaline cartilage (mostly composed of type-II collagen) and fibrocartilage (predominantly type-I collagen) related to degeneration and repair mechanisms [195]. In an in vivo study on human knee joints prior to partial or total joint replacement treatment, reduced birefringence was found in degenerated cartilage [196]. PS-OCT images of one proximal joint surface of bovine tibia are shown in Figure 9d [188]. PS-OCT using variable incidence angles was further used to investigate the 3D architecture of the collagen fiber network in cartilage [197,198]. Due to its high sensitivity to cartilage disorder, PS-OCT proved a promising tool for imaging cartilage in osteoarthritis in both humans and animal models [199,200].
3.5. PS-OCT in Vessels and Cardiac Tissue
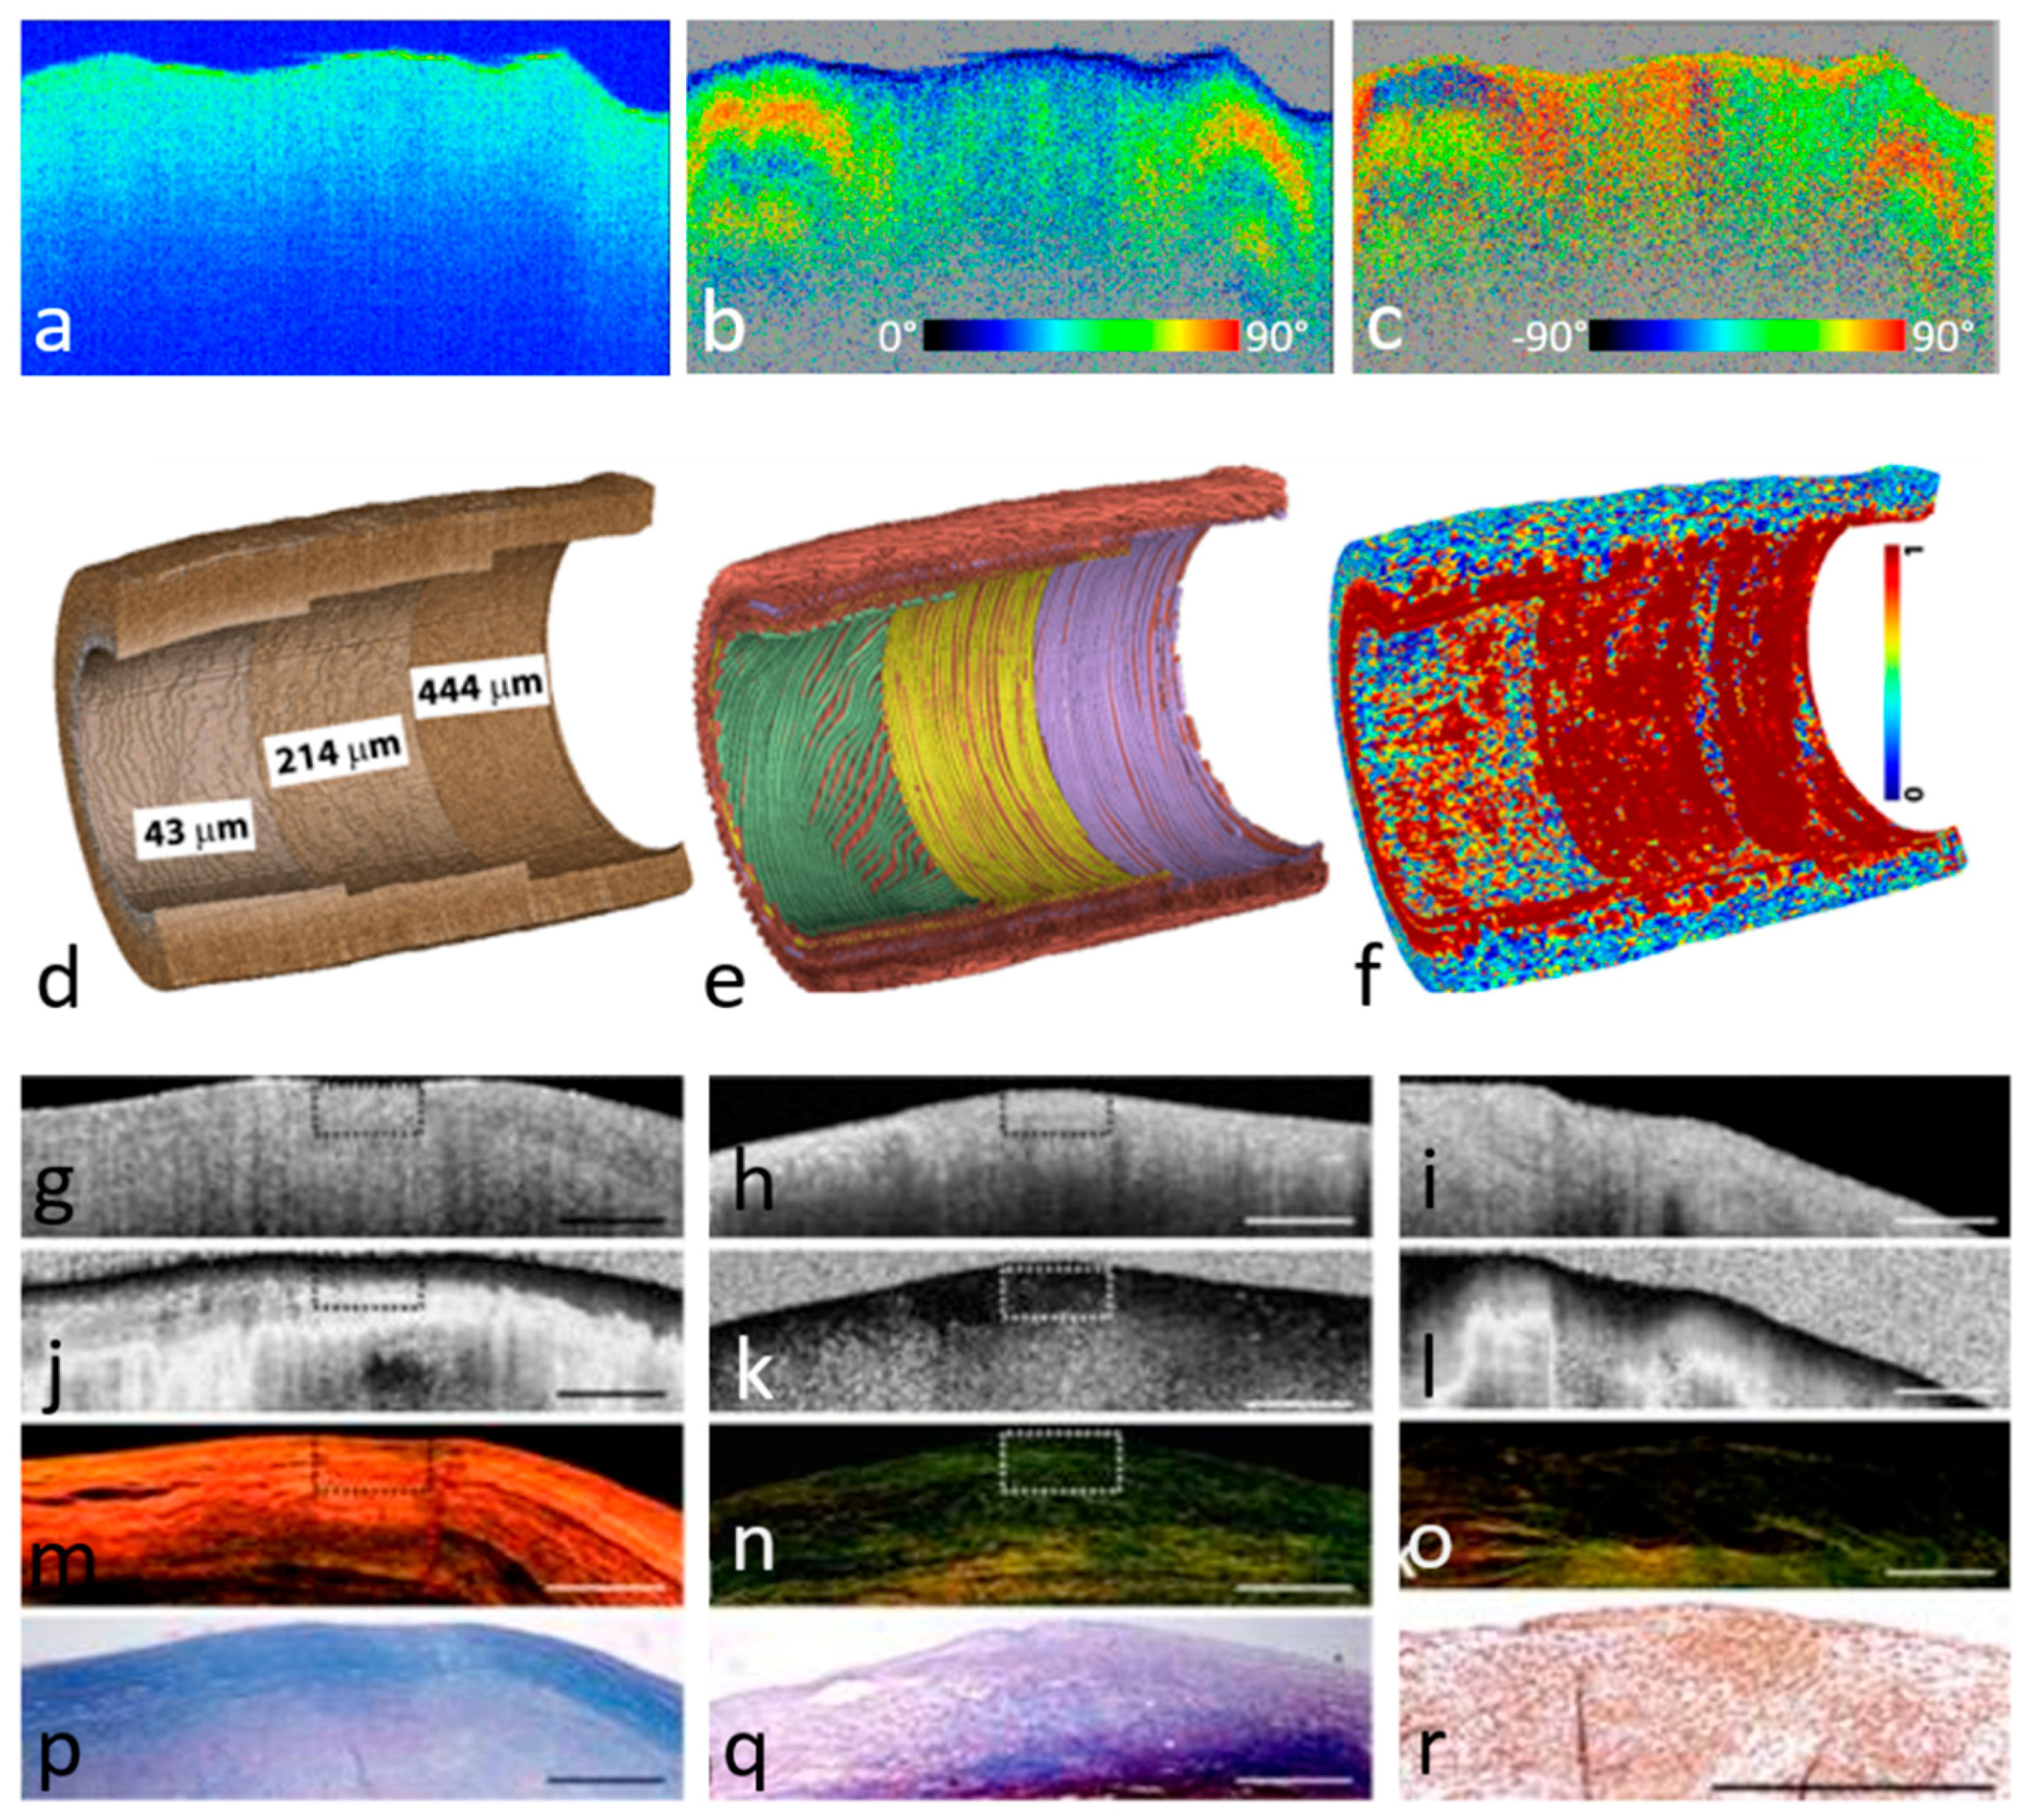
Birefringence of vessel walls is a promising diagnostic parameter for arteriosclerotic vascular disease accessible by PS-OCT [201]. In atherosclerosis, artery walls locally thicken and may form atherosclerotic plaque lesions, which may be categorized into stable and unstable (called vulnerable) plaques. Ex vivo scanning compared to histology as well as catheter based PS-OCT imaging of atherosclerotic artery walls have revealed altered birefringence patterns in atherosclerotic plaques [202,203,204]. Examples of different plaques imaged by PS-OCT as well as corresponding histologic images are shown in Figure 10 [205].
Information on the birefringent axis orientation provides access to fiber alignment in fibrous tissue (Figure 10a–c) [14]. Tractographic PS-OCT imaging was performed in the walls of blood vessels (Figure 10d–f) and in the mouse heart, thereby revealing fibrous layers with varying fiber orientations [69,70]. In rabbit hearts, the geometry of the perfusion border zone was investigated using PS-OCT and tissue clearing [206], and tissue discrimination was enabled by PS-OCT in rat hearts where decreased birefringence was observed in infarcted hearts [207].
3.6. PS-OCT in Teeth
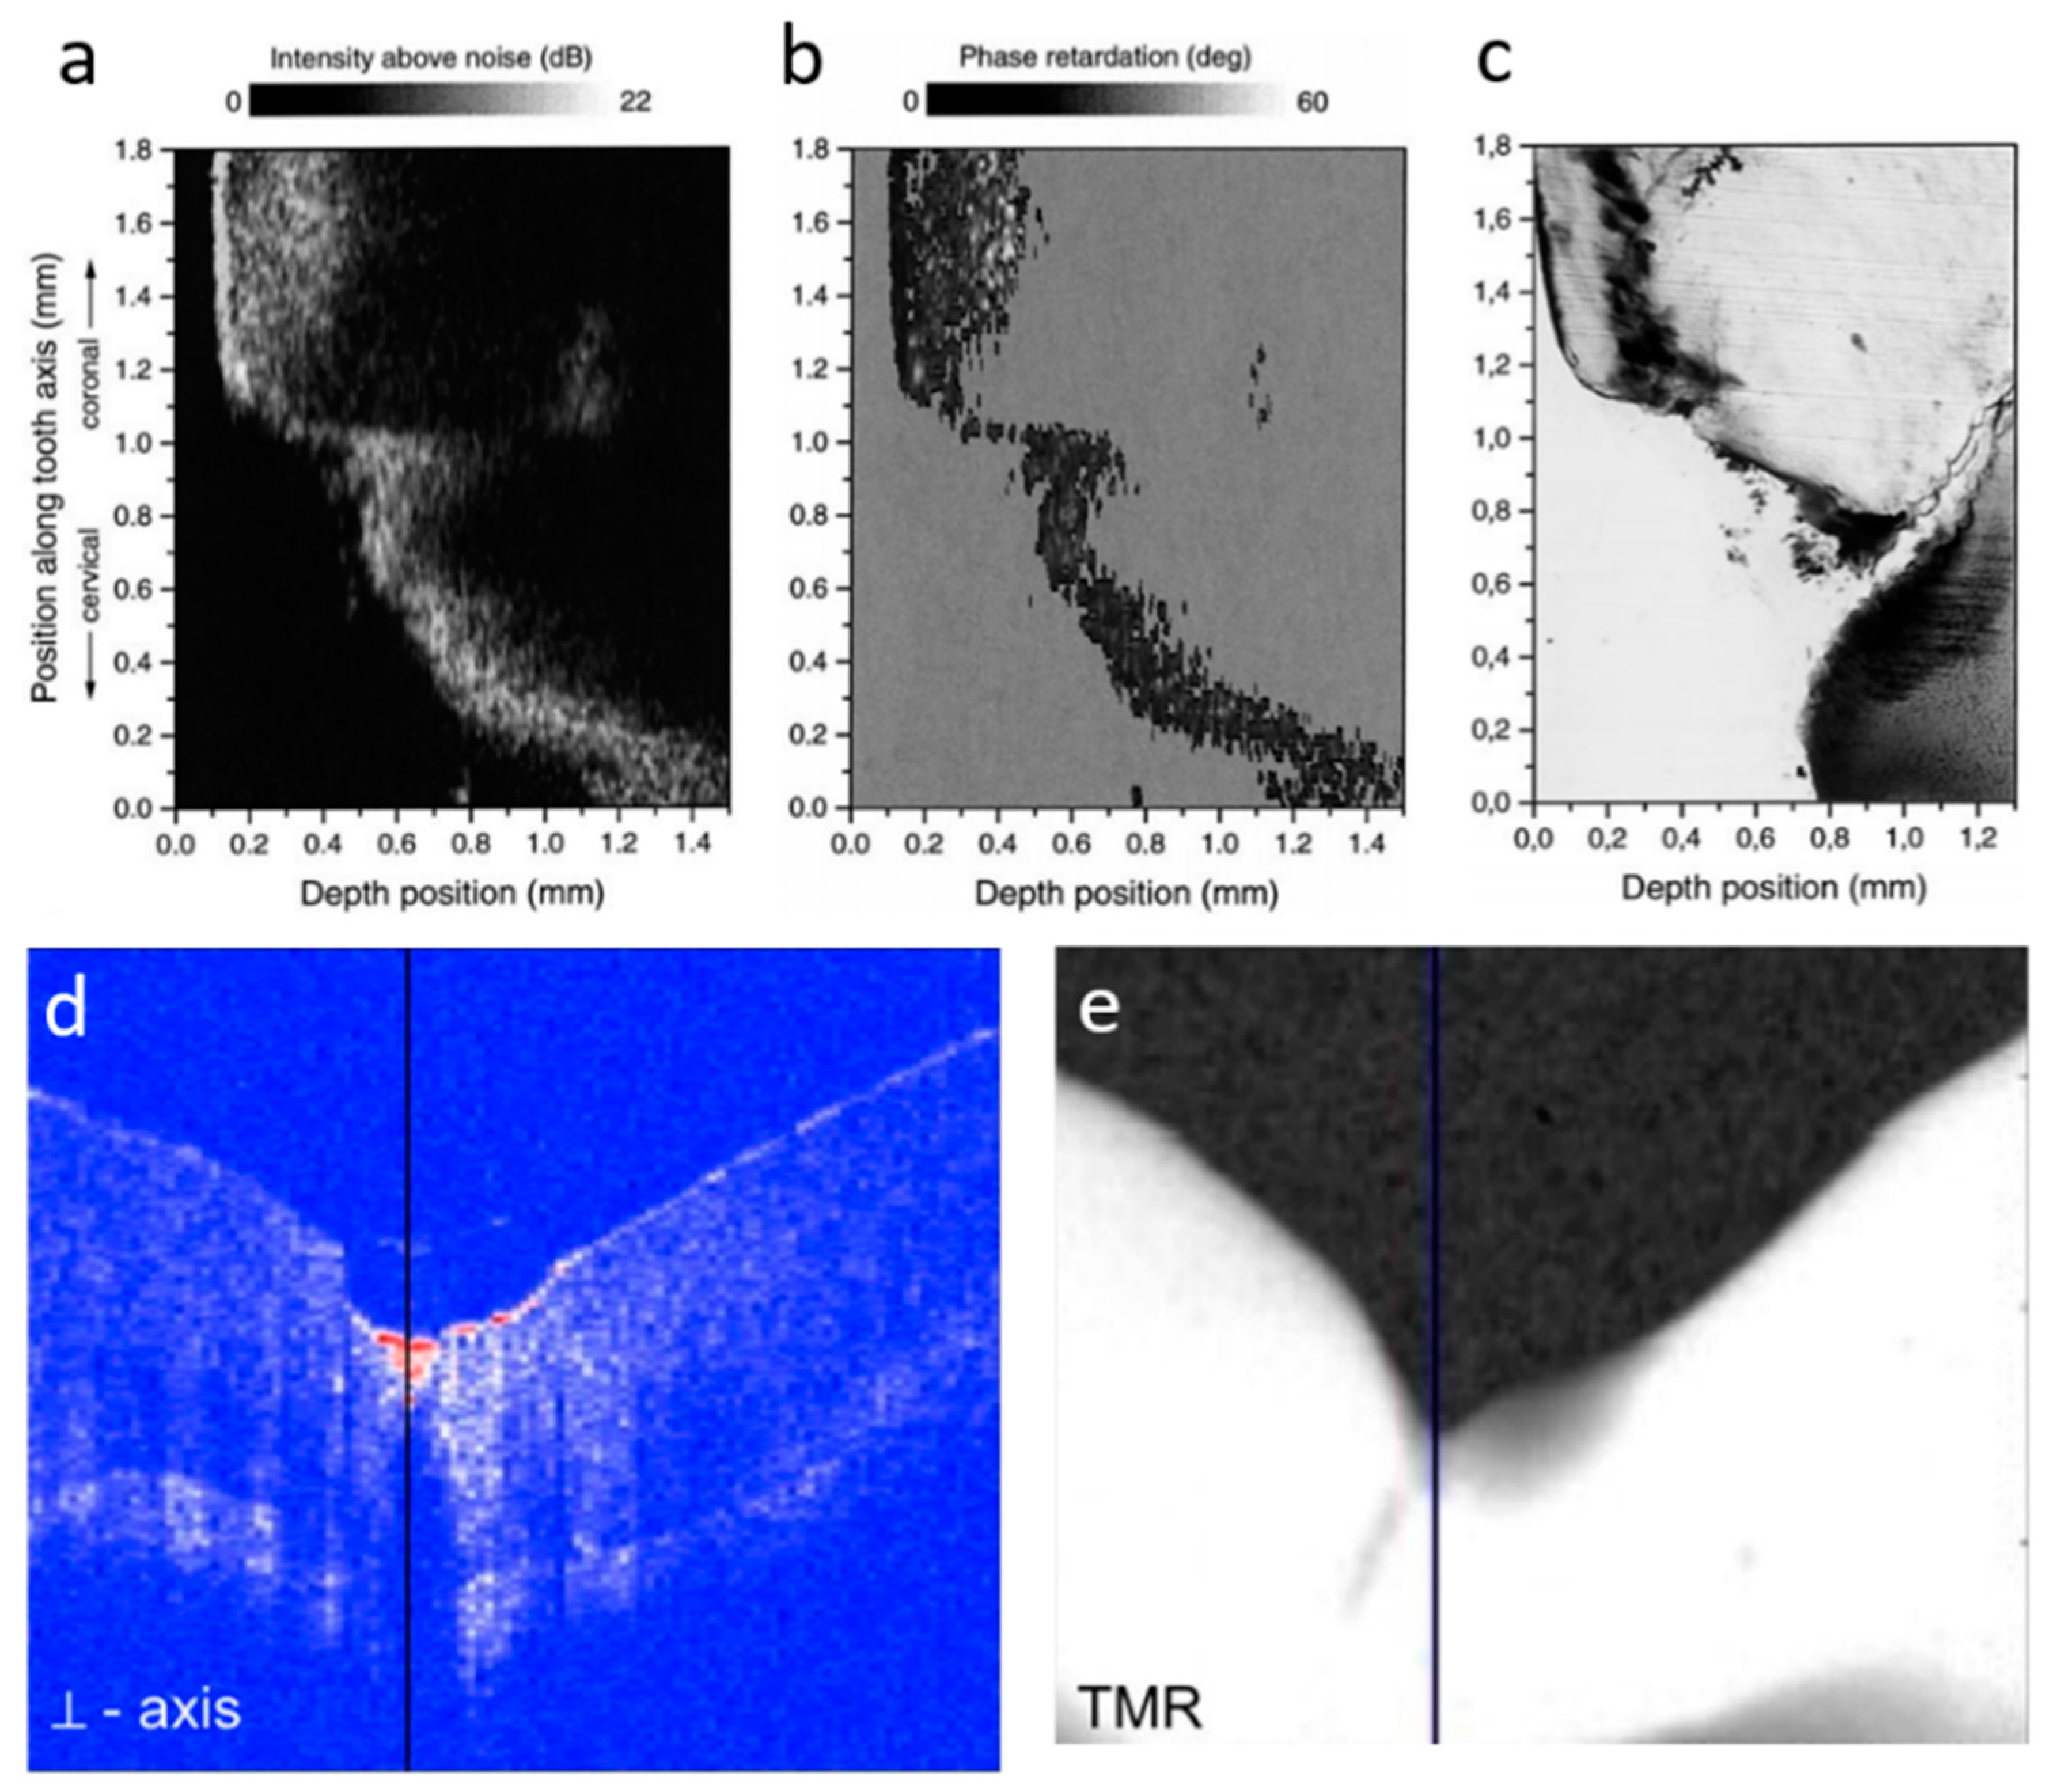
PS-OCT has been used for imaging dental structures for almost 20 years [208,209,210]. In teeth, PS-OCT provides contrast for dentin, enamel, as well as carious lesions. Dentin is a calcified tissue and is a central component of teeth. On the crown, it is covered by enamel, a highly mineralized substance. The apatite crystals in dental enamel are highly ordered and produce negative birefringence. In contrast, collagen makes dentin positively birefringent. Processes such as demineralization lead to birefringence changes which can be observed by PS-OCT.
PS-OCT was demonstrated for the assessment of early and advanced demineralization in dentin as well as in enamel (Figure 11d–e) [211,212,213,214]. Ablation of demineralized tooth structures was monitored by PS-OCT [215]. Demineralization was also investigated in tooth roots [216]. PS-OCT of enamel treated by CO2 laser irradiation confirmed inhibited demineralization [217]. In particular, caries—characterized by mineral breakdown of teeth due to bacterial activity—has been an interesting target for PS-OCT imaging. Caries lesions in various conditions were investigated and their progression was followed longitudinally [209,210,218,219,220]. Consequently, also remineralization processes in enamel and dentin were imaged based on their birefringence [211,221]. Recently, an automated method for assessing remineralized lesions was developed based on PS-OCT [222].
3.7. PS-OCT in Nerves and Brain
Nerve fibers exhibit birefringence, an optical property that has been exploited for quantitative measurements in the retinal nerve fiber layer (see Section 3.1). Also nerve fibers in cerebral white matter or in peripheral nerves may be imaged by PS-OCT based on their birefringence [223].
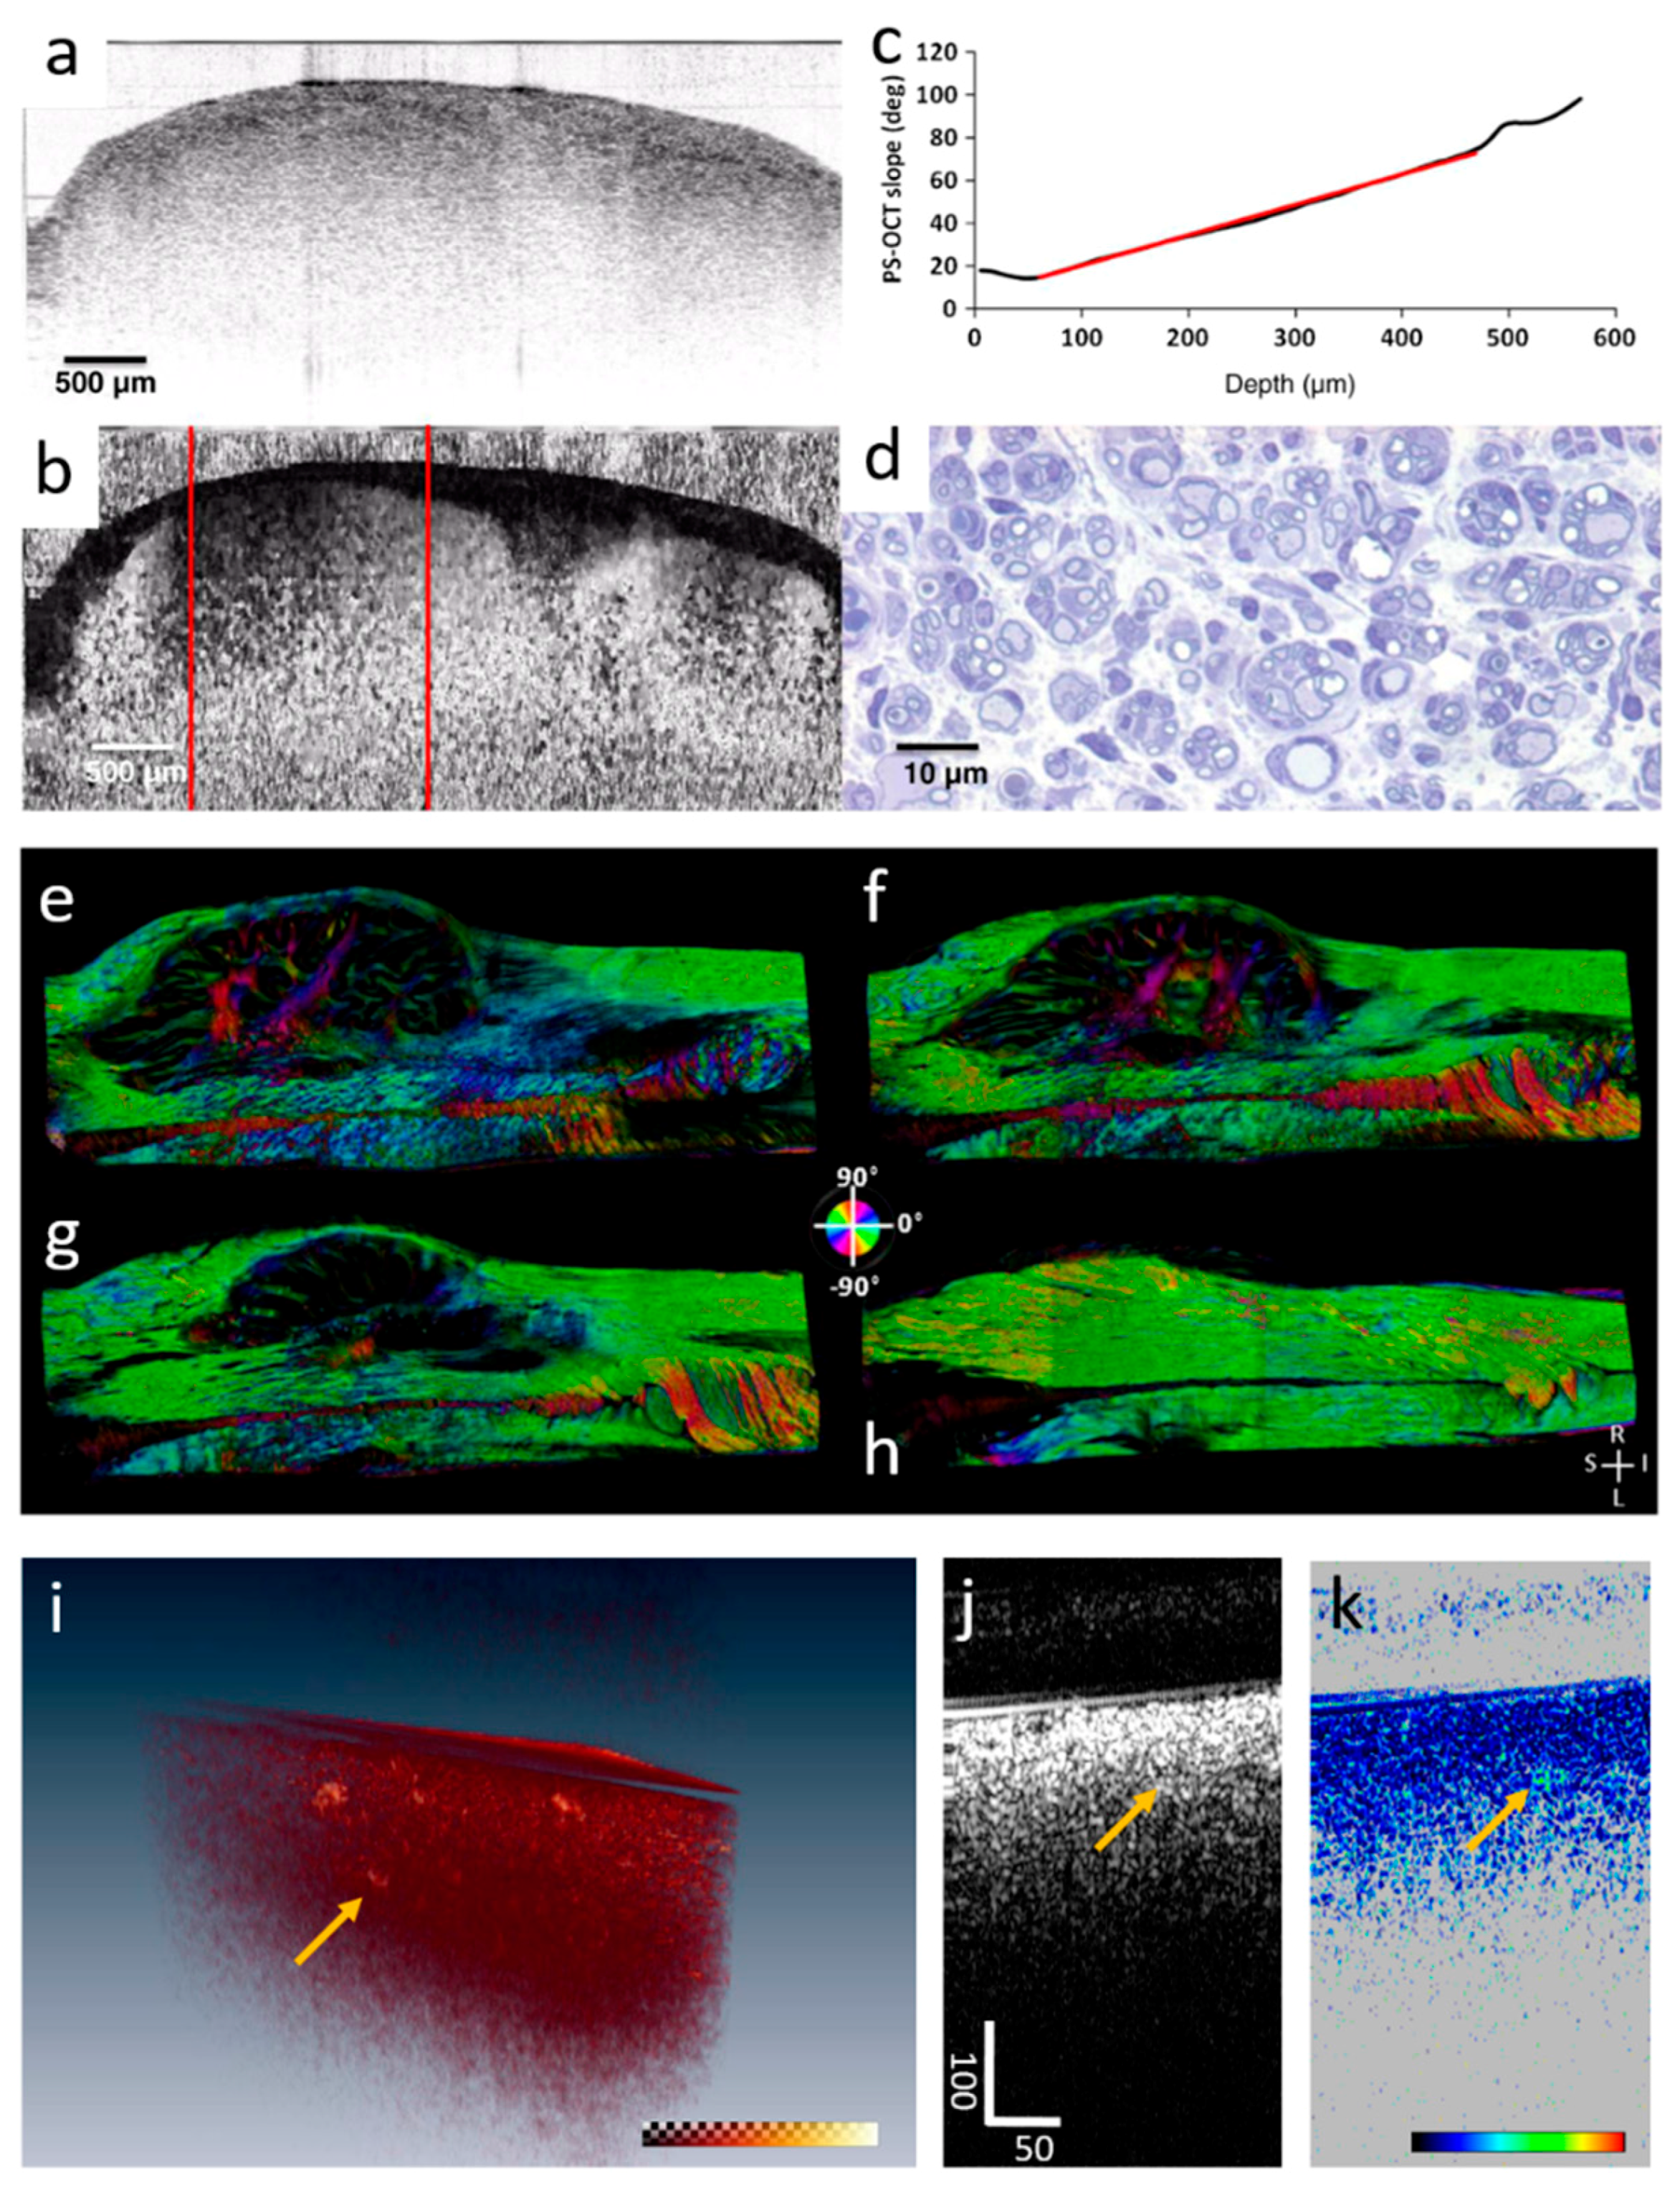
Aside from neural structures in the central nervous system, peripheral nerves have also been imaged by PS-OCT. Improved delineation of the sciatic nerve boundaries to muscle and adipose tissues as well as quantitative birefringence measurements were enabled by the additional polarization contrast [224]. In an experimental nerve crush model, decreasing birefringence was observed in parallel to a loss of myelination (Figure 12a–d) [225]. The prostatic nerves—indiscernible from surrounding tissue by standard, intensity based OCT—were identified in prostates of rats and humans, thereby indicating the feasibility of PS-OCT as a method for intrasurgical imaging [226].
In the brain, PS-OCT was not only used to enhance the contrast of birefringent structures but also to trace white matter structures as shown in Figure 12e–h. PS-OCT based tractography provides images encoding the orientation of fiber tracts in different colors and can be used to verify diffusion tensor based MRI tractography images with micrometer scale resolution [51,227,228,229]. Lately, PS-OCT was also demonstrated for imaging a hallmark of Alzheimer’s disease, namely neuritic amyloid-beta plaques as well as amyloidosis in cerebral vasculature [230]. PS-OCT images of birefringent neuritic plaques are shown in Figure 12i–k.
3.8. Other Applications of PS-OCT
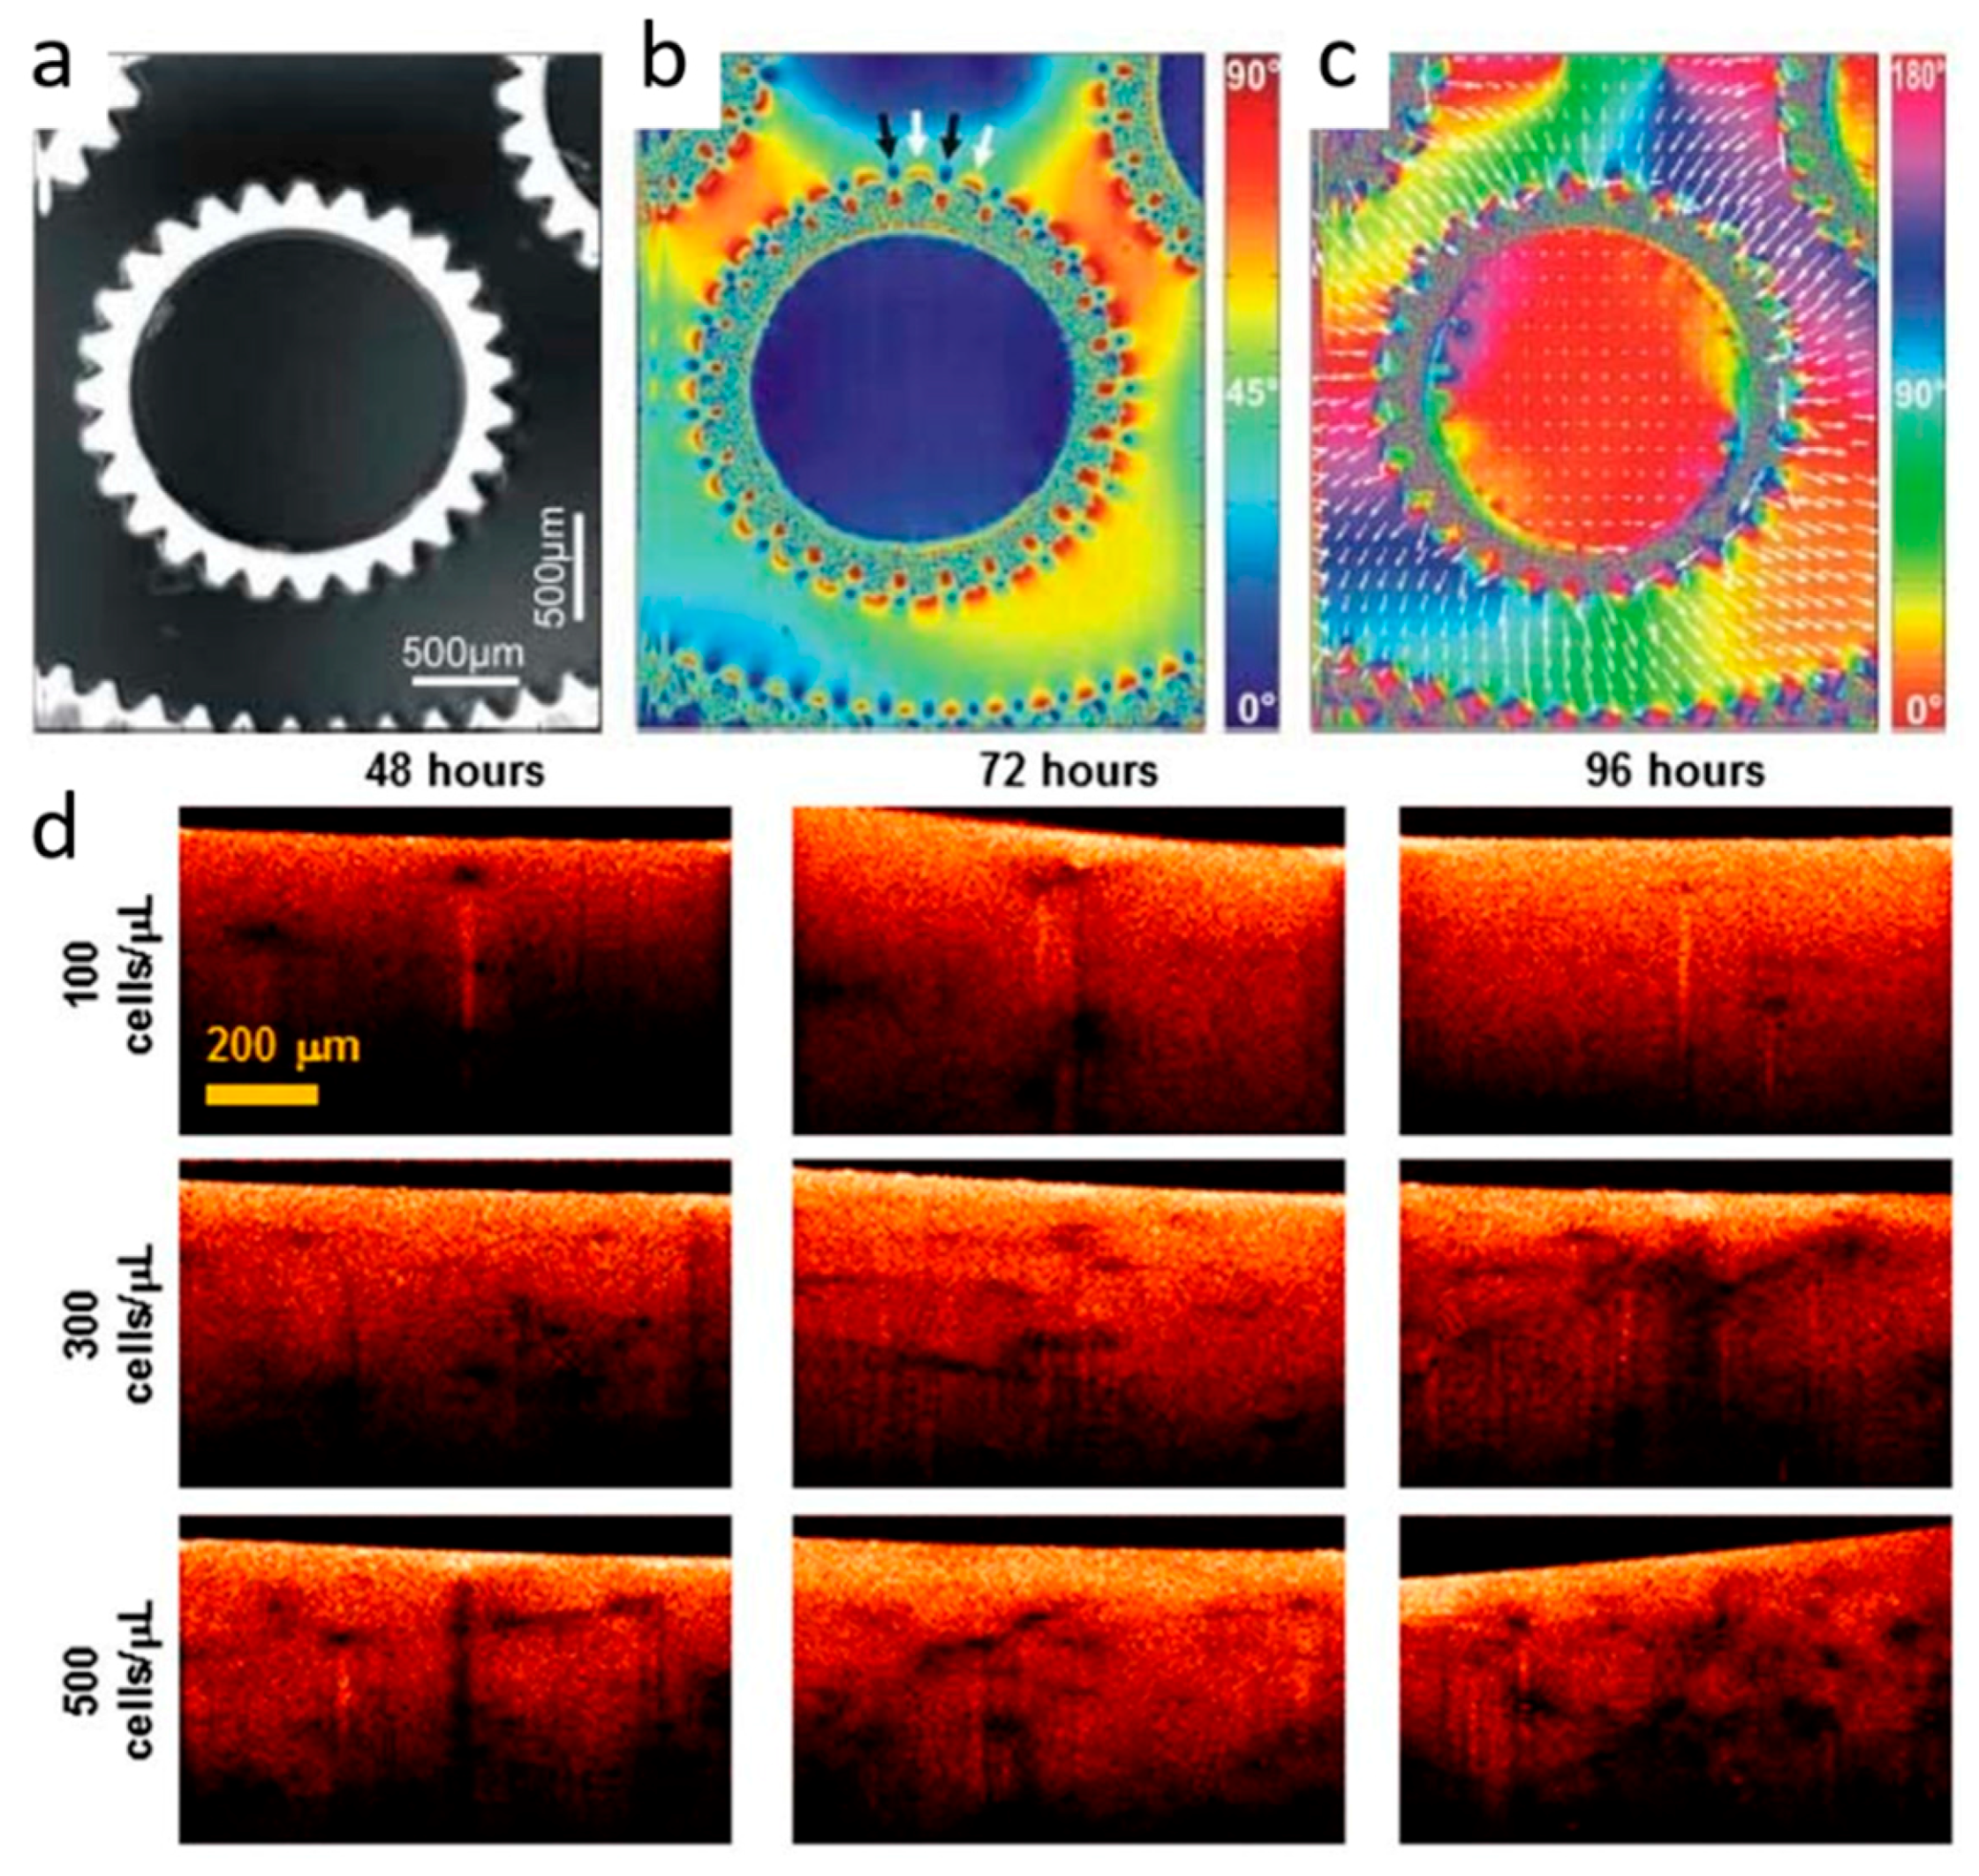
PS-OCT also found applications in biomedical fields other than those discussed in the previous sections as well as in non-medical fields. One exciting use of PS-OCT is in imaging applications relying on small particles as exogenous contrast agents. As such, plasmon-resonant nanoparticles like gold nanostars are popular contrast agents in biophotonic imaging. In order to increase detection sensitivity for single particles, their polarization-sensitive scattering signal in the near infrared can be modulated by an external oscillating magnetic field [231]. PS-OCT can be used to detect these dynamic scattering signals and was demonstrated for depth-resolved viscosity measurements based on the diffusion of gold nanorods [232]. Based on temporal changes in polarization contrast parameters, a method for differentiating light scatterers such as cells and gold nanorods was developed [233]. Recently, PS-OCT based detection of gold nanorods was proposed for detecting nanotopological changes in 3D tissue models of mammary extracellular matrix and pulmonary mucus (Figure 13d) [234]. Having a non-invasive imaging technique like PS-OCT for studies of such tissue models may help to interpret biophysical changes associated with disease progression.
Its sensitivity for microstructural changes affecting sample polarization properties along with its 3D imaging capabilities made PS-OCT also an interesting modality for materials science and nondestructive testing applications [236]. Using translucent glass-epoxy composite phantoms, the spatial distribution of mechanical stress was mapped by PS-OCT [237]. Strain mapping by also exploiting the optic axis orientation in PS-OCT images was demonstrated as a method for charting the directionality of strained sample areas (Figure 13a–c) [235]. Material dynamics were optically investigated by translating measured phase retardation into stress images [238]. Thereby, dynamics could be studied from the elastic regime over the deformation phase up to fracture.
4. Conclusions
PS-OCT is a versatile functional extension of OCT. As described in the section on the technical background, only few modifications to the standard OCT layout are necessary for polarization sensitivity. Of course, more sophisticated setups and advanced analysis methods were also developed. This review aimed to provide a concise introduction to the basic principles underlying PS-OCT and a crisp overview of advances in PS-OCT technology development. By highlighting research on state of the art PS-OCT applications based on the published literature, the obvious potential of this powerful technique for improved qualitative and quantitative imaging was portrayed. Given the achievements of the past 20 years discussed here, we are anticipating exciting new technological developments, advances of applied biomedical imaging, and potential applications in new fields for the next 20 years.
Acknowledgments
I would like to express my gratitude to Christoph K. Hitzenberger, Michael Pircher, and Erich Götzinger, Medical University of Vienna, Austria, who introduced me to the exciting world of PS-OCT more than 10 years ago. Also, I would like to thank my colleagues at the Center for Medical Physics and Biomedical Engineering (in particular Marco Augustin and Christoph Hitzenberger for proof-reading), at the Department of Ophthalmology, at the Division of Biomedical Research, at the Core Facility Imaging and at the Institute of Neurology at Medical University of Vienna as well as at the VetCore Facility for Research and Technology at the University of Veterinary Medicine Vienna for their continuous collaborative support, fruitful discussions, and creative feedback. Funding by the Austrian Science Fund (FWF grant P25823-B24) and the European Research Council (ERC Starting Grant 640396 OPTIMALZ) is gratefully acknowledged.
Conflicts of Interest
The author declares no conflict of interest.
References
- Huang, D.; Swanson, E.A.; Lin, C.P.; Schuman, J.S.; Stinson, W.G.; Chang, W.; Hee, M.R.; Flotte, T.; Gregory, K.; Puliafito, C.A.; et al. Optical coherence tomography. Science 1991, 254, 1178–1181. [Google Scholar] [CrossRef] [PubMed]
- Drexler, W.; Fujimoto, J.G. Optical Coherence Tomography Technology and Applications; Springer: Berlin/Heidelberg, Germany; New York, NY, USA, 2008. [Google Scholar]
- Fercher, A.F. Optical coherence tomography—Development, principles, applications. Zeitschrift Fur Medizinische Physik 2010, 20, 251–276. [Google Scholar] [CrossRef] [PubMed]
- Fercher, A.F.; Mengedoht, K.; Werner, W. Eye-length measurement by interferometry with partially coherent light. Opt. Lett. 1988, 13, 1867–1869. [Google Scholar] [CrossRef]
- Fercher, A.F.; Hitzenberger, C.K.; Kamp, G.; Elzaiat, S.Y. Measurement of intraocular distances by backscattering spectral interferometry. Opt. Commun. 1995, 117, 43–48. [Google Scholar] [CrossRef]
- Drexler, W.; Liu, M.; Kumar, A.; Kamali, T.; Unterhuber, A.; Leitgeb, R.A. Optical coherence tomography today: Speed, contrast, and multimodality. J. Biomed. Opt. 2014, 19, 071412. [Google Scholar] [CrossRef] [PubMed]
- Tuchin, V.V. Polarized light interaction with tissues. J. Biomed. Opt. 2016, 21, 071114. [Google Scholar] [CrossRef] [PubMed]
- De Boer, J.F.; Milner, T.E.; van Gemert, M.J.C.; Nelson, J.S. Two-dimensional birefringence imaging in biological tissue by polarization-sensitive optical coherence tomography. Opt. Lett. 1997, 22, 934–936. [Google Scholar] [CrossRef] [PubMed]
- De Boer, J.F.; Milner, T.E. Review of polarization sensitive optical coherence tomography and Stokes vector determination. J. Biomed. Opt. 2002, 7, 359–371. [Google Scholar] [CrossRef] [PubMed]
- De Boer, J.F.; Hitzenberger, C.K.; Yasuno, Y. Polarization sensitive optical coherence tomography—A review. Biomed. Opt. Express 2017, 8, 1838–1873. [Google Scholar] [CrossRef]
- Jones, R.C. A new calculus for the treatment of optical systemsi. Description and discussion of the calculus. J. Opt. Soc. Am. 1941, 31, 488–493. [Google Scholar] [CrossRef]
- Bickel, W.S.; Bailey, W.M. Stokes vectors, Mueller matrices, and polarized scattered light. Am. J. Phys. 1985, 53, 468–478. [Google Scholar] [CrossRef]
- Hee, M.R.; Huang, D.; Swanson, E.A.; Fujimoto, J.G. Polarization-sensitive low-coherence reflectometer for birefringence characterization and ranging. J. Opt. Soc. Am. B 1992, 9, 903–908. [Google Scholar] [CrossRef]
- Hitzenberger, C.K.; Gotzinger, E.; Sticker, M.; Pircher, M.; Fercher, A.F. Measurement and imaging of birefringence and optic axis orientation by phase resolved polarization sensitive optical coherence tomography. Opt. Express 2001, 9, 780–790. [Google Scholar] [CrossRef] [PubMed]
- Park, B.H.; Pierce, M.C.; Cense, B.; de Boer, J.F. Jones matrix analysis for a polarization-sensitive optical coherence tomography system using fiber-optic components. Opt. Lett. 2004, 29, 2512–2514. [Google Scholar] [CrossRef] [PubMed]
- Makita, S.; Yamanari, M.; Yasuno, Y. Generalized Jones matrix optical coherence tomography: Performance and local birefringence imaging. Opt. Express 2010, 18, 854–876. [Google Scholar] [CrossRef] [PubMed]
- Todorovic, M.; Jiao, S.; Wang, L.V.; Stoica, G. Determination of local polarization properties of biological samples in the presence of diattenuation by use of Mueller optical coherence tomography. Opt. Lett. 2004, 29, 2402–2404. [Google Scholar] [CrossRef] [PubMed]
- Braaf, B.; Vermeer, K.A.; de Groot, M.; Vienola, K.V.; de Boer, J.F. Fiber-based polarization-sensitive OCT of the human retina with correction of system polarization distortions. Biomed. Opt. Express 2014, 5, 2736–2758. [Google Scholar] [CrossRef] [PubMed]
- Adie, S.G.; Hillman, T.R.; Sampson, D.D. Detection of multiple scattering in optical coherence tomography using the spatial distribution of Stokes vectors. Opt. Express 2007, 15, 18033–18049. [Google Scholar] [CrossRef] [PubMed]
- Gotzinger, E.; Pircher, M.; Geitzenauer, W.; Ahlers, C.; Baumann, B.; Michels, S.; Schmidt-Erfurth, U.; Hitzenberger, C.K. Retinal pigment epithelium segmentation by polarization sensitive optical coherence tomography. Opt. Express 2008, 16, 16410–16422. [Google Scholar] [CrossRef] [PubMed]
- Makita, S.; Hong, Y.-J.; Miura, M.; Yasuno, Y. Degree of polarization uniformity with high noise immunity using polarization-sensitive optical coherence tomography. Opt. Lett. 2014, 39, 6783–6786. [Google Scholar] [CrossRef] [PubMed]
- Baumann, B.; Zotter, S.; Pircher, M.; Götzinger, E.; Rauscher, S.; Glösmann, M.; Lammer, J.; Schmidt-Erfurth, U.; Gröger, M.; Hitzenberger, C.K. Spectral degree of polarization uniformity for polarization-sensitive OCT. J. Mod. Opt. 2015, 62, 1758–1763. [Google Scholar] [CrossRef] [PubMed]
- Lippok, N.; Villiger, M.; Bouma, B.E. Degree of polarization (uniformity) and depolarization index: Unambiguous depolarization contrast for optical coherence tomography. Opt. Lett. 2015, 40, 3954–3957. [Google Scholar] [CrossRef] [PubMed]
- Ortega-Quijano, N.; Marvdashti, T.; Bowden, A.K.E. Enhanced depolarization contrast in polarization-sensitive optical coherence tomography. Opt. Lett. 2016, 41, 2350–2353. [Google Scholar] [CrossRef] [PubMed]
- Baumann, B.; Baumann, S.O.; Konegger, T.; Pircher, M.; Götzinger, E.; Schlanitz, F.; Schütze, C.; Sattmann, H.; Litschauer, M.; Schmidt-Erfurth, U.; et al. Polarization sensitive optical coherence tomography of melanin provides intrinsic contrast based on depolarization. Biomed. Opt. Express 2012, 3, 1670–1683. [Google Scholar] [CrossRef] [PubMed]
- Baumann, B.; Schirmer, J.; Rauscher, S.; Fialová, S.; Glösmann, M.; Augustin, M.; Pircher, M.; Gröger, M.; Hitzenberger, C.K. Melanin pigmentation in rat eyes: In vivo imaging by polarization-sensitive optical coherence tomography and comparison to histology. Investig. Ophthalmol. Vis. Sci. 2015, 56, 7462–7472. [Google Scholar] [CrossRef] [PubMed]
- Zhang, E.Z.; Oh, W.-Y.; Villiger, M.L.; Chen, L.; Bouma, B.E.; Vakoc, B.J. Numerical compensation of system polarization mode dispersion in polarization-sensitive optical coherence tomography. Opt. Express 2013, 21, 1163–1180. [Google Scholar] [CrossRef] [PubMed]
- Villiger, M.; Zhang, E.Z.; Nadkarni, S.; Oh, W.-Y.; Bouma, B.E.; Vakoc, B.J. Artifacts in polarization-sensitive optical coherence tomography caused by polarization mode dispersion. Opt. Lett. 2013, 38, 923–925. [Google Scholar] [CrossRef] [PubMed]
- Villiger, M.; Zhang, E.Z.; Nadkarni, S.K.; Oh, W.-Y.; Vakoc, B.J.; Bouma, B.E. Spectral binning for mitigation of polarization mode dispersion artifacts in catheter-based optical frequency domain imaging. Opt. Express 2013, 21, 16353–16369. [Google Scholar] [CrossRef] [PubMed]
- Ju, M.J.; Hong, Y.-J.; Makita, S.; Lim, Y.; Kurokawa, K.; Duan, L.; Miura, M.; Tang, S.; Yasuno, Y. Advanced multi-contrast Jones matrix optical coherence tomography for Doppler and polarization sensitive imaging. Opt. Express 2013, 21, 19412–19436. [Google Scholar] [CrossRef] [PubMed]
- Wojtkowski, M.; Leitgeb, R.; Kowalczyk, A.; Bajraszewski, T.; Fercher, A.F. In vivo human retinal imaging by Fourier domain optical coherence tomography. J. Biomed. Opt. 2002, 7, 457–463. [Google Scholar] [CrossRef] [PubMed]
- Kiseleva, E.; Kirillin, M.; Feldchtein, F.; Vitkin, A.; Sergeeva, E.; Zagaynova, E.; Streltzova, O.; Shakhov, B.; Gubarkova, E.; Gladkova, N. Differential diagnosis of human bladder mucosa pathologies in vivo with cross-polarization optical coherence tomography. Biomed. Opt. Express 2015, 6, 1464–1476. [Google Scholar] [CrossRef] [PubMed]
- Gubarkova, E.V.; Kirillin, M.Y.; Dudenkova, V.V.; Timashev, P.S.; Kotova, S.L.; Kiseleva, E.B.; Timofeeva, L.B.; Belkova, G.V.; Solovieva, A.B.; Moiseev, A.A.; et al. Quantitative evaluation of atherosclerotic plaques using cross-polarization optical coherence tomography, nonlinear, and atomic force microscopy. J. Biomed. Opt. 2016, 21, 126010. [Google Scholar] [CrossRef] [PubMed]
- Liu, B.; Harman, M.; Giattina, S.; Stamper, D.L.; Demakis, C.; Chilek, M.; Raby, S.; Brezinski, M.E. Characterizing of tissue microstructure with single-detector polarization-sensitive optical coherence tomography. Appl. Opt. 2006, 45, 4464–4479. [Google Scholar] [CrossRef] [PubMed]
- Jiao, S.; Wang, L.V. Two-dimensional depth-resolved Mueller matrix of biological tissue measured with double-beam polarization-sensitive optical coherence tomography. Opt. Lett. 2002, 27, 101–103. [Google Scholar] [CrossRef] [PubMed]
- Jiao, S.; Yao, G.; Wang, L.V. Depth-resolved two-dimensional Stokes vectors of backscattered light and Mueller matrices of biological tissue measured with optical coherence tomography. Appl. Opt. 2000, 39, 6318–6324. [Google Scholar] [CrossRef] [PubMed]
- Jiao, S.; Yu, W.; Stoica, G.; Wang, L.V. Optical-fiber-based Mueller optical coherence tomography. Opt. Lett. 2003, 28, 1206–1208. [Google Scholar] [CrossRef] [PubMed]
- Villiger, M.; Bouma, B.E. Practical decomposition for physically admissible differential Mueller matrices. Opt. Lett. 2014, 39, 1779–1782. [Google Scholar] [CrossRef] [PubMed]
- Everett, M.J.; Schoenenberger, K.; Colston, B.W., Jr.; Da Silva, L.B. Birefringence characterization of biological tissue by use of optical coherence tomography. Opt. Lett. 1998, 23, 228–230. [Google Scholar] [CrossRef] [PubMed]
- Pircher, M.; Goetzinger, E.; Leitgeb, R.; Hitzenberger, C.K. Transversal phase resolved polarization sensitive optical coherence tomography. Phys. Med. Biol. 2004, 49, 1257–1263. [Google Scholar] [CrossRef] [PubMed]
- Götzinger, E.; Pircher, M.; Hitzenberger, C.K. High speed spectral domain polarization sensitive optical coherence tomography of the human retina. Opt. Express 2005, 13, 10217–10229. [Google Scholar] [CrossRef] [PubMed]
- Schmoll, T.; Gotzinger, E.; Pircher, M.; Hitzenberger, C.K.; Leitgeb, R.A. Single-camera polarization-sensitive spectral-domain OCT by spatial frequency encoding. Opt. Lett. 2010, 35, 241–243. [Google Scholar] [CrossRef] [PubMed]
- Fan, C.; Yao, G. Mapping local optical axis in birefringent samples using polarization-sensitive optical coherence tomography. J. Biomed. Opt. 2012, 17, 110501. [Google Scholar] [CrossRef] [PubMed]
- Fan, C.; Yao, G. Mapping local retardance in birefringent samples using polarization sensitive optical coherence tomography. Opt. Lett. 2012, 37, 1415–1417. [Google Scholar] [CrossRef] [PubMed]
- Al-Qaisi, M.K.; Akkin, T. Polarization-sensitive optical coherence tomography based on polarization-maintaining fibers and frequency multiplexing. Opt. Express 2008, 16, 13032–13041. [Google Scholar] [CrossRef] [PubMed]
- Gotzinger, E.; Baumann, B.; Pircher, M.; Hitzenberger, C.K. Polarization maintaining fiber based ultra-high resolution spectral domain polarization sensitive optical coherence tomography. Opt. Express 2009, 17, 22704–22717. [Google Scholar] [CrossRef] [PubMed]
- Al-Qaisi, M.K.; Akkin, T. Swept-source polarization-sensitive optical coherence tomography based on polarization-maintaining fiber. Opt. Express 2010, 18, 3392–3403. [Google Scholar] [CrossRef] [PubMed]
- Wang, H.; Al-Qaisi, M.K.; Akkin, T. Polarization-maintaining fiber based polarization-sensitive optical coherence tomography in spectral domain. Opt. Lett. 2010, 35, 154–156. [Google Scholar] [CrossRef] [PubMed]
- Zotter, S.; Pircher, M.; Torzicky, T.; Baumann, B.; Yoshida, H.; Hirose, F.; Roberts, P.; Ritter, M.; Schütze, C.; Götzinger, E.; et al. Large-field high-speed polarization sensitive spectral domain OCT and its applications in ophthalmology. Biomed. Opt. Express 2012, 3, 2720–2732. [Google Scholar] [CrossRef] [PubMed]
- Bonesi, M.; Sattmann, H.; Torzicky, T.; Zotter, S.; Baumann, B.; Pircher, M.; Götzinger, E.; Eigenwillig, C.; Wieser, W.; Huber, R.; et al. High-speed polarization sensitive optical coherence tomography scan engine based on Fourier domain mode locked laser. Biomed. Opt. Express 2012, 3, 2987–3000. [Google Scholar] [CrossRef] [PubMed]
- Wang, H.; Akkin, T.; Magnain, C.; Wang, R.P.; Dubb, J.; Kostis, W.J.; Yaseen, M.A.; Cramer, A.; Sakadzic, S.; Boas, D. Polarization sensitive optical coherence microscopy for brain imaging. Opt. Lett. 2016, 41, 2213–2216. [Google Scholar] [CrossRef] [PubMed]
- Lin, H.; Kao, M.-C.; Lai, C.-M.; Huang, J.-C.; Kuo, W.-C. All fiber optics circular-state swept source polarization-sensitive optical coherence tomography. J. Biomed. Opt. 2013, 19, 021110. [Google Scholar] [CrossRef] [PubMed]
- Lurie, K.L.; Moritz, T.J.; Ellerbee, A.K. Design considerations for polarization-sensitive optical coherence tomography with a single input polarization state. Biomed. Opt. Express 2012, 3, 2273–2287. [Google Scholar] [CrossRef] [PubMed]
- Trasischker, W.; Zotter, S.; Torzicky, T.; Baumann, B.; Haindl, R.; Pircher, M.; Hitzenberger, C.K. Single input state polarization sensitive swept source optical coherence tomography based on an all single mode fiber interferometer. Biomed. Opt. Express 2014, 5, 2798–2809. [Google Scholar] [CrossRef] [PubMed]
- Lippok, N.; Villiger, M.; Jun, C.; Bouma, B.E. Single input state, single-mode fiber-based polarization-sensitive optical frequency domain imaging by eigenpolarization referencing. Opt. Lett. 2015, 40, 2025–2028. [Google Scholar] [CrossRef] [PubMed]
- Kemp, N.J.; Zaatari, H.N.; Park, J.; Rylander Iii, H.G.; Milner, T.E. Form-biattenuance in fibrous tissues measured with polarization-sensitive optical coherence tomography (PS-OCT). Opt. Express 2005, 13, 4611–4628. [Google Scholar] [CrossRef] [PubMed]
- Pircher, M.; Götzinger, E.; Baumann, B.; Hitzenberger, C.K. Corneal birefringence compensation for polarization sensitive optical coherence tomography of the human retina. J. Biomed. Opt. 2007, 12, 041210. [Google Scholar] [CrossRef] [PubMed]
- De Boer, J.F.; Milner, T.E.; Nelson, J.S. Determination of the depth-resolved Stokes parameters of light backscattered from turbid media by use of polarization-sensitive optical coherence tomography. Opt. Lett. 1999, 24, 300–302. [Google Scholar] [CrossRef] [PubMed]
- Jiao, S.; Wang, L.V. Jones-matrix imaging of biological tissues with quadruple-channel optical coherence tomography. J. Biomed. Opt. 2002, 7, 350–358. [Google Scholar] [CrossRef] [PubMed]
- Yasuno, Y.; Makita, S.; Endo, T.; Itoh, M.; Yatagai, T.; Takahashi, M.; Katada, C.; Mutoh, M. Polarization-sensitive complex Fourier domain optical coherence tomography for Jones matrix imaging of biological samples. Appl. Phys. Lett. 2004, 85, 3023–3025. [Google Scholar] [CrossRef]
- Makita, S.; Yasuno, Y.; Endo, T.; Itoh, M.; Yatagi, T. Jones matrix imaging of biological samples using parallel-detecting polarization-sensitive Fourier domain optical coherence tomography. Opt. Rev. 2005, 12, 146–148. [Google Scholar] [CrossRef]
- Park, J.; Kemp, N.J.; Zaatari, H.N.; Rylander, H.G.; Milner, T.E. Differential geometry of normalized Stokes vector trajectories in anisotropic media. J. Opt. Soc. Am. A 2006, 23, 679–690. [Google Scholar] [CrossRef]
- Makita, S.; Yasuno, Y.; Endo, T.; Itoh, M.; Yatagai, T. Polarization contrast imaging of biological tissues by polarization-sensitive Fourier-domain optical coherence tomography. Appl. Opt. 2006, 45, 1142–1147. [Google Scholar] [CrossRef] [PubMed]
- Saxer, C.E.; de Boer, J.F.; Park, B.H.; Zhao, Y.; Chen, Z.; Nelson, J.S. High-speed fiber-based polarization-sensitive optical coherence tomography of in vivo human skin. Opt. Lett. 2000, 25, 1355–1357. [Google Scholar] [CrossRef] [PubMed]
- Yamanari, M.; Makita, S.; Madjarova, V.D.; Yatagai, T.; Yasuno, Y. Fiber-based polarization-sensitive Fourier domain optical coherence tomography using B-scan-oriented polarization modulation method. Opt. Express 2006, 14, 6502–6515. [Google Scholar] [CrossRef] [PubMed]
- Park, B.H.; Saxer, C.; Srinivas, S.M.; Nelson, J.S.; de Boer, J.F. In vivo burn depth determination by high-speed fiber-based polarization sensitive optical coherence tomography. J. Biomed. Opt. 2001, 6, 474–479. [Google Scholar] [CrossRef] [PubMed]
- Park, B.H.; Pierce, M.C.; Cense, B.; de Boer, J.F. Real-time multi-functional optical coherence tomography. Opt. Express 2003, 11, 782–793. [Google Scholar] [CrossRef] [PubMed]
- Park, B.H.; Pierce, M.C.; Cense, B.; Yun, S.H.; Mujat, M.; Tearney, G.J.; Bouma, B.E.; de Boer, J.F. Real-time fiber-based multi-functional spectral-domain optical coherence tomography at 1.3 µm. Opt. Express 2005, 13, 3931–3944. [Google Scholar] [CrossRef] [PubMed]
- Wang, Y.; Yao, G. Optical tractography of the mouse heart using polarization-sensitive optical coherence tomography. Biomed. Opt. Express 2013, 4, 2540–2545. [Google Scholar] [CrossRef] [PubMed]
- Azinfar, L.; Ravanfar, M.; Wang, Y.; Zhang, K.; Duan, D.; Yao, G. High resolution imaging of the fibrous microstructure in bovine common carotid artery using optical polarization tractography. J. Biophotonics 2015, 10, 231–241. [Google Scholar] [CrossRef] [PubMed]
- Oh, W.Y.; Yun, S.H.; Vakoc, B.J.; Shishkov, M.; Desjardins, A.E.; Park, B.H.; de Boer, J.F.; Tearney, G.J.; Bouma, E. High-speed polarization sensitive optical frequency domain imaging with frequency multiplexing. Opt. Express 2008, 16, 1096–1103. [Google Scholar] [CrossRef] [PubMed]
- Oh, W.Y.; Vakoc, B.J.; Yun, S.H.; Tearney, G.J.; Bouma, B.E. Single-detector polarization-sensitive optical frequency domain imaging using high-speed intra a-line polarization modulation. Opt. Lett. 2008, 33, 1330–1332. [Google Scholar] [CrossRef] [PubMed]
- Baumann, B.; Choi, W.; Potsaid, B.; Huang, D.; Duker, J.S.; Fujimoto, J.G. Swept source/Fourier domain polarization sensitive optical coherence tomography with a passive polarization delay unit. Opt. Express 2012, 20, 10229–10241. [Google Scholar] [CrossRef] [PubMed]
- Lim, Y.; Hong, Y.-J.; Duan, L.; Yamanari, M.; Yasuno, Y. Passive component based multifunctional Jones matrix swept source optical coherence tomography for Doppler and polarization imaging. Opt. Lett. 2012, 37, 1958–1960. [Google Scholar] [CrossRef] [PubMed]
- Lu, Z.; Kasaragod, D.K.; Matcher, S.J. Method to calibrate phase fluctuation in polarization-sensitive swept-source optical coherence tomography. J. Biomed. Opt. 2011, 16, 070502. [Google Scholar] [CrossRef] [PubMed]
- Fan, C.; Yao, G. Imaging myocardial fiber orientation using polarization sensitive optical coherence tomography. Biomed. Opt. Express 2013, 4, 460–465. [Google Scholar] [CrossRef] [PubMed]
- Lo, W.C.Y.; Villiger, M.; Golberg, A.; Broelsch, G.F.; Khan, S.; Lian, C.G.; Austen, W.G., Jr.; Yarmush, M.; Bouma, B.E. Longitudinal, 3D imaging of collagen remodeling in murine hypertrophic scars in vivo using polarization-sensitive optical frequency domain imaging. J. Investig. Dermatol. 2016, 136, 84–92. [Google Scholar] [CrossRef] [PubMed]
- Li, E.; Makita, S.; Hong, Y.-J.; Kasaragod, D.; Yasuno, Y. Three-dimensional multi-contrast imaging of in vivo human skin by Jones matrix optical coherence tomography. Biomed. Opt. Express 2017, 8, 1290–1305. [Google Scholar] [CrossRef]
- Cense, B.; Chen, T.C.; Park, B.H.; Pierce, M.C.; de Boer, J.F. In vivo depth-resolved birefringence measurements of the human retinal nerve fiber layer by polarization-sensitive optical coherence tomography. Opt. Lett. 2002, 27, 1610–1612. [Google Scholar] [CrossRef] [PubMed]
- Pierce, M.C.; Park, B.H.; Cense, B.; de Boer, J.F. Simultaneous intensity, birefringence, and flow measurements with high-speed fiber-based optical coherence tomography. Opt. Lett. 2002, 27, 1534–1536. [Google Scholar] [CrossRef] [PubMed]
- Leitgeb, R.; Hitzenberger, C.K.; Fercher, A.F. Performance of fourier domain vs. Time domain optical coherence tomography. Opt. Express 2003, 11, 889–894. [Google Scholar] [CrossRef] [PubMed]
- De Boer, J.F.; Cense, B.; Park, B.H.; Pierce, M.C.; Tearney, G.J.; Bouma, B.E. Improved signal-to-noise ratio in spectral-domain compared with time-domain optical coherence tomography. Opt. Lett. 2003, 28, 2067–2069. [Google Scholar] [CrossRef] [PubMed]
- Choma, M.A.; Sarunic, M.V.; Yang, C.H.; Izatt, J.A. Sensitivity advantage of swept source and Fourier domain optical coherence tomography. Opt. Express 2003, 11, 2183–2189. [Google Scholar] [CrossRef] [PubMed]
- Baumann, B.; Gotzinger, E.; Pircher, M.; Hitzenberger, C.K. Single camera based spectral domain polarization sensitive optical coherence tomography. Opt. Express 2007, 15, 1054–1063. [Google Scholar] [CrossRef] [PubMed]
- Cense, B.; Mujat, M.; Chen, T.C.; Park, B.H.; de Boer, J.F. Polarization-sensitive spectral-domain optical coherence tomography using a single line scan camera. Opt. Express 2007, 15, 2421–2431. [Google Scholar] [CrossRef] [PubMed]
- Zhao, M.; Izatt, J.A. Single-camera sequential-scan-based polarization-sensitive SDOCT for retinal imaging. Opt. Lett. 2009, 34, 205–207. [Google Scholar] [CrossRef] [PubMed]
- Fan, C.M.; Yao, G. Single camera spectral domain polarization-sensitive optical coherence tomography using offset B-scan modulation. Opt. Express 2010, 18, 7281–7287. [Google Scholar] [CrossRef] [PubMed]
- Lee, S.W.; Jeong, H.W.; Kim, B.M. High-speed spectral domain polarization-sensitive optical coherence tomography using a single camera and an optical switch at 1.3 µm. J. Biomed. Opt. 2010, 15, 010501. [Google Scholar] [CrossRef] [PubMed]
- Song, C.; Ahn, M.; Gweon, D. Polarization-sensitive spectral-domain optical coherence tomography using a multi-line single camera spectrometer. Opt. Express 2010, 18, 23805–23817. [Google Scholar] [CrossRef] [PubMed]
- Lexer, F.; Hitzenberger, C.K.; Fercher, A.F.; Kulhavy, M. Wavelength-tuning interferometry of intraocular distances. Appl. Opt. 1997, 36, 6548–6553. [Google Scholar] [CrossRef] [PubMed]
- Golubovic, B.; Bouma, B.E.; Tearney, G.J.; Fujimoto, J.G. Optical frequency-domain reflectometry using rapid wavelength tuning of a Cr4+: Forsterite laser. Opt. Lett. 1997, 22, 1704–1706. [Google Scholar] [CrossRef] [PubMed]
- Klein, T.; Huber, R. High-speed OCT light sources and systems. Biomed. Opt. Express 2017, 8, 828–859. [Google Scholar] [CrossRef] [PubMed]
- Zhang, J.; Jung, W.; Nelson, J.S.; Chen, Z. Full range polarization-sensitive Fourier domain optical coherence tomography. Opt. Express 2004, 12, 6033–6039. [Google Scholar] [CrossRef] [PubMed]
- Yamanari, M.; Makita, S.; Yasuno, Y. Polarization-sensitive swept-source optical coherence tomography with continuous source polarization modulation. Opt. Express 2008, 16, 5892–5906. [Google Scholar] [CrossRef] [PubMed]
- Yasuno, Y.; Yamanari, M.; Kawana, K.; Oshika, T.; Miura, M. Investigation of post-glaucoma-surgery structures by three-dimensional and polarization sensitive anterior eye segment optical coherence tomography. Opt. Express 2009, 17, 3980–3996. [Google Scholar] [CrossRef] [PubMed]
- Yamanari, M.; Makita, S.; Lim, Y.; Yasuno, Y. Full-range polarization-sensitive swept-source optical coherence tomography by simultaneous transversal and spectral modulation. Opt. Express 2010, 18, 13964–13980. [Google Scholar] [CrossRef] [PubMed]
- Kim, K.H.; Park, B.H.; Tu, Y.; Hasan, T.; Lee, B.; Li, J.; de Boer, J.F. Polarization-sensitive optical frequency domain imaging based on unpolarized light. Opt. Express 2011, 19, 552–561. [Google Scholar] [CrossRef] [PubMed]
- Torzicky, T.; Pircher, M.; Zotter, S.; Bonesi, M.; Götzinger, E.; Hitzenberger, C.K. Automated measurement of choroidal thickness in the human eye by polarization sensitive optical coherence tomography. Opt. Express 2012, 20, 7564–7574. [Google Scholar] [CrossRef] [PubMed]
- Torzicky, T.; Marschall, S.; Pircher, M.; Baumann, B.; Bonesi, M.; Zotter, S.; Götzinger, E.; Trasischker, W.; Klein, T.; Wieser, W.; et al. Retinal polarization-sensitive optical coherence tomography at 1060 nm with 350 kHz a-scan rate using an Fourier domain mode locked laser. J. Biomed. Opt. 2013, 18, 026008. [Google Scholar] [CrossRef] [PubMed]
- Hong, Y.-J.; Makita, S.; Sugiyama, S.; Yasuno, Y. Optically buffered Jones-matrix-based multifunctional optical coherence tomography with polarization mode dispersion correction. Biomed. Opt. Express 2015, 6, 225–243. [Google Scholar] [CrossRef] [PubMed]
- Cho, H.S.; Oh, W.-Y. Polarization-sensitive OFDI using polarization-multiplexed wavelength-swept laser. Opt. Lett. 2014, 39, 4065–4067. [Google Scholar] [CrossRef] [PubMed]
- Wang, Z.; Lee, H.-C.; Vermeulen, D.; Chen, L.; Nielsen, T.; Park, S.Y.; Ghaemi, A.; Swanson, E.; Doerr, C.; Fujimoto, J. Silicon photonic integrated circuit swept-source optical coherence tomography receiver with dual polarization, dual balanced, in-phase and quadrature detection. Biomed. Opt. Express 2015, 6, 2562–2574. [Google Scholar] [CrossRef] [PubMed]
- Hong, Y.-J.; Miura, M.; Ju, M.J.; Makita, S.; Iwasaki, T.; Yasuno, Y. Simultaneous investigation of vascular and retinal pigment epithelial pathologies of exudative macular diseases by multifunctional optical coherence tomography. Investig. Ophthalmol. Vis. Sci. 2014, 55, 5016–5031. [Google Scholar] [CrossRef] [PubMed]
- Kim, S.; Park, T.; Jang, S.-J.; Nam, A.S.; Vakoc, B.J.; Oh, W.-Y. Multi-functional angiographic OFDI using frequency-multiplexed dual-beam illumination. Opt. Express 2015, 23, 8939–8947. [Google Scholar] [CrossRef] [PubMed]
- Augustin, M.; Fialová, S.; Himmel, T.; Glösmann, M.; Lengheimer, T.; Harper, D.J.; Plasenzotti, R.; Pircher, M.; Hitzenberger, C.K.; Baumann, B. Multi-functional OCT enables longitudinal study of retinal changes in a VLDLR knockout mouse model. PLoS ONE 2016, 11, e0164419. [Google Scholar] [CrossRef] [PubMed]
- Gong, P.; Chin, L.; Es’haghian, S.; Liew, Y.M.; Wood, F.M.; Sampson, D.D.; McLaughlin, R.A. Imaging of skin birefringence for human scar assessment using polarization-sensitive optical coherence tomography aided by vascular masking. J. Biomed. Opt. 2014, 19, 126014. [Google Scholar] [CrossRef] [PubMed]
- Pierce, M.C.; Shishkov, M.; Park, B.H.; Nassif, N.A.; Bouma, B.E.; Tearney, G.J.; de Boer, J.F. Effects of sample arm motion in endoscopic polarization-sensitive optical coherence tomography. Opt. Express 2005, 13, 5739–5749. [Google Scholar] [CrossRef] [PubMed]
- Kim, K.H.; Park, B.H.; Maguluri, G.N.; Lee, T.W.; Rogomentich, F.J.; Bancu, M.G.; Bouma, B.E.; de Boer, J.F.; Bernstein, J.J. Two-axis magnetically-driven mems scanning catheter for endoscopic high-speed optical coherence tomography. Opt. Express 2007, 15, 18130–18140. [Google Scholar] [CrossRef] [PubMed]
- Kim, K.H.; Burns, J.A.; Bernstein, J.J.; Maguluri, G.N.; Park, B.H.; de Boer, J.F. In vivo 3D human vocal fold imaging with polarization sensitive optical coherence tomography and a mems scanning catheter. Opt. Express 2010, 18, 14644–14653. [Google Scholar] [CrossRef] [PubMed]
- Li, J.; Feroldi, F.; de Lange, J.; Daniels, J.M.A.; Grünberg, K.; de Boer, J.F. Polarization sensitive optical frequency domain imaging system for endobronchial imaging. Opt. Express 2015, 23, 3390–3402. [Google Scholar] [CrossRef] [PubMed]
- Van der Sijde, J.N.; Karanasos, A.; Villiger, M.; Bouma, B.E.; Regar, E. First-in-man assessment of plaque rupture by polarization-sensitive optical frequency domain imaging in vivo. Eur. Heart J. 2016, 37, 1932. [Google Scholar] [CrossRef] [PubMed]
- Villiger, M.; Lorenser, D.; McLaughlin, R.A.; Quirk, B.C.; Kirk, R.W.; Bouma, B.E.; Sampson, D.D. Deep tissue volume imaging of birefringence through fibre-optic needle probes for the delineation of breast tumour. Sci. Rep. 2016, 6, 28771. [Google Scholar] [CrossRef] [PubMed]
- Li, B.H.; Leung, A.S.O.; Soong, A.; Munding, C.E.; Lee, H.; Thind, A.S.; Munce, N.R.; Wright, G.A.; Rowsell, C.H.; Yang, V.X.D.; et al. Hybrid intravascular ultrasound and optical coherence tomography catheter for imaging of coronary atherosclerosis. Catheter. Cardiovasc. Interv. 2013, 81, 494–507. [Google Scholar] [CrossRef] [PubMed]
- Yoon, Y.; Jang, W.H.; Xiao, P.; Kim, B.; Wang, T.; Li, Q.; Lee, J.Y.; Chung, E.; Kim, K.H. In vivo wide-field reflectance/fluorescence imaging and polarization-sensitive optical coherence tomography of human oral cavity with a forward-viewing probe. Biomed. Opt. Express 2015, 6, 524–535. [Google Scholar] [CrossRef] [PubMed]
- Liu, G.J.; Zhang, J.; Yu, L.F.; Xie, T.Q.; Chen, Z.P. Real-time polarization-sensitive optical coherence tomography data processing with parallel computing. Appl. Opt. 2009, 48, 6365–6370. [Google Scholar] [CrossRef] [PubMed]
- Duan, L.; Yamanari, M.; Yasuno, Y. Automated phase retardation oriented segmentation of chorio-scleral interface by polarization sensitive optical coherence tomography. Opt. Express 2012, 20, 3353–3366. [Google Scholar] [CrossRef] [PubMed]
- Kasaragod, D.; Makita, S.; Fukuda, S.; Beheregaray, S.; Oshika, T.; Yasuno, Y. Bayesian maximum likelihood estimator of phase retardation for quantitative polarization-sensitive optical coherence tomography. Opt. Express 2014, 22, 16472–16492. [Google Scholar] [CrossRef] [PubMed]
- Cense, B.; Gao, W.; Brown, J.M.; Jones, S.M.; Jonnal, R.S.; Mujat, M.; Park, B.H.; de Boer, J.F.; Miller, D.T. Retinal imaging with polarization-sensitive optical coherence tomography and adaptive optics. Opt. Express 2009, 17, 21634–21651. [Google Scholar] [CrossRef] [PubMed]
- Götzinger, E.; Pircher, M.; Baumann, B.; Schmoll, T.; Sattmann, H.; Leitgeb, R.A.; Hitzenberger, C.K. Speckle noise reduction in high speed polarization sensitive spectral domain optical coherence tomography. Opt. Express 2011, 19, 14568–14585. [Google Scholar] [CrossRef] [PubMed]
- Sugita, M.; Zotter, S.; Pircher, M.; Makihira, T.; Saito, K.; Tomatsu, N.; Sato, M.; Roberts, P.; Schmidt-Erfurth, U.; Hitzenberger, C.K. Motion artifact and speckle noise reduction in polarization sensitive optical coherence tomography by retinal tracking. Biomed. Opt. Express 2014, 5, 106–122. [Google Scholar] [CrossRef] [PubMed]
- Baumann, B.; Götzinger, E.; Pircher, M.; Sattmann, H.; Schütze, C.; Schlanitz, F.; Ahlers, C.; Schmidt-Erfurth, U.; Hitzenberger, C.K. Segmentation and quantification of retinal lesions in age-related macular degeneration using polarization-sensitive optical coherence tomography. J. Biomed. Opt. 2010, 15, 061704. [Google Scholar] [CrossRef] [PubMed]
- Schlanitz, F.G.; Baumann, B.; Spalek, T.; Schütze, C.; Ahlers, C.; Pircher, M.; Götzinger, E.; Hitzenberger, C.K.; Schmidt-Erfurth, U. Performance of automated drusen detection by polarization-sensitive optical coherence tomography. Investig. Ophthalmol. Vis. Sci. 2011, 52, 4571–4579. [Google Scholar] [CrossRef] [PubMed]
- Lammer, J.; Bolz, M.; Baumann, B.; Pircher, M.; Gerendas, B.; Schlanitz, F.; Hitzenberger, C.K.; Schmidt-Erfurth, U. Detection and analysis of hard exudates by polarization-sensitive optical coherence tomography in patients with diabetic maculopathy. Investig. Ophthalmol. Vis. Sci. 2014, 55, 1564–1571. [Google Scholar] [CrossRef] [PubMed]
- Schlanitz, F.G.; Sacu, S.; Baumann, B.; Bolz, M.; Platzer, M.; Pircher, M.; Hitzenberger, C.K.; Schmidt-Erfurth, U. Identification of drusen characteristics in age-related macular degeneration by polarization-sensitive optical coherence tomography. Am. J. Ophthalmol. 2015, 160, 335–344. [Google Scholar] [CrossRef] [PubMed]
- Sugita, M.; Pircher, M.; Zotter, S.; Baumann, B.; Saito, K.; Makihira, T.; Tomatsu, N.; Sato, M.; Hitzenberger, C.K. Analysis of optimum conditions of depolarization imaging by polarization-sensitive optical coherence tomography in the human retina. J. Biomed. Opt. 2015, 20, 016011. [Google Scholar] [CrossRef] [PubMed]
- Miyazawa, A.; Yamanari, M.; Makita, S.; Miura, M.; Kawana, K.; Iwaya, K.; Goto, H.; Yasuno, Y. Tissue discrimination in anterior eye using three optical parameters obtained by polarization sensitive optical coherence tomography. Opt. Express 2009, 17, 17426–17440. [Google Scholar] [CrossRef] [PubMed]
- Yasuno, Y.; Yamanari, M.; Kawana, K.; Miura, M.; Fukuda, S.; Makita, S.; Sakai, S.; Oshika, T. Visibility of trabecular meshwork by standard and polarization-sensitive optical coherence tomography. J. Biomed. Opt. 2010, 15, 061705. [Google Scholar] [CrossRef] [PubMed]
- Fukuda, S.; Yamanari, M.; Lim, Y.; Hoshi, S.; Beheregaray, S.; Oshika, T.; Yasuno, Y. Keratoconus diagnosis using anterior segment polarization-sensitive optical coherence tomography. Investig. Ophthalmol. Vis. Sci. 2013, 54, 1384–1391. [Google Scholar] [CrossRef] [PubMed]
- Duan, L.; Marvdashti, T.; Ellerbee, A.K. Polarization-sensitive interleaved optical coherence tomography. Opt. Express 2015, 23, 13693–13703. [Google Scholar] [CrossRef] [PubMed]
- Drexler, W.; Fujimoto, J.G. State-of-the-art retinal optical coherence tomography. Prog. Retin. Eye Res. 2008, 27, 45–88. [Google Scholar] [CrossRef] [PubMed]
- Pircher, M.; Hitzenberger, C.K.; Schmidt-Erfurth, U. Polarization sensitive optical coherence tomography in the human eye. Prog. Retin. Eye Res. 2011, 30, 431–451. [Google Scholar] [CrossRef] [PubMed]
- Kingman, S. Glaucoma is second leading cause of blindness globally. Bull. World Health Organ. 2004, 82, 887–888. [Google Scholar] [PubMed]
- Weinreb, R.N.; Dreher, A.W.; Coleman, A.; Quigley, H.; Shaw, B.; Reiter, K. Histopathologic validation of Fourier-ellipsometry measurements of retinal nerve fiber layer thickness. Arch. Ophthalmol. 1990, 108, 557–560. [Google Scholar] [CrossRef] [PubMed]
- Huang, X.-R.; Knighton, R.W. Linear birefringence of the retinal nerve fiber layer measured in vitro with a multispectral imaging micropolarimeter. J. Biomed. Opt. 2002, 7, 199–204. [Google Scholar] [CrossRef] [PubMed]
- Fortune, B.; Burgoyne, C.F.; Cull, G.; Reynaud, J.; Wang, L. Onset and progression of peripapillary retinal nerve fiber layer (RNFL) retardance changes occur earlier than RNFL thickness changes in experimental glaucoma. Investig. Ophthalmol. Vis. Sci. 2013, 54, 5653–5661. [Google Scholar] [CrossRef] [PubMed]
- Bussel, I.I.; Wollstein, G.; Schuman, J.S. OCT for glaucoma diagnosis, screening and detection of glaucoma progression. Br. J. Ophthalmol. 2014, 98, ii15–ii19. [Google Scholar] [CrossRef] [PubMed]
- Weinreb, R.N.; Zangwill, L.; Berry, C.C.; Bathija, R.; Sample, P.A. Detection of glaucoma with scanning laser polarimetry. Arch. Ophthalmol. 1998, 116, 1583–1589. [Google Scholar] [CrossRef] [PubMed]
- Klemm, M.; Rumberger, E.; Walter, A.; Richard, G. Quantifizierung der retinalen nervenfaserschichtdicke ein vergleich von laser-scanning-ophthalmoskopie, polarimetrie und optischer kohärenztomographie bei gesunden und glaukomkranken augen. Der Ophthalmologe 2001, 98, 832–843. [Google Scholar] [CrossRef] [PubMed]
- Knighton, R.W.; Huang, X.-R.; Greenfield, D.S. Analytical model of scanning laser polarimetry for retinal nerve fiber layer assessment. Investig. Ophthalmol. Vis. Sci. 2002, 43, 383–392. [Google Scholar]
- Ducros, M.G.; Marsack, J.D.; Rylander, H.G.; Thomsen, S.L.; Milner, T.E. Primate retina imaging with polarization-sensitive optical coherence tomography. J. Opt. Soc. Am. A 2001, 18, 2945–2956. [Google Scholar] [CrossRef]
- Cense, B.; Chen, T.C.; Park, B.H.; Pierce, M.C.; de Boer, J.F. Thickness and birefringence of healthy retinal nerve fiber layer tissue measured with polarization-sensitive optical coherence tomography. Investig. Ophthalmol. Vis. Sci. 2004, 45, 2606–2612. [Google Scholar] [CrossRef] [PubMed]
- Yamanari, M.; Miura, M.; Makita, S.; Yatagai, T.; Yasuno, Y. Phase retardation measurement of retinal nerve fiber layer by polarization-sensitive spectral-domain optical coherence tomography and scanning laser polarimetry. J. Biomed. Opt. 2008, 13, 014013. [Google Scholar] [CrossRef] [PubMed]
- Götzinger, E.; Pircher, M.; Baumann, B.; Hirn, C.; Vass, C.; Hitzenberger, C. Retinal nerve fiber layer birefringence evaluated with polarization sensitive spectral domain OCT and scanning laser polarimetry: A comparison. J. Biophotonics 2008, 1, 129–139. [Google Scholar] [CrossRef] [PubMed]
- Götzinger, E.; Pircher, M.; Baumann, B.; Hirn, C.; Vass, C.; Hitzenberger, C.K. Analysis of the origin of atypical scanning laser polarimetry patterns by polarization-sensitive optical coherence tomography. Investig. Ophthalmol. Vis. Sci. 2008, 49, 5366–5372. [Google Scholar] [CrossRef] [PubMed]
- Zotter, S.; Pircher, M.; Götzinger, E.; Torzicky, T.; Yoshida, H.; Hirose, F.; Holzer, S.; Kroisamer, J.; Vass, C.; Schmidt-Erfurth, U. Measuring retinal nerve fiber layer birefringence, retardation, and thickness using wide-field, high-speed polarization sensitive spectral domain OCT. Investig. Ophthalmol. Vis. Sci. 2013, 54, 72–84. [Google Scholar] [CrossRef] [PubMed]
- Pocock, G.M.; Aranibar, R.G.; Kemp, N.J.; Specht, C.S.; Markey, M.K.; Rylander, H.G. The relationship between retinal ganglion cell axon constituents and retinal nerve fiber layer birefringence in the primate. Investig. Ophthalmol. Vis. Sci. 2009, 50, 5238–5246. [Google Scholar] [CrossRef] [PubMed]
- Dwelle, J.; Liu, S.; Wang, B.; McElroy, A.; Ho, D.; Markey, M.K.; Milner, T.; Rylander, H.G. Thickness, phase retardation, birefringence, and reflectance of the retinal nerve fiber layer in normal and glaucomatous non-human primates. Investig. Ophthalmol. Vis. Sci. 2012, 53, 4380–4395. [Google Scholar] [CrossRef] [PubMed]
- Fialová, S.; Augustin, M.; Fischak, C.; Schmetterer, L.; Handschuh, S.; Glösmann, M.; Pircher, M.; Hitzenberger, C.K.; Baumann, B. Posterior rat eye during acute intraocular pressure elevation studied using polarization sensitive optical coherence tomography. Biomed. Opt. Express 2017, 8, 298–314. [Google Scholar] [CrossRef] [PubMed]
- Sugita, M.; Pircher, M.; Zotter, S.; Baumann, B.; Roberts, P.; Makihira, T.; Tomatsu, N.; Sato, M.; Vass, C.; Hitzenberger, C.K. Retinal nerve fiber bundle tracing and analysis in human eye by polarization sensitive OCT. Biomed. Opt. Express 2015, 6, 1030–1054. [Google Scholar] [CrossRef] [PubMed]
- Pircher, M.; Götzinger, E.; Leitgeb, R.; Sattmann, H.; Findl, O.; Hitzenberger, C.K. Imaging of polarization properties of human retina in vivo with phase resolved transversal PS-OCT. Opt. Express 2004, 12, 5940–5951. [Google Scholar] [CrossRef] [PubMed]
- Pircher, M.; Götzinger, E.; Findl, O.; Michels, S.; Geitzenauer, W.; Leydolt, C.; Schmidt-Erfurth, U.; Hitzenberger, C.K. Human macula investigated in vivo with polarization-sensitive optical coherence tomography. Investig. Ophthalmol. Vis. Sci. 2006, 47, 5487–5494. [Google Scholar] [CrossRef] [PubMed]
- Baumann, B.; Götzinger, E.; Pircher, M.; Hitzenberger, C.K. Measurements of depolarization distribution in the healthy human macula by polarization sensitive OCT. J. Biophotonics 2009, 2, 426–434. [Google Scholar] [CrossRef] [PubMed]
- Schütze, C.; Ritter, M.; Blum, R.; Zotter, S.; Baumann, B.; Pircher, M.; Hitzenberger, C.K.; Schmidt-Erfurth, U. Retinal pigment epithelium findings in patients with albinism using wide-field polarization-sensitive optical coherence tomography. Retina 2014, 34, 2208–2217. [Google Scholar] [CrossRef] [PubMed]
- Ahlers, C.; Götzinger, E.; Pircher, M.; Golbaz, I.; Prager, F.; Schütze, C.; Baumann, B.; Hitzenberger, C.K.; Schmidt-Erfurth, U. Imaging of the retinal pigment epithelium in age-related macular degeneration using polarization-sensitive optical coherence tomography. Investig. Ophthalmol. Vis. Sci. 2010, 51, 2149–2157. [Google Scholar] [CrossRef] [PubMed]
- Michels, S.; Pircher, M.; Geitzenauer, W.; Simader, C.; Götzinger, E.; Findl, O.; Schmidt-Erfurth, U.; Hitzenberger, C. Value of polarisation-sensitive optical coherence tomography in diseases affecting the retinal pigment epithelium. Br. J. Ophthalmol. 2008, 92, 204–209. [Google Scholar] [CrossRef] [PubMed]
- Schlanitz, F.G.; Baumann, B.; Kundi, M.; Sacu, S.; Baratsits, M.; Scheschy, U.; Shahlaee, A.; Mittermüller, T.J.; Montuoro, A.; Roberts, P. Drusen volume development over time and its relevance to the course of age-related macular degeneration. Br. J. Ophthalmol. 2016, 101, 198–203. [Google Scholar] [CrossRef] [PubMed]
- Schütze, C.; Bolz, M.; Sayegh, R.; Baumann, B.; Pircher, M.; Götzinger, E.; Hitzenberger, C.K.; Schmidt-Erfurth, U. Lesion size detection in geographic atrophy by polarization-sensitive optical coherence tomography and correlation to conventional imaging techniques. Investig. Ophthalmol. Vis. Sci. 2013, 54, 739–745. [Google Scholar] [CrossRef] [PubMed]
- Sayegh, R.G.; Zotter, S.; Roberts, P.K.; Kandula, M.M.; Sacu, S.; Kreil, D.P.; Baumann, B.; Pircher, M.; Hitzenberger, C.K.; Schmidt-Erfurth, U. Polarization-sensitive optical coherence tomography and conventional retinal imaging strategies in assessing foveal integrity in geographic atrophy. Investig. Ophthalmol. Vis. Sci. 2015, 56, 5246–5255. [Google Scholar] [CrossRef] [PubMed]
- Roberts, P.; Sugita, M.; Deák, G.; Baumann, B.; Zotter, S.; Pircher, M.; Sacu, S.; Hitzenberger, C.K.; Schmidt-Erfurth, U. Automated identification and quantification of subretinal fibrosis in neovascular age-related macular degeneration using polarization-sensitive OCT. Investig. Ophthalmol. Vis. Sci. 2016, 57, 1699–1705. [Google Scholar] [CrossRef] [PubMed]
- Roberts, P.; Baumann, B.; Lammer, J.; Gerendas, B.; Kroisamer, J.; Bühl, W.; Pircher, M.; Hitzenberger, C.K.; Schmidt-Erfurth, U.; Sacu, S. Retinal pigment epithelial features in central serous chorioretinopathy identified by polarization-sensitive optical coherence tomography. Investig. Ophthalmol. Vis. Sci. 2016, 57, 1595–1603. [Google Scholar] [CrossRef] [PubMed]
- Miura, M.; Yamanari, M.; Iwasaki, T.; Elsner, A.E.; Makita, S.; Yatagai, T.; Yasuno, Y. Imaging polarimetry in age-related macular degeneration. Investig. Ophthalmol. Vis. Sci. 2008, 49, 2661–2667. [Google Scholar] [CrossRef] [PubMed]
- Schütze, C.; Wedl, M.; Baumann, B.; Pircher, M.; Hitzenberger, C.K.; Schmidt-Erfurth, U. Progression of retinal pigment epithelial atrophy in antiangiogenic therapy of neovascular age-related macular degeneration. Am. J. Ophthalmol. 2015, 159, 1100–1114. [Google Scholar] [CrossRef] [PubMed]
- Ritter, M.; Zotter, S.; Schmidt, W.M.; Bittner, R.E.; Deak, G.G.; Pircher, M.; Sacu, S.; Hitzenberger, C.K.; Schmidt-Erfurth, U.M. Characterization of stargardt disease using polarization-sensitive optical coherence tomography and fundus autofluorescence imaging. Investig. Ophthalmol. Vis. Sci. 2013, 54, 6416–6425. [Google Scholar] [CrossRef] [PubMed]
- Schütze, C.; Ahlers, C.; Pircher, M.; Baumann, B.; Götzinger, E.; Prager, F.; Matt, G.; Sacu, S.; Hitzenberger, C.K.; Schmidt-Erfurth, U. Morphologic characteristics of idiopathic juxtafoveal telangiectasia using spectral-domain and polarization-sensitive optical coherence tomography. Retina 2012, 32, 256–264. [Google Scholar] [CrossRef] [PubMed]
- Götzinger, E.; Pircher, M.; Dejaco-Ruhswurm, I.; Kaminski, S.; Skorpik, C.; Hitzenberger, C.K. Imaging of birefringent properties of keratoconus corneas by polarization-sensitive optical coherence tomography. Investig. Ophthalmol. Vis. Sci. 2007, 48, 3551–3558. [Google Scholar] [CrossRef] [PubMed]
- Ju, M.J.; Tang, S. Usage of polarization-sensitive optical coherence tomography for investigation of collagen cross-linking. J. Biomed. Opt. 2015, 20, 046001. [Google Scholar] [CrossRef] [PubMed]
- Fukuda, S.; Beheregaray, S.; Kasaragod, D.; Hoshi, S.; Kishino, G.; Ishii, K.; Yasuno, Y.; Oshika, T. Noninvasive evaluation of phase retardation in blebs after glaucoma surgery using anterior segment polarization-sensitive optical coherence tomography. Investig. Ophthalmol. Vis. Sci. 2014, 55, 5200–5206. [Google Scholar] [CrossRef] [PubMed]
- Miura, M.; Kawana, K.; Iwasaki, T.; Kiuchi, T.; Oshika, T.; Mori, H.; Yamanari, M.; Makita, S.; Yatagai, T.; Yasuno, Y. Three-dimensional anterior segment optical coherence tomography of filtering blebs after trabeculectomy. J. Glaucoma 2008, 17, 193–196. [Google Scholar] [CrossRef] [PubMed]
- Lim, Y.; Yamanari, M.; Fukuda, S.; Kaji, Y.; Kiuchi, T.; Miura, M.; Oshika, T.; Yasuno, Y. Birefringence measurement of cornea and anterior segment by office-based polarization-sensitive optical coherence tomography. Biomed. Opt. Express 2011, 2, 2392–2402. [Google Scholar] [CrossRef] [PubMed]
- Iwasaki, T. Polarization-sensitive optical coherence tomography of necrotizing scleritis. Ophthalmic Surg. Lasers Imaging Retin. 2009, 40, 607. [Google Scholar]
- Yamanari, M.; Nagase, S.; Fukuda, S.; Ishii, K.; Tanaka, R.; Yasui, T.; Oshika, T.; Miura, M.; Yasuno, Y. Scleral birefringence as measured by polarization-sensitive optical coherence tomography and ocular biometric parameters of human eyes in vivo. Biomed. Opt. Express 2014, 5, 1391–1402. [Google Scholar] [CrossRef] [PubMed]
- Pircher, M.; Goetzinger, E.; Leitgeb, R.; Hitzenberger, C.K. Three dimensional polarization sensitive OCT of human skin in vivo. Opt. Express 2004, 12, 3236–3244. [Google Scholar] [CrossRef] [PubMed]
- Mogensen, M.; Morsy, H.A.; Thrane, L.; Jemec, G.B.E. Morphology and epidermal thickness of normal skin imaged by optical coherence tomography. Dermatology 2008, 217, 14–20. [Google Scholar] [CrossRef] [PubMed]
- Lee, A.M.D.; Cahill, L.; Liu, K.; MacAulay, C.; Poh, C.; Lane, P. Wide-field in vivo oral OCT imaging. Biomed. Opt. Express 2015, 6, 2664–2674. [Google Scholar] [CrossRef] [PubMed]
- Burns, J.A.; Zeitels, S.M.; Anderson, R.R.; Kobler, J.B.; Pierce, M.C.; de Boer, J.F. Imaging the mucosa of the human vocal fold with optical coherence tomography. Ann. Otol. Rhinol. Laryngol. 2005, 114, 671–676. [Google Scholar] [CrossRef] [PubMed]
- Bonesi, M.; Sattmann, H.; Torzicky, T.; Zotter, S.; Baumann, B.; Pircher, M.; Götzinger, E.; Eigenwillig, C.; Wieser, W.; Huber, R. High-speed polarization sensitive optical coherence tomography scan engine based on Fourier domain mode locked laser: Erratum. Biomed. Opt. Express 2013, 4, 241–244. [Google Scholar] [CrossRef]
- Sakai, S.; Yamanari, M.; Lim, Y.; Nakagawa, N.; Yasuno, Y. In vivo evaluation of human skin anisotropy by polarization-sensitive optical coherence tomography. Biomed. Opt. Express 2011, 2, 2623–2631. [Google Scholar] [CrossRef] [PubMed]
- Jiao, S.; Yu, W.; Stoica, G.; Wang, L.V. Contrast mechanisms in polarization-sensitive Mueller-matrix optical coherence tomography and application in burn imaging. Appl. Opt. 2003, 42, 5191–5197. [Google Scholar] [CrossRef] [PubMed]
- Pierce, M.C.; Sheridan, R.L.; Park, B.H.; Cense, B.; de Boer, J.F. Collagen denaturation can be quantified in burned human skin using polarization-sensitive optical coherence tomography. Burns 2004, 30, 511–517. [Google Scholar] [CrossRef] [PubMed]
- Oh, J.-T.; Lee, S.-W.; Kim, Y.-S.; Suhr, K.-B.; Kim, B.-M. Quantification of the wound healing using polarization-sensitive optical coherence tomography. J. Biomed. Opt. 2006, 11, 041124. [Google Scholar] [CrossRef] [PubMed]
- Sahu, K.; Verma, Y.; Sharma, M.; Rao, K.; Gupta, P. Non-invasive assessment of healing of bacteria infected and uninfected wounds using optical coherence tomography. Skin Res. Technol. 2010, 16, 428–437. [Google Scholar] [CrossRef] [PubMed]
- Strasswimmer, J.; Pierce, M.C.; Park, B.H.; Neel, V.; de Boer, J.F. Polarization-sensitive optical coherence tomography of invasive basal cell carcinoma. J. Biomed. Opt. 2004, 9, 292–298. [Google Scholar] [CrossRef] [PubMed]
- Duan, L.; Marvdashti, T.; Lee, A.; Tang, J.Y.; Ellerbee, A.K. Automated identification of basal cell carcinoma by polarization-sensitive optical coherence tomography. Biomed. Opt. Express 2014, 5, 3717–3729. [Google Scholar] [CrossRef] [PubMed]
- Burns, J.A.; Kim, K.H.; deBoer, J.F.; Anderson, R.R.; Zeitels, S.M. Polarization-sensitive optical coherence tomography imaging of benign and malignant laryngeal lesions: An in vivo study. Otolaryngol. Head Neck Surg. 2011, 145, 91–99. [Google Scholar] [CrossRef] [PubMed]
- Wang, T.; Yang, Y.; Zhu, Q. A three-parameter logistic model to characterize ovarian tissue using polarization-sensitive optical coherence tomography. Biomed. Opt. Express 2013, 4, 772–777. [Google Scholar] [CrossRef] [PubMed]
- Patel, R.; Khan, A.; Quinlan, R.; Yaroslavsky, A.N. Polarization-sensitive multimodal imaging for detecting breast cancer. Cancer Res. 2014, 74, 4685–4693. [Google Scholar] [CrossRef] [PubMed]
- South, F.A.; Chaney, E.J.; Marjanovic, M.; Adie, S.G.; Boppart, S.A. Differentiation of ex vivo human breast tissue using polarization-sensitive optical coherence tomography. Biomed. Opt. Express 2014, 5, 3417–3426. [Google Scholar] [CrossRef] [PubMed]
- Xie, T.; Xia, Y.; Guo, S.; Hoover, P.; Chen, Z.; Peavy, G.M. Topographical variations in the polarization sensitivity of articular cartilage as determined by polarization-sensitive optical coherence tomography and polarized light microscopy. J. Biomed. Opt. 2008, 13, 054034. [Google Scholar] [CrossRef] [PubMed]
- Martin, S.; Patel, N.; Adams, S.; Roberts, M.; Plummer, S.; Stamper, D.; Fujimoto, J.; Brezinski, M. New technology for assessing microstructural components of tendons and ligaments. Int. Orthop. 2003, 27, 184–189. [Google Scholar] [PubMed]
- Ahearne, M.; Bagnaninchi, P.O.; Yang, Y.; El Haj, A.J. Online monitoring of collagen fibre alignment in tissue-engineered tendon by PSOCT. J. Tissue Eng. Regen. Med. 2008, 2, 521–524. [Google Scholar] [CrossRef] [PubMed]
- Bagnaninchi, P.; Yang, Y.; Bonesi, M.; Maffulli, G.; Phelan, C.; Meglinski, I.; El Haj, A.; Maffulli, N. In-depth imaging and quantification of degenerative changes associated with achilles ruptured tendons by polarization-sensitive optical coherence tomography. Phys. Med. Biol. 2010, 55, 3777. [Google Scholar] [CrossRef] [PubMed]
- Yang, Y.; Rupani, A.; Bagnaninchi, P.; Wimpenny, I.; Weightman, A. Study of optical properties and proteoglycan content of tendons by polarization sensitive optical coherence tomography. J. Biomed. Opt. 2012, 17, 081417. [Google Scholar] [CrossRef] [PubMed]
- Pasquesi, J.J.; Schlachter, S.C.; Boppart, M.D.; Chaney, E.; Kaufman, S.J.; Boppart, S.A. In vivo detection of exercise-induced ultrastructural changes in genetically-altered murine skeletal muscle using polarization-sensitive optical coherence tomography. Opt. Express 2006, 14, 1547–1556. [Google Scholar] [PubMed]
- Yang, X.; Chin, L.; Klyen, B.R.; Shavlakadze, T.; McLaughlin, R.A.; Grounds, M.D.; Sampson, D.D. Quantitative assessment of muscle damage in the mdx mouse model of duchenne muscular dystrophy using polarization-sensitive optical coherence tomography. J. Appl. Physiol. 2013, 115, 1393–1401. [Google Scholar] [CrossRef] [PubMed]
- Matcher, S.J. What can biophotonics tell us about the 3D microstructure of articular cartilage? Quant. Imaging Med. Surg. 2015, 5, 143–158. [Google Scholar] [PubMed]
- Chu, C.R.; Izzo, N.J.; Irrgang, J.J.; Ferretti, M.; Studer, R.K. Clinical diagnosis of potentially treatable early articular cartilage degeneration using optical coherence tomography. J. Biomed. Opt. 2007, 12, 051703. [Google Scholar] [CrossRef] [PubMed]
- Ugryumova, N.; Jacobs, J.; Bonesi, M.; Matcher, S.J. Novel optical imaging technique to determine the 3-d orientation of collagen fibers in cartilage: Variable-incidence angle polarization-sensitive optical coherence tomography. Osteoarthr. Cartil. 2009, 17, 33–42. [Google Scholar] [CrossRef] [PubMed]
- Kasaragod, D.K.; Lu, Z.; Jacobs, J.; Matcher, S.J. Experimental validation of an extended Jones matrix calculus model to study the 3D structural orientation of the collagen fibers in articular cartilage using polarization-sensitive optical coherence tomography. Biomed. Opt. Express 2012, 3, 378–387. [Google Scholar] [CrossRef] [PubMed]
- Patel, N.A.; Zoeller, J.; Stamper, D.L.; Fujimoto, J.G.; Brezinski, M.E. Monitoring osteoarthritis in the rat model using optical coherence tomography. IEEE Trans. Med. Imaging 2005, 24, 155–159. [Google Scholar] [CrossRef] [PubMed]
- Li, X.; Martin, S.; Pitris, C.; Ghanta, R.; Stamper, D.L.; Harman, M.; Fujimoto, J.G.; Brezinski, M.E. High-resolution optical coherence tomographic imaging of osteoarthritic cartilage during open knee surgery. Arthritis Res. Ther. 2005, 7, R318. [Google Scholar] [CrossRef] [PubMed]
- Nadkarni, S.K. Optical measurement of arterial mechanical properties: From atherosclerotic plaque initiation to rupture. J. Biomed. Opt. 2013, 18, 121507. [Google Scholar] [CrossRef] [PubMed]
- Kuo, W.-C.; Hsiung, M.-W.; Shyu, J.-J.; Chou, N.-K.; Yang, P.-N. Assessment of arterial characteristics in human atherosclerosis by extracting optical properties from polarization-sensitive optical coherence tomography. Opt. Express 2008, 16, 8117–8125. [Google Scholar] [CrossRef] [PubMed]
- Giattina, S.D.; Courtney, B.K.; Herz, P.R.; Harman, M.; Shortkroff, S.; Stamper, D.L.; Liu, B.; Fujimoto, J.G.; Brezinski, M.E. Assessment of coronary plaque collagen with polarization sensitive optical coherence tomography (PS-OCT). Int. J. Cardiol. 2006, 107, 400–409. [Google Scholar] [CrossRef] [PubMed]
- Nadkarni, S.K.; Bouma, B.E.; de Boer, J.; Tearney, G.J. Evaluation of collagen in atherosclerotic plaques: The use of two coherent laser-based imaging methods. Lasers Med. Sci. 2009, 24, 439–445. [Google Scholar] [CrossRef] [PubMed]
- Nadkarni, S.K.; Pierce, M.C.; Park, B.H.; de Boer, J.F.; Whittaker, P.; Bouma, B.E.; Bressner, J.E.; Halpern, E.; Houser, S.L.; Tearney, G.J. Measurement of collagen and smooth muscle cell content in atherosclerotic plaques using polarization-sensitive optical coherence tomography. J. Am. Coll. Cardiol. 2007, 49, 1474–1481. [Google Scholar] [CrossRef] [PubMed]
- Smith, R.M.; Black, A.J.; Velamakanni, S.S.; Akkin, T.; Tolkacheva, E.G. Visualizing the complex 3D geometry of the perfusion border zone in isolated rabbit heart. Appl. Opt. 2012, 51, 2713–2721. [Google Scholar] [CrossRef] [PubMed]
- Sun, C.-W.; Wang, Y.-M.; Lu, L.-S.; Lu, C.-W.; Hsu, I.-J.; Tsai, M.-T.; Yang, C.-C.; Kiang, Y.-W.; Wu, C.-C. Myocardial tissue characterization based on a polarization-sensitive optical coherence tomography system with an ultrashort pulsed laser. J. Biomed. Opt. 2006, 11, 054016. [Google Scholar] [CrossRef] [PubMed]
- Baumgartner, A.; Hitzenberger, C.K.; Dichtl, S.; Sattmann, H.; Moritz, A.; Sperr, W.; Fercher, A.F. Optical Coherence Tomography of Dental Structures. SPIE Proc. 1998, 3248, 130–136. [Google Scholar]
- Baumgartner, A.; Dichtl, S.; Hitzenberger, C.; Sattmann, H.; Robl, B.; Moritz, A.; Fercher, A.; Sperr, W. Polarization–sensitive optical coherence tomography of dental structures. Caries Res. 1999, 34, 59–69. [Google Scholar] [CrossRef]
- Everett, M.J.; Colston, B.W., Jr.; Sathyam, U.S.; Da Silva, L.B.; Fried, D.; Featherstone, J.D. Noninvasive diagnosis of early caries with polarization-sensitive optical coherence tomography (PS-OCT). SPIE Proc. 1999, 3593, 177–182. [Google Scholar]
- Manesh, S.K.; Darling, C.L.; Fried, D. Nondestructive assessment of dentin demineralization using polarization-sensitive optical coherence tomography after exposure to fluoride and laser irradiation. J. Biomed. Mater. Res. Part B Appl. Biomater. 2009, 90, 802–812. [Google Scholar] [CrossRef] [PubMed]
- Le, M.H.; Darling, C.L.; Fried, D. Automated analysis of lesion depth and integrated reflectivity in PS-OCT scans of tooth demineralization. Lasers Surg. Med. 2010, 42, 62–68. [Google Scholar] [CrossRef] [PubMed]
- Louie, T.; Lee, C.; Hsu, D.; Hirasuna, K.; Manesh, S.; Staninec, M.; Darling, C.L.; Fried, D. Clinical assessment of early tooth demineralization using polarization sensitive optical coherence tomography. Lasers Surg. Med. 2010, 42, 898–905. [Google Scholar] [CrossRef] [PubMed]
- Tom, H.; Simon, J.C.; Chan, K.H.; Darling, C.L.; Fried, D. Near-infrared imaging of demineralization under sealants. J. Biomed. Opt. 2014, 19, 077003. [Google Scholar] [CrossRef] [PubMed]
- Tom, H.; Chan, K.H.; Darling, C.L.; Fried, D. Near-IR image-guided laser ablation of demineralization on tooth occlusal surfaces. Lasers Surg. Med. 2016, 48, 52–61. [Google Scholar] [CrossRef] [PubMed]
- Lee, C.; Darling, C.L.; Fried, D. Polarization-sensitive optical coherence tomographic imaging of artificial demineralization on exposed surfaces of tooth roots. Dent. Mater. 2009, 25, 721–728. [Google Scholar] [CrossRef] [PubMed]
- Can, A.M.; Darling, C.L.; Ho, C.; Fried, D. Non-destructive assessment of inhibition of demineralization in dental enamel irradiated by a λ = 9.3-µm CO2 laser at ablative irradiation intensities with PS-OCT. Lasers Surg. Med. 2008, 40, 342–349. [Google Scholar] [CrossRef] [PubMed]
- Fried, D.; Xie, J.; Shafi, S.; Featherstone, J.D.; Breunig, T.M.; Le, C. Imaging caries lesions and lesion progression with polarization sensitive optical coherence tomography. J. Biomed. Opt. 2002, 7, 618–627. [Google Scholar] [CrossRef] [PubMed]
- Jones, R.S.; Staninec, M.; Fried, D. Imaging artificial caries under composite sealants and restorations. J. Biomed. Opt. 2004, 9, 1297–1304. [Google Scholar] [CrossRef] [PubMed]
- Simon, J.C.; Lucas, S.A.; Lee, R.C.; Darling, C.L.; Staninec, M.; Vaderhobli, R.; Pelzner, R.; Fried, D. Near-infrared imaging of secondary caries lesions around composite restorations at wavelengths from 1300–1700-nm. Dent. Mater. 2016, 32, 587–595. [Google Scholar] [CrossRef] [PubMed]
- Jones, R.; Fried, D. Remineralization of enamel caries can decrease optical reflectivity. J. Dent. Res. 2006, 85, 804–808. [Google Scholar] [CrossRef] [PubMed]
- Lee, R.C.; Kang, H.; Darling, C.L.; Fried, D. Automated assessment of the remineralization of artificial enamel lesions with polarization-sensitive optical coherence tomography. Biomed. Opt. Express 2014, 5, 2950–2962. [Google Scholar] [CrossRef] [PubMed]
- De Boer, J.F.; Srinivas, S.M.; Park, B.H.; Pham, T.H.; Chen, Z.; Milner, T.E.; Nelson, J.S. Polarization effects in optical coherence tomography of various biological tissues. IEEE J. Sel. Top. Quantum Electron. 1999, 5, 1200–1204. [Google Scholar] [CrossRef] [PubMed]
- Islam, M.S.; Oliveira, M.C.; Wang, Y.; Henry, F.P.; Randolph, M.A.; Park, B.H.; de Boer, J.F. Extracting structural features of rat sciatic nerve using polarization-sensitive spectral domain optical coherence tomography. J. Biomed. Opt. 2012, 17, 056012. [Google Scholar] [CrossRef] [PubMed]
- Henry, F.P.; Wang, Y.; Rodriguez, C.L.R.; Randolph, M.A.; Rust, E.A.Z.; Winograd, J.M.; de Boer, J.F.; Park, B.H. In vivo optical microscopy of peripheral nerve myelination with polarization sensitive-optical coherence tomography. J. Biomed. Opt. 2015, 20, 046002. [Google Scholar] [CrossRef] [PubMed]
- Yoon, Y.; Jeon, S.H.; Park, Y.H.; Jang, W.H.; Lee, J.Y.; Kim, K.H. Visualization of prostatic nerves by polarization-sensitive optical coherence tomography. Biomed. Opt. Express 2016, 7, 3170–3183. [Google Scholar] [CrossRef] [PubMed]
- Wang, H.; Black, A.J.; Zhu, J.; Stigen, T.W.; Al-Qaisi, M.K.; Netoff, T.I.; Abosch, A.; Akkin, T. Reconstructing micrometer-scale fiber pathways in the brain: Multi-contrast optical coherence tomography based tractography. Neuroimage 2011, 58, 984–992. [Google Scholar] [CrossRef] [PubMed]
- Wang, H.; Zhu, J.; Akkin, T. Serial optical coherence scanner for large-scale brain imaging at microscopic resolution. Neuroimage 2014, 84, 1007–1017. [Google Scholar] [CrossRef] [PubMed]
- Wang, H.; Zhu, J.F.; Reuter, M.; Vinke, L.N.; Yendiki, A.; Boas, D.A.; Fischl, B.; Akkin, T. Cross-validation of serial optical coherence scanning and diffusion tensor imaging: A study on neural fiber maps in human medulla oblongata. Neuroimage 2014, 100, 395–404. [Google Scholar] [CrossRef] [PubMed]
- Baumann, B.; Woehrer, A.; Ricken, G.; Augustin, M.; Mitter, C.; Pircher, M.; Kovacs, G.G.; Hitzenberger, C.K. Visualization of neuritic plaques in Alzheimer’s disease by polarization-sensitive optical coherence microscopy. Sci. Rep. 2017, 7, 43477. [Google Scholar] [CrossRef] [PubMed]
- Wei, Q.; Song, H.-M.; Leonov, A.P.; Hale, J.A.; Oh, D.; Ong, Q.K.; Ritchie, K.; Wei, A. Gyromagnetic imaging: Dynamic optical contrast using gold nanostars with magnetic cores. J. Am. Chem. Soc. 2009, 131, 9728–9734. [Google Scholar] [CrossRef] [PubMed]
- Chhetri, R.K.; Kozek, K.A.; Johnston-Peck, A.C.; Tracy, J.B.; Oldenburg, A.L. Imaging three-dimensional rotational diffusion of plasmon resonant gold nanorods using polarization-sensitive optical coherence tomography. Phys. Rev. E 2011, 83, 040903. [Google Scholar] [CrossRef] [PubMed]
- Oldenburg, A.L.; Chhetri, R.K.; Cooper, J.M.; Wu, W.-C.; Troester, M.A.; Tracy, J.B. Motility-, autocorrelation-, and polarization-sensitive optical coherence tomography discriminates cells and gold nanorods within 3D tissue cultures. Opt. Lett. 2013, 38, 2923–2926. [Google Scholar] [CrossRef] [PubMed]
- Chhetri, R.K.; Blackmon, R.L.; Wu, W.-C.; Hill, D.B.; Button, B.; Casbas-Hernandez, P.; Troester, M.A.; Tracy, J.B.; Oldenburg, A.L. Probing biological nanotopology via diffusion of weakly constrained plasmonic nanorods with optical coherence tomography. Proc. Natl. Acad. Sci. USA 2014, 111, E4289–E4297. [Google Scholar] [CrossRef] [PubMed]
- Wiesauer, K.; Pircher, M.; Goetzinger, E.; Hitzenberger, C.; Engelke, R.; Ahrens, G.; Gruetzner, G.; Stifter, D. Transversal ultrahigh-resolution polarization-sensitive optical coherence tomography for strain mapping in materials. Opt. Express 2006, 14, 5945–5953. [Google Scholar] [CrossRef] [PubMed]
- Stifter, D. Beyond biomedicine: A review of alternative applications and developments for optical coherence tomography. Appl. Phys. B 2007, 88, 337–357. [Google Scholar] [CrossRef]
- Oh, J.-T.; Kim, S.-W. Polarization-sensitive optical coherence tomography for photoelasticity testing of glass/epoxy composites. Opt. Express 2003, 11, 1669–1676. [Google Scholar] [CrossRef] [PubMed]
- Stifter, D.; Leiss-Holzinger, E.; Major, Z.; Baumann, B.; Pircher, M.; Götzinger, E.; Hitzenberger, C.K.; Heise, B. Dynamic optical studies in materials testing with spectral-domain polarization-sensitive optical coherence tomography. Opt. Express 2010, 18, 25712–25725. [Google Scholar] [CrossRef] [PubMed]
Figure 1.
PS-OCT in the scientific literature. Results from a literature search for “polarization sensitive optical coherence tomography” and “polarization sensitive optical coherence tomography” on PubMed (https://0-www-ncbi-nlm-nih-gov.brum.beds.ac.uk/pubmed/, accessed on 5 January 2017). (a) Number of documents published per year since 1997; (b) Break-up of the publications into seven medical and one technical area. The latter includes PS-OCT measurements of technical samples and phantoms; (c) Absolute numbers of publications per year are shown for the eight fields of application; (d) Time course of the relative share of the eight subgroups. The color legend in (b) also applies to (c) and (d).

Figure 2.
Polarization of light. (a) Jones vectors. Depending on the amplitudes Ax,y and the relative phase retardation δ of the transverse light wave components oscillating in x and z direction, different polarization states such as linear for δ = 0° and δ = 180°, circular for δ = ±45° and equal amplitudes Ax = Ay, or elliptical for all other combinations can be described. The vector e = [Ax, Ay exp(iδ)]T is called Jones vector; (b) Stokes–Müller representation of polarization states. Vectors in the 3D space spanned by horizontal/vertical linear state, +45°/−45° linear state, and right-/left-hand circular state are called Stokes vectors. Stokes vectors (red) describe any elliptical polarization state and their length scales with intensity of polarized light. The unit sphere is called a Poincaré sphere; (c) The interaction of a Jones vector with a sample can be described by multiplication with a Jones matrix describing the tissue properties; (d) Likewise, the interaction of a Stokes vector with a sample can be calculated by multiplying with a so-called Müller matrix describing the sample polarization properties.

Figure 3.
Depolarization measurement by PS-OCT. (a) Stokes vectors are plotted in Poincaré spheres for polarization preserving tissue (left, pink window) and for depolarizing tissue (right, blue window). Different Stokes vectors (red) correspond to the polarization states in adjacent image locations. In order to assess polarization scrambling within the evaluation kernels represented by the pink and blue rectangles overlaid on the OCT reflectivity image (center) of a rodent retina, the length of the average Stokes vectors is computed; (b) The length of the average Stokes vector (shown in blue in the Poincaré spheres) is decreased in case of depolarization. The DOPU image (center) assigns a color to the DOPU value of each pixel. The color map plots values from DOPU = 0 (blue, completely depolarized) to DOPU = 1 (red, uniform polarization). Pixels with low reflectivity (typically up to several decibels above the noise level) are masked in black. Note that the resolution in the DOPU image is slightly reduced by convolution with the evaluation kernel. In the DOPU image, most retinal structures appear to be polarization preserving, while pigmented structures such as the retinal pigment epithelium and the choroid scramble the polarization.

Figure 4.
Basic schemes for PS-OCT. (a) Basic scheme of OCT with a Michelson interferometer. (b) PS-OCT with a single circular input state; (c) PS-OCT based on probing with several input states; (d) PS-OCT based on a Mach–Zehnder interferometer with two input states generated by a polarization delay unit. See text for descriptions of different approaches. The grey arrows indicate the directions of light beams. Black pictograms indicate linear, circular, and elliptical polarization states. LS—light source, POL—polarizer, QWP—quarter wave plate, RM—reference mirror, L—lens, SAM—sample, PBS—polarizing beam splitter, DU—detection unit, POM—polarization modulator, PS1/PS2—polarization state 1/2, BS—beam splitter, Δz—path delay between polarization states, PDU—polarization delay unit.

Figure 5.
PS-OCT in the posterior eye. (a–d) PS-OCT of a patient with late-stage AMD (adapted with permission from [120], Optical Society of America, 2014). (a) Reflectivity B-scan; (b) DOPU B-scan (color map: 0–1); (c) Depolarization in the retinal pigment epithelium (RPE, red) and choroid (green) overlaid on reflectivity image; (d) Fundus map indicating thickness of depolarizing pixels at the level of the RPE; (e) Relation of DOPU and melanin density assessed by histology in RPE/choroid of rat eyes (adapted with permission from [26], ARVO, 2015). (f,g) PS-OCT based layer segmentation in an AMD patient with drusen (adapted with permission from [121], SPIE, 2010). (f) Reflectivity B-scan with segmented inner limiting membrane (blue), RPE (red), and Bruch’s membrane (green). Drusen can be observed as bumpy elevations of the retina at the RPE level; (g) Drusen thickness map; (h) Drusen characteristics assessed by PS-OCT (courtesy by Dr. F. G. Schlanitz, Medical University of Vienna, Austria). Depolarizing pixels are marked in red. (i,j) Birefringence in the retinal nerve fiber layer (RNFL) imaged by PS-OCT (adapted with permission from [18], Optical Society of America, 2014). (i) Fundus reflectivity map; (j) Fundus map showing increased phase retardation caused by the RNFL around the optic nerve head and by Henle’s fibers around the fovea.

Figure 6.
PS-OCT of the anterior eye. (a–e) PS-OCT of the cornea of a keratoconus patient (adapted with permission from [165], ARVO, 2007). (a) PS-OCT en-face image showing retardation at the posterior surface of the cornea. The red lines indicate the locations of the B-scans shown in (b–e); (b,c) Horizontal and vertical reflectivity B-scan images. Decreased corneal thickness can be observed in the center; (d,e) Corresponding retardation B-scans exhibiting irregular pattern. (f) PS-OCT of blebs in the anterior eye after glaucoma surgery (adapted with permission from [167], ARVO, 2014). Photographs (red lines indicate locations of OCT scans), phase retardation and intensity images with PS-OCT at one day, one week, and one month after surgery. Cases of partial increase of phase retardation after surgery. Arrows indicate irregular and abnormal phase retardation.

Figure 7.
PS-OCT of skin. (a–e) Cross-sectional PS-OCT image of human skin (adapted with permission from [176], Optical Society of America, 2013). (a) Scan location at the proximal interphalangeal joint of middle finger; (b) Reflectivity image. SC stratum corneum, D dermis, ED epidermis; (c) Retardation image. CLS “column” like structure; (d) Axis orientation image; (e) DOPU image. (f–j) Birefringence and vascular imaging of a hypertrophic scar and adjacent normal skin (adapted with permission from [106], P. Gong, 2014). (f) Photograph. Locations of PS-OCT scans are indicated by two blue squares; (g,h) Vasculature maximum intensity projections of the normal skin and scar, respectively; (i,j) En face birefringence maps of the normal skin and scar, respectively.

Figure 8.
PS-OCT of cancerous tissue. (a–d) PS-OCT of basal cell carcinoma in human skin (adapted with permission from [24], Optical Society of America, 2016). (a) Reflectance B-scan image. BCC indicates the basal cell carcinoma tumor position; (b) Linear retardance along the x–y direction; (c) Linear retardance along the ±45° directions; (d) Normalized differential depolarization index image. Scale bar is 0.5(x) × 0.3(z) mm. (e–j) Needle-based PS-OCT of breast cancer (reproduced with permission from [112], M. Villiger et al., 2016). Imaging was performed in grade 1 invasive ductal carcinoma (e–g) and grade 2 invasive ductal carcinoma (h,j). (e,h) Structural intensity (I), (f,i) overlay of tissue birefringence and intensity (I, Δn), and (g,j) matching histological section stained with hematoxylin and eosin. Scale bar in (e) is 1 mm and applies to panels (e–j).

Figure 9.
PS-OCT of tendon and cartilage. (a–c) First published PS-OCT images (adapted with permission from [8], Optical Society of America, 1997) showing birefringence of bovine tendon. (a) Fresh tendon; (b) Tendon after exposure to high-power laser irradiation. The banded structure appears disturbed compared to (a); (c) Color-coded intensity image; (d) PS-OCT optical phase retardation images at the various sites on a bovine tibia. The banded appearance in retardation images is indicative of high birefringence in some areas (adapted with permission from [188], G. M. Peavy, 2008).

Figure 10.
PS-OCT of cardiac tissue and vessels. (a–c) PS-OCT images of ex vivo chicken myocardium (adapted with permission from [14], Optical Society of America, 2001). (a) Intensity image; (b) Phase retardation image; (c) Image of fast axis distribution. (d–f) 3D visualization of a carotid arterial sample (adapted with permission from [70], Optical Society of America, 2015). (d) OCT intensity image; (e) Fiber orientation tractography; (f) Fiber alignment map in the vessel wall. Surface layers were partly removed in three sections to reveal OCT intensity and fiber orientation/alignment at three representative depths in the arterial wall. (g–r) PS-OCT images of fibrous plaques (adapted with permission from [205], Elsevier, 2007). (g–i) OCT intensity images; (j,k) Phase retardation images (scale range: 0–180°) showing high birefringence; (l) Retardation image of fibrous plaque showing black region corresponding to low birefringence below the luminal surface. (m–o) Picrosirius red stained histology section, showing orange-red fibers (thicker fibers), yellow-green (thinner fibers) and low collagen content in the plaque under polarized light microscopy, respectively; (p,q) Trichrome-stained histology images; (r) Corresponding histology section stained for α-smooth muscle actin shows numerous smooth muscle cells within the fibrous plaque. Scale bars are 500 μm.

Figure 11.
Dental PS-OCT. (a–c) PS-OCT tomograms of a carious lesion in enamel at the distal surface of a human molar (adapted with permission from [209], Karger Publishers, 1999). (a) Reflectivity image; (b) Phase retardation image; (c) Corresponding histologic section. (d–e) PS-OCT and transverse microradiography (TMR) of tooth demineralization (adapted with permission from [213], John Wiley and Sons, 2010). (d) PS-OCT image showing the cross-polarized signal; (e) Corresponding TMR. The area of demineralization has a strong cross-polarized signal in (d) and appears darker in (e).

Figure 12.
PS-OCT of neural structures. (a–d) PS-OCT of rat sciatic nerve two weeks post nerve crush (adapted with permission from [225], B. H. Park, 2015). (a) Intensity image; (b) PS-OCT retardation image; (c) Plot of average phase retardation per depth computed within the red lines shown in (b); (d) Histologic image. Toluidine blue staining for assessing the myelination state; (e–h) En face PS-OCT optic axis orientation maps quantitatively depict in-plane fiber orientations in the medulla (from [229] with permission by Elsevier). The color wheel shows the orientation values ranging between −90° and 90°. The brightness of colors in the images is determined by the en face retardance values. (i–k) PS-OCT imaging of neuritic plaques in post mortem cerebral cortex of an Alzheimer’s disease patient. (i) Rendering of 3D retardation data showing increased retardation in plaques. Color map range: 7–41° (reproduced with permission from [230], B. Baumann et al., 2017). (j) Reflectivity B-scan image; (k) Retardation B-scan image. The location of one plaque is marked by an orange arrow.

Figure 13.
Nonmedical applications of PS-OCT. (a–c) Transversal ultrahigh resolution PS-OCT images of the resist-wafer interface of a photoresist mold for a micromechanical wheel (adapted with permission from [235], Optical Society of America, 2006). (a) Intensity image; (b) PS-OCT retardation image. The arrows indicate highly strained areas at the teeth of the wheel; (c) Orientation of the slow optic axis (color-coded and displayed as vector-field scaled by the magnitude of the retardation); (d) Diffusion of gold nanorods (GNRs) in in vitro extracellular matrix models (adapted with permission from [234], A. Oldenburg,2014). Representative PS-OCT B-scan images showing cross-polarized signal of fibroblasts in collagen I: Matrigel versus cell seed density and incubation time show how GNRs provide positive contrast within the matrix between cells, whereas cells appear dark.

© 2017 by the author. Licensee MDPI, Basel, Switzerland. This article is an open access article distributed under the terms and conditions of the Creative Commons Attribution (CC BY) license (http://creativecommons.org/licenses/by/4.0/).
Share and Cite
MDPI and ACS Style
Baumann, B. Polarization Sensitive Optical Coherence Tomography: A Review of Technology and Applications. Appl. Sci. 2017, 7, 474. https://0-doi-org.brum.beds.ac.uk/10.3390/app7050474
AMA Style
Baumann B. Polarization Sensitive Optical Coherence Tomography: A Review of Technology and Applications. Applied Sciences. 2017; 7(5):474. https://0-doi-org.brum.beds.ac.uk/10.3390/app7050474
Chicago/Turabian StyleBaumann, Bernhard. 2017. "Polarization Sensitive Optical Coherence Tomography: A Review of Technology and Applications" Applied Sciences 7, no. 5: 474. https://0-doi-org.brum.beds.ac.uk/10.3390/app7050474
Note that from the first issue of 2016, this journal uses article numbers instead of page numbers. See further details here.