Article

Evaluating the Impact of the Sudden Collapse of Major Freeway Connectors on Rapid Transit and Adjacent Freeway Systems: San Francisco Bay Area Case Study

1
School of Civil, Environmental and Architectural Engineering, Korea University, 145 Anam-ro, Seongbuk-gu, Seoul 02841, Korea
2
California Department of Transportation, Operations, Oakland, CA 94612, USA
3
Department of Transportation Engineering, Keimyung University, 1095 Dalgubeol-daero, Dalseo-gu, Daegu 42601, Korea
4
Department of Civil and Environmental Engineering, Seoul National University, 1 Gwanak-ro, Gwanak-gu, Seoul 08826, Korea
*
Author to whom correspondence should be addressed.
Submission received: 14 June 2017 / Revised: 8 July 2017 / Accepted: 12 July 2017 / Published: 15 July 2017

Abstract

:
The early Sunday morning collapse of two sections of the multi-level freeway interchange, known as the MacArthur Maze, resulted in a month-long closure of the interchange, which connects several major California cities: San Francisco, Oakland, and Berkeley. This paper evaluates the impacts of this unplanned, extended closure on Bay Area Rapid Transit (BART) and the remaining freeway system based on empirical data and reports on the findings. Among the findings were that BART was instrumental in keeping commuters moving during the freeway repair. In addition, ridership counts at some stations remained significantly elevated after the repairs were completed. This may be due to the fact that many of the riders using those BART stations had not previously traveled via transit and, having discovered its convenience and benefits during the repair phase, continued to use BART even after the repairs. The impact of the closure on BART demand was not uniform across the stations.

1. Introduction

An elevated segment of one of the most heavily-traveled freeways in California’s San Francisco Bay Area collapsed on 29 April 2007 due to a fire caused by a tanker truck carrying 8600 gallons of unleaded gasoline. This event led to a complete closure of two sections of the elevated multi-level freeway interchange, known as the MacArthur Maze, connecting several major California cities: San Francisco, Oakland, and Berkeley. Following the collapse, the governor immediately declared a state of emergency, and authorized one day of free transit rides for 30 April 2007, which had been subsidized with state funds. The California Department of Transportation (Caltrans), the Metropolitan Transportation Commission (MTC), and local transit agencies worked together to expand transit services. The interchange remained closed for nearly a month. The objective of the paper is to evaluate the impacts of this unplanned, extended closure on Bay Area Rapid Transit (BART) and the remaining freeway system based on empirical data.
The following section discusses relevant previous studies. Section 3 provides a description of the freeway and the BART system in the region, along with a brief explanation of the events related the complete closure of the two heavily-traveled freeway connectors. The traffic impacts of the collapse are evaluated and the findings are reported in Section 4. This paper ends with brief concluding remarks.

2. Literature Review

Previous studies evaluating the impact of highway link disruption have focused primarily on the economic impacts, rerouting strategies, and retrofit priorities. Gordon et al. [1] estimated the transport-related business interruption impacts of the 1994 Northridge earthquake using a spatial allocation model. The National Research Council [2] suggested a decision analysis process for modeling the economic impact on the freight system by transportation facilities and link disruptions. The process consists of rerouting, supply-chain response, and industrial impact evaluation. Kim et al. [3] estimated the economic impacts of disruption by combining the transportation network and economic input-output model. Sohn et al. [4] and Sohn [5] studied rerouting strategies and the robustness of highway links following natural disasters. Those economic impact analyses could have been used to estimate the overall loss of the economic activities caused by the disruption and identify the most significant links on the network in an economic sense. However, those methodologies cannot be applied to investigate detailed day-to-day movement of people in the region before and after the disruption.
As Sullivan et al. [6] noted, recent studies have begun to pay close attention to the sequential application of traffic equilibrium models to measure the traffic change by a disruption. For example, Tsuchiya et al. [7] developed a spatial equilibrium model to estimate the freight and passenger flow from link disruption following an earthquake. He and Liu [8] validated a day-to-day traffic evolution model with empirical observations on the collapse of the I-35W Mississippi River Bridge. The focus of those studies was limited to the highway vehicle users without considering the converted demand to the public transit system.
There are several studies regarding the behavior changes of commuters during planned or unplanned highway closures. Most of those studies are based on telephone, mail, Internet, and in-person surveys. These studies include the following: maintenance-related closures of the Fix I-5 project in Sacramento, CA [9], 1-405 in Seattle, WA [10], Southeast Expressway in Boston, MA [11], I-376 in Pittsburgh, PA [12], and the Centre Street Bridge in Calgary, Canada [13], in addition to disasters, such as the I-35W Bridge Collapse in Minneapolis, MN [14], and the Northridge earthquake [15,16].
Chang and Nojima [17] measured overall transportation system performance after area-wide highway system damage following the 1995 Kobe, Japan earthquake. They proposed system-wise performance measures, including total length of the network that was open, total distance-based accessibility, and areal distance-based accessibility. Fujii and Kitamura [18] tested the influence of travel time information to drivers in rerouting traffic after the closure of the Hanshin Expressway in Japan. Literature on transportation system performance in disasters is summarized by Faturechi and Miller-Hooks [19].
A recent study by Zhu et al. [20] on the I-35W Bridge collapse in Minneapolis, MN analyzed traffic detector and bus ridership data with the survey results, including aggregated weekly and daily traffic counts, total vehicle kilometers of travel, vehicle hours of travel, and monthly transit ridership. They reported that the total travel demand on the highway was not reduced significantly after the network collapse because of redundant capacity provided by alternate routes. The peak period, however, was extended and the total travel time was increased. The increase of bus ridership was not evident, but it is noted that the follow-up studies are necessary to investigate impacts of bridge collapse on transit ridership in detail.
The limitation of the data used in the above studies about the behavioral analysis of commuter traffic was that most of those were from area-wide surveys or aggregated traffic and ridership counts, thus, a section-by-section microscopic analysis of highway and transit demand was not possible.
Comprehensive empirical analyses on the change in multi-modal travel patterns resulting from unexpected highway link disruption and scheduled restoration projects are scarce. As such, the empirical findings from the present study can be invaluable in developing guidelines for determining incentives for early completion of such emergency projects, and the level of additional transit service availability required during the recovery period, especially in the San Francisco Bay Area and other urban areas that have similar transportation infrastructure systems.

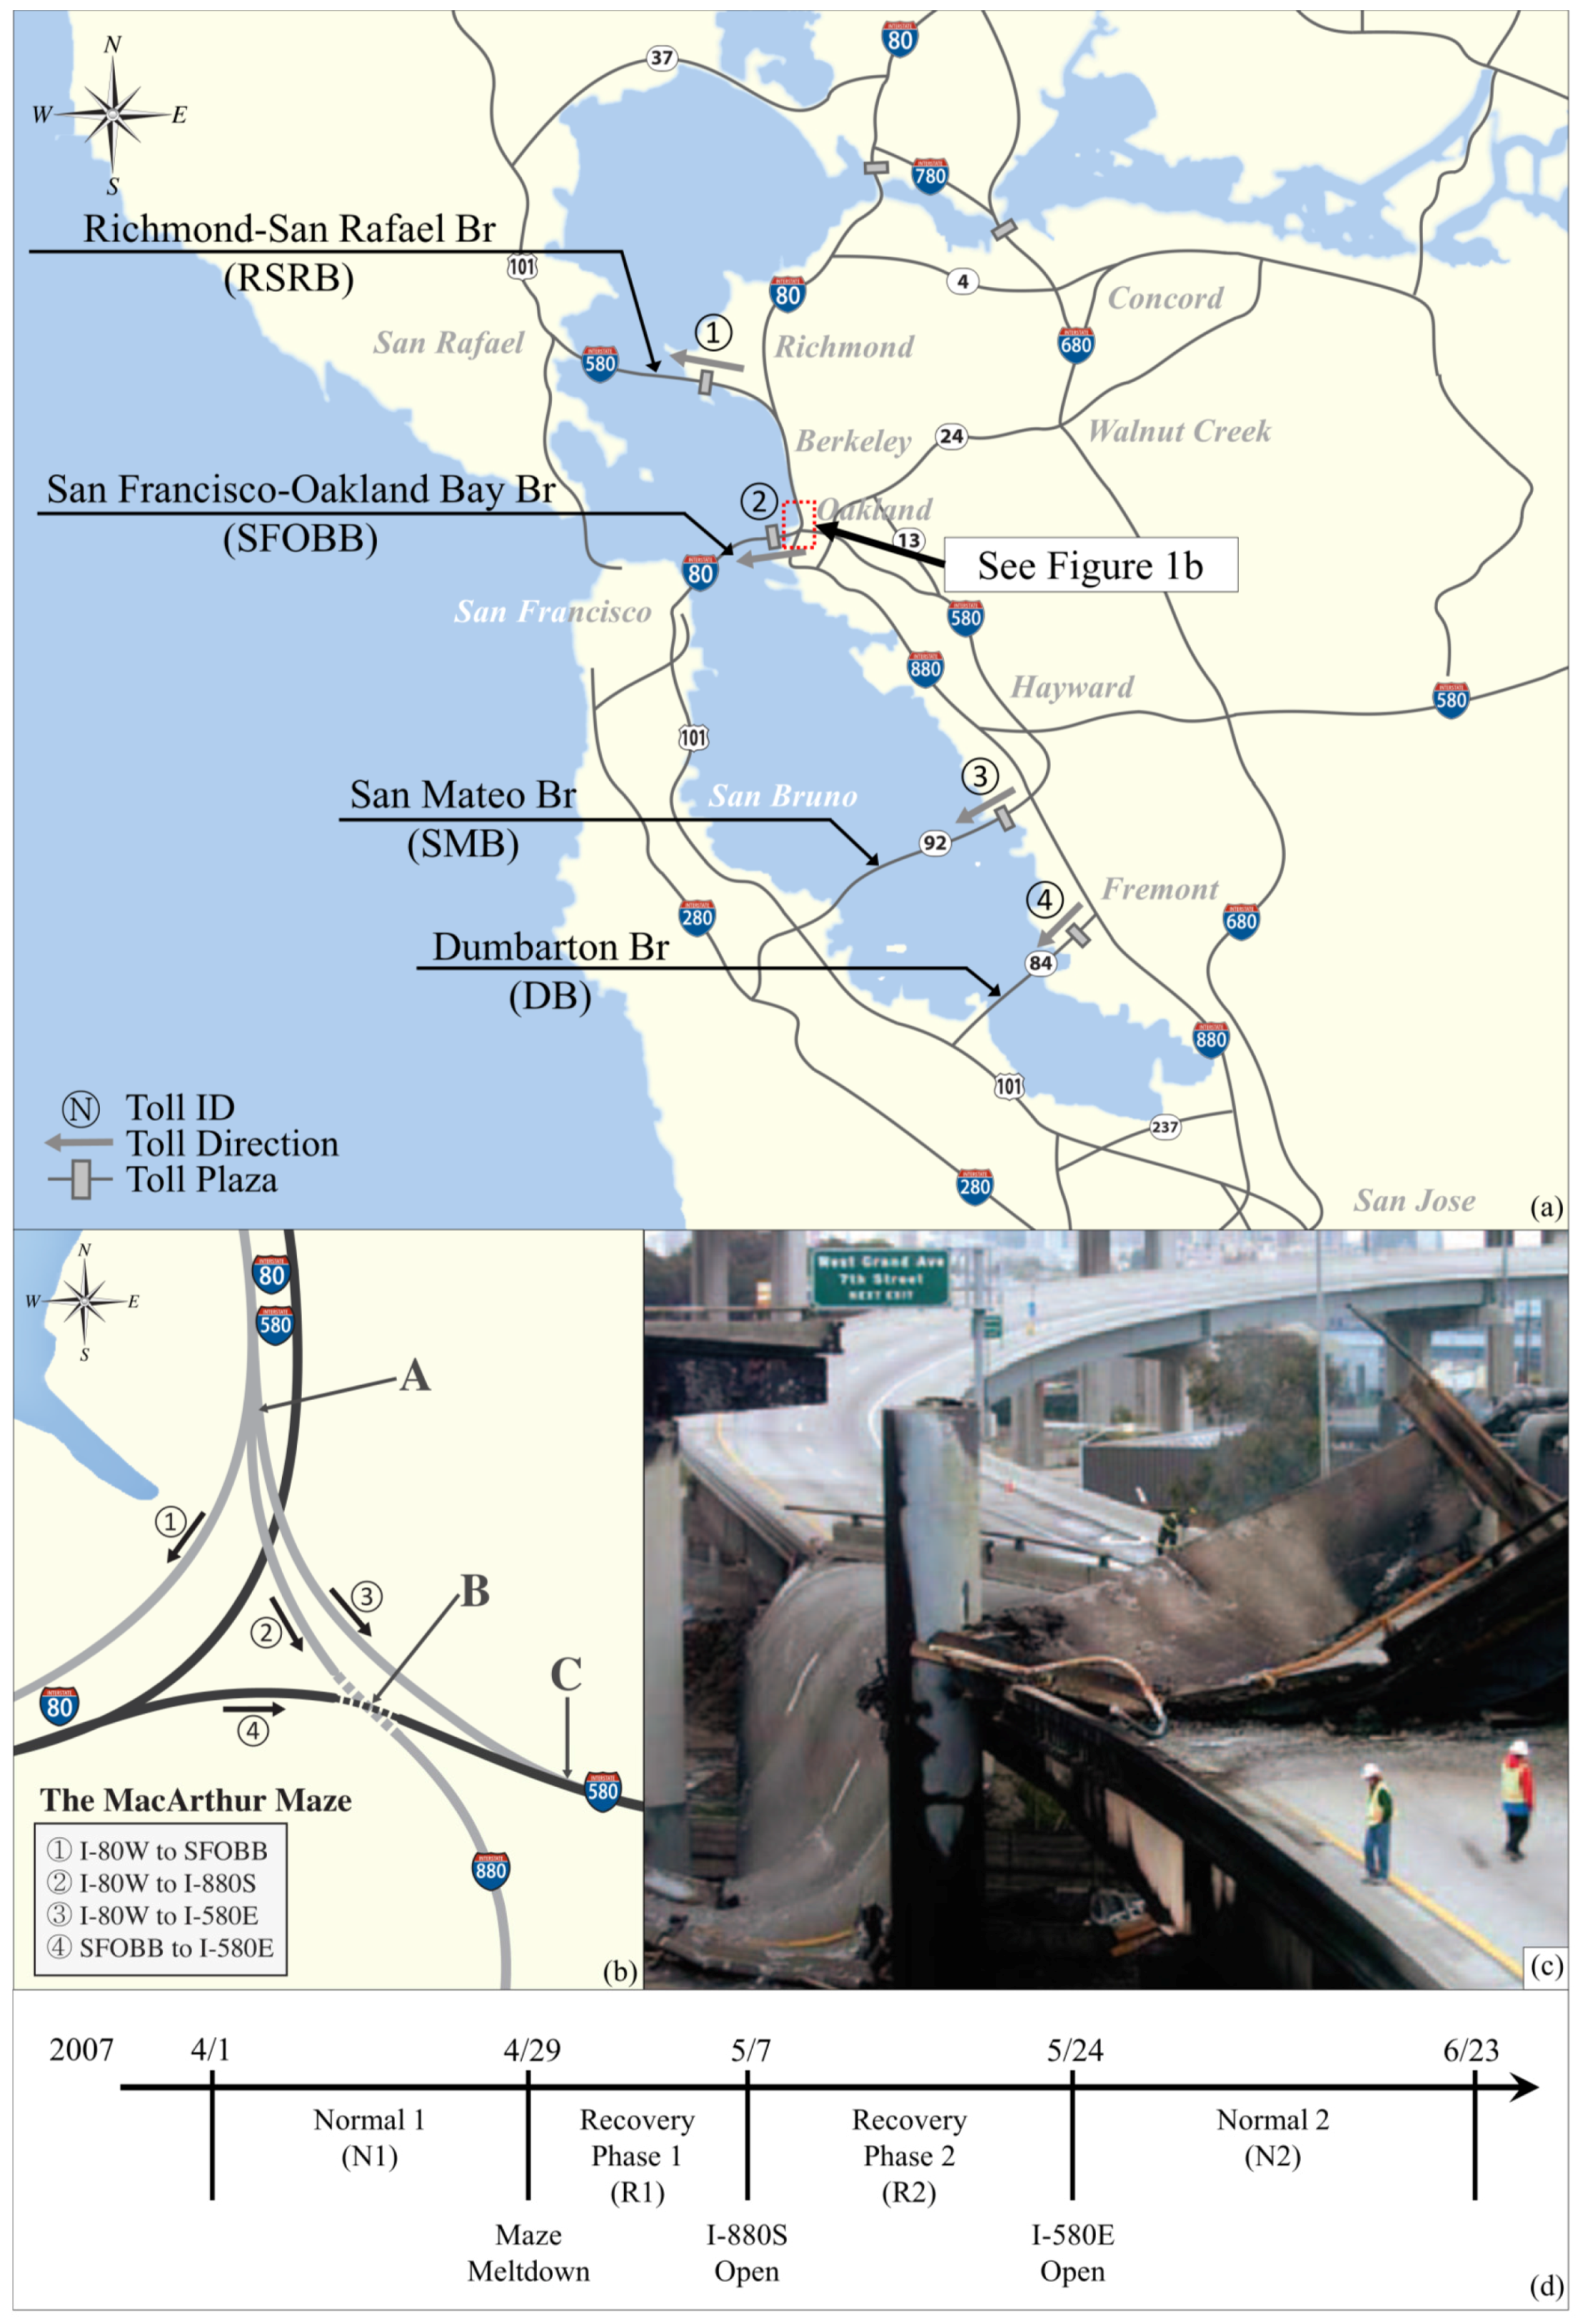
3. Study Site and Sequence of Events Related to Maze Meltdown

Figure 1 shows the network of freeway connectors near the site where the incident occurred. Interstate 580 Eastbound (I-580E) and Interstate 80 Westbound (I-80W) run north and south within the dotted box shown in Figure 1a, and the area enclosed in the dotted box has been enlarged and shown in Figure 1b. I-80W provides access from the eastside of the region to the San Francisco area via the San Francisco Oakland Bay Bridge (SFOBB), as shown in Figure 1a. The grey rectangular boxes shown in Figure 1a mark the locations of toll plazas, and the arrows indicate the toll collection travel direction.
Near location A, as shown in Figure 1b, I-80W splits into three directions (see arrows numbered 1 to 3 in Figure 1b). Above the I-80W to I-880S connector (see arrow 2 in Figure 1b), there exists an additional connector between the SFOBB and I-580E (see arrow 4 in Figure 1b), which merges with the connector between I-80W and I-580E (see arrow 3 in Figure 1b) at location C (see Figure 1b). The section of the freeway shown in Figure 1 is called the MacArthur Maze or simply “the Maze”.
On 29 April 2007, when a tanker truck with 8600 gallons of unleaded gasoline traveling along I-80W to the I-880S connector (see arrow 2 in Figure 1b) hit a guardrail near location B (see Figure 1b) at 3:41 a.m. [21], the crash caused the gasoline tank to explode to start a fire. The blaze engulfed a section of the I-80W to I-580E connector (see arrow 4 in Figure 1b) near location B (see Figure 1b), causing the steel frame of the connector and the bolts holding the frame to melt. The upper deck ultimately melted down onto the freeway connector segment below (see Figure 1c). This resulted in the complete obstruction of the movement of traffic indicated by arrows 2 and 4 (see Figure 1b) for an extended period of time.
The governor immediately declared a state of emergency, and authorized one day of free transit rides for 30 April 2007, subsidized with state funds. The California Department of Transportation (Caltrans), the Metropolitan Transportation Commission (MTC), and local transit agencies worked together to expand transit services. The connector from the I-80W to the I-880S (see arrow 2 in Figure 1b) was reopened on Monday, 7 May 2007 [21], while the replacement of the connector from I-80E to I-580E (see arrow 4 in Figure 1b) was scheduled to be completed on 27 June 2007. To speed up the reopening of the second connector, Caltrans included early completion performance bonuses of $200,000 per day for each day ahead of schedule and penalties of $200,000 each day if the project was not completed by the 27 June 2007 deadline. The contract was awarded to C.C. Myers Inc. of Rancho Cordova, California. Their bidding price for the project was $867,075, but the contractor was eligible to receive the maximum bonus payment of $5 million for the early completion of the project. The work was completed a month earlier than scheduled and the connector was reopened to traffic on the evening of Thursday, 24 May 2007.
Figure 1d shows the sequence of events, beginning with the Maze Meltdown to reopening of the SFOBB to I-580E connector. With respect to the time of the collapse, the time period prior to the event will be referred to as “Normal 1 (N1)”, the time period between the meltdown to reopening of the I-880S (see arrow 2 in Figure 1b) is referred to as “Recovery Phase 1 (R1)”, and the subsequent time periods involving reopening of the connectors are referred to as “Recovery Phase 2 (R2)” and “Normal 2 (N2)” in this paper. Traffic patterns over the weekends and holidays displayed similar patterns, while Mondays that followed holiday weekend and those that fell on a holiday deviated greatly from the regular Mondays. For this reason, the data from 2 April and 28 May were excluded from the analysis because 2 April was the Monday following Cesar Chavez Day and 28 May was Memorial Day.

4. Evaluating the Effect of the Maze Meltdown
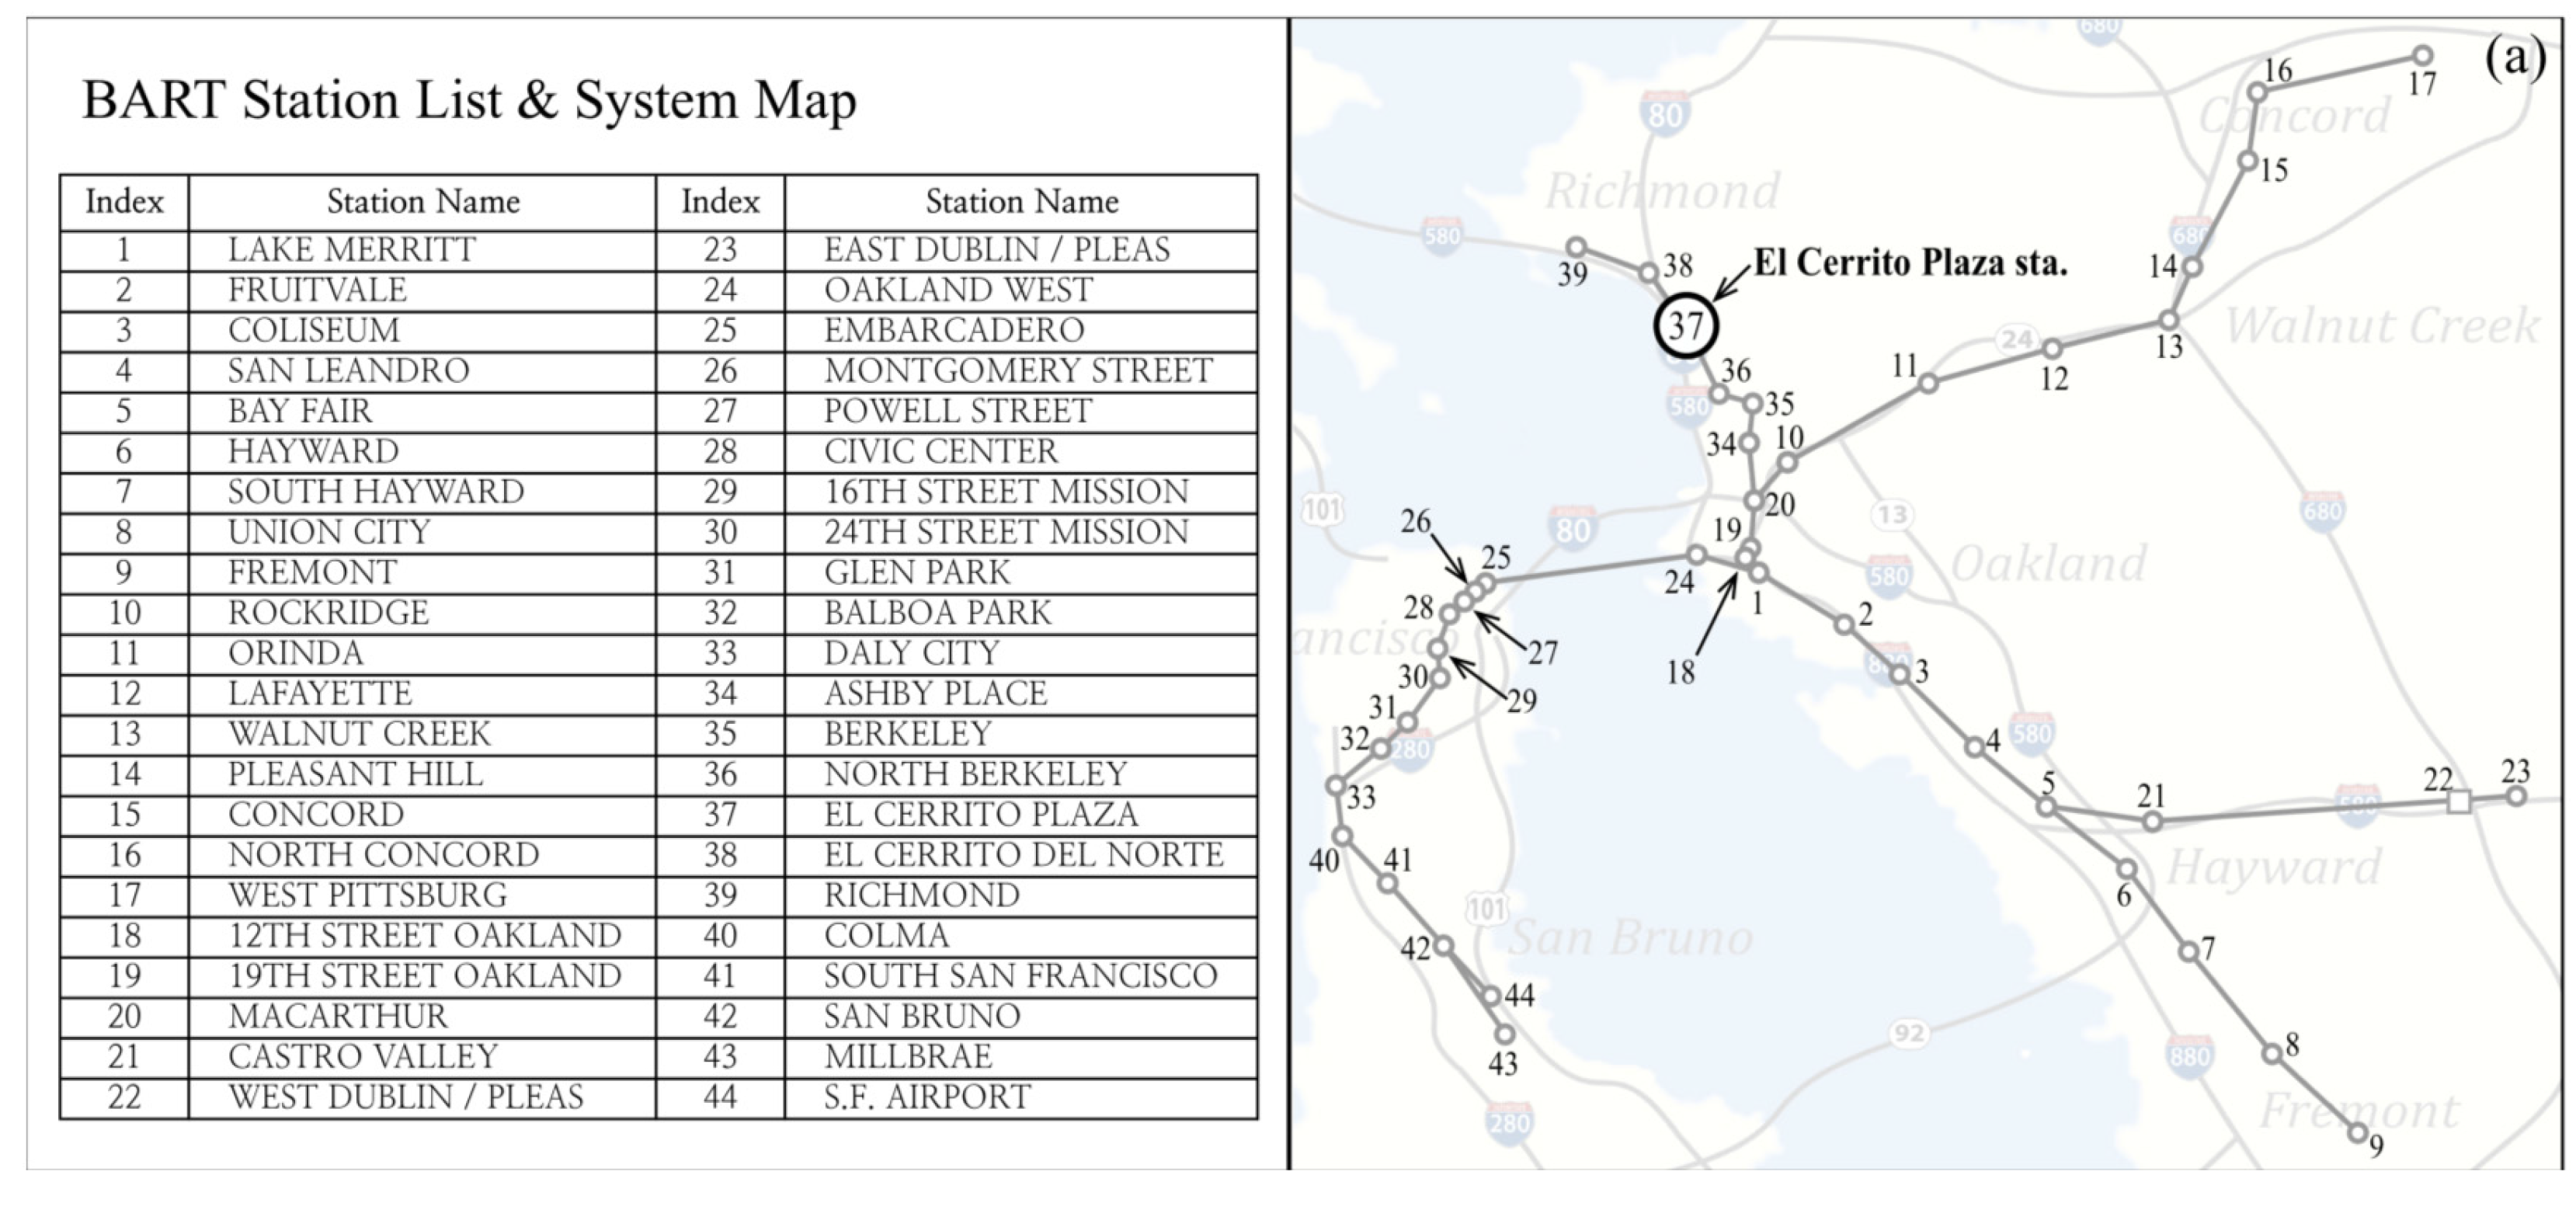
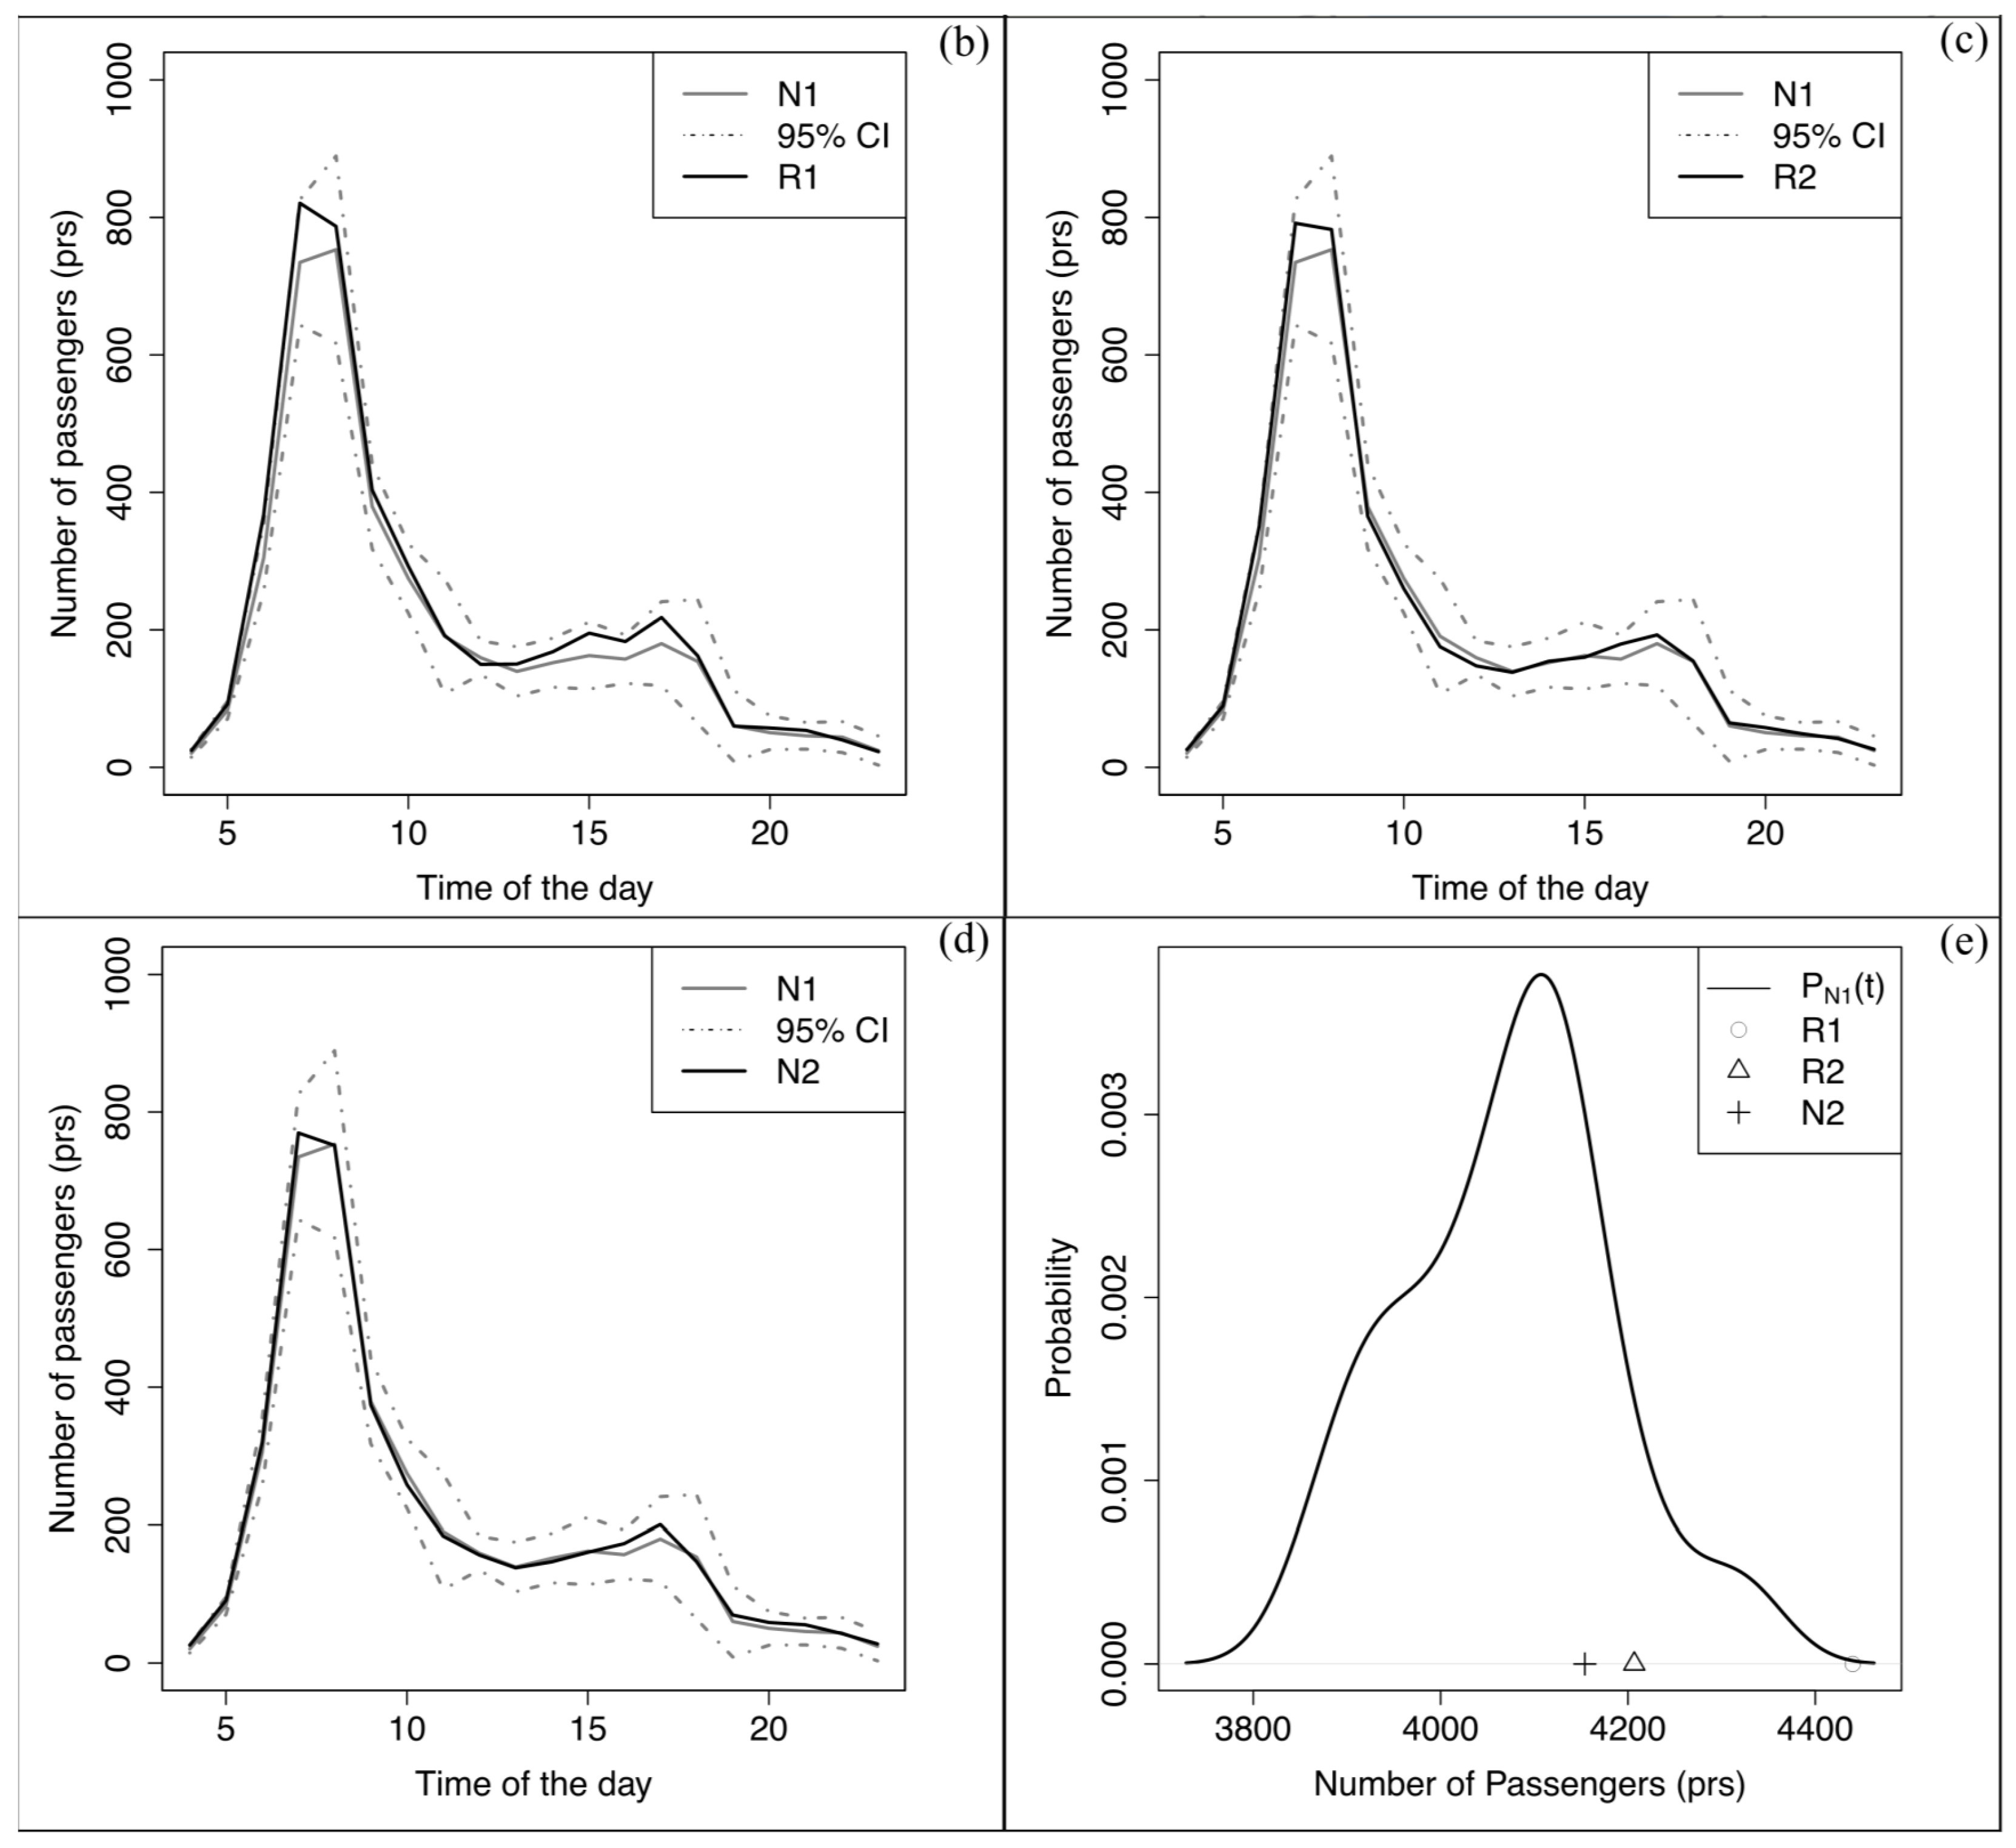
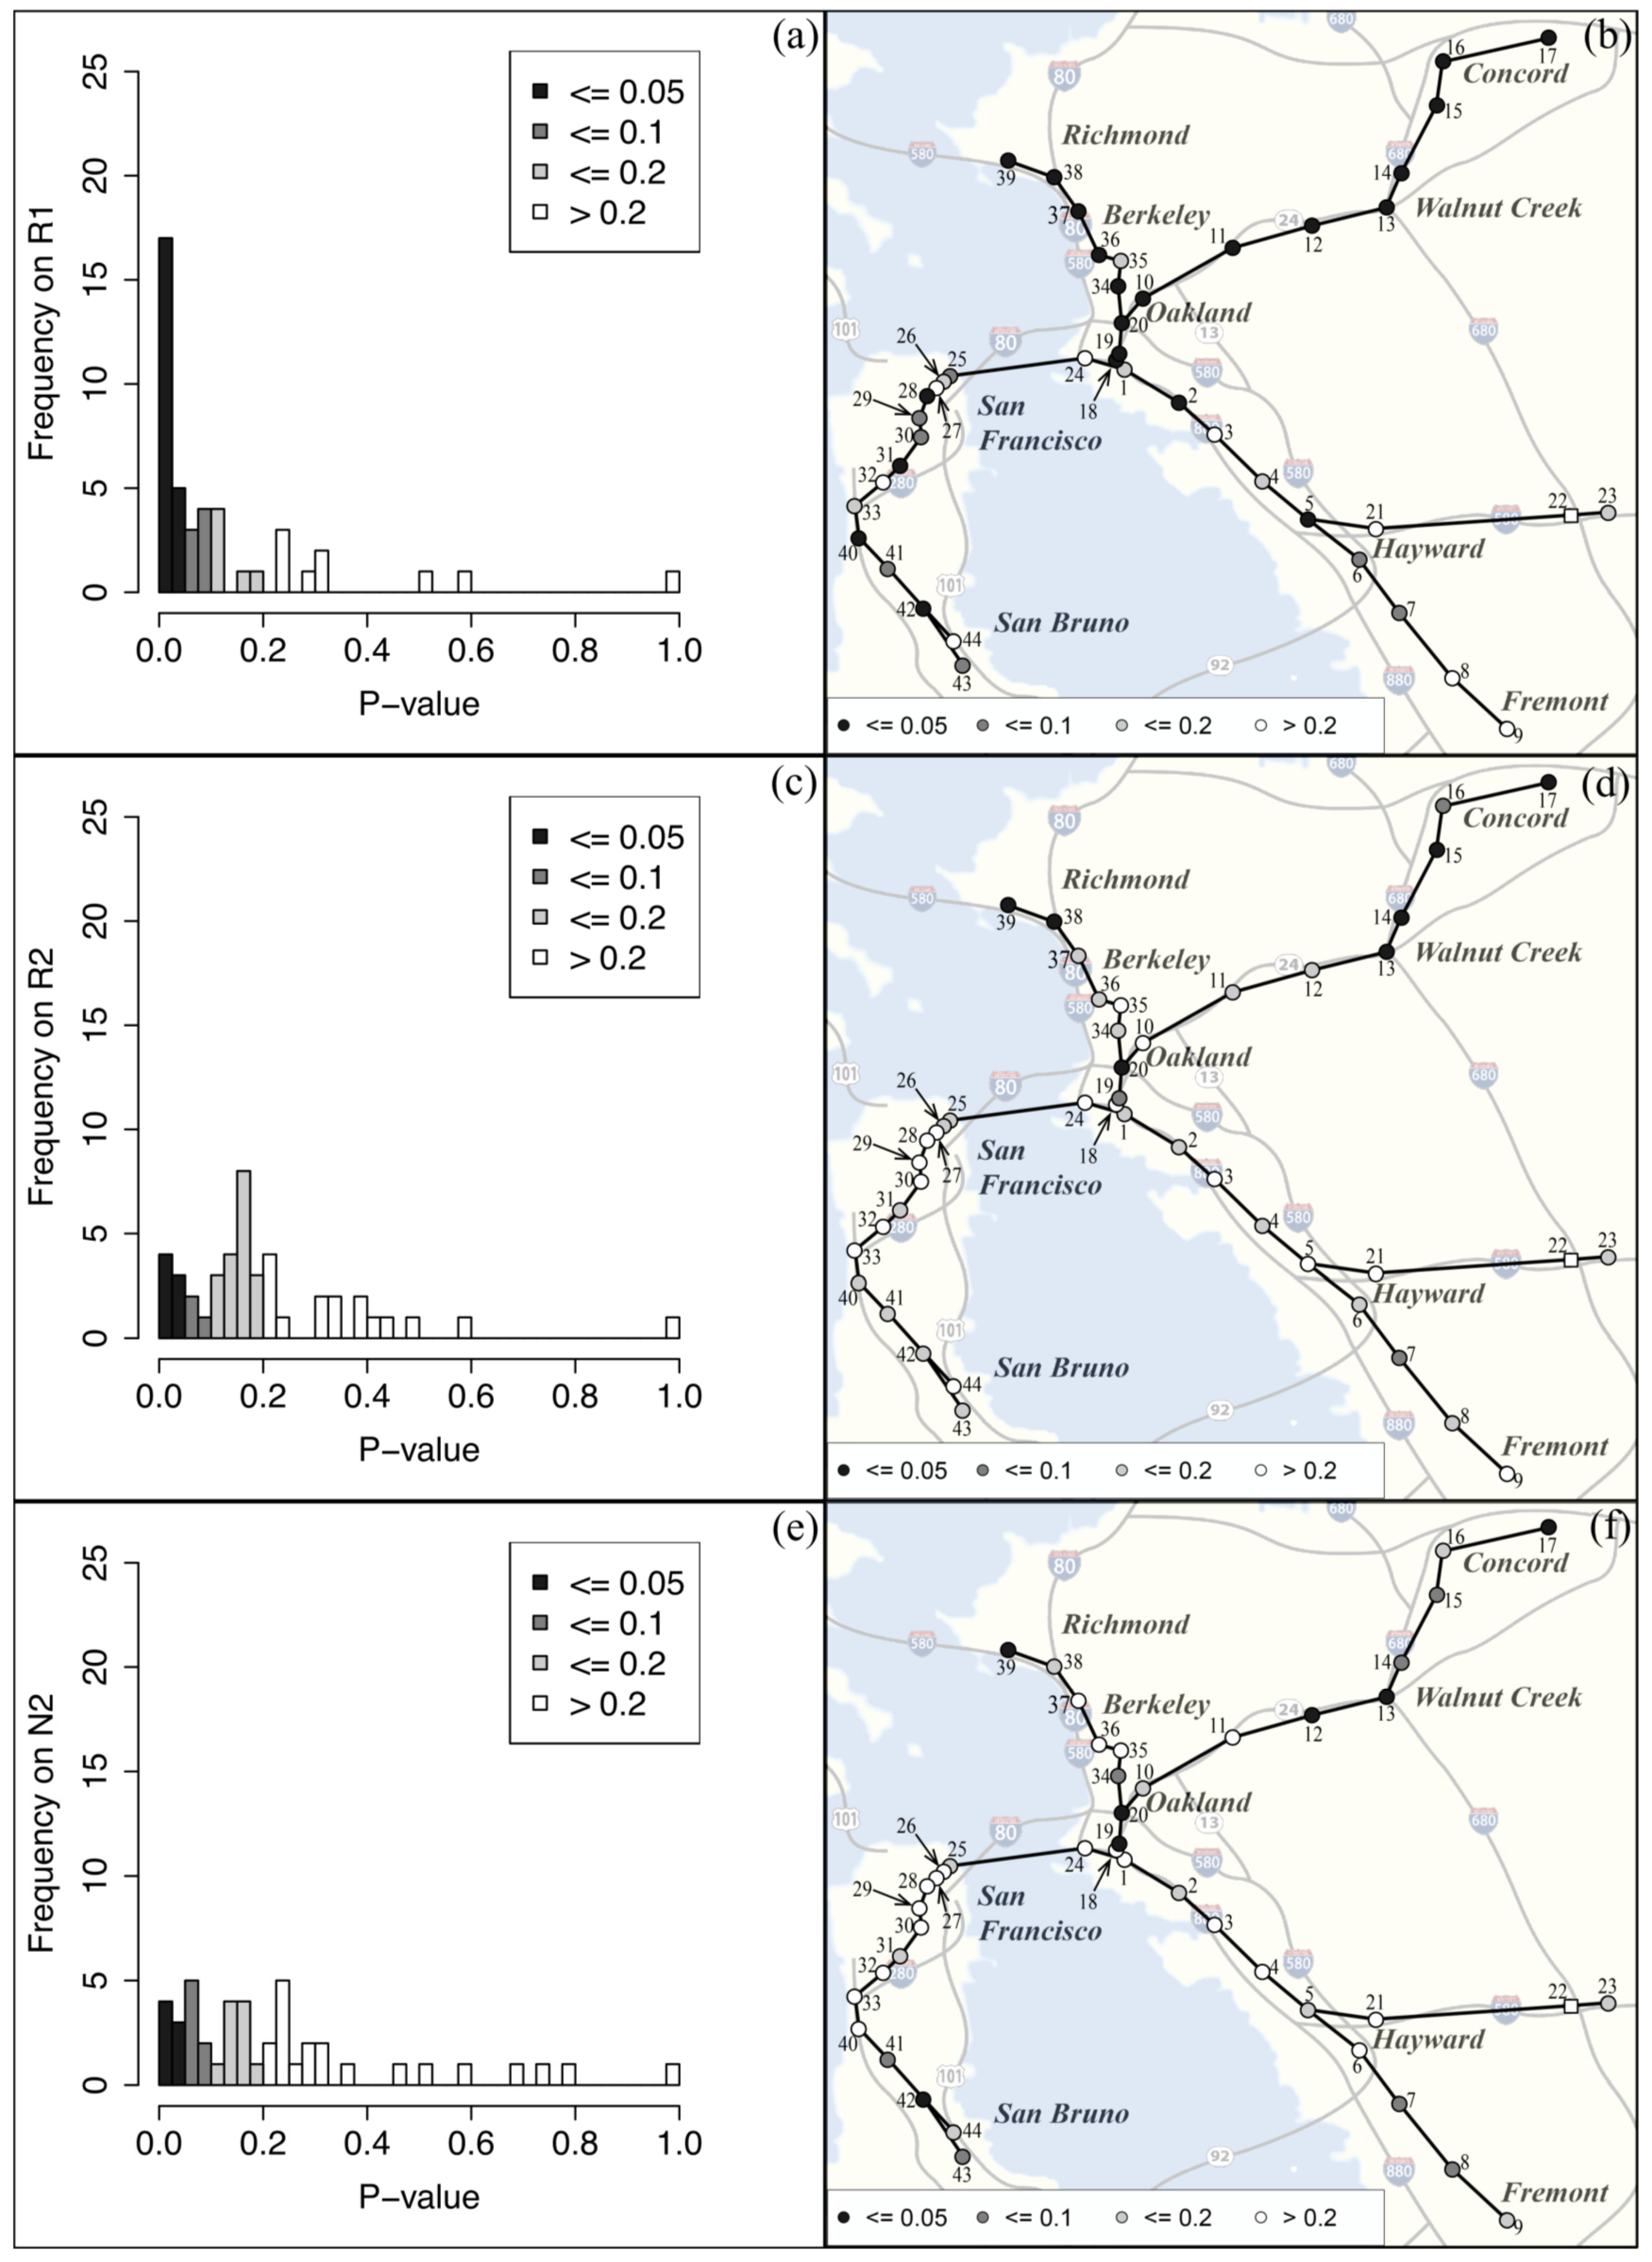
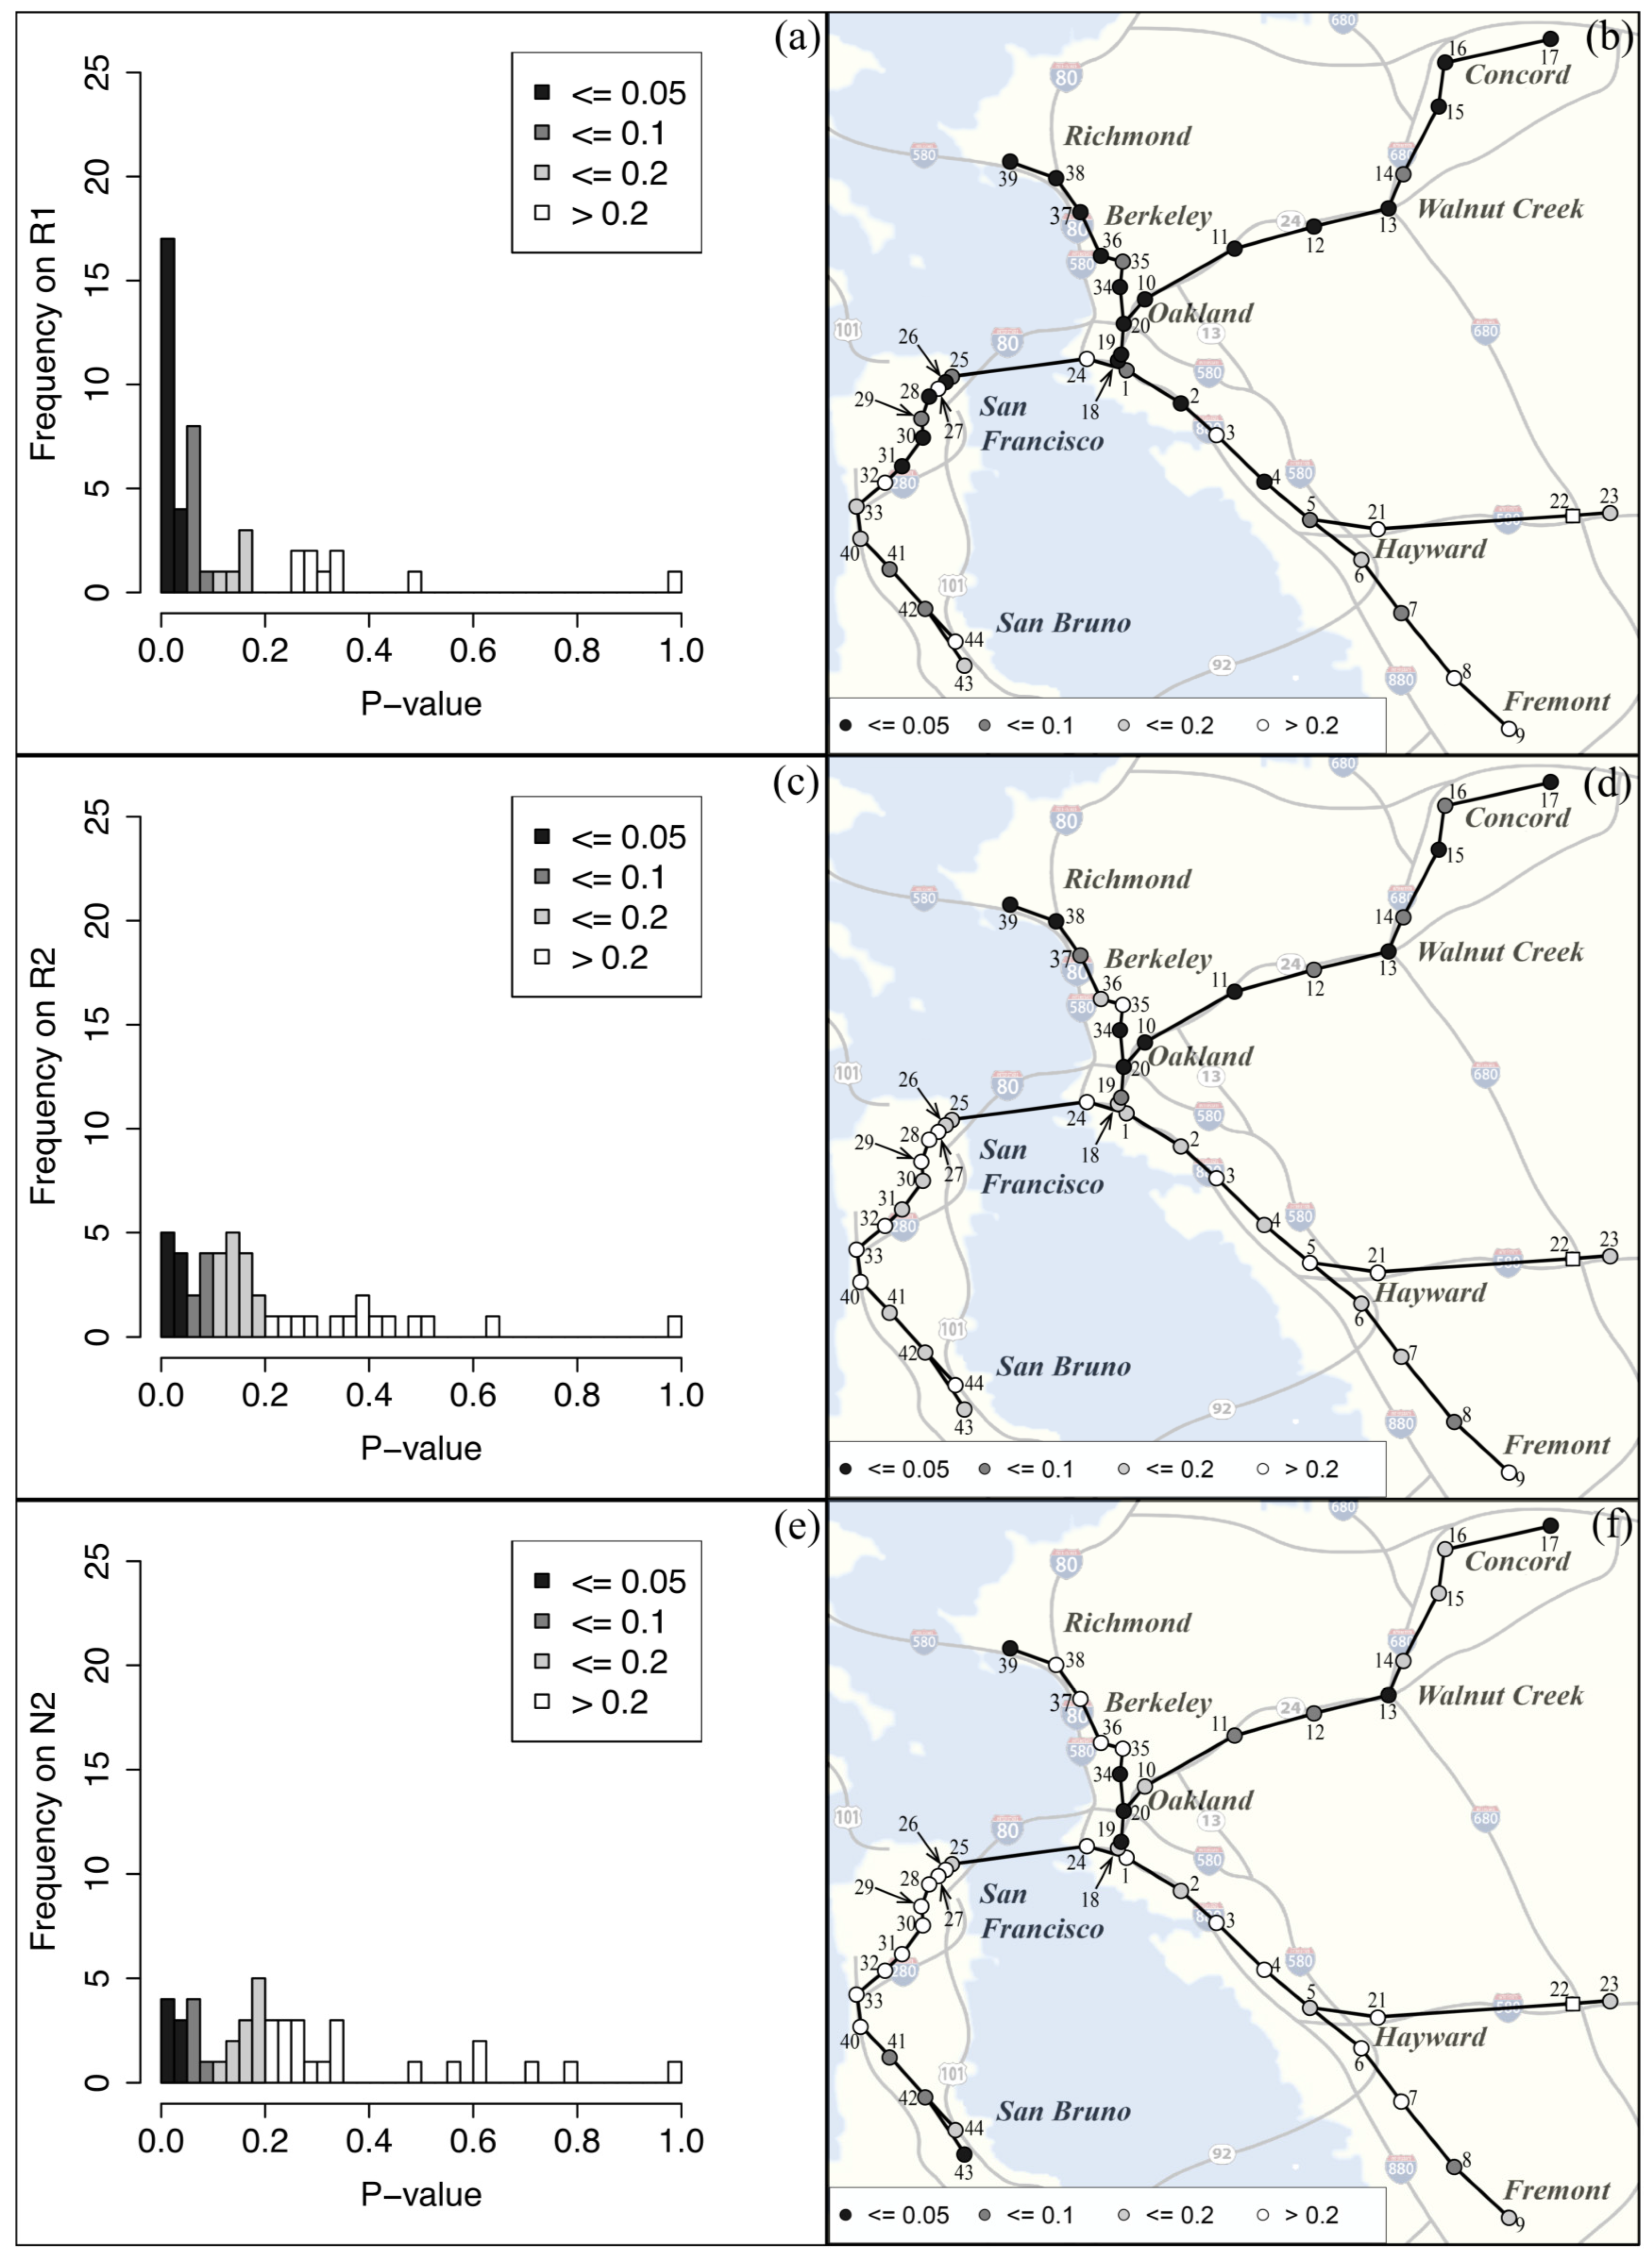
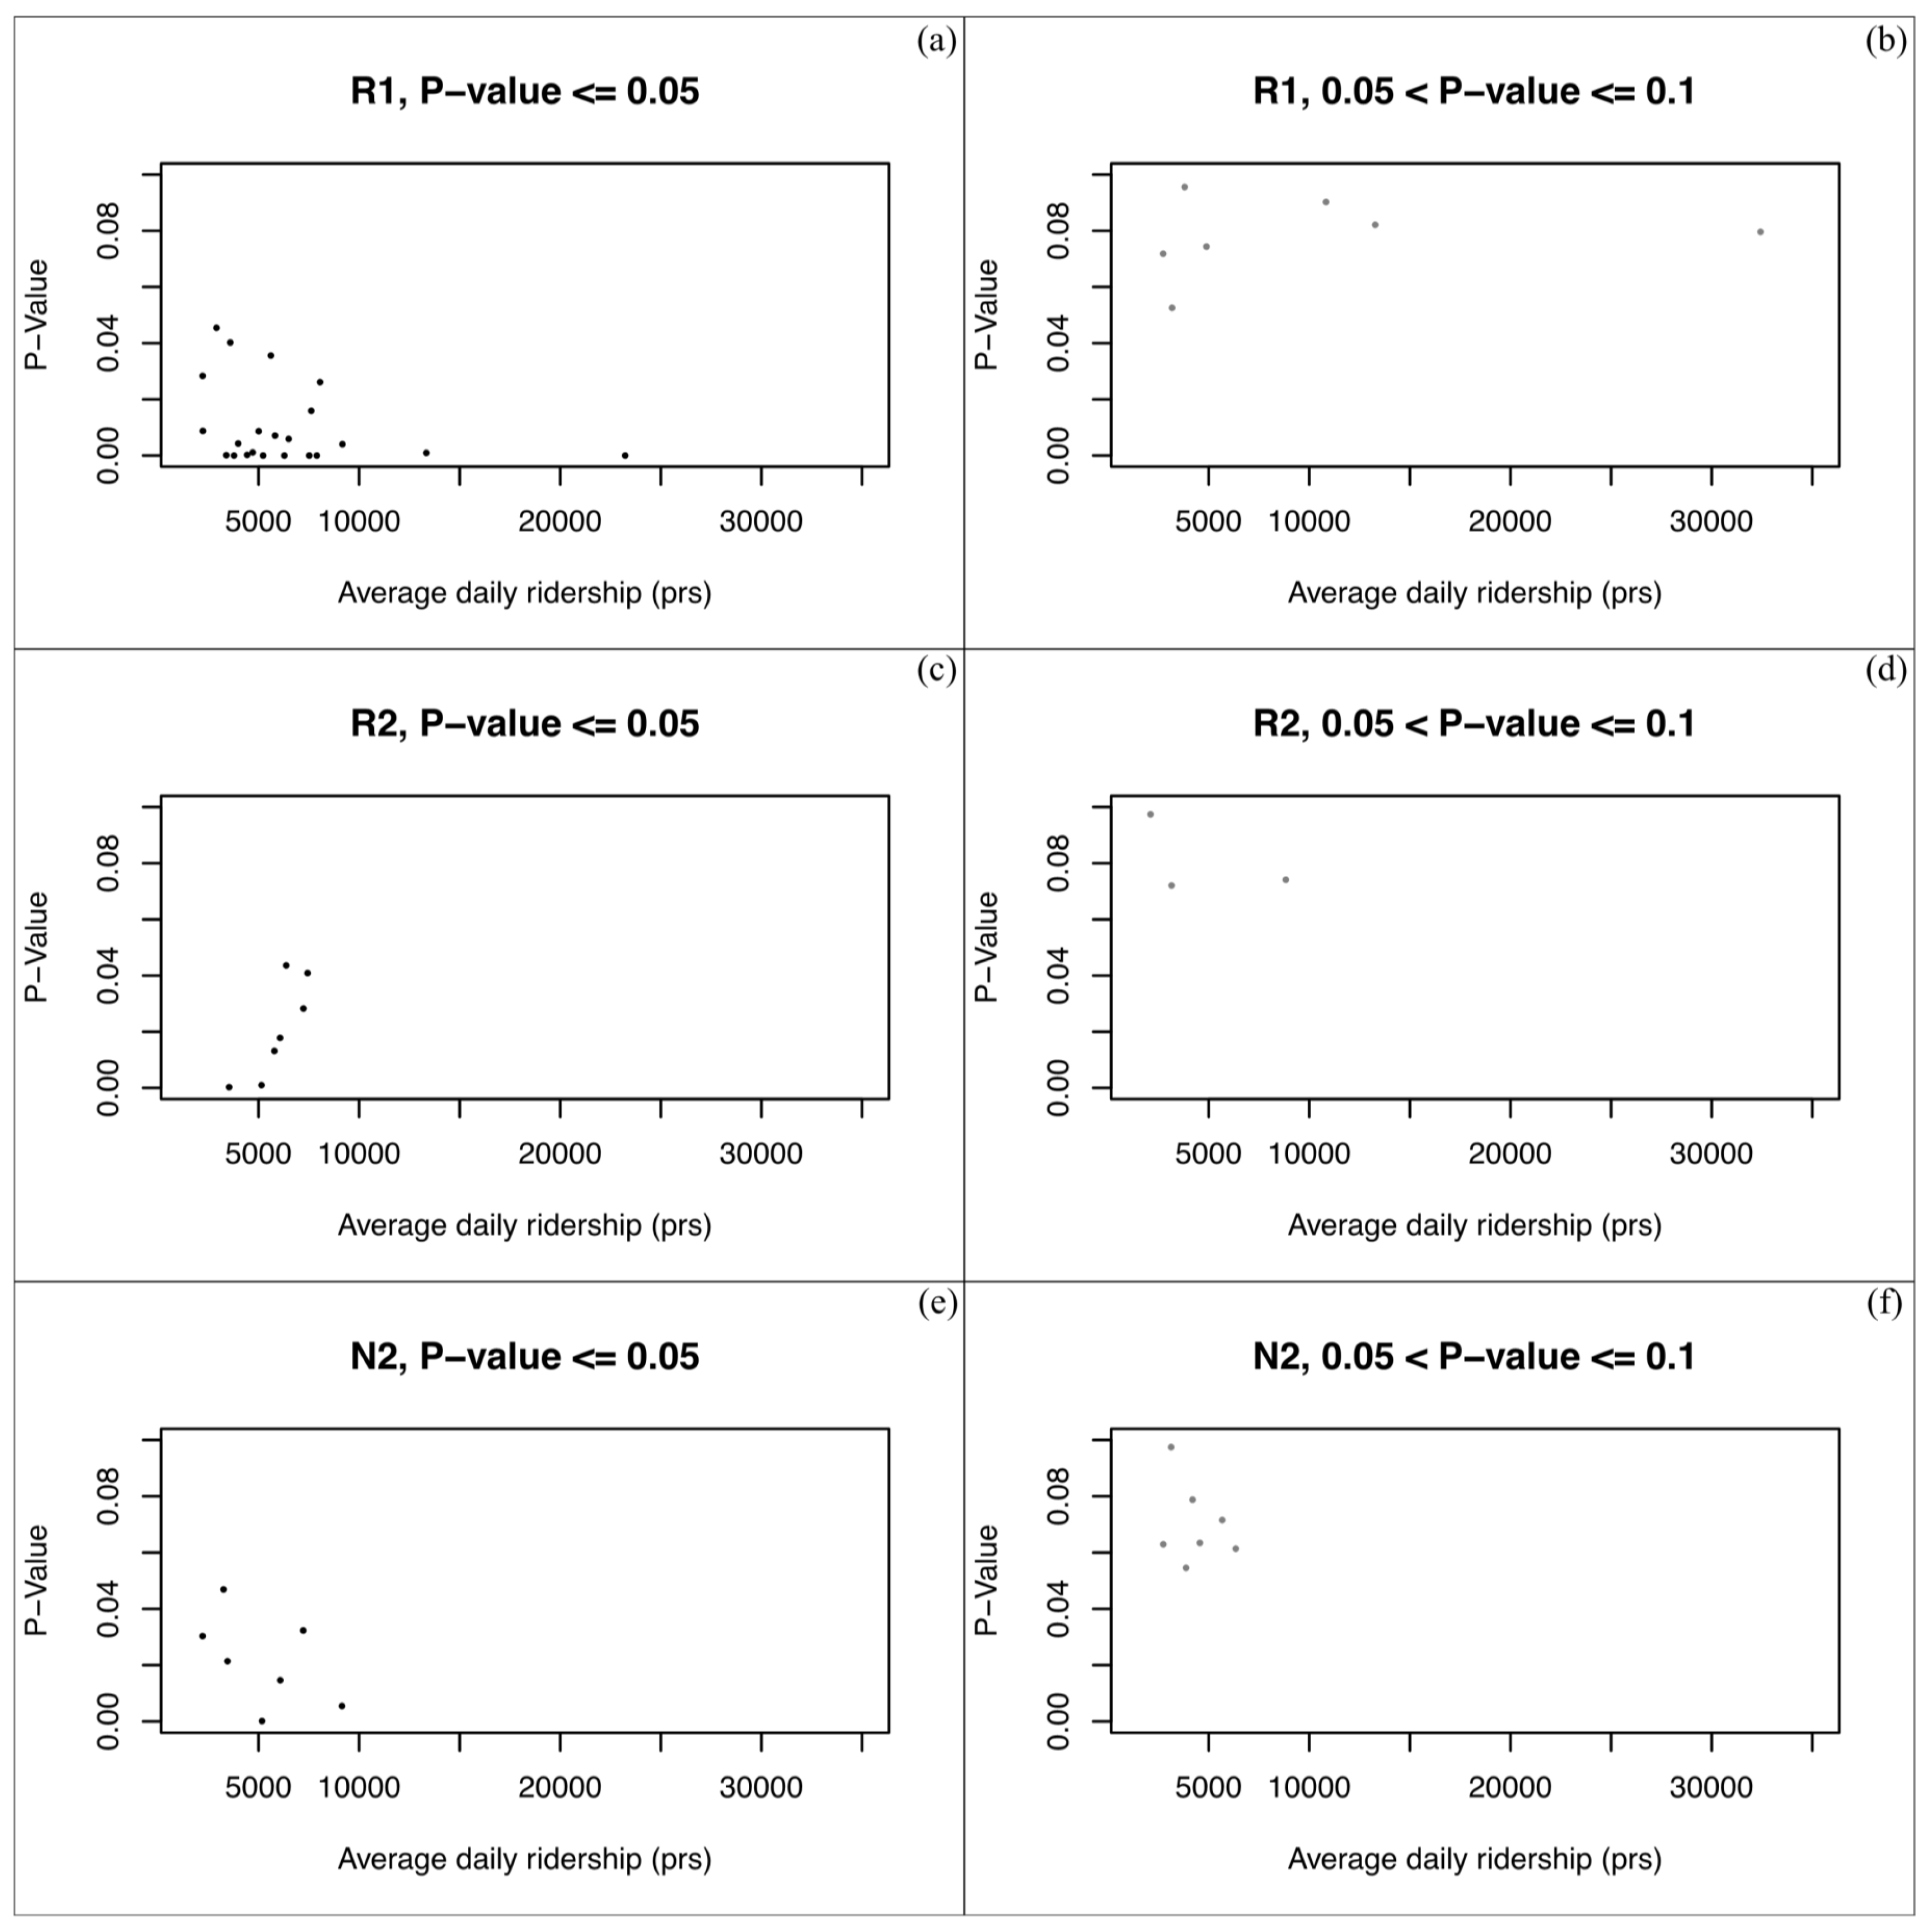
The disruption of traffic that resulted from the complete closure of the two connectors, both the I-80W to I-880S (see arrow 2 in Figure 1b), and the SFOBB to I-580E (see arrow 4 in Figure 1b), caused a pronounced increase in BART ridership at a number of stations compared with the demand observed during the N1 period. The increases in ridership at most stations slowly returned to the N1 level as connectors were sequentially reopened. The increase in BART ridership compared with N1 remained significantly higher at some stations even after traffic conditions returned to a normal state during N2. The changes in BART ridership observed following the Maze Meltdown and the traffic conditions observed on the surrounding freeways are discussed in the following.

4.1. Effect on BART

The level of urbanization markedly varies within the region, potentially affecting the level of BART utilization [22]. The Richmond, Concord, San Rafael, and Hayward areas are primarily residential areas, while the San Francisco, Oakland, and San Jose areas (see Figure 1a) are primarily central business districts that include some residential areas. Commuters from the Richmond, Concord, and Oakland to San Francisco downtown areas were directly impacted due to the freeway collapse.
A marked increase in BART ridership was observed at many stations following the incident. BART's average weekday ridership is 340,000. BART set its single day record of 375,200 passengers on Tuesday, 1 May 2007. Many of those who rode BART that day were attempting to avoid the complications caused by the Maze Meltdown freeway repairs. The third highest total in BART’s history occurred two days later on Thursday, 3 May when 374,200 passengers used BART [23].
The white circles shown in Figure 2a indicate the locations of the 44 BART stations. Daily BART ridership ranges from 314,500 to 354,000 on weekdays, and 102,000 to 168,000 on weekends. The data from West Dublin (see station 22 in Figure 3b) were not available and not included in the analysis.
The hourly ridership of BART did not significantly deviate from normal demand during the freeway repairs. Figure 2b–d show hourly BART ridership (represented by the solid black line) at different phases (see Figure 1d) compared with that of N1 (represented by the light grey line) at El Cerrito Plaza station (see station 37 in Figure 2a). Hourly BART ridership during R1 remained within the 95% confidence interval (CI) of the hourly ridership observed during N1. Hourly BART demand during R2 and N2 also remained within 95%. If hourly ridership had varied greatly during the recovery period, utilization of different timetabling strategies and additional trains might have been considered [24]. However, it appears that BART could accommodate the additional demand shifted from the freeway without temporarily increasing the trains’ existing capacity.
Although the hourly demand observed during different stages of recovery period did not deviate significantly from pre-incident demand, the total daily ridership was significantly increased during R1. Figure 2e shows the distribution of BART ridership observed at El Cerrito Plaza during weekdays. The solid black line, PN1(t), shows the empirical probability distribution of daily demand observed at El Cerrito Plaza station. The white circle, triangle, and cross in the figure are the observed average demand at El Cerrito Plaza station during R1, R2, and N2 periods, respectively.
How much the ridership changed compared to the N1 period can be quantified by the p-value of the average demand estimated using PN1(t): a p-value less than 0.05 indicates an increase in demand that is higher than the 99.5 percentile of demand observed during N1. The p-value of the average daily ridership observed during R1 was 0.00002 (represented by the white circle in Figure 2e) indicating a significant increase in BART ridership. This increase in ridership declined as the connectors were sequentially reopened. The p-values of daily ridership during R2, after the reopening of the I-80W to I-880S connector (see arrow 2 in Figure 1b) and N2, after reopening of the SFOBB to I-580E connector (see arrow 4 in Figure 1b), were 0.11 and 0.23, respectively (see the triangle and cross in Figure 2e). The demand observed during R2 and N2 at El Cerrito Plaza station was within 89 percentile of the demand observed during N1. A similar pattern was observed at a number of other stations, as is shown in Figure 3.
Figure 3a shows the histogram of stations with respect to different p-values of average weekday BART ridership based on the station entry data: PN1(t) at each station was used in estimating the p-value of average ridership during R1, R2, and N2. The black bars in the figure indicate the frequency of stations at which the observed p-values were less than 0.05 indicating a significant increase in ridership. The locations of the BART stations at which pronounced increases in daily ridership were observed are shown in Figure 3b (see stations represented by black circles). The dark and light grey bars in the figure show the number of stations where the observed p-values were 0.05–0.1 and 0.1–0.2, respectively (see stations represented by dark and light grey circles in Figure 3b). The white bars in the figure indicate the frequency of stations where observed p-values exceeded 0.2. Figure 3 shows the corresponding statistics from the R2 and N2 period.
Significant increases in BART ridership were observed at most stations located in the Richmond, Walnut Creek, and Concord areas, whereas the stations located south of the Oakland, Hayward, and Fremont areas remained relatively unaffected during R1: the impact of the closure was not uniform among the stations. The stations marked with black circles (see Figure 3b,d,e) reported more pronounced increases in demand than other stations (i.e., p-values less than 0.05).
The increased in BART ridership quickly diminished during R2, after the reopening of the I-80W to I-880S connector (see arrow 2 in Figure 1b). The number of patrons entering stations returned to the normal state, which is indicated by p-values higher than 0.05 (see Figure 3c) and darker colored circles turning to a lighter color (see Figure 3d). Notice BART stations located in remote locations in the Richmond, Concord, and Walnut Creek areas retained high numbers of patrons (see stations in Figure 3f) even after all the connectors are restored. Additionally, two stations in Oakland, which are primary central business districts, reported high numbers of patrons using those stations (see station 19 and 20 in Figure 3f).
Monitoring the changes in ridership using p-values can be instrumental in evaluating how statistically significant the change is. However, it can also be misleading when the average ridership during N1 is small. Notice how station 42 displayed a low p-value during R1 (see Figure 3b), a high p-value during R2 (see Figure 3d), and low p-value during N2 (see Figure 3f). This is due to the fact that average daily ridership at station 42 was only 2200 during N1, as a result, even a moderate increase of several hundred passengers could significantly alter the p-value. Excluding station 42, ridership at some of the remote stations remained significantly high during N2 compared with ridership during N1. This may due, in part, to the fact that many of the passengers using those BART stations did not travel via BART prior to the incident. Having been forced to use BART during the freeway repairs, they may have discovered its benefits and convenience, and continued to travel via BART even after traffic conditions returned to the normal state.
Based on where BART patrons enter (see Figure 3) and exit (see Figure 4), it appears that commuters can change their mode of travel from car to BART even if their traveling freeway route is not directly impacted by a closure. Commuters traveling from Richmond and Berkeley to Oakland and Hayward areas via the freeway (see Figure 1a) use either the I-80W to I-580E connector (see arrow 3 in Figure 1b), which remained open, or I-80W to I-880S, which was reopened at the end of R1 (see arrow 2 in Figure 1b). I-80W to SFOBB (see arrow 1 in Figure 1b) remained open such that commuters traveling from Richmond and Berkeley to SFOBB were not impacted by the closure. Commuters from Richmond and Berkeley to either Oakland or San Francisco had connectors remaining open, yet, a significant increase BART ridership was observed among the stations near Richmond and Berkeley. Commuters traveling from Concord and Walnut Creek to San Francisco via the freeway use the I-80E to I-580E connector (see arrow 4 in Figure 1b), which was reopened at the end of R2. BART ridership at the stations within Concord and Walnut Creek area commuters markedly increased, as expected, since their traveling route via car had been directly affected by the closure. Compared with entrance information, more riders exited San Francisco downtown BART stations than entered. Commuters traveling from Richmond, north of Oakland might have traveled to downtown San Francisco in the morning via casual carpool [25] then returned to the east side via BART.
The changes in demand at different stations during R1, R2, and N2 are shown in Figure 5 based on their p-values being less than 0.05 (i.e., significant changes in demand) or greater than 0.05 (i.e., less significant increases in demand) with respect to the average daily ridership observed at different periods. Most of the stations that reported p-values less than 0.05 (i.e., significant increases in ridership compared to N1) during R1 normally experience average daily ridership of less than 10,000. Only two stations within the San Francisco downtown area reported average daily ridership exceeding 10,000. A similar pattern was observed for the stations that reported p-values between 0.05 and 0.1 (see Figure 5b). The number of stations with p-values less than 0.05, and those with p-values between 0.05 and 0.1, markedly decreased during R2 (see Figure 5c,d). Figure 5e,f together show the average daily ridership of stations whose p-values remained low even after the traffic returned to the normal state. Based on the average traveling distance and BART fare, the estimated increase in BART revenue were $60,000 for R1, $35,000 for R2, and $31,000 for R3, respectively.

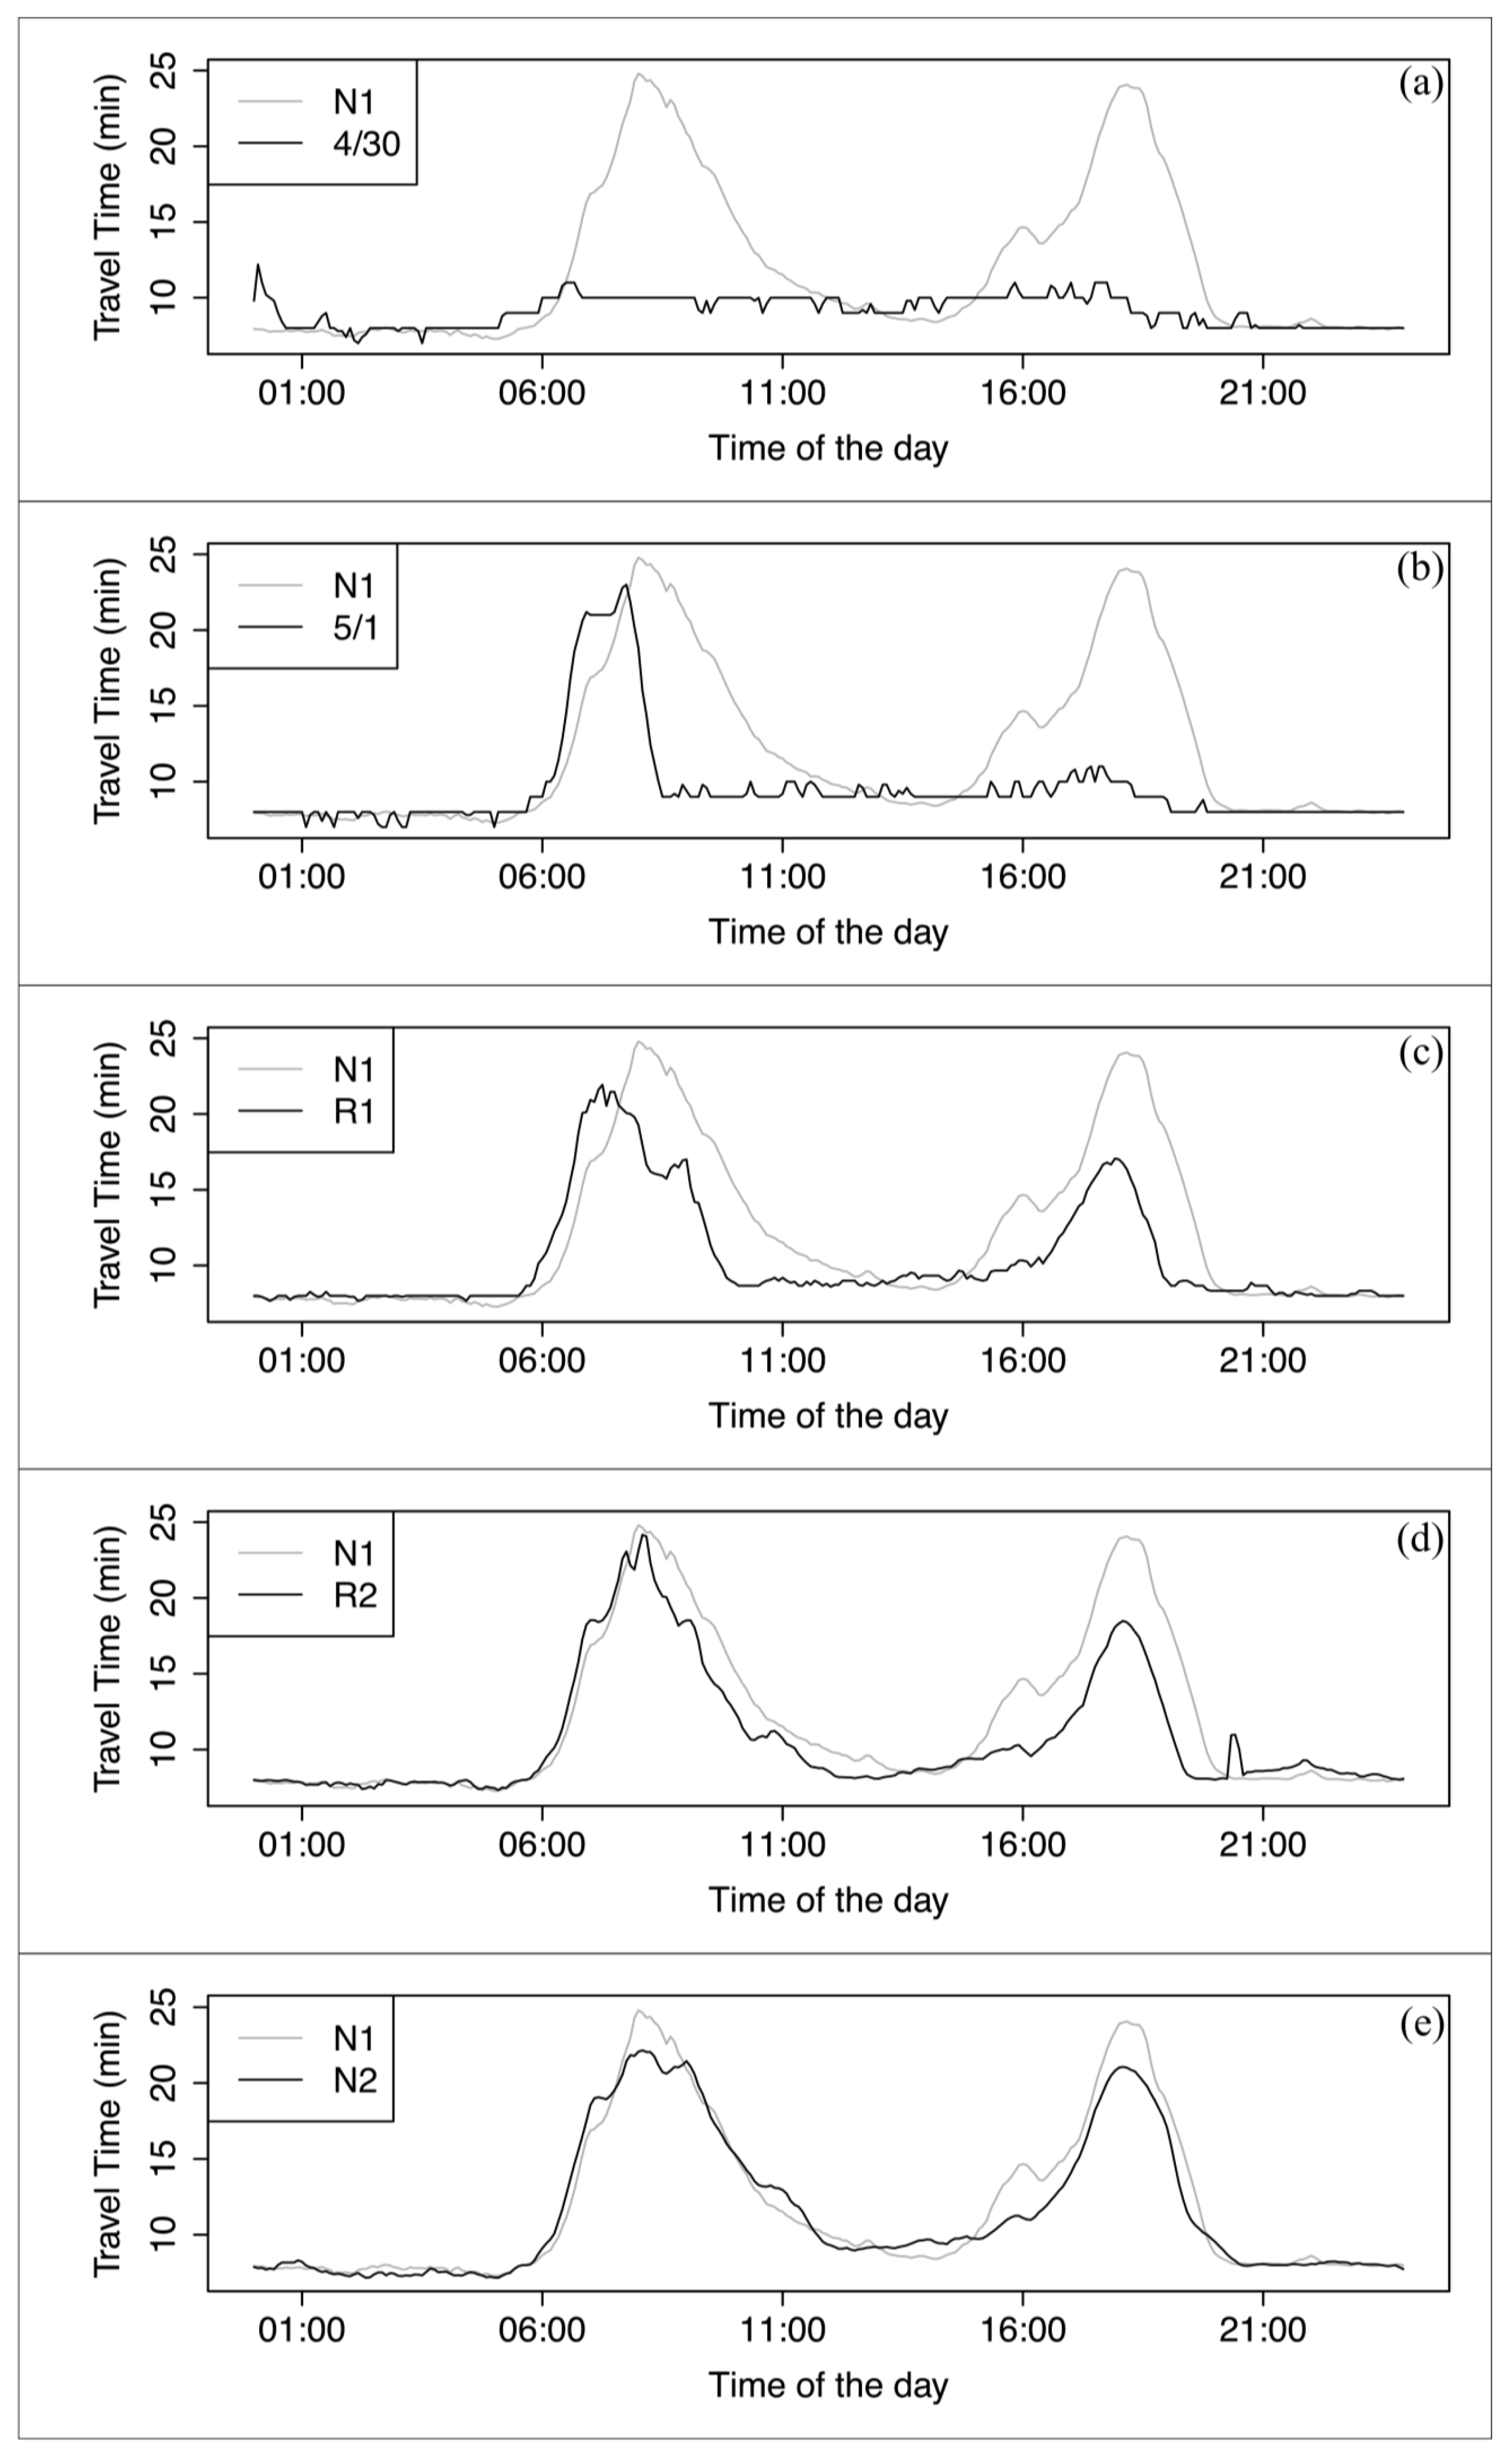
4.2. Effect on Toll Bridges

Traffic volumes observed at four toll bridges (see Figure 6) were evaluated together with the travel times (see Figure 7) provided by www.511.org [26]. The solid grey line in Figure 7a represents average travel times observed along the SFOBB, while the solid black line represents the travel time reported on the day after the Maze Meltdown. It is notable that travel times on 30 April (when BART use was free as declared by the governor) remained much lower than the average weekday travel times. This marked reduction in travel times was accompanied by a reduction in traffic using the SFOBB, as shown in the box plot in Figure 6a.
On 1 May, the travel times from 6:00 a.m. to 8:10 a.m. were comparable with other weekday travel times, but it remained much lower during the remainder of the day. Traffic volume recorded at the SFOBB on 1 May is shown in Figure 6a. Figure 7c–e together show the average weekday travel times observed during N1, R1, R2, and N2. Notice that the travel time returned to the N1 state gradually as the connectors were sequentially reopened. The corresponding traffic volumes are shown in Figure 6a.
Similar travel time patterns were observed at Richmond San Rafael Bridge (RSRB) (see Figure 1a) on 30 April, 30 May, and during R1, R2, and N2. The travel times along Dumbarton Bridge (DB) appeared to be unaffected by the collapse of the connectors. Travel times on the San Mateo Bridge (SMB) for 30 April and 30 May were unavailable, however, travel times during R1, R2, and N2 were comparable to N1 level. The corresponding traffic volumes at those bridges with respect to different time periods are shown in Figure 6.
Based on the estimated changes in toll bridge traffic on the affected bridges, and the toll price, which was $4 in 2007, the estimated reductions in toll revenues are estimated to be $136,750 and $94,000 for 30 April and 1 May, respectively, based on the estimated value of time for Bay Area commuters [27].

5. Conclusions

A tanker truck carrying 8,600 gallons of unleaded gasoline traveling along I-80W to the I-880S connector (see arrow 2 in Figure 1b) hit a guardrail, igniting a fire that engulfed the freeway connector between SFOBB and I-580E (see arrow 4 in Figure 1b), which melted on top of the connector between the I-80W and I-880S (see arrow 2 in Figure 1b). These two connectors were closed for an extended period of time during the repairs. The connector between the I-80W and I-880S was reopened first, followed by the connector between SFOBB and the I-580W, which reopened 26 days after the collapse, and about one month earlier than originally scheduled.
The traffic volumes along four toll bridges shown in Figure 1a were evaluated at different phases shown in Figure 1d. A marked reduction in traffic volumes was observed at SFOBB and RSRB on the day of the collapse. Shortly after the meltdown of the connectors, the governor of California declared a state of emergency, authorizing an entire day of free transit rides for the following day, Monday, 30 April, 2007, the cost of which was subsidized using state funds. The reduction in toll revenues from the four affected bridges was estimated to be $136,750 and $94,000 on 30 April and 1 May, respectively. This daily loss in toll bridge revenues were less than the early completion incentive (i.e., $200,000) provided by Caltrans.
Significant increases in BART ridership were observed during the R1 phase, however the number of stations showing a significant increase in ridership quickly declined during the R2 phase. Notably, even after traffic conditions returned to their normal state, ridership at some stations continued to remain significantly high. This may be due to the fact that many of the riders using those BART stations had not previously traveled via BART. Having used the transit service following the collapse, they might have discovered its convenience and benefits and continued to use BART even after the freeway repairs were completed.
Commuters changed their mode of travel from car to BART even if their traveling freeway route is not directly impacted by a closure. The estimated in increase in the daily BART revenue were $60,000, $35,000, and $31,000 during R1, R2, and N2 periods, respectively. This increase in BART revenue and the reduction in toll revenues resulting from the connector closure can later be used as a reference in determining the amount of incentives for early completion of freeway construction work and subsidies to BART when a major freeway closure is expected to shift significant demand to require BART to alter the transit frequency or capacity by temporally adding additional cars in the train.
Analysis of BART and traffic data showed that the transit service was instrumental in keeping Bay Area commuters moving in the days and weeks following the collapse. A significant increase in BART ridership was observed at a number of stations during the R1 phase, however, no increase in travel times was observed on the adjacent freeway system. Evaluating the fitness of theoretical models, such as the day-to-day traffic equilibrium model [8], network vulnerability analysis [28], evaluation of traveler response to variable message signs [29], and improving existing models for predicting the changes to travel patterns in urban networks caused by highway link disruption and its restoration are topics of future study.

Acknowledgments

The findings and views reported in this paper are solely the opinions of the authors and do not represent the view of Caltrans or BART. Authors greatly appreciate Wingate Lew from Caltrans, Robert Held from BART, and Lai-Han Szeto for providing data used in this study. This research was supported by Basic Science Research Program through the National Research Foundation of Korea (NRF) funded by the Ministry of Science, ICT & Future Planning (NRF-2010-0028693 and NRF-2015R1C1A1A02037285).

Author Contributions

Yoonseok Oh performed the data analysis and provided significant contributions in updating the paper by incorporating the comments from the reviewer. Koohong Chung designed the analysis and contributed in drafting the initial paper. Shin Hyung Park contributed to the travel time comparison analysis. Cheolsun Kim performed the analysis and contributed to most of figures. Seungmo Kang contributed to drafting the initial paper and coordinated the overall effort.

Conflicts of Interest

The authors declare no conflict of interest.

References

  1. Gordon, P.; Richardson, H.W.; Davis, B. Transport-related impacts of the northridge earthquake. J. Transp. Stat. 1998, 1, 21–36. [Google Scholar]
  2. National Research Council. NCHRP Report 732: Methodologies to Estimate the Economic Impacts of Disruptions to the Goods Movement System; Transportation Research Board: Washington, DC, USA, 2012; Volume 732. [Google Scholar]
  3. Kim, T.J.; Ham, H.; Boyce, D.E. Economic impacts of transportation network changes: Implementation of a combined transportation network and input-output model. Pap. Reg. Sci. 2002, 81, 223–246. [Google Scholar] [CrossRef]
  4. Sohn, J.; Kim, T.J.; Hewings, G.J.; Lee, J.S.; Jang, S.-G. Retrofit priority of transport network links under an earthquake. J. Urban Plan. Dev. 2003, 129, 195–210. [Google Scholar] [CrossRef]
  5. Sohn, J. Evaluating the significance of highway network links under the flood damage: An accessibility approach. Transp. Res. Part A Policy Pract. 2006, 40, 491–506. [Google Scholar] [CrossRef]
  6. Sullivan, J.; Aultman-Hall, L.; Novak, D. A review of current pra ctice in network disruption analysis and an assessment of the ability to account for isolating links in transportation networks. Transp. Lett. 2009, 1, 271–280. [Google Scholar] [CrossRef]
  7. Tsuchiya, S.; Tatano, H.; Okada, N. Economic loss assessment due to railroad and highway disruptions. Econ. Syst. Res. 2007, 19, 147–162. [Google Scholar] [CrossRef]
  8. He, X.; Liu, H.X. Modeling the day-to-day traffic evolution process after an unexpected network disruption. Transp. Res. Part B Methodol. 2012, 46, 50–71. [Google Scholar] [CrossRef]
  9. Ye, L.; Mokhtarian, P.L.; Circella, G. Commuter impacts and behavior changes during a temporary freeway closure: The ‘fix i-5’project in sacramento, california. Transp. Plan. Technol. 2012, 35, 341–371. [Google Scholar] [CrossRef]
  10. Nam, D.; Lee, J.; Dunston, P.; Mannering, F. Analysis of the impacts of freeway reconstruction closures in urban areas. Transp. Res. Rec. J. Transp. Res. Board 1999, 1654, 161–170. [Google Scholar] [CrossRef]
  11. Meyer, M.D. Reconstructing major transportation facilities: The case of Boston's southeast expressway. Transp. Res. Rec. J. Transp. Res. Board 1985, 1021, 1–9. [Google Scholar]
  12. Hendrickson, C.T.; Carrier, R.E.; Dubyak, T.J.; Anderson, R.B. Traveler response to reconstruction of parkway east (I-376) in Pittsburgh. Transp. Res. Rec. J. Transp. Res. Board 1982, 890, 33–39. [Google Scholar]
  13. Hunt, J.; Brownlee, A.; Stefan, K. Responses to centre street bridge closure: Where the “disappearing” travelers went. Transp. Res. Rec. J. Transp. Res. Board 2002, 1807, 51–58. [Google Scholar] [CrossRef]
  14. Tilahun, N.; Levinson, D. I-35w Bridge Collapse: Travel Impacts and Adjustment Strategies; St. Paul, M.N., Ed.; Department of Civil Engineering, University of Minnesota: Minneapolis, MN, USA, 2008. [Google Scholar]
  15. Wesemann, L.; Hamilton, T.; Tabaie, S. Traveler response to damaged freeways and transportation system changes following northridge earthquake. Transp. Res. Rec. J. Transp. Res. Board 1996, 1556, 96–108. [Google Scholar] [CrossRef]
  16. Giuliano, G.; Golob, J. Impacts of the northridge earthquake on transit and highway use. J. Transp. Stat. 1998, 1, 1–20. [Google Scholar]
  17. Chang, S.E.; Nojima, N. Measuring post-disaster transportation system performance: The 1995 kobe earthquake in comparative perspective. Transp. Res. Part A Policy Pract. 2001, 35, 475–494. [Google Scholar] [CrossRef]
  18. Fujii, S.; Kitamura, R. Anticipated travel time, information acquisition, and actual experience: Hanshin expressway route closure, osaka-sakai, japan. Transp. Res. Rec. J. Transp. Res. Board 2000, 1725, 79–85. [Google Scholar] [CrossRef]
  19. Faturechi, R.; Miller-Hooks, E. Measuring the performance of transportation infrastructure systems in disasters: A comprehensive review. J. Infrastruct. Syst. 2014, 21, 04014025. [Google Scholar] [CrossRef]
  20. Zhu, S.; Levinson, D.; Liu, H.X.; Harder, K. The traffic and behavioral effects of the i-35w mississippi river bridge collapse. Transp. Res. Part A Policy Pract. 2010, 44, 771–784. [Google Scholar] [CrossRef]
  21. State of California. Governor Schwarzenegger Fast-Tracks Bay Area Freeway Collapse Repairs, i-880 Connector will Open in Less Than 10 Days. Available online: https://www.gov.ca.gov/news.php?id=6109 (accessed on 7 July 2017).
  22. Vandebona, U.; Tsukaguchi, H. Impact of urbanization on user expectations related to public transport accessibility. Int. J. Urban Sci. 2013, 17, 199–211. [Google Scholar] [CrossRef]
  23. San Francisco Bay Area Rapid Transit District. Bart Sets Ridership Record. Available online: http://www.bart.gov/news/articles/2007/news20070502 (accessed on 7 July 2017).
  24. Ceder, A.; Hassold, S.; Dunlop, C.; Chen, I. Improving urban public transport service using new timetabling strategies with different vehicle sizes. Int. J. Urban Sci. 2013, 17, 239–258. [Google Scholar] [CrossRef]
  25. Casual Carpool News. Available online: http://www.ridenow.org/carpool/ (accessed on 7 July 2017).
  26. Metropolitan Transportation Commission. 511 SF Bay. Available online: http://www.511.org/ (accessed on 4 July 2014).
  27. Jang, K.; Chung, K.; Yeo, H. A dynamic pricing strategy for high occupancy toll lanes. Transp. Res. Part A Policy Pract. 2014, 67, 69–80. [Google Scholar] [CrossRef]
  28. Jenelius, E.; Petersen, T.; Mattsson, L.G. Importance and exposure in road network vulnerability analysis. Transp. Res. Part A Policy Pract. 2006, 40, 537–560. [Google Scholar] [CrossRef]
  29. Majumder, J.; Kattan, L.; Habib, K.N.; Fung, T.S. Modelling traveller response to variable message sign. Int. J. Urban Sci. 2013, 17, 259–280. [Google Scholar] [CrossRef]
Figure 1. (a) Map of the San Francisco Bay Area, California; (b) map of the MacArthur Maze; (c) picture of the melted section of I-80W to I-580E connector; and (d) diagram of the analysis periods.
Applsci 07 00726 g001
Figure 2. (a) Map of Bay Area Rapid Transit (BART) stations; (b) comparison of the average weekday hourly ridership between N1 and R1 at El Cerrito Plaza station; (c) comparison of the average weekday hourly ridership between N1 and R2 at El Cerrito Plaza station; (d) comparison of the average weekday hourly ridership between N1 and N2 at El Cerrito Plaza station; and (e) empirical probability distribution of the daily demand observed at El Cerrito Plaza station prior to the Maze Meltdown.
Applsci 07 00726 g002aApplsci 07 00726 g002b
Figure 3. (a) Histogram of p-values of the average weekday daily BART entrance ridership during R1; (b) map of values shown in Figure 3a; (c) histogram of p-values of the average weekday daily BART entrance ridership during R2; (d) map of values shown in Figure 3c; (e) histogram of p-values of the average weekday daily BART entrance ridership during N2; and (f) map of values shown in Figure 3e.
Applsci 07 00726 g003
Figure 4. (a) Histogram of p-values of the average weekday daily BART exit ridership during R1; (b) map of values shown in Figure 4a; (c) histogram of p-values of the average weekday daily BART exit ridership during R2; (d) map of values shown in Figure 4c; (e) histogram of p-values of the average weekday daily BART exit ridership during N2; and (f) map of values shown in Figure 4e.
Applsci 07 00726 g004
Figure 5. (a) Distribution of the average ridership of stations with p-values <0.05 during R1; (b) distribution of the average ridership of stations with p-values between 0.05 and 0.1 during R1; (c) distribution of the average ridership of stations with p-values <0.05 during R2; (d) distribution of the average ridership of stations with p-values between 0.05 and 0.1 during R2; (e) distribution of the average ridership of stations with p-values <0.05 during N2; and (f) distribution of the average ridership of stations with p-values between 0.05 and 0.1 during N2.
Applsci 07 00726 g005
Figure 6. (a) Box plot of the weekday AADT at the SFOBB toll plaza and the AADT observed after Maze Meltdown; (b) box plot of the weekday AADT at the SMB toll plaza and the AADT observed after Maze Meltdown; (c) box plot of the weekday AADT at the RSRB toll plaza and the AADT observed after Maze Meltdown; and (d) box plot of the weekday AADT at the DB toll plaza and the AADT observed after Maze Meltdown.
Applsci 07 00726 g006
Figure 7. (ae) Travel time distributions of the route from the MacArthur Maze to the end point of the I-80W depends on the several analysis phases.
Applsci 07 00726 g007

