Article

Broken Rotor Bar Detection in LS-PMSM Based on Startup Current Analysis Using Wavelet Entropy Features

by
Mohammad Rezazadeh Mehrjou
1,2,
Norman Mariun
1,2,
Norhisam Misron
2,*,
Mohd Amran Mohd Radzi
1,2 and
Suleiman Musa
1,2
1
Department of Electrical and Electronic Engineering, Universiti Putra Malaysia, Serdang 43400, Selangor, Malaysia
2
Centre of Advanced Power and Energy Research (CAPER), Universiti Putra Malaysia, Serdang 43400, Selangor, Malaysia
*
Author to whom correspondence should be addressed.
Submission received: 16 June 2017 / Revised: 3 August 2017 / Accepted: 9 August 2017 / Published: 17 August 2017

Abstract

:
High-efficiency motors are being gradually introduced in many industrial applications because of their positive impacts on the environment by reducing energy consumption and CO2 emission. In this respect, line start permanent magnet synchronous motors (LS-PMSMs) have been introduced recently. Due to their unique configuration, LS-PMSMs allow the obtaining of super premium efficiency levels, accompanied with a high torque and power factor. However, since the use of LS-PMSMs in the industry is in its infancy, no efficient scheme has yet been reported for broken rotor bar (BRB) fault detection in this type of motor. Accordingly, the main aim of this research is to investigate the fault-related feature for BRB faults on LS-PMSMs. In this regard, a simulation model and experimental setup for the investigation of BRB in LS-PMSM are implemented. The detection strategy for BRB in LS-PMSM proposed here is based on the monitoring of the start-up current signal and discrete wavelet transform. The entropy features are used as fault-related features for BRB faults. Finally, the ability of these features is validated for the detection of BRB in LS-PMSM through statistical analysis. In this research, the importance of the starting load is also considered for BRB detection in LS-PMSMs.

1. Introduction

Induction machines that facilitate the production processes and related services lead to enormous changes in human lifestyles. Induction machines are extensively used in all aspects of industrial, commercial, domestic, utility and special-purpose commercial markets owing to their rugged configuration, low cost, versatility, reasonably small size, and their operation with an easily available power supply. However, induction machines suffer from a low efficiency and low power factor that means the loss of energy is high. This issue is viewed as an important disadvantage because of the energy cost and global energy concerns.
The improvement of induction machine efficiency was tried through an optimal design of these motors. However, due to several inherent limitations, it is difficult to improve the efficiency of induction machines significantly. An alternative solution is to replace the induction machines with high-efficiency permanent magnet synchronous motors (PMSMs). An important obstacle for ordinary PMSMs is they need an inverter to start that is not economical for many single speed applications. To overcome this problem, the squirrel-cage bar-equipped PM motors—called line start permanent magnet synchronous motors (LS-PMSMs) —have been introduced. LS-PMSMs also allow for the reaching of super premium efficiency levels [1,
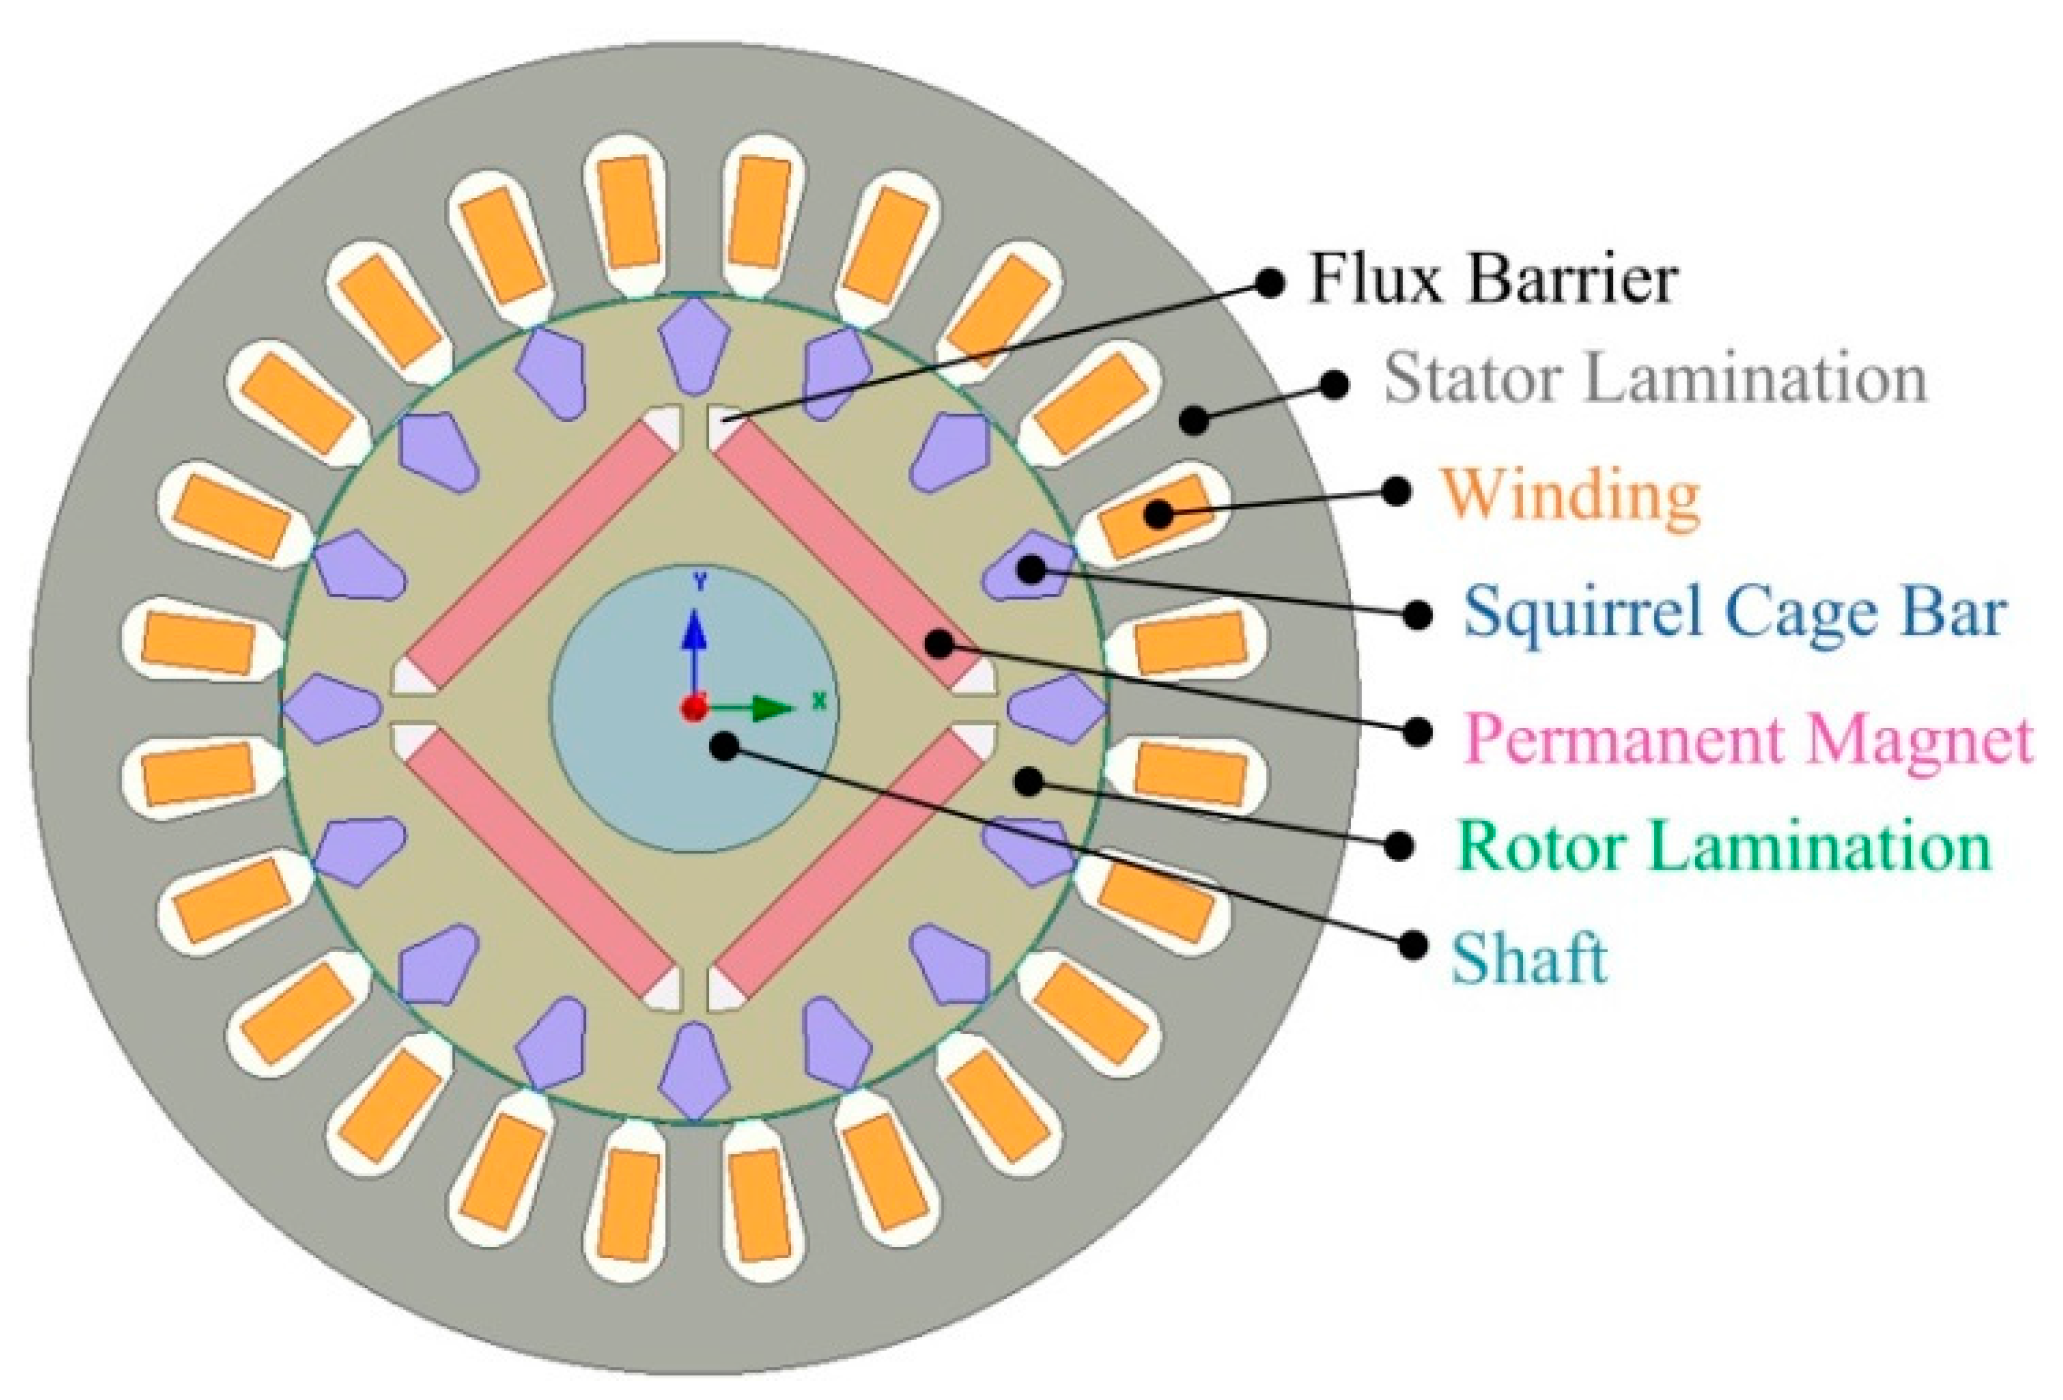
2]. The structure and configuration of the three phase-four pole LS-PMSM are depicted in Figure 1.
An LS-PMSM is made up of a stator and a hybrid rotor with a squirrel-cage and pairs of permanent magnets. In this machine, when the rotor is operated from a standstill, squirrel-cage bars generate a suitably high starting torque, enabling the direct-on-line movement of the rotor. The reverse-rotating fields of the air gap reduces in a squirrel-cage rotor when there is an unbalancing in the load condition or there is a fluctuation in the rotation speed. Otherwise, if there is no squirrel-cage in the rotor, these conditions lead to significant losses, and no reduction in the reverse-rotating fields is observed [3].
In the industry, LS-PMSMs are exposed to unavoidable stresses; for example, electrical, environmental, mechanical and thermal stresses. These stresses produce some failures and imperfections in different parts of the LS-PMSMs. Usually, the generated faults disrupt the operation of the LS-PMSMs, degrade the manufacturing quality, and therefore result in significant cost penalties. Maintenance costs can be greatly reduced with the application of an efficient fault detection method, as this avoids spontaneous downtimes. The application of LS-PMSM is growing gradually, although the industry is still lacking an accurate fault detection criterion for maintenance policies of the motor.
The aim of this paper is to extend a motor startup methodology to the detection of a broken rotor bar (BRB) in LS-PMSM. In this method, a novel approach of deriving the amplitude of the left sideband harmonic (LSH) in a specific sub-band frequency is presented for BRB. Using discrete wavelet transform, LSH is extracted from the current spectrum and is used as an input for entropy features.

2. Background and Methodology

The key for successful fault detection in electrical machines relies on the availability of accurate information from them which allows for the understanding of the machine’s condition. Thus, the basis of any fault detection system is precise condition monitoring. It can easily be realized from the name that condition monitoring is an act designed to observe the performance of a device, including electric machines, with the purpose of a maintenance strategy. The reliability of condition monitoring techniques depends upon the best understanding of motor characteristics, including electrical and mechanical characteristics, in both healthy and faulty conditions. In this respect, condition monitoring techniques have continuously been developed over the years, resulting in a range of available methods for failure diagnosis in electrical devices. Condition monitoring techniques presented for broken rotor bar detection in induction machines can be classified into the following categories [4,5]:
Acoustic Emission [6];
Air Gap Torque [7];
Motor Current Signature Analysis (MCSA) [8];
Electromagnetic Field Monitoring [9];
Instantaneous Angular Speed [10];
Power [11];
Motor Circuit Analysis [12];
Thermal [13];
Vibration [14];
Voltage [15].
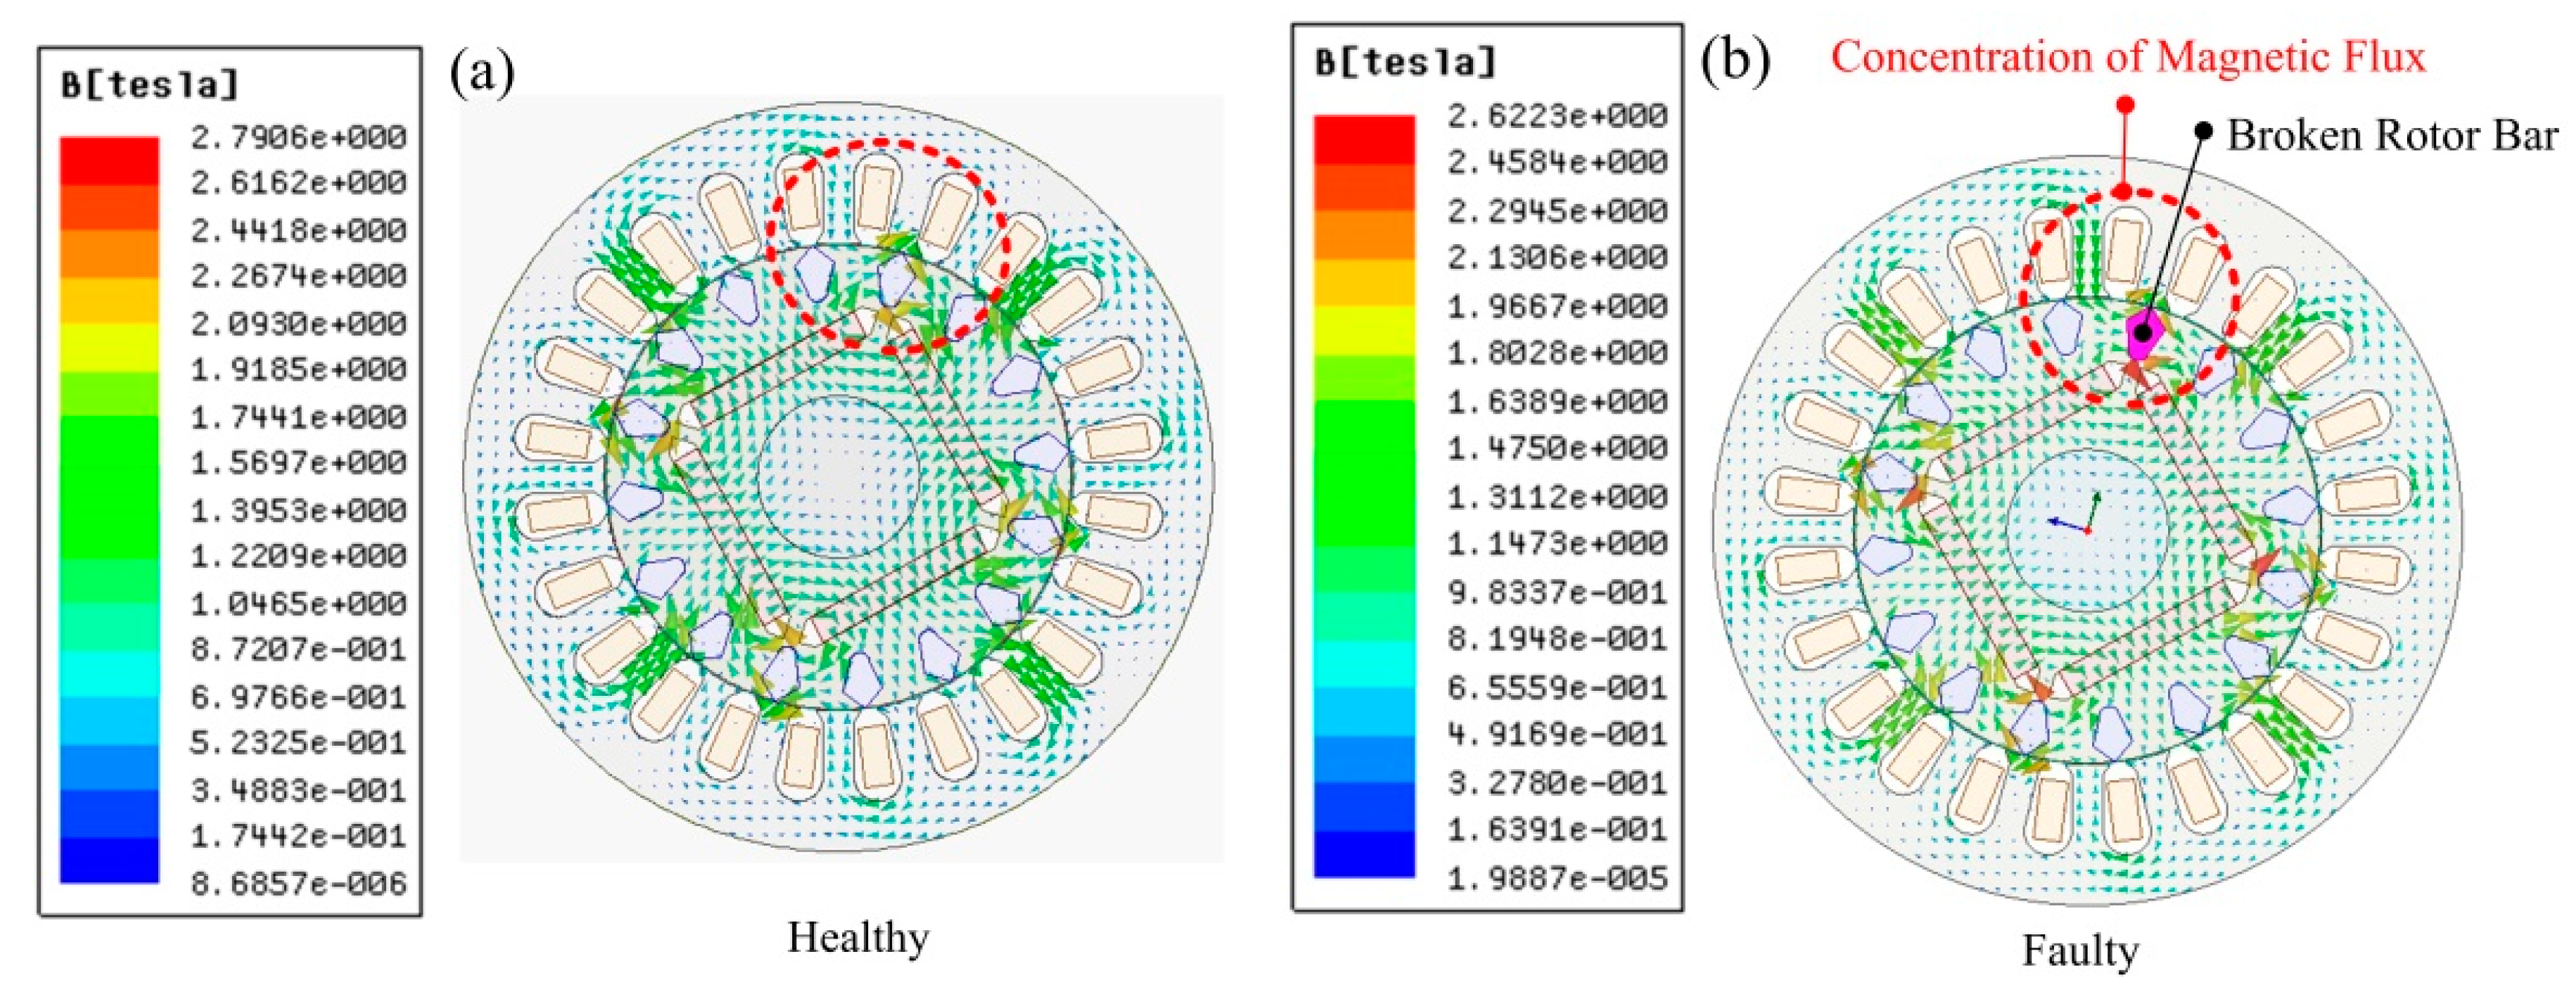
This section discusses the influence of BRB on the rotor magneto-motive force (MMF) and its effects on the stator current signals. The forward component of this MMF, in a healthy case, rotates at a synchronous speed, ω s y n , with respects to the stator (or s ω s y n 
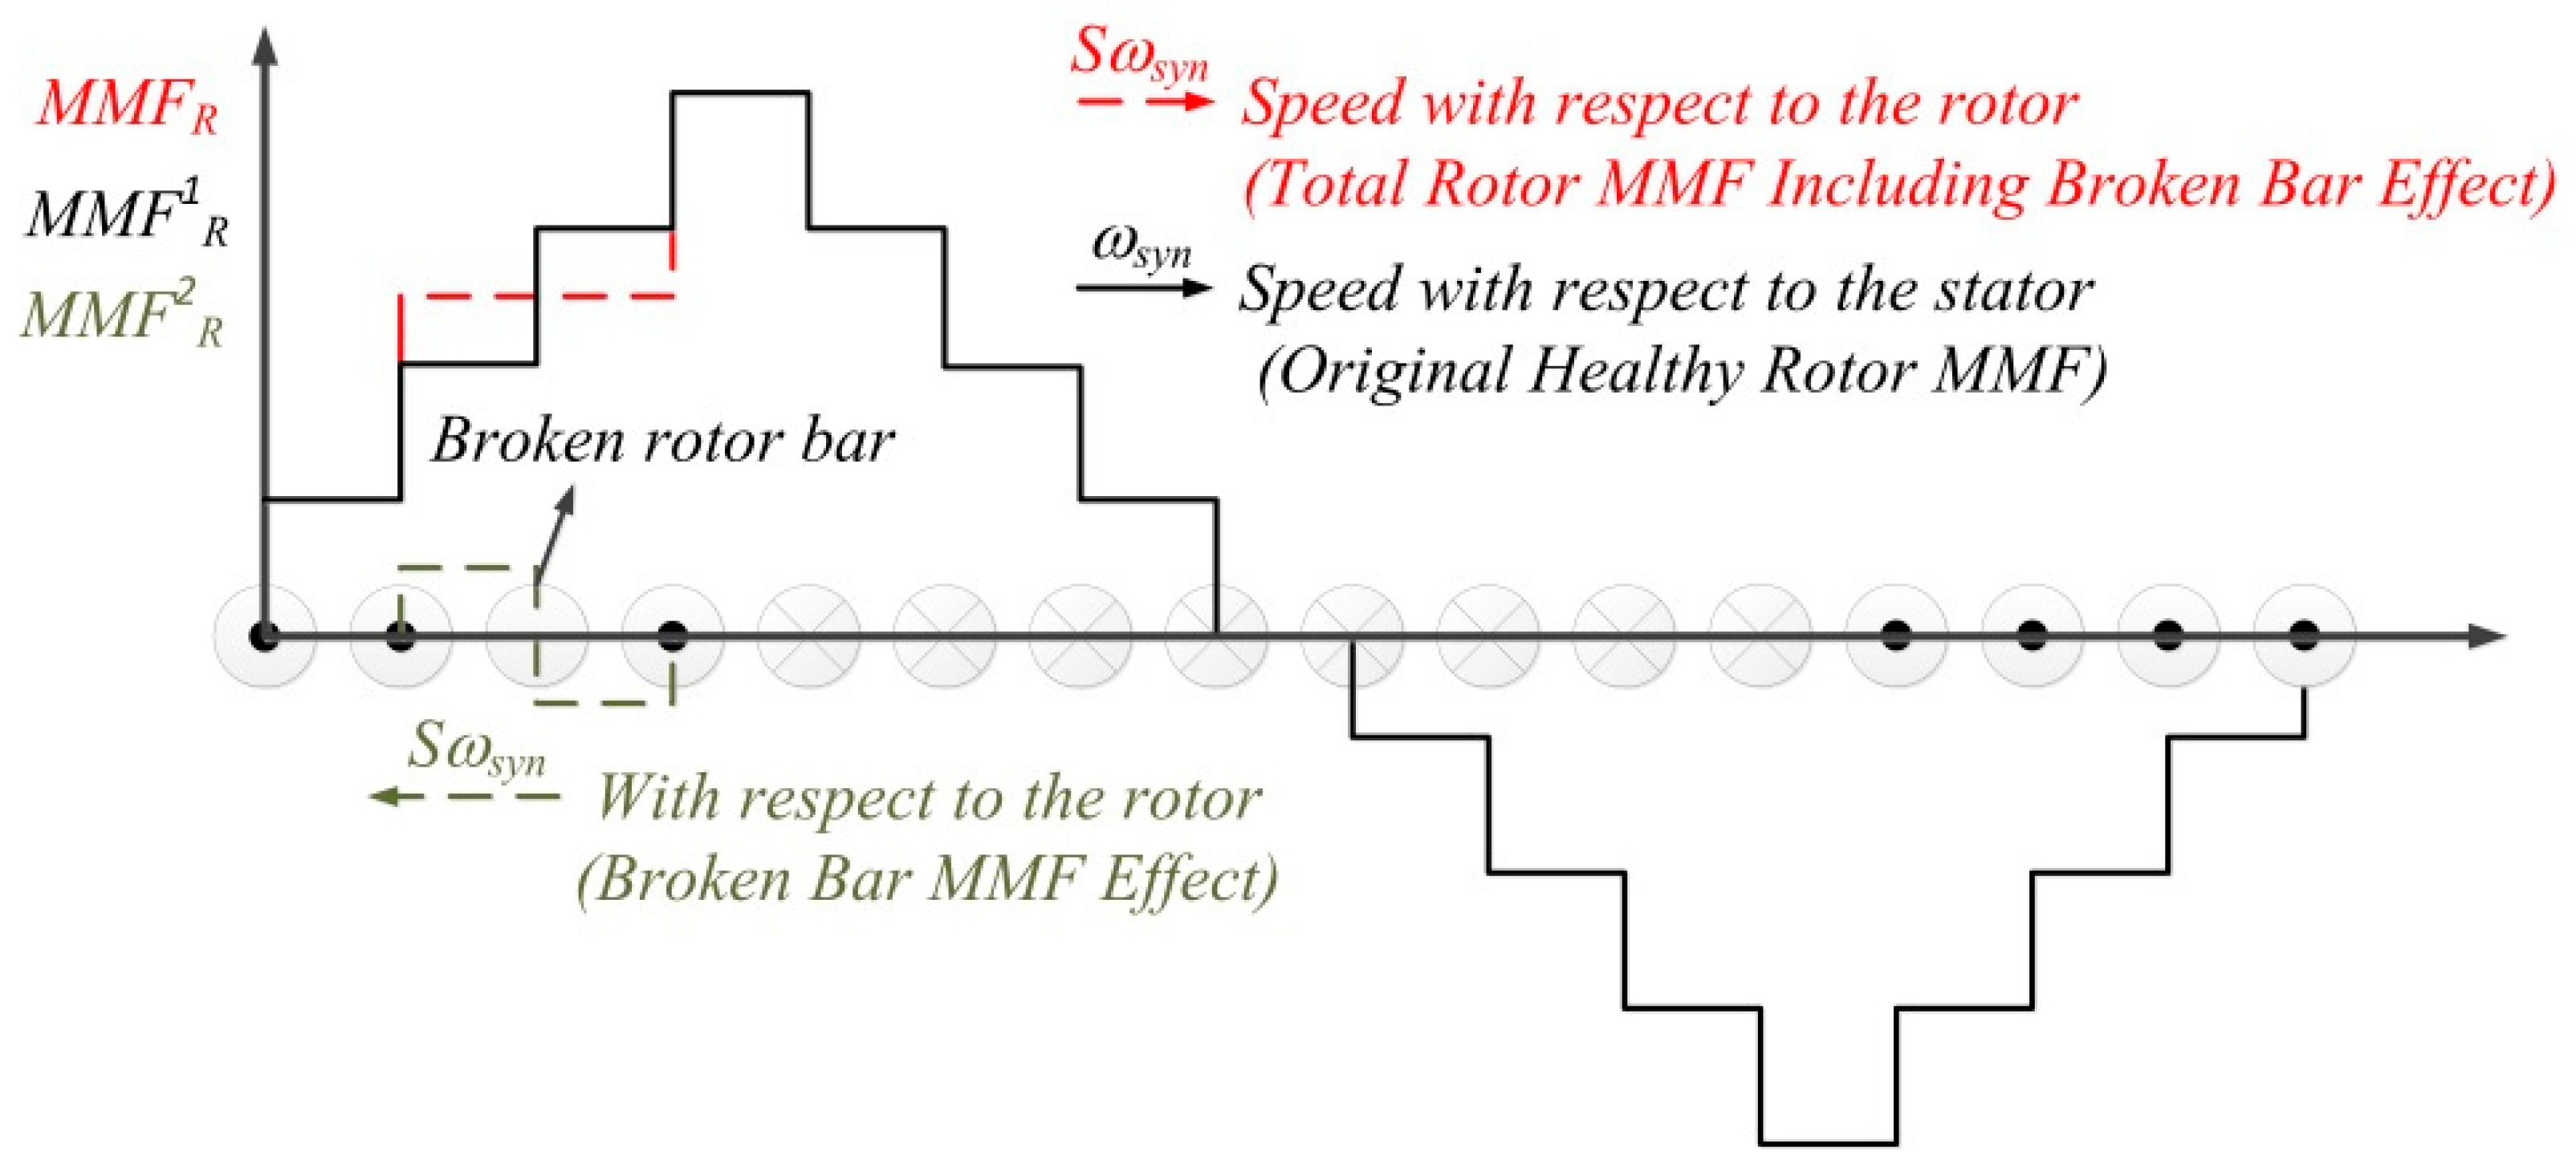
with regard to the rotor). When a bar cracks, there will be no current flow in it, and therefore no magnetic flux is produced surrounding the BRB. As there is no magnetic flux around the BRB, a non-zero backward rotating field is generated, and thus an asymmetry is created in the rotor MMF. It is worth mentioning that the backward rotating field in a healthy rotor is zero. The non-zero backward rotating component produced due to the existence of a BRB conducts an equal but reverse current in the healthy bars. Such a current causes secondary failure. The rotation of non-zero backward MMF as a result of BRB is at a slip speed, which is defined by s ω s y n with regards to the rotor or by Equation (1) with respect to the stator [16].
ω b M M F = s ω s y n + ω m = s ω s y n + ( 1 s ) ω s y n = ( 1 2 s ) ω s y n
The non-zero backward MMF produces harmonics which are superimposed on the stator currents. These superimposed features can be used as signatures for the detection of BRB in the MCSA technique [17]. Figure 2 shows the effect of BRB faults on the MMF of rotor for a cage with 16 bars per pair of poles. As explained before, broken bars cause harmonic components of ( 1 2 k s ) f in the stator current. Among these components, the main one corresponds to the frequency that has ( k = 2 ) , called the left sideband harmonic (LSH) and defined as:
f L S H = ( 1 2 s ) f
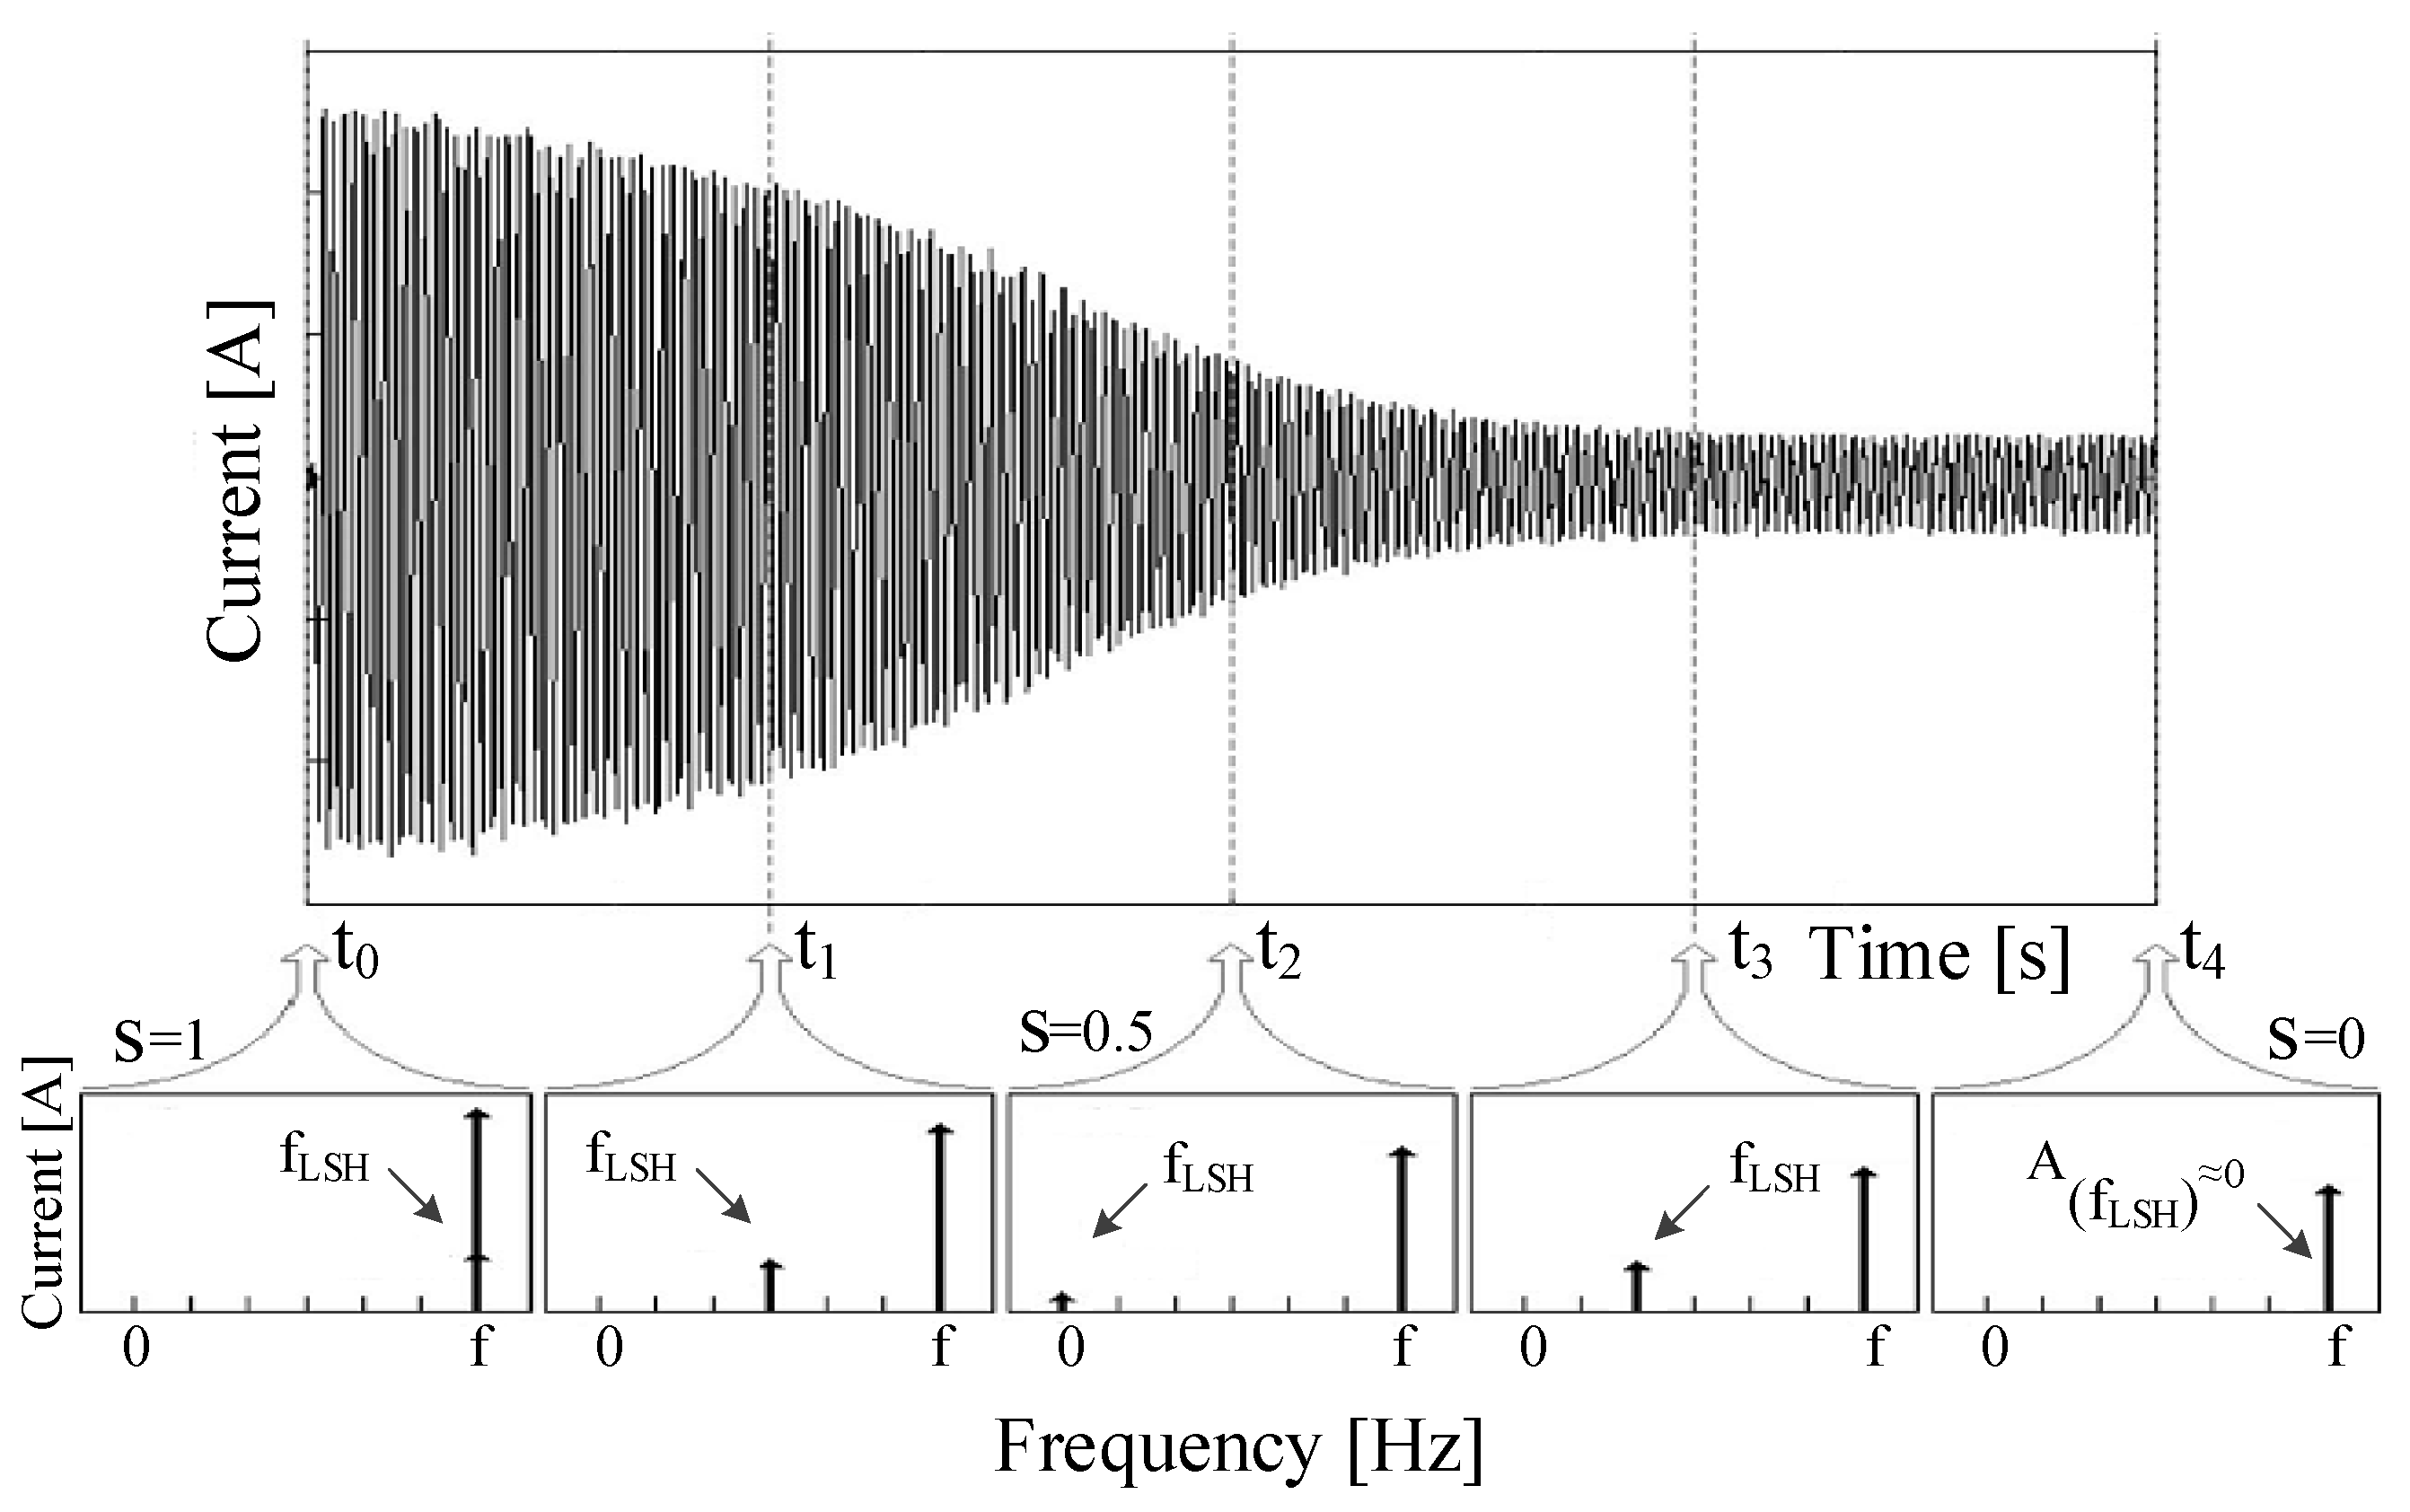
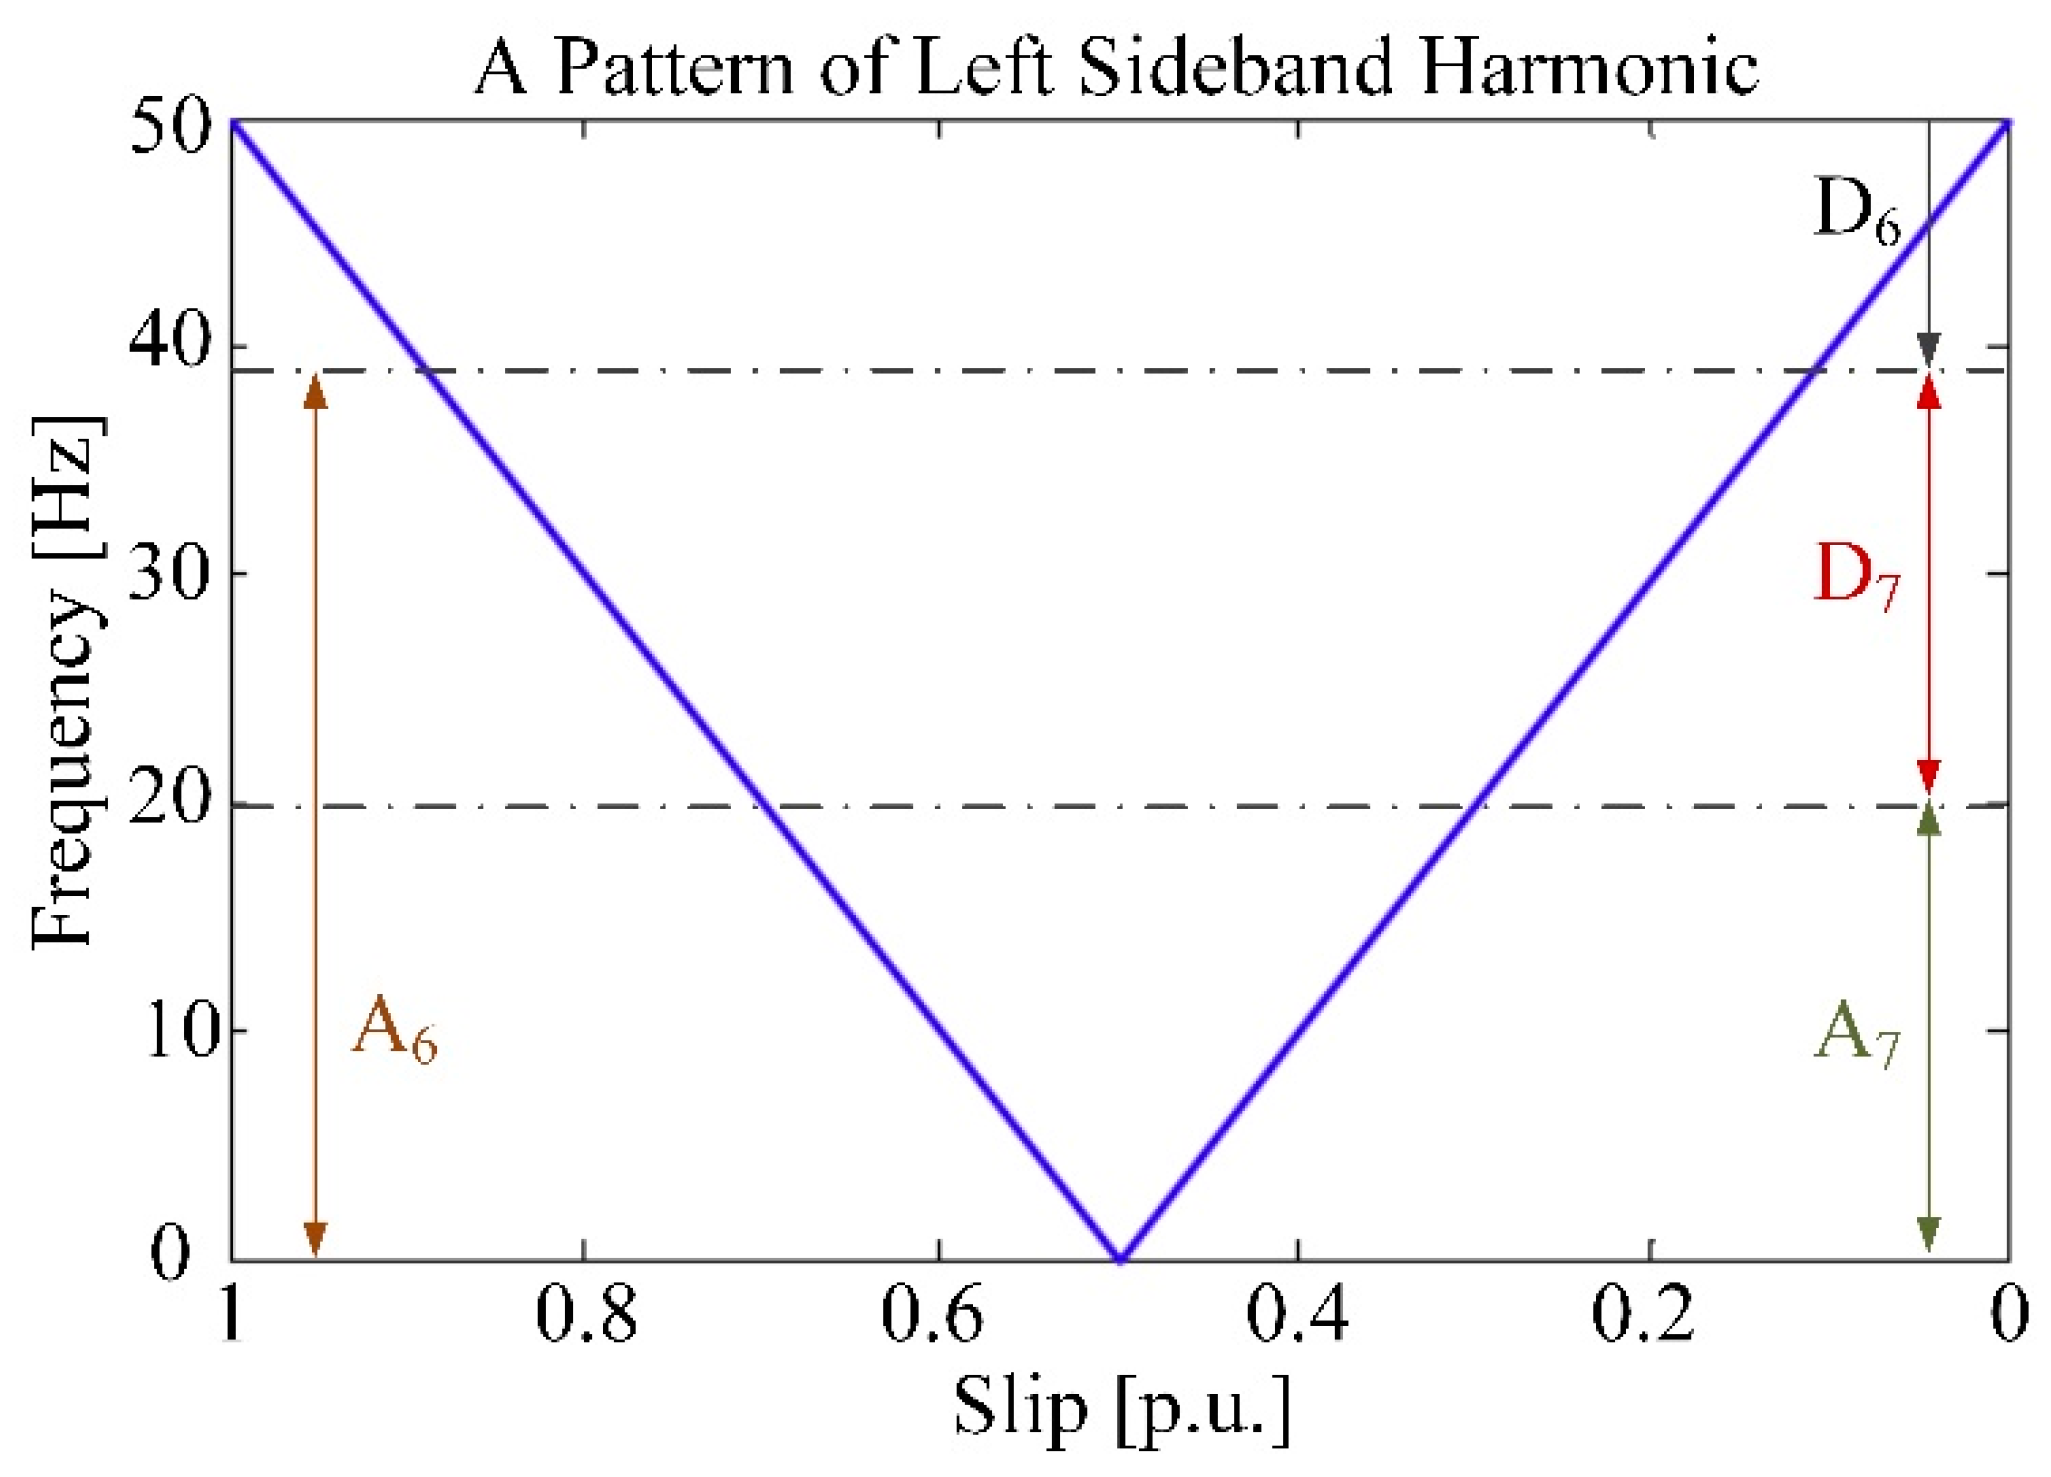
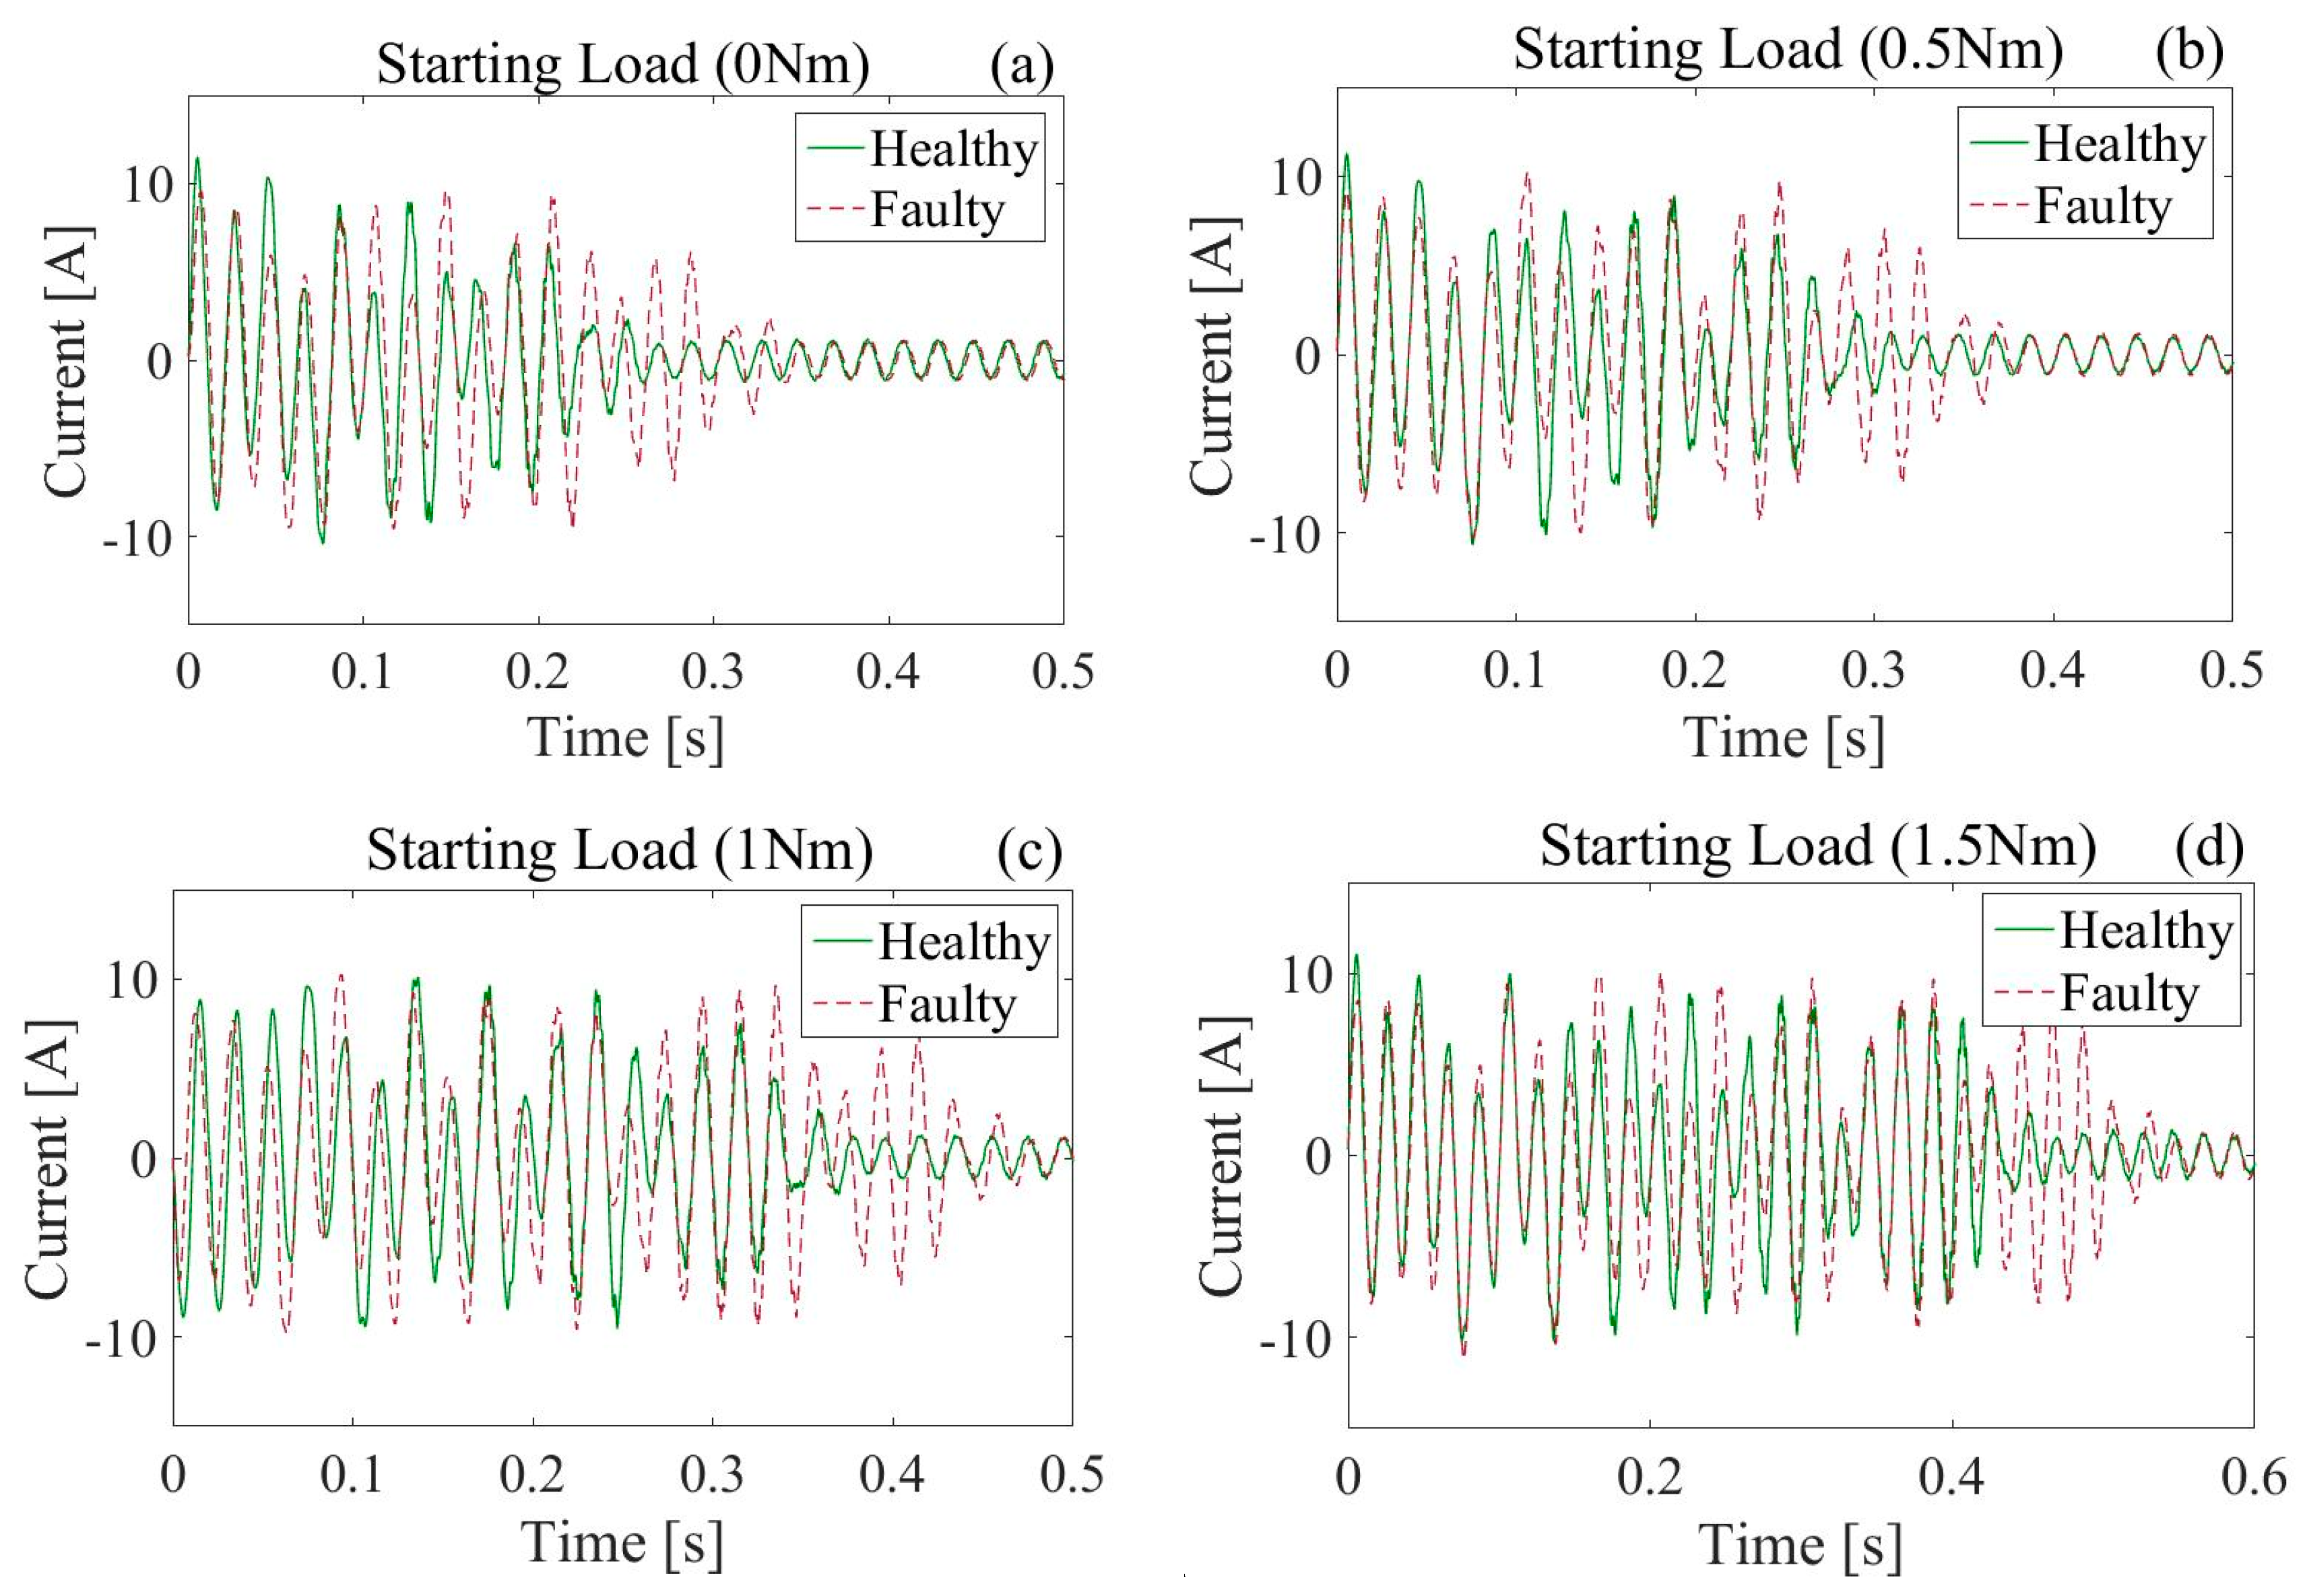
The motor slip changes from one to zero during the start-up; at the beginning of the start-up, the motor slip is one and it goes to zero when the motor reaches the steady state. Accordingly, the frequency of LSH ( f L S H ) varies from the value equal to the fundamental frequency to zero and vice versa. The appearance of this harmonic and its particular evolution were also explained [
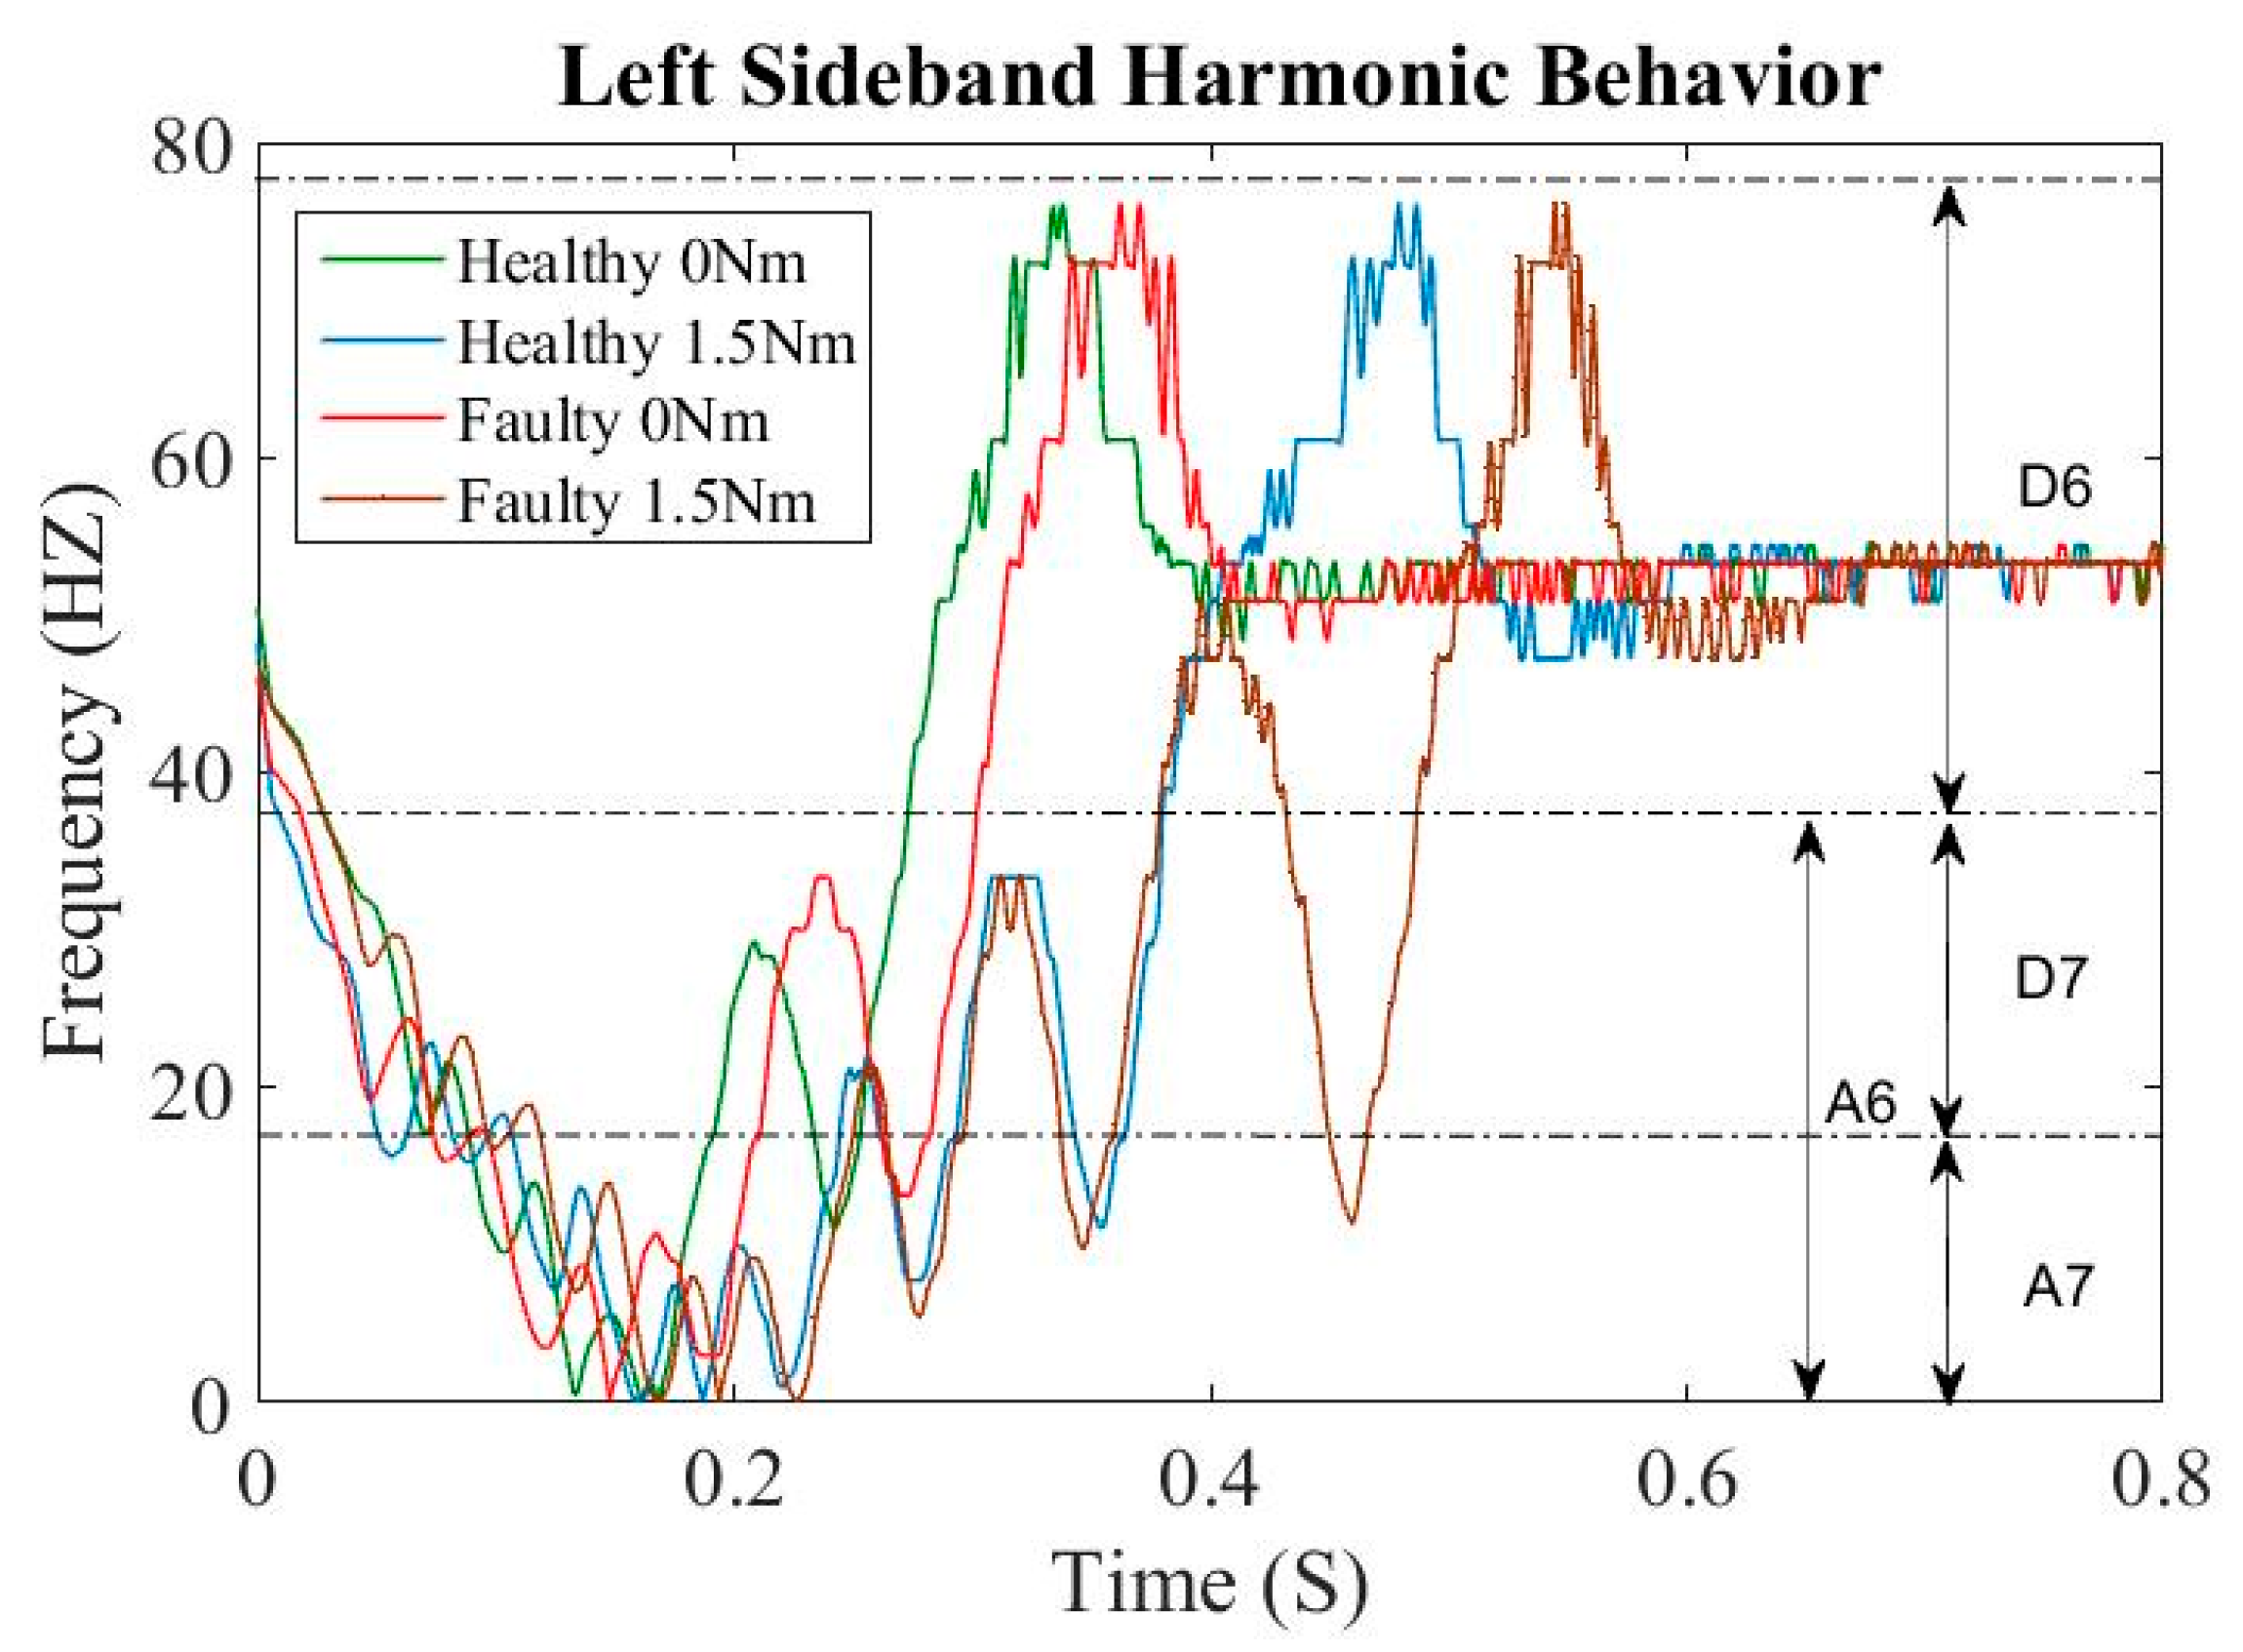
18]. Squirrel-cage bars in LS-PMSM improve start-up operation by allowing the rotor to have direct-on-line movement. In the stationary region, no current flows in the squirrel-cage bars and thus the value of LSH becomes zero, A f L S H 0 . The behavior of the LSH frequency for LS-PMSM during the start-up transient is shown in Figure 3.
The main idea underlying this methodology is the tracking of the characteristic transient evolution of the fault-related feature from the LSH pattern [19]. Wavelet transform has been shown to be one of the best tools for non-stationary signal analysis [20]. The applicability of using wavelet transform for decomposing a signal and extracting its sensitive bands is considered to be good for the health monitoring of an electrical motor and fault diagnosis [21]. Discrete wavelet transform (DWT) is proposed to be used because it provides a dyadic band-pass filtering of the signal as well as the advantages of its simplicity, low computational requirements and the easy interpretation of the obtained results [18]. The DWT is computed through the Mallat algorithm, in which low-pass and high-pass filtering of a time-domain signal is performed while the sampling rate changes [22]. DWT allows high frequency components to be analyzed with short time intervals, and low frequency components to be analyzed with long time intervals [23]. The decomposition of a sampled signal i ( t ) . using DWT results n + 1 wavelet signals, which are an approximation signal, A n ( t ) , and n detail signals D j ( t ) with j varying from 1 to n [24].
i ( t ) = ( A n ( t ) + D n ( t ) + + D 1 ( t ) )
The parameter n is an integer known as the number of decomposition levels and it is set based on the sampling rate ( f s ), which is used for capturing i ( t ) . The n also can be computed based on the frequency interval covered by the fault-related component. Taking into account whether the second rule is considered, n should be less than predicted by the sampling rate. The approximation signal A n ( t ) is obtained using the scaling function, deduced by the father wavelet ( φ j n ) and scaling coefficients a j n :
A n ( t ) = i a j n · φ j n ( t )
The detail signal D n ( t ) is calculated using d i j as a base; the wavelet coefficients with level j , which is a scaled and time-expanded version of the wavelet functions, are deduced by the mother wavelet ( ψ i j ):
D n ( t ) = i d i j · ψ i j ( t )
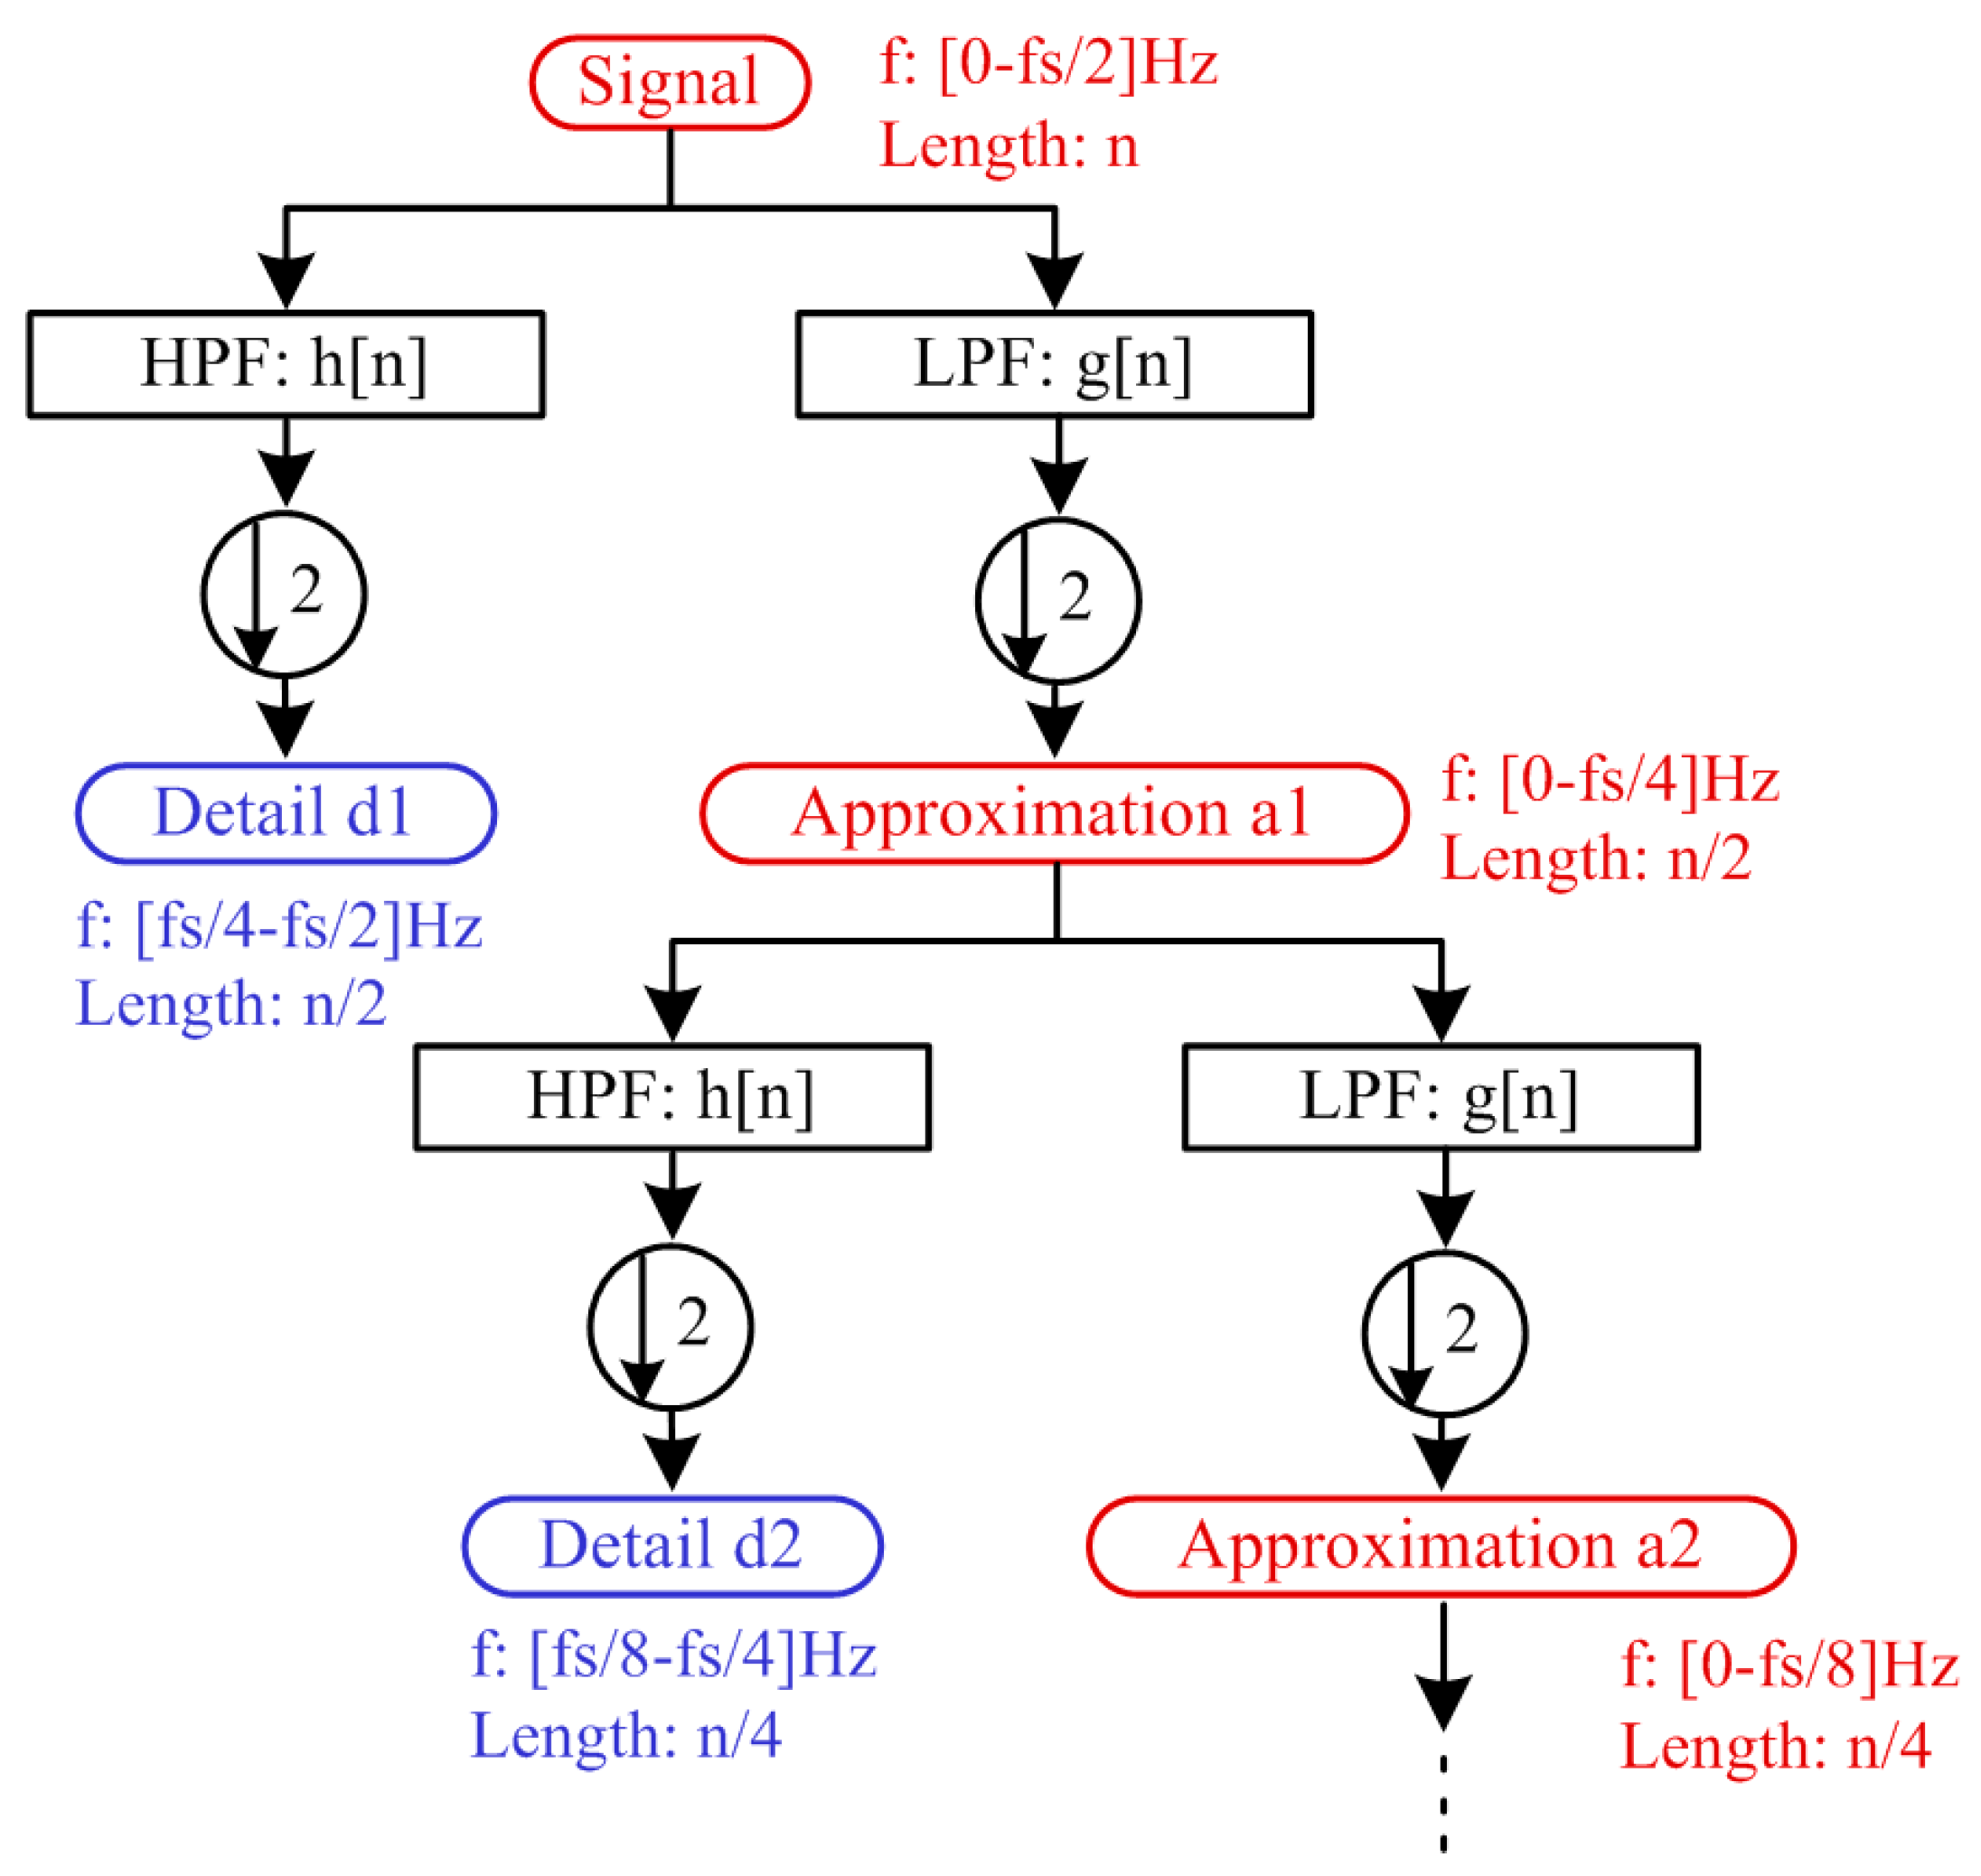
Figure 4 illustrates the dyadic wavelet decomposition algorithm regarding the coefficients of the transform at the different levels according to the description by [25]. In this figure, the length of those coefficients and the frequency content at each level is shown, considering an original signal with a sampling rate of f s samples/s.
The analysis of these signals reveals the time evolution of the components of the signal i ( t ) which are contained within its corresponding frequency band. The approximation signal includes the low-frequency components of the signal, belonging to the interval:
f ( A n ) [ 0.2 ( n + 1 ) f s ] Hz
More concretely, the detail contains the information concerning the signal components with frequencies included in the interval:
f ( D n ) [ 2 ( n + 1 ) f s · 2 n f s ] Hz
There are many different mother wavelet functions that are categorized based on their real type, such as the Coiflet wavelet, and their complex type, such as the Morlet wavelet. In fault detection algorithms, different types of mother wavelets have been used with satisfactory results [26,27]. In this work, the DWT of the motor start-up current has been performed using a fourth-order biorthogonal Coiflet wavelet. The sampling frequency used to capture the data in this research is 5000 samples/s. To define the suitable level of decomposition, the main signal of the motor current was initially decomposed into seven levels, where each level has its own range of frequencies. Table 1 presents the frequency bands equivalent to each level. Clearly, the fundamental frequency is located in the frequency range corresponding to the detail of level six.
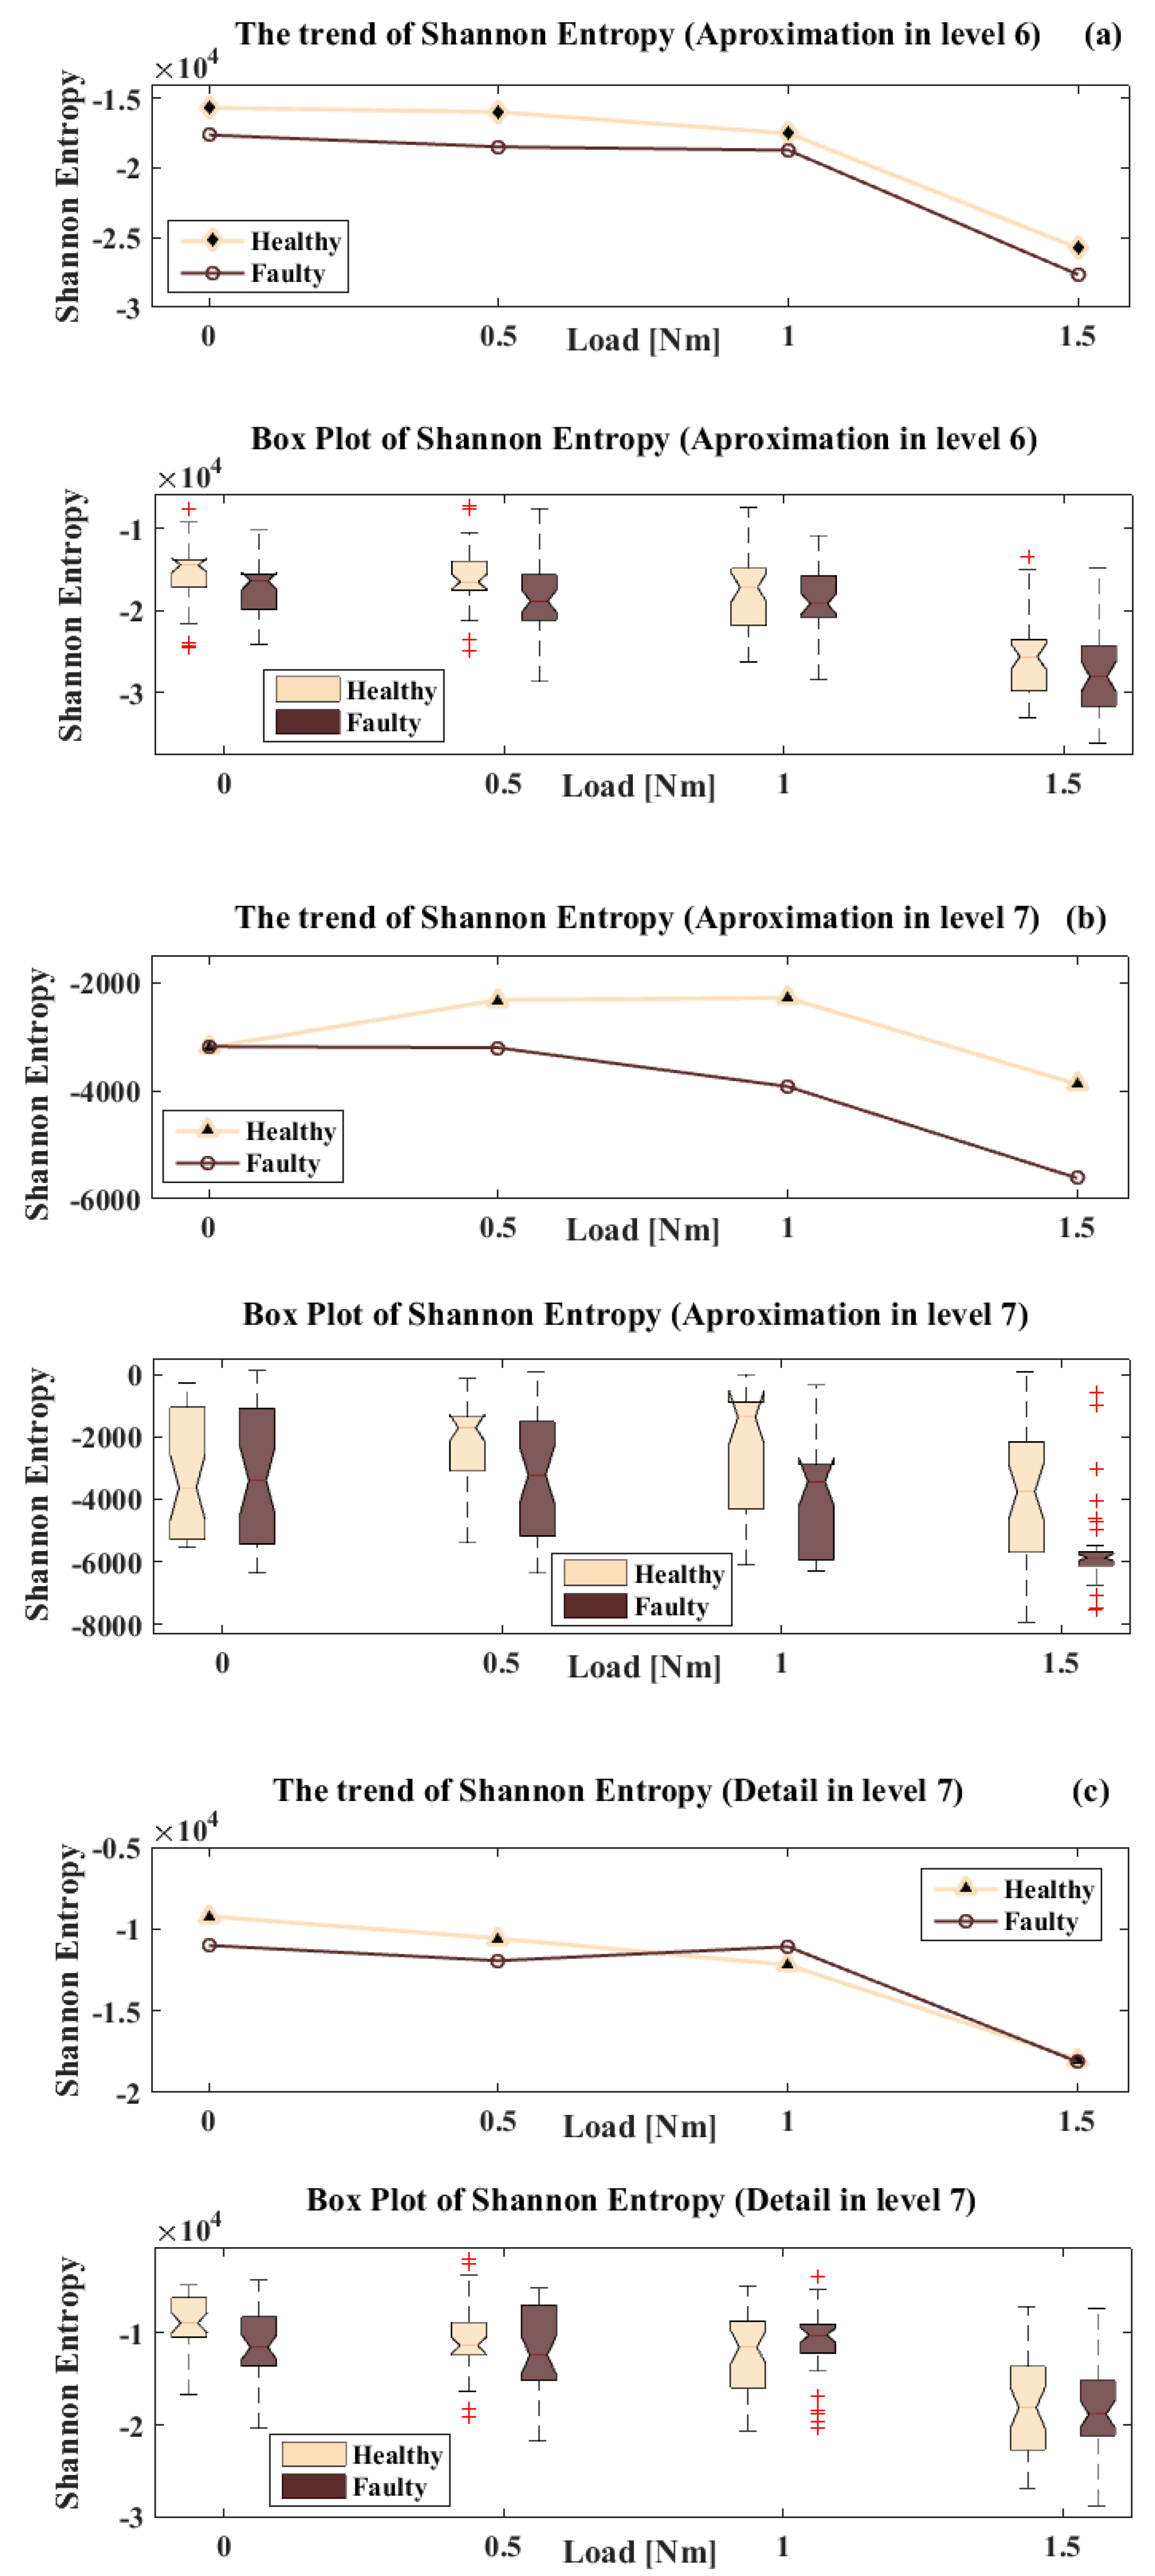
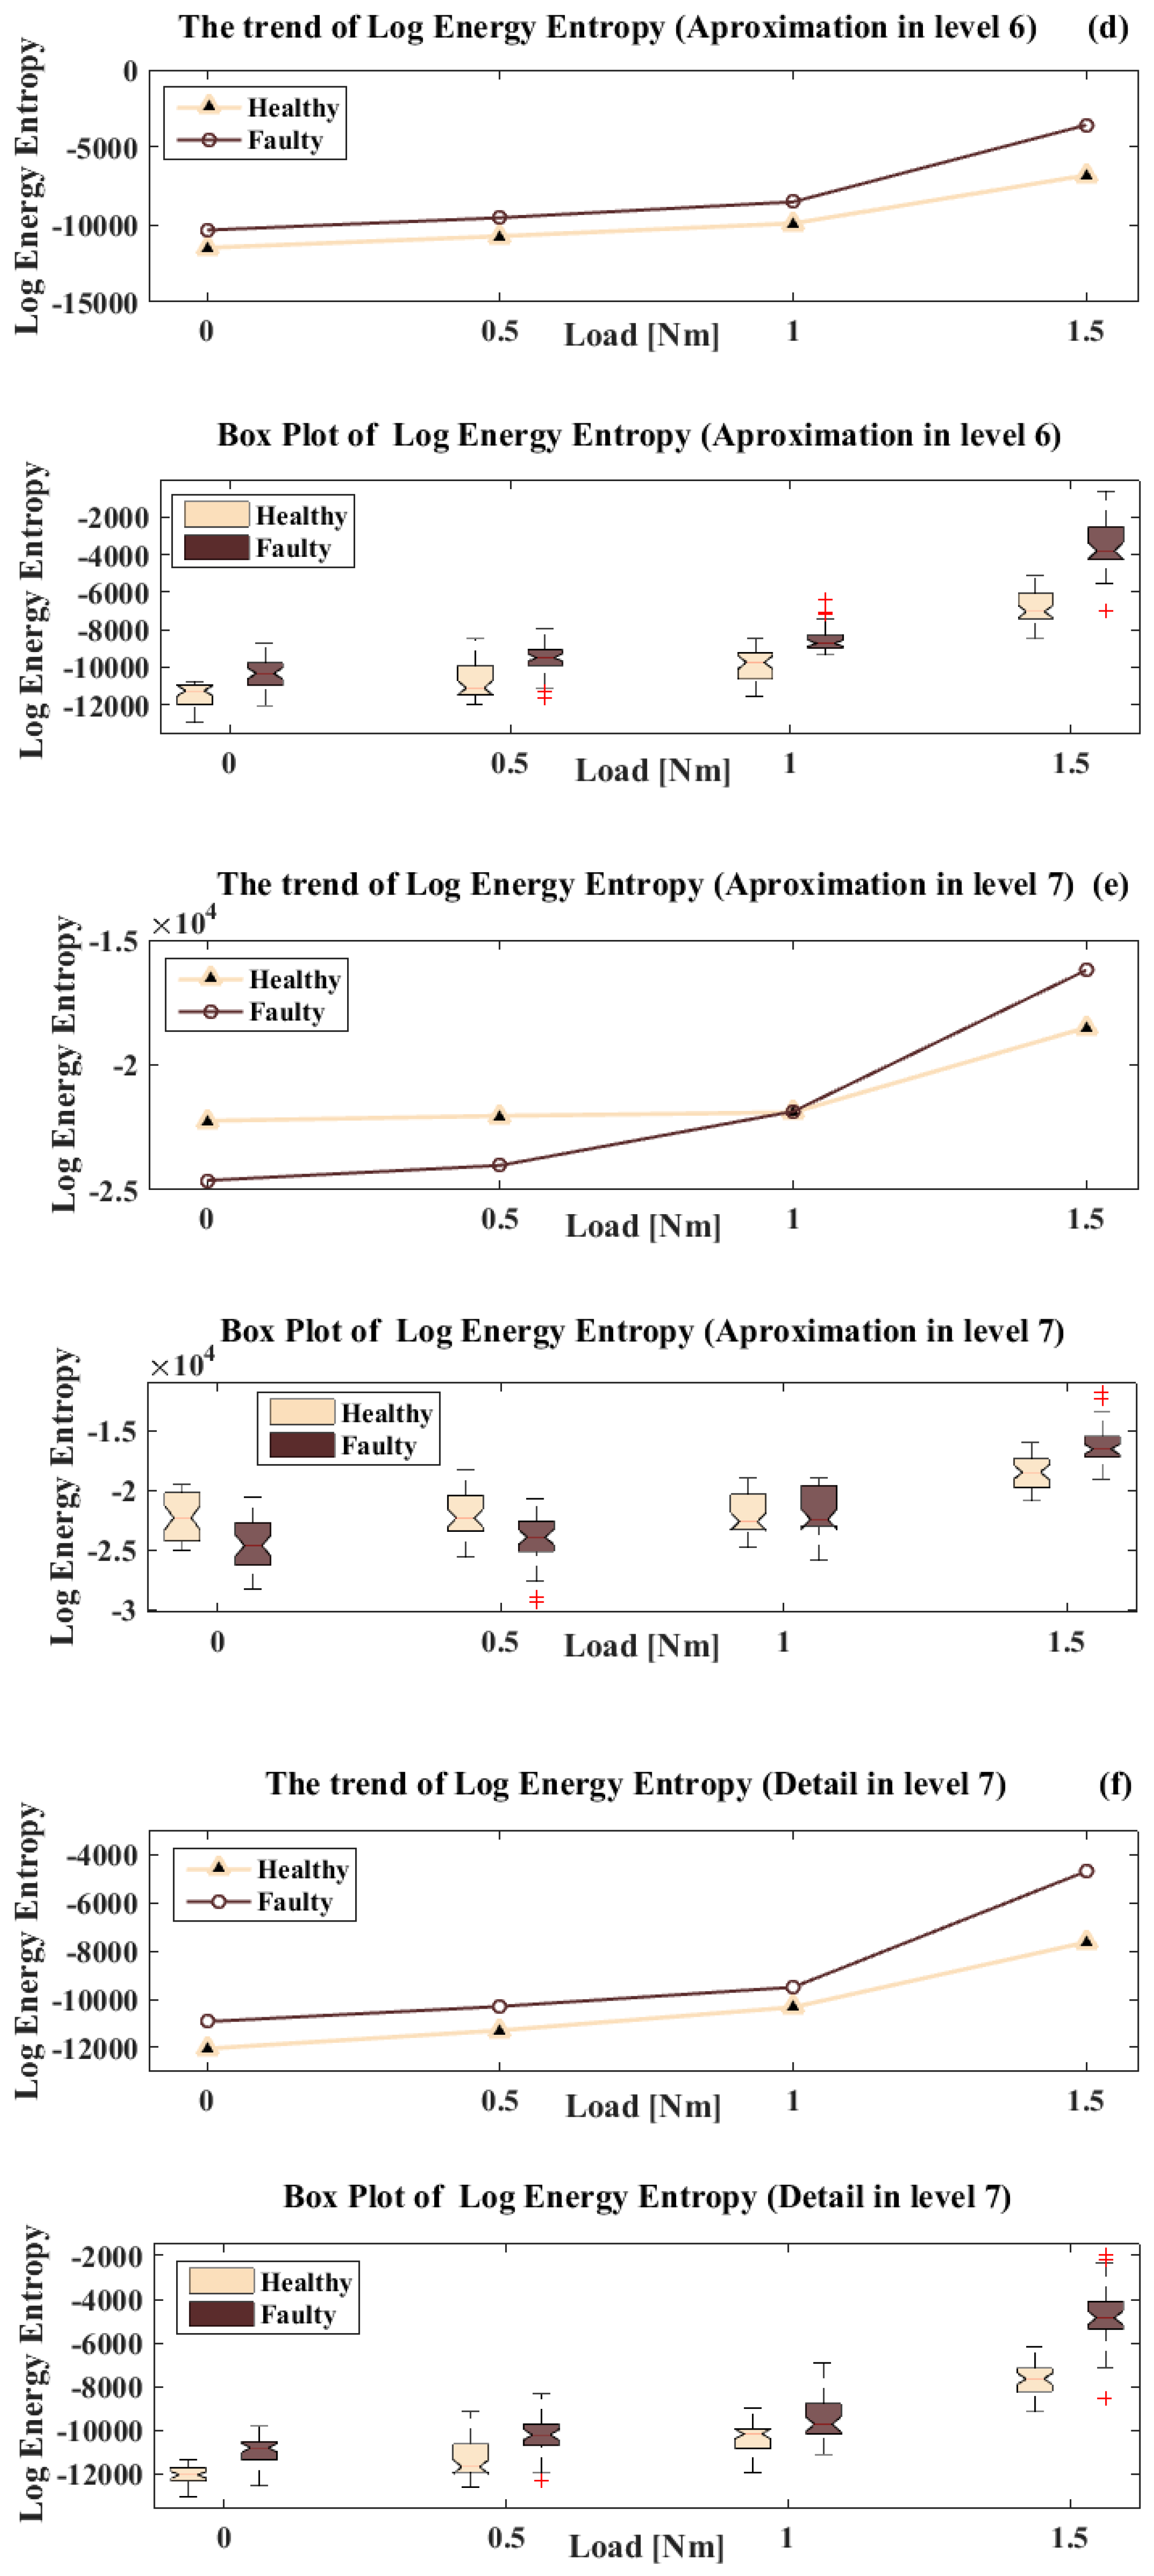
The qualitative pattern of LSH in the high decomposition level of the signals can be a good indicator for the fault detection, as shown in Figure 5. Hence, the reconstructed signal that comes from the detail and approximation of level seven, and also the approximation of level six, is used as an input signal for calculating the fault-related feature. The relevant frequency bands of D7 (Detail of level seven), A7 (approximation of level seven) and A6 (approximation of level six) are shown in Table 1. Accordingly, the features evaluated for monitoring BRB faults in LS-PMSM are based on these relevant frequency bands.
Entropy in information theory describes the amount of information provided by a signal or event. It relates the uncertainty of the signal or event associated with a given probability distribution. The concept of entropy has found broad applications in engineering, including, for instance, fault diagnoses [28,29,30,31]. A survey of recent methods for the fault diagnosis of rotating machinery using entropy techniques was discussed in [32]. According to these studies, tntropy has been used a feature for the diagnosis of a failure in electrical machines. The features used in this research are log-energy entropy and Shannon entropy. These two features are common concepts in many fields, mainly in signal processing, and are listed as bellow:
Entropy   Shannon   X E S h a n n o n = i X n 2 log X n 2
with the convention 0log(0) = 0.
Entropy   log - energy   X ELog   energy = i log ( X n 2 )
with the convention log(0) = 0. where, X n is the reconstructed signal from level n.
Once the features are determined, statistical techniques should be used in exploratory data investigation. The movement of features is surveyed to discover the overlapping of healthy and faulty conditions at different levels of load. A number of methods have been implemented for visualizing and checking normality in multi-level experiments to provide a good understanding of the overall characteristics of the data. Thus, by listing all data with a multiplier, a boxplot can be used to check the assumption of normality. Boxplots, in this research, are considered to analyse and compare various features of parameter. The parameters investigated are two types of motor conditions, healthy and faulty, and four different stages of starting load are considered for each condition. The estimation of the statistical significance of differences was verified with a two-way Analysis of variance (ANOVA) based on the motor condition, the starting load, and their interaction. Tukey’s honest significant differences technique was also utilized for multiple comparisons after ANOVA. There are three sets of hypotheses should be tested with the two-way ANOVA in this research. The null hypotheses for each of the sets are given below:
  • The population means of the first factor (motor condition) are equal;
  • The population means of the second factor (load) are equal;
  • There is no interaction between the two factors (motor condition and load).
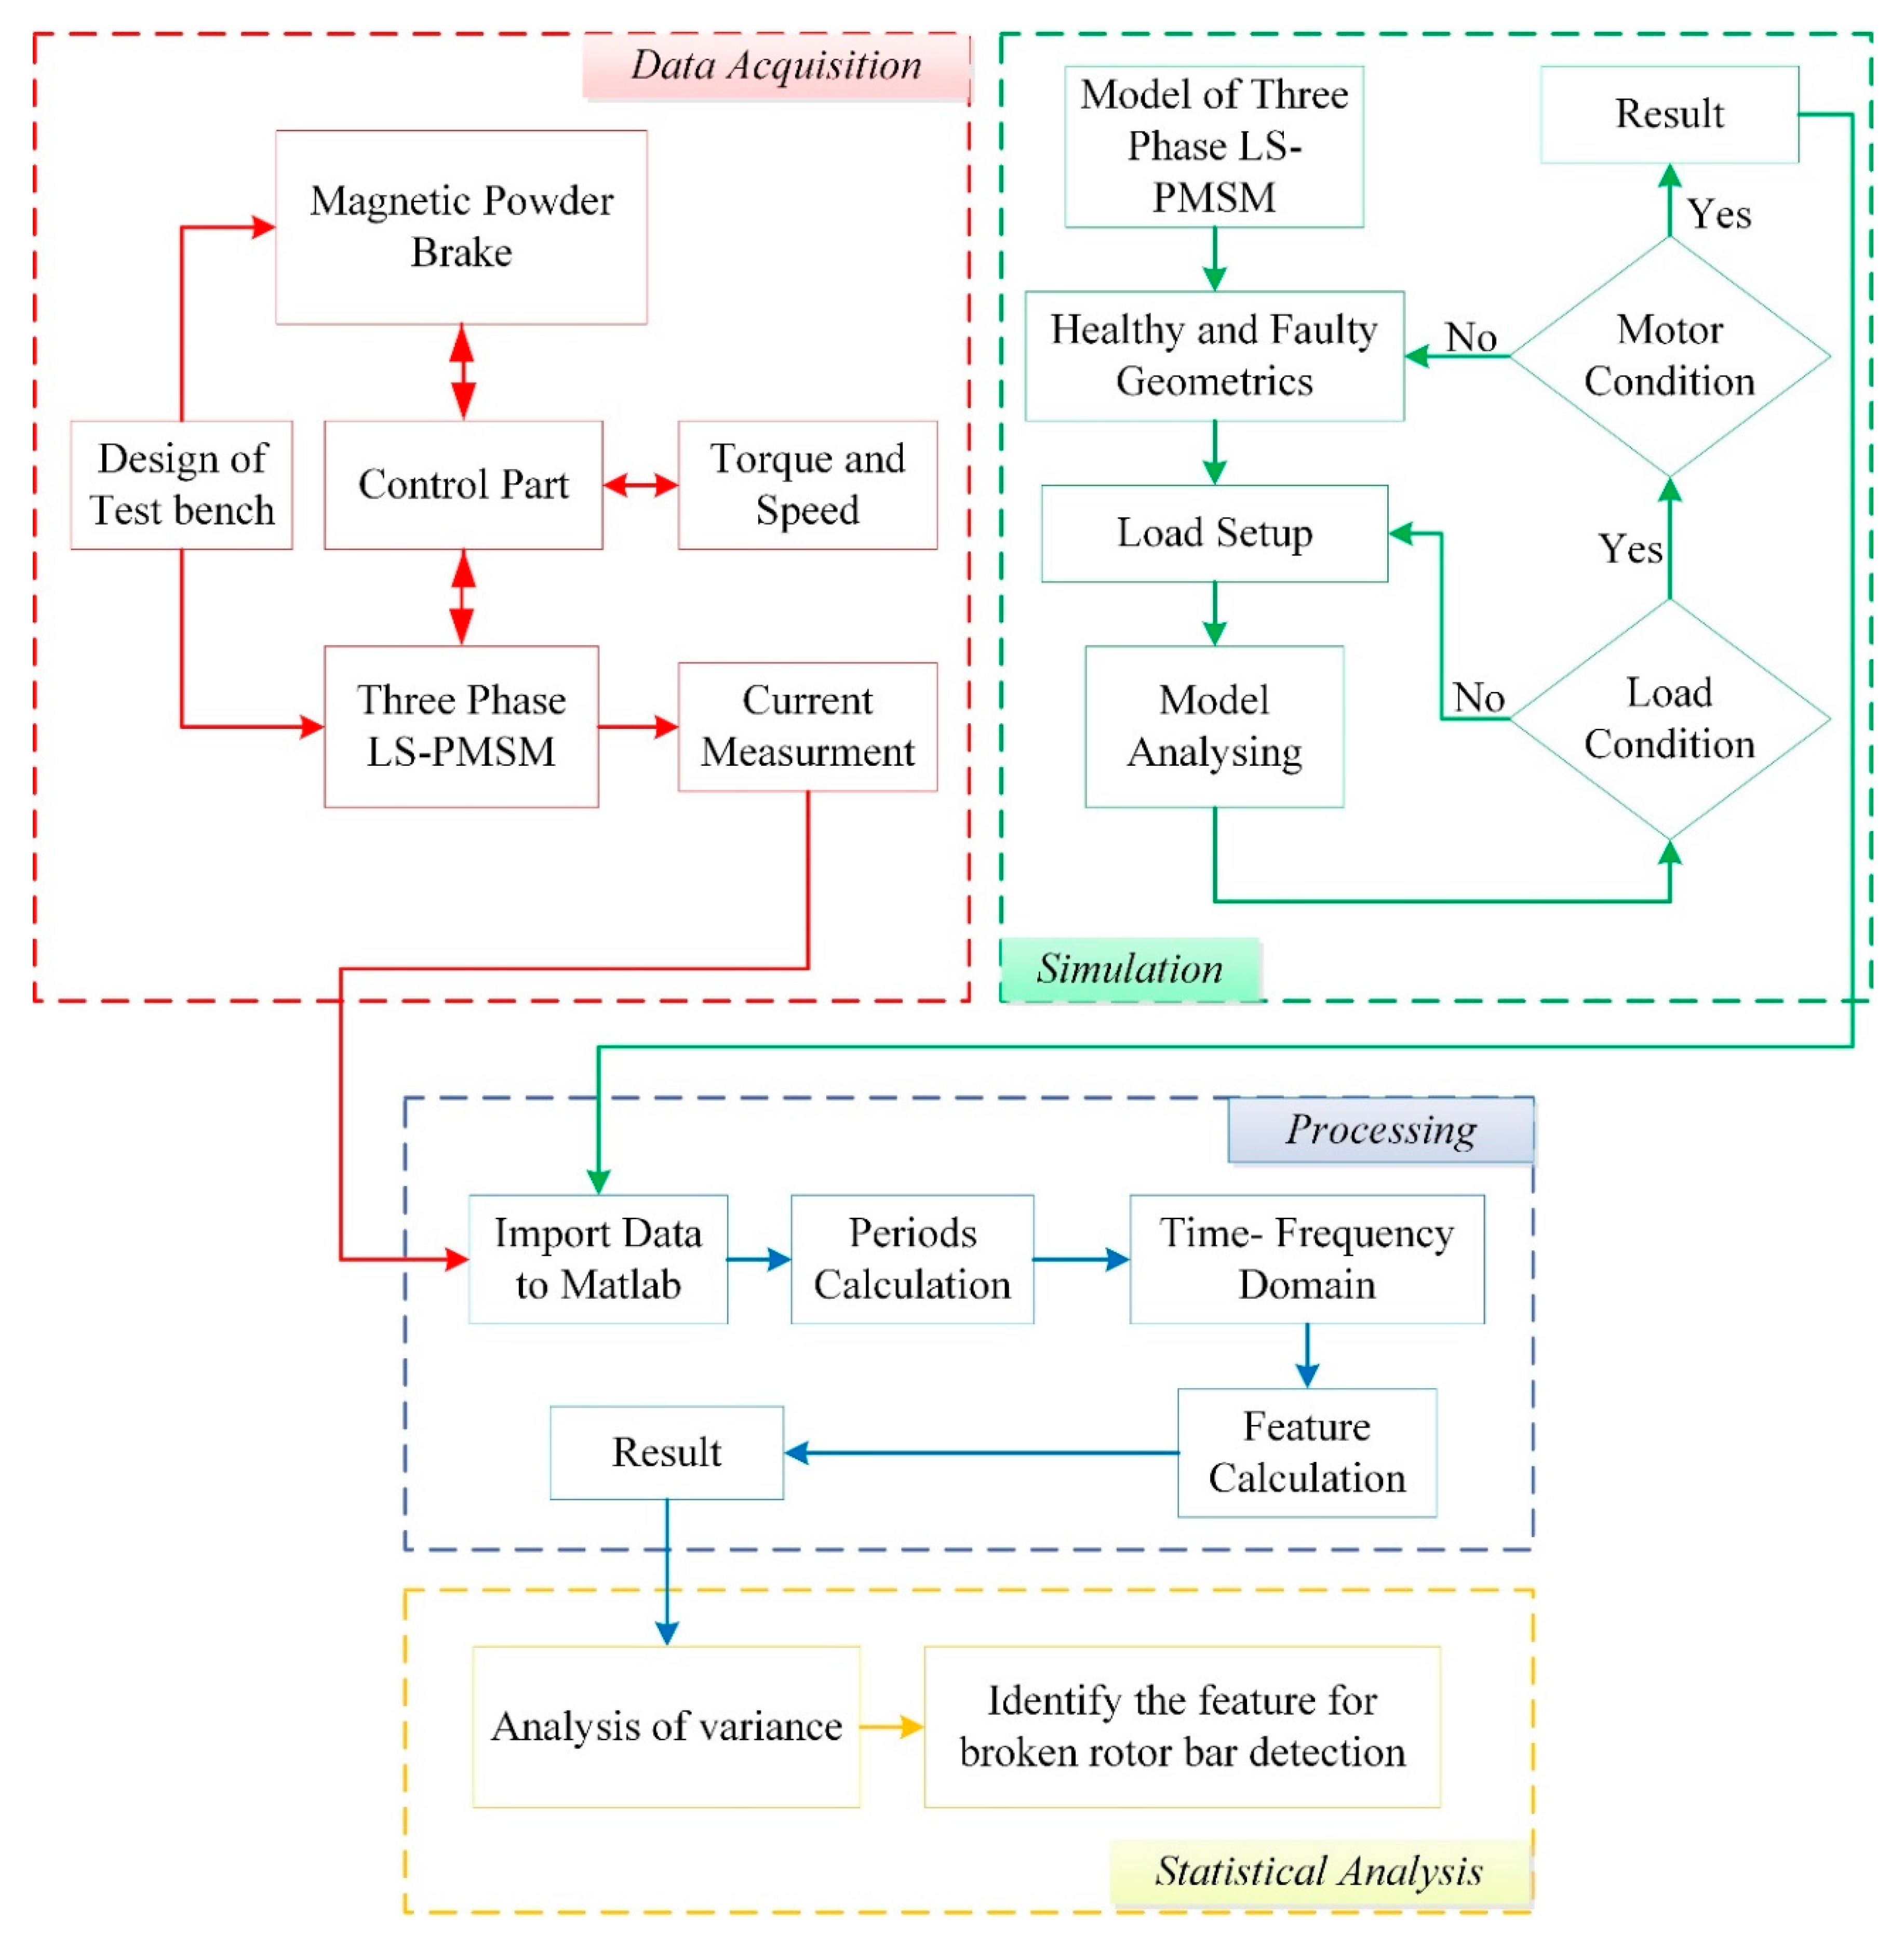
Accordingly, the most important point of current research is to identify the features related to BRB fault detection in LS-PMSM. A brief overview of the methodology employed for BRB detection in this research is depicted in Figure 6. In this paper, the performance of LS-PMSM under BRB during transient operation is scrutinized employing the finite element method (FEM).

3. Simulation and Experiment Process

3.1. Simulation

This study looks into the dynamics of LS-PMSM using a two-dimensional time-stepping FEM method. The major advantage of using a two-dimensional model is to reduce the computation time. In this research, Ansoft® Maxwell 2D (Pittsburgh, PA, USA) software version 15 is used to simulate the healthy and faulty condition of LS-PMSMs. The specification of the LS-PMSM has been summarized in Table 2. Figure 7 illustrates the Maxwell 2D model for a LS-PMSM with meshed region.

3.2. Experimental and Signal Capturing

An experimental study was conducted to validate the effectiveness of the proposed method using the self-designed test rig shown in Figure 8a. It includes the LS-PMSM, sensor and powder break. Magnetic powder brake offers a variable mechanical load by adjusting the voltage. Two one-hp, four-pole LS-PMSMs were considered to generate data under four levels of starting load (0, 0.5, 1 and 1.5 Nm). The first motor was considered as healthy and taken as a standard for evaluation with the faulty motor. The second motor was faulty, with one BRB, as illustrated in Figure 8b.
A schematic diagram of the experimental test setup including the data acquisition technique and computer interfacing is shown in Figure 9. The signal of the stator current was collected noninvasively while the system was on operation. Two categories of signal exist: transient and stationary. A transient signal is the signal obtained during motor start-up. It is selected as a feature source and analyzed in the time-frequency domain. The sampling frequency is a vital component in capturing of the transient signal and it is a significant point that should be taken into account.
According to Nyquist criterion, implementation of this method needs a very high sampling frequency, since the majority of the features exist in the low-frequency section [33]. The sampling frequency of 5 ks/s can provide a good resolution for the analysis of the transient signal here. In each case, 40 tests were performed; hence, 320 data sets in total were acquired for each analysis.

4. Result and Discussion

4.1. Performance of LS-PMSM with Presence of Fault

In this section, the effects of BRB on the performance of motor during start-up are investigated. In the first step, the simulation result was used to analyze the performance of a healthy motor and a motor with one broken bar under different levels of load. In the second step, the experimental result was used to confirm the effects of the fault on machine performance.
In the simulation study, FEM is applied to investigate the performance of LS-PMSM when any BRB exists. The waveform of the magnetic field contains comprehensive information about the stator and mechanical parts of the motor. Figure 10a shows the symmetrical distribution of magnetic flux in the healthy motor and Figure 10b presents the asymmetrical distribution of magnetic flux in a motor with one BRB under 1.5 Nm starting torque. Comparing Figure 10a,b shows that the distribution of the flux lines around the broken bars differs from healthy bars and the density increase of magnetic flux in the rotor core around the broken bar, stator core, and the air gap. The concentration of magnetic flux observed around the broken bar creates an asymmetric distribution of magnetic flux in this area. When a bar breaks, its current is distributed in the adjacent bars, meaning that more current flows in them. The excess current causes saturation and generates more heat in adjacent bars, which results in an asymmetrical distribution of magnetic flux. The generated heat makes the situation of the adjacent bars worse and then causes a problem for the permanent magnet. The residual flux density and coercivity of permanent magnets reduce due to the proximity of the cages to the magnets as a function of temperature.
According to Faraday’s law, an electromagnetic field will be induced in the cage because of the magnetic field fluctuating. The electromagnetic field will then generate a current through the cage and the situation becomes as a current carrying loop situated in a magnetic field. According to the Lorentz law, a magnetic force is produced in the cage and causes the cage starts to rotate. Magnetic force in a healthy rotor is symmetrically distributed around the rotor. A magnetic asymmetry due to the BRB introduces an unbalanced magnetic force. For both the healthy motor and motor with BRB, the magnetic force distributions on the rotor bar at start-up (0 Nm) are computed by the FEM method. The results shown in the Figure 11 reveal that the amplitude of the magnetic force for the faulty motor is higher than for healthy motor. This spontaneous distribution of the force unavoidably leads to undue mechanical stress in the bars, and it would become more vulnerable to additional wearing and an eventual break.
The squirrel-cage bars provide the accelerating torque which operates the rotor to a near-synchronous speed. In addition to overcoming the applied load, the accelerating torque must also overcome the generated magnet braking torques, which is present as a result of the permanent magnet. When BRB occurs, the torque characteristics of the motor also change. Figure 12 illustrates the comparison of faulty and fault-free motors under a maximum starting torque. As is clear, the motor with one BRB cannot run at starting torque value of “2.3 Nm”, which the motor is designed for, and the starting torque value decreases to near 1.75 Nm. Accordingly, the value of the starting torque is decreased whenever there is a BRB in LS-PMSM, while this phenomenon has not been reported for induction machines. As the presence of BRB changes the torque characteristic of the LS-PMSM, early detection of this fault is very important.
Another issue found during the simulation analysis is an increase of time duration for the transient section when any bar is broken. Figure 13 illustrates the starting time for both the healthy and faulty motor under different levels of load. As is clear in the figure, the starting time trend increased based on increment in the load. A recent study performed on a squirrel-cage induction motor revealed that the startup load is not important in BRB fault detection based on the transient analysis; however, they mentioned that this approach is especially suitable for applications with heavy startup transients [34]. Other researchers also did not consider the effects of starting load for fault detection in induction machines based on the analysis of current in transient state [35,36]. However, this research indicates that the starting load effects in the transient time should be carefully taken into account for BRB fault detection in LS-PMSM.
For LS-PMSM that starts with a squirrel cage, the application of the transient current is even more justified, due to the carrying of significant currents in the squirrel cage during the start-up. This is why the steady-state signal is impractical for BRB fault detection in this motor. The presence of BRB in LS-PMSM can produce changes in the air gap flux and the current distribution between the bars during acceleration from zero to rated speed. This part indicated that the BRBs slightly modified the performance of the motor during startup and is critical in fault detection during transient time.
The effect of BRB in starting torque is also surveyed experimentally. It was found that the motor with one BRB cannot run at a starting torque value of “2.3 Nm”, which the motor is designed for, and the starting torque value decreases to near 1.70 Nm. The rate of torque variations for the faulty motor is higher than for the healthy one, so a higher noise accompanied with lower performance are expected from the faulty motor. The time duration for the transient section is also determined through experimental work. The stator current signal for the different load situations is illustrated in Figure 14 for healthy and faulty motors. It is obvious in this figure that instances of broken bars lengthen the starting transient time of the motor. Figure 15 provides a comparison between the starting time for both healthy and faulty motors in different levels of load. The results presented in Figure 15 are based on a mean of 40 samples for each condition.

4.2. Fault Related Feature Evaluation

The proposed technique for the detection of BRB in LS-PMSM includes two steps: first, the characteristic pattern of LSH, which is shown in Figure 4, is calculated, and second, the entropy features are computed. In the first stage, knowing the value of the motor slip is compulsory for LSH calculation. Therefore, the speed of the tested motor was measured and the slip was calculated. Figure 16 presents the behavior of LSH determined using Equation (2), where s and f are slip and fundamental frequency, respectively. These values are obtained from measuring the motor speed for both faulty and fault-free motors when there is no starting load and when there is a starting load equal to 1.5 Nm. As is clear in this figure, the frequency of the LSH will change between the fundamental frequency (s = 1), zero frequency (s = 1/2) and again near the fundamental frequency (s ≈ 0) when the motor reaches a steady state. From this figure, it should be noted that there is a shift between the faulty and fault-free motor under the same level of load that is also created by the effect of BRB.
The second stage is the quantitative approach, which begins with applying the wavelet transforms to the startup current signal. By applying wavelet transform to the signal, sets of wavelet signals are obtained based on the approximation and detail coefficient. The method is to track the evolution of the LSH. As the LSH changes in the range of 50~0~80 Hz, its evolution is reflected by the wavelet signals and covers the frequencies lower than the fundamental frequency and, hence, cancels their effects. The alternative variant proposed for detecting this evolution is to perform the signal decomposition in a number of levels that result in two approximations and one detail signal and covers the aforementioned frequency range. The number of levels that lead to such a result with their type of coefficients is marked in Figure 15. The next step, in this stage, involves entropy computation to quantify failure in LS-PMSM. Two different features introduced in the previous section are then applied in these three frequency bands (A6, A7 and D7). After all data have been analysed, the result is investigated with trend and boxplot graphs.
Figure 17 illustrates the trend and boxplot graphs for entropy features used as a fault feature in this study. A number of interesting conclusions can be drawn from the analysis of these figures. The most significant is that the trends are dissimilar for all the conditions, and thus each individual case must be studied and analyzed independently. The trend graph for Shannon entropy shows an overlap between the healthy and faulty states at different levels of starting load for approximation and detail of decomposition level seven (Figure 17b,c). The trend graph for Shannon entropy in the approximation of level six indicates that there is no overlapping between the healthy and faulty states at various levels of starting load. However, by looking at the boxplot graph, there is an overlap for each condition in the same load (Figure 17a).The trend graph for log-energy entropy shows an overlapping between the healthy situation and faulty state at various levels of starting load for an approximation of level seven (Figure 17e). The trend graphs for log-energy entropy in the approximation of level six and detail of level seven indicate that there is no overlapping between the healthy and faulty states at various levels of starting load (Figure 17d,f).
The evaluation of the statistical significance of differences (p-value ≤ 0.05) was verified with a two-way ANOVA based on the motor condition, starting load condition, and their interaction. Tukey’s honest significant differences method was also applied for multiple comparisons after ANOVA. Table 3 presents the results of the ANOVA models for the Shannon entropy feature in three different sub-band frequencies based on the condition as mention above. As can be seen in this table, the p-value for the features that were extracted from (A6) is more than 0.05 for the interaction condition states and also for (D7) in both the motor condition and their interaction, which can be checked with a post-hoc test. The performed ANOVA for Shannon entropy at (A7) reveals it can significantly distinguish different conditions. Table 4 presents the results of the ANOVA models for the log-energy entropy feature in three different sub-band frequencies based on similar conditions, as mentioned earlier. The performed ANOVA for log-energy entropy features at different sub-band frequencies reveals its capability to differentiate various states tested, as the p-value for all decomposition levels is significant.
To carry out a statistical evaluation between the means for the features in various situations, Tukey’s honest significant differences technique was used as a post-hoc test. Table 5 shows the outcomes of the post-hoc test for two different features in three different sub-band frequencies. The mean values were compared using Tukey’s honest significant differences test at p ≤ 0.05. As is clear in Table 5, only the log-energy entropy feature is significant in (A6 and D7), and this feature is not significant in a load of 1Nm for sub-band frequencies belonging to the (A7). The Shannon entropy feature is also not significant in (A6 and D7) and also in (A7) at the loads (0 and 1 Nm).
Table 6 presents the conclusion of the feature validation of the simulation and the experimental results for two different features, using Coiflet mother wavelets. As is clear in this table, Shannon entropy is not capable to detect the BRB in all frequency band ranges used. The log-energy entropy is very significant in detecting BRB in the two frequency band ranges of 39.06–19.53 Hz, which belongs to the decomposition of the original signal in the detail of level seven, and 39.06–0 Hz, which belongs to decomposition of the original signal in the approximation of level six. However, log-energy entropy is not significant for BRB detection in the frequency band range of 19.53–0 Hz, which belongs to the decomposition of the original signal in the approximation of level seven. The results of the simulation are also in accordance with the experimental results. Correspondingly, the most effective sub-band frequency is the detail of level seven which includes the frequency band ranges of 39.06–19.53 Hz, because this sub-band frequency is located in both (A6 and D7).

5. Conclusions

The technique proposed here is well-suited for BRB detection in synchronous motors that start with a squirrel cage. The reason is that these electrical machines carry significant currents during the transient state, and it is difficult to diagnose the failure based on the monitoring of the conventional steady-state current. According to the non-stationary characteristics of BRB faulty signals, a fault-diagnosis method based on DWT is put forward in this paper. The main advantage of the proposed DWT approach is that the feature of a specific fault mode is not at the same frequency band as the fundamental, and hence is not affected by the main frequency, as shown in Figure 3. In this research, the importance of starting load on broken bar detection in LS-PMSMs is also considered, and the results show that the log-energy entropy feature is highly sensitive to the degree of load complexity. Accordingly, the other advantage of this method is that fault detection and diagnosis can be performed under different load conditions. Since the study of faults in LS-PMSM has just started, it is of interest to propose further overall works according to the results achieved. Our future research will be on the following topics: (1) to extend the detection method for the diagnosis of broken rotor bars in LS-PMSM that use drive systems, and (2) the application of intelligent techniques to increase the ability and accuracy of fault detection in the decision-making area.

Acknowledgments

The authors would like to express their gratitude to Ministry of High Education Malaysia for financial support through grant number FRGS-5524356 and Universiti Putra Malaysia for the facilities provided during this research work.

Author Contributions

Mohammad Rezazadeh Mehrjou designed and performed the experiments; analyzed the data and prepare the manuscript, Norman Mariun is leader of the project and immensely in the preparation of the manuscript, Norhisam Misron and Mohd Amran Mohd Radzi and Suleiman Musa revised and finalized the manuscript.

Conflicts of Interest

The authors declare no conflict of interest.

References

  1. Toliyat, H.A.; Kliman, G.B. Handbook of Electric Motors; CRC Press: Boca Raton, FL, USA, 2004. [Google Scholar]
  2. WEG. WQuattro-Super Premium Efficiency Motor; WEG Industries: Jaraguá do Sul, Santa Catarina, Brazil, 2015. [Google Scholar]
  3. Pyrhonen, J.; Jokinen, T.; Hrabovcova, V. Design of Rotating Electrical Machines; Wiley: Hoboken, NJ, USA, 2009. [Google Scholar]
  4. Mehrjou, M.R.; Mariun, N.; Marhaban, M.H.; Misron, N. Rotor fault condition monitoring techniques for squirrel-cage induction machine—A review. Mech. Syst. Signal Process. 2011, 25, 2827–2848. [Google Scholar] [CrossRef]
  5. Liu, Y.; Bazzi, A.M. A review and comparison of fault detection and diagnosis methods for squirrel—Cage induction motors: State of the art. ISA Trans. 2017. [Google Scholar] [CrossRef] [PubMed]
  6. Akçay, H.; Germen, E. Subspace-based identification of acoustic noise spectra in induction motors. IEEE Trans. Energy Convers. 2015, 30, 32–40. [Google Scholar] [CrossRef]
  7. Gyftakis, K.N.; Spyropoulos, D.V.; Kappatou, J.C.; Mitronikas, E.D. A novel approach for broken bar fault diagnosis in induction motors through torque monitoring. IEEE Trans. Energy Convers. 2013, 28, 267–277. [Google Scholar] [CrossRef]
  8. Georgoulas, G.; Climente-Alarcon, V.; Antonino-Daviu, J.A.; Tsoumas, I.P.; Stylios, C.D.; Arkkio, A.; Nikolakopoulos, G. The Use of a Multilabel Classification Framework for the Detection of Broken Bars and Mixed Eccentricity Faults Based on the Start-Up Transient. IEEE Trans. Ind. Inform. 2017, 13, 625–634. [Google Scholar] [CrossRef]
  9. Mirzaeva, G.; Saad, K.I.; Jahromi, M.G. Comprehensive Diagnostics of Induction Motor Faults Based on Measurement of Space and Time Dependencies of Air Gap Flux. IEEE Trans. Ind. Appl. 2017, 53, 2657–2666. [Google Scholar] [CrossRef]
  10. Gu, F.; Yesilyurt, I.; Li, Y.; Harris, G.; Ball, A. An Investigation of the Effects of Measurement Noise in the Use of Instantaneous Angular Speed for Machine Diagnosis. Mech. Syst. Signal Process. 2006, 20, 1444–1460. [Google Scholar] [CrossRef]
  11. Drif, M.H.; Kim, H.; Kim, J.; Lee, S.B.; Cardoso, A.J.M. Active and Reactive Power Spectra-Based Detection and Separation of Rotor Faults and Low-Frequency Load Torque Oscillations. IEEE Trans. Ind. Appl. 2017, 53, 2702–2710. [Google Scholar] [CrossRef]
  12. Penrose, H.W. Estimating motor life using motor circuit analysis predictive measurements: Part 2. In Proceedings of the IEEE International Symposium on Electrical Insulation, Indianapolis, IN, USA, 19–22 September 2004; pp. 15–17. [Google Scholar]
  13. Picazo-Ródenas, M.J.; Antonino-Daviu, J.; Climente-Alarcon, V.; Royo-Pastor, R.; Mota-Villar, A. Combination of Noninvasive Approaches for General Assessment of Induction Motors. IEEE Trans. Ind. Appl. 2015, 51, 2172–2180. [Google Scholar] [CrossRef]
  14. Martinez, J.; Belahcen, A.; Muetze, A. Analysis of the Vibration Magnitude of an Induction Motor with Different Numbers of Broken Bars. IEEE Trans. Ind. Appl. 2017, 53, 2711–2720. [Google Scholar] [CrossRef]
  15. Hou, Z.; Huang, J.; Liu, H.; Ye, M.; Liu, Z.; Yang, J. Diagnosis of Broken Rotor Bar Fault in Open-and Closed-Loop Controlled wye-Connected Induction Motors Using Zero-Sequence Voltage. IET Electr. Power Appl. 2017, 11, 1214–1223. [Google Scholar] [CrossRef]
  16. Mirafzal, B. Incipient Fault Diagnosis in Squirrel-Cage Induction Motors. Ph.D. Thesis, Marquette University, Milwaukee, WI, USA, 2005. [Google Scholar]
  17. Bangura, J.F.; Demerdash, N.A. Diagnosis and Characterization of Effects of Broken Bars and Connectors in Squirrel-Cage Induction Motors by a Time-Stepping Coupled Finite Element-State Space Modeling Approach. IEEE Trans. Energy Convers. 1999, 14, 1167–1176. [Google Scholar] [CrossRef]
  18. Antonino-Daviu, J.A.; Climente-Alarcón, V.; Pons-Llinares, J.; Puche, R.; Pineda-Sánchez, M. Transient-Based Analysis for The Detection of Broken Damper Bars in Synchronous Motors. Mech. Syst. Signal Process. 2013, 34, 367–377. [Google Scholar] [CrossRef]
  19. Pineda-Sanchez, M.; Riera-Guasp, M.; Antonino-Daviu, J.A.; Roger-Folch, J.; Perez-Cruz, J.; Puche-Panadero, R. Instantaneous Frequency of the Left Sideband Harmonic During the Start-Up Transient: A New Method for Diagnosis of Broken Bars. IEEE Trans. Ind. Electron. 2009, 56, 4557–4570. [Google Scholar] [CrossRef]
  20. Yan, R.; Gao, R.X.; Chen, X. Wavelets for fault diagnosis of rotary machines: A review with applications. Signal Process. 2014, 96, 1–15. [Google Scholar] [CrossRef]
  21. Glowacz, A. DC Motor Fault Analysis with the Use of Acoustic Signals, Coiflet Wavelet Transform, and K-Nearest Neighbor Classifier. Arch. Acoust. 2015, 40, 321–327. [Google Scholar] [CrossRef]
  22. Mallat, S.G. A theory for multiresolution signal decomposition: The wavelet representation. IEEE Trans. Pattern Anal. Mach. Intell. 1989, 11, 674–693. [Google Scholar] [CrossRef]
  23. Dash, R.N.; Subudhi, B.; Das, S. Induction motor stator inter- turn fault detection using wavelet transform technique. In Proceedings of the International Conference on Industrial and Information Systems, Mangalore, India, 29 July–1 August 2010; pp. 436–441. [Google Scholar]
  24. Pilloni, A.; Pisano, A.; Riera-Guasp, M.; Puche-Panadero, R.; Pineda-Sanchez, M. Fault detection in induction motors. In AC Electric Motors Control: Advanced Design Techniques and Applications, 1st ed.; Giri, F., Ed.; John Wiley & Sons Ltd.: Oxford, UK, 2013; pp. 275–309. [Google Scholar] [CrossRef]
  25. Polikar, R. Multi Resolution Analysis: The Discrete Wavelet Transform. In The Wavelet Tutorial Part IV; Rowan University, College of Engineering Web Servers 10: Glassboro, NJ, USA, 1998. [Google Scholar]
  26. Bae, H.; Kim, Y.T.; Lee, S.H.; Kim, S.; Lee, M.H. Fault Diagnostic of Induction Motors for Equipment Reliability and Health Maintenance Based Upon Fourier and Wavelet Analysis. Artif. Life Robot. 2005, 9, 112–116. [Google Scholar] [CrossRef]
  27. Sadeghian, A.; Zhongming, Y.; Wu, B. Online Detection of Broken Rotor Bars in Induction Motors by Wavelet Packet Decomposition and Artificial Neural Networks. IEEE Trans. Instrum. Meas. 2009, 58, 2253–2263. [Google Scholar] [CrossRef]
  28. Romero-Troncoso, R.J.; Saucedo-Gallaga, R.; Cabal-Yepez, E.; Garcia-Perez, A.; Osornio-Rios, R.A.; Alvarez-Salas, R.; Huber, N. FPGA-based online detection of multiple combined faults in induction motors through information entropy and fuzzy inference. IEEE Trans. Ind. Electron. 2011, 58, 5263–5270. [Google Scholar] [CrossRef]
  29. Hernandez-Vargas, M.; Cabal-Yepez, E.; Garcia-Perez, A.; Romero-Troncoso, R.J. Novel methodology for broken-rotor-bar and bearing faults detection through SVD and information entropy. J. Sci. Ind. Res. 2012, 71, 589–593. [Google Scholar]
  30. Cabal-Yepez, E.; Valtierra-Rodriguez, M.; Romero-Troncoso, R.J.; Garcia-Perez, A.; Osornio-Rios, R.A.; Miranda-Vidales, H.; Alvarez-Salas, R. FPGA-based entropy neural processor for online detection of multiple combined faults on induction motors. Mech. Syst. Signal Process. 2011, 30, 123–130. [Google Scholar] [CrossRef]
  31. Pan, S.; Han, T.; Tan, A.C.; Lin, T.R. Fault diagnosis system of induction motors based on multiscale entropy and support vector machine with mutual information algorithm. Shock Vib. 2016. [Google Scholar] [CrossRef]
  32. Huo, Z.; Zhang, Y.; Shu, L. A Short Survey on Fault Diagnosis of Rotating Machinery Using Entropy Techniques. In Proceedings of the 3rd EAI International Conference on Industrial Networks and Intelligent Systems, Ho Chi Minh City, Vietnam, 4 September 2017. [Google Scholar]
  33. Antonino-Daviu, J.A.; Riera-Guasp, M.; Roger-Folch, J.; Martínez-Giménez, F.; Peris, A. Application and Optimization of the Discrete Wavelet Transform for the Detection of Broken Rotor Bars in Induction Machines. Appl. Comput. Harmon. Anal. 2006, 22, 268–279. [Google Scholar] [CrossRef]
  34. Riera-Guasp, M.; Antonino-Daviu, J.A.; Rusek, J.; Roger-Folch, J. Diagnosis of Rotor Asymmetries in Induction Motors Based on the Transient Extraction of Fault Components Using Filtering Techniques. Electr. Power Syst. Res. 2009, 79, 1181–1191. [Google Scholar] [CrossRef]
  35. Tran, V.T.; AlThobiani, F.; Ball, A.; Choi, B.K. An Application to Transient Current Signal Based Induction Motor Fault diagnosis of Fourier–Bessel expansion and Simplified Fuzzy ARTMAP. Expert Syst. Appl. 2013, 40, 5372–5384. [Google Scholar] [CrossRef]
  36. Cabal-Yepez, E.; Romero-Troncoso, R.J.; Garcia-Perez, A.; Osornio-Rios, R.A. Single-Parameter Fault Identification through Information Entropy Analysis at the Startup-Transient Current in Induction Motors. Electr. Power Syst. Res. 2012, 89, 64–69. [Google Scholar] [CrossRef]
Figure 1. The structure of three phase line start permanent magnet synchronous motors LS-PMSM (four pole).
Applsci 07 00845 g001
Figure 2. Effect of a broken bar on the magneto-motive force (MMF) of a rotor [16].
Applsci 07 00845 g002
Figure 3. Behavior f L S H during the start-up for LS-PMSM.
Applsci 07 00845 g003
Figure 4. Dyadic wavelet decomposition algorithm.
Applsci 07 00845 g004
Figure 5. Theoretical behavior of   f L S H as a function of slip.
Applsci 07 00845 g005
Figure 6. Methodology employed in the research design.
Applsci 07 00845 g006
Figure 7. Cross-section of LS-PMSM with mesh plotting.
Applsci 07 00845 g007
Figure 8. (a) The experimental test rig and (b) the rotor with one broken rotor bar (BRB).
Applsci 07 00845 g008
Figure 9. Schematic diagram of the experimental test setup.
Applsci 07 00845 g009
Figure 10. The magnetic flux line in the (a) healthy motor and (b) faulty motor (one BRB).
Applsci 07 00845 g010
Figure 11. Magnetic force in starting torque in the healthy and faulty motor.
Applsci 07 00845 g011
Figure 12. Comparison of the maximum starting torque [2.3 Nm] for (a) healthy and (b) faulty motor.
Applsci 07 00845 g012
Figure 13. Comparison of the result of starting time under different loads.
Applsci 07 00845 g013
Figure 14. Experimental current signal in four load conditions for healthy and faulty motors. (a) No load; (b) 0.5 Nm; (c) 1 Nm; (d) 1.5 Nm.
Applsci 07 00845 g014
Figure 15. Comparison of the experimental result of starting time under different loads, based on the mean value of 40 samples for each load.
Applsci 07 00845 g015
Figure 16. The behavior of LSH from experimental data.
Applsci 07 00845 g016
Figure 17. Trend and boxplot for entropy features under different levels of starting load. (a) Shannon entropy (A6); (b) Shannon entropy (A7); (c) Shannon entropy (D7); (d) log-energy entropy (A6); (e) log-energy entropy (A7); (f) log-energy entropy (D7).
Applsci 07 00845 g017aApplsci 07 00845 g017b
Table 1. Frequency ranges for the wavelet decomposition of the signal.
Decomposition LevelFrequency Ranges (Hz)
Detail (D)Approximation (A)
level 12500–12501250–0
level 21250–625625–0
level 3625–312.5312.5–0
level 4312.5–156.2156.2–0
level 5156.25–78.1278.12–0
level 678.12–39.0639.06–0
level 739.06–19.5319.53–0
Table 2. Motor specifications.
ParametersValueParametersValue
Rated Power (HP)1Starting Torque (Nm)2.3
Rated Voltage (V)415Number of Poles4
Rated Frequency (Hz)50ConnectionY
Rated Torque (Nm)4.8Number of Stator Slots24
Rated Speed (rpm)1500Number of Rotor Slots16
Rated Current (A)1.3Permanent MagnetN38H
Table 3. Analysis of variance for Shannon entropy features.
Shannon EntropySourceSum of SquaresdfMean SquareFp-Value
A6Motor Condition2.86 × 10812.86 × 10815.6359.51 × 10−5
Load5.35 × 10931.78 × 10997.5721.45 × 10−44
Interaction1.66 × 10735.53 × 1060.3020.824 *
Error5.70 × 1093121.83 × 107
Total1.14 × 1010319
A7Motor Condition8.96 × 10718.96 × 10725.8516.37 × 10−7
Load1.87 × 10836.22 × 10717.9419.11 × 10−11
Interaction3.96 × 10731.32 × 1073.8081.05 × 10−2
Error1.08 × 1093123.47 × 106
Total1.40 × 109319
D7Motor Condition2.34 × 10712.34 × 1071.2840.258 *
Load3.07 × 10931.02 × 10956.2334.4 × 10−29
Interaction1.02 × 10833.41 × 1071.8740.134 *
Error5.68 × 1093121.82 × 107
Total8.87 × 109319
* The p-value is greater than 0.05 and is not significant.
Table 4. Analysis of variance for log-energy entropy features.
Log-energy Entropy SourceSum of SquaresdfMean SquareFp-Value
A6Motor Condition2.43 × 10812.43 × 108304.9074.17 × 10−48
Load1.56 × 10935.21 × 108654.4013.24 × 10−134
Interaction6.10 × 10732.03 × 10725.5358.47 × 10−15
Error2.48 × 1083127.96 × 105
Total2.12 × 109319
A7Motor Condition2.06 × 10712.06 × 1075.8541.61 × 10−2
Load1.87 × 10936.22 × 108176.6566.20 × 10−67
Interaction2.77 × 10839.24 × 10726.2463.65 × 10−15
Error1.10 × 1093123.52 × 106
Total3.26 × 109319
D7Motor Condition1.72 × 10811.72 × 108228.2174.44 × 10−39
Load1.34 × 10934.48 × 108594.1071.3 × 10−128
Interaction5.81 × 10731.94 × 10725.7096.88 × 10−15
Error2.35 × 1083127.54 × 105
Total1.81 × 109319
Table 5. p-Value calculation from the post-hoc test procedure for features in different sub-band frequencies.
Load (Nm)Shannon Entropy Log-Energy Entropy
A6A7D7A6A7D7
00.448 *1.00 *0.58 *3.5 × 10−74.2 × 10−73.0 × 10⁻⁷
0.50.153 *0.40 *0.84 *1.2 × 10−76.4 × 10−59.4 × 10⁻⁶
10.911 *2.2 × 10−30.939 *6.0 × 10−81.00 *5.5 × 10−4
1.50.494 *8.3 × 10−41.00 *6.0 × 1−81.3 × 10−66.0 × 10−8
* The p-value is greater than 0.05 and is not significant.
Table 6. Conclusion for feature validation in the simulation and experiment.
Coefficientat Decomposition LevelFrequency Ranges (Hz)Simulation Experimental
Shannon Entropy Log-Energy EntropyShannon EntropyLog-Energy Entropy
Approximation (6)[39.06–0]NaANaA
Detail (7)[39.06–19.53]NaANaA
Approximation (7)[19.53–0]NaNaNaNa
A: Applicable; Na: Not applicable.

