Fatigue Performance and Model of Polyacrylonitrile Fiber Reinforced Asphalt Mixture

School of Transportation Engineering, Changsha University of Science and Technology, Changsha 410004, Hunan, China
*
Author to whom correspondence should be addressed.
Appl. Sci. 2018, 8(10), 1818; https://0-doi-org.brum.beds.ac.uk/10.3390/app8101818
Submission received: 1 September 2018
/
Revised: 28 September 2018
/
Accepted: 29 September 2018
/
Published: 3 October 2018
(This article belongs to the Special Issue Achievements and Prospects of Functional Pavement: Materials and Structures)
Abstract
:Fatigue is considered a major pavement structural distress and an important part of a performance-based mix design. Currently, the fatigue model of asphalt mixture, especially the mixture incorporated with fibers, is not perfect. In this paper, the central-point bending fatigue test was conducted by constant strain mode with MTS apparatus. The fatigue performance and model of polyacrylonitrile (PAN) fiber-reinforced asphalt mixture produced with different fiber contents and asphalt contents were reported. The results indicated that the fatigue life of fiber reinforced mixture was higher than the reference one. The effects of fiber contents and asphalt contents on fatigue life were discussed. The mechanism of an optimum fiber content for the fatigue life in the fiber reinforced asphalt mixture was explained. The statistical analysis of variance (ANOVA) method and regression method were used to evaluate the effects of fiber content, strain level, and volumetric parameters, etc. on the fatigue life of an asphalt mixture. This paper presents a new fatigue performance model of a PAN fiber-reinforced asphalt mixture, including the fiber content, tensile strain, mixture initial flexural stiffness, and voids filled with asphalt (VFA). Compared to the earlier fatigue equations, the accuracy of the new fatigue model with the fiber content is improved significantly according to the statistical analysis results. Meanwhile, the model can preferably reveal the effect of fiber content, strain level, initial stiffness, and VFA on fatigue life.
1. Introduction
The fatigue resistance of an asphalt mixture refers to its ability to withstand repeated bending without fracture. The fatigue in asphalt pavements mainly appears as cracking on the surface of the pavement. These fatigue cracks are usually a series of interconnecting cracks caused by fatigue failure of the asphalt surface under repeated traffic loading. These tensile cracks caused by repeated flexural stresses propagate and grow continuously. Finally, these cracks are interconnected, forming multi-sided, sharp-angled pieces, which develop a pattern resembling alligator skin. Fatigue cracking is considered one of the main structural distress modes in asphalt pavement. It is also essential to consider the loss of asphalt pavement serviceability in the performance-based design of asphalt mixtures and the structural design of flexible pavements [1,2].
Some reports have revealed that the incorporation of fibers into asphalt mixture can improve the properties of the mixture to some extent [3,4,5,6]. Kim et al. [7] concluded that the reinforcing efficiencies of polyester and nylon fibers on the mechanical performance of asphalt concrete increased as the fiber content increased from 0.5% to 1.0%. Xiang et al. [8] found that basalt fiber, whose surface was modified by a silane coupling agent, had good interfacial compatibility with asphalt by the reaction with free silane groups. Morea and Zerbino [9] found that fracture behavior at low to medium temperatures and rutting behavior was significantly improved by the addition of glass macro fibers and could reduce permanent deformation by up to 50% compared to a mixture without fibers. Klinsky et al. [10] found that pavement overlays with a compound of polypropylene and aramid fiber modified hot mix asphalt can better resist reflective cracking and reduce rutting rate evolution. Yanping et al. [11] investigated the effect of phosphorus slag powder (PSP) and polyester fiber (PF) on the rheological properties of asphalt binder and the mechanical properties of the resultant mixture, and concluded that PSP in combination with PF can provide satisfactory rutting, moisture susceptibility, and low temperature cracking of the resultant mixture. Davar et al. [12] found that the use of basalt fiber in a reinforced mixture with diatomite (which were of a higher stiffness) ended up doubling the fatigue life of the asphalt mixture. In this study, the composite of basalt fiber and diatomite was used to enhance the fatigue life and tensile strength of hot mix asphalt. Dehghanan and Modarres [13] evaluated the fatigue response of polyethylene terephthalate (PET) fiber modified asphalt specimens by a four-point bending test and found that PET fiber increased the fatigue life of hot mix asphalt (HMA) by up to 70%. Badeli et al. [14] found that aramid pulp fiber asphalt mixture had a lower fatigue life at high strain amplitudes (heavy truckloads). Brovelli et al. [15] concluded that the use of 6% and 9% of amorphous polyolefin and a compound of low density polyethylene (LDPE) and ethylene/vinyl acetate (EVA), as well as cellulose and synthetic fibers, could improve the fatigue resistance of asphalt mixture and energetic methods can be effectively applied to data from indirect tensile fatigue tests. Guo et al. [16] evaluated the effects of diamite and glass fiber on the properties of asphalt mixture using the statistical analysis of variance (ANOVA) method and statistical regression method. They found that diatomite and glass fiber can improve the rutting resistance and fatigue properties of asphalt mixture.
Traditionally, fatigue models are proposed as a result of fitting laboratory test data. The fatigue characteristics are usually represented as relationships between the initial longitudinal stress and strain versus the number of load repetitions to failure. However, accurate description of the fatigue behavior of asphalt mixture is a difficult task due to the complexity of fatigue phenomenon under varying material, loading, and environmental conditions. For the past several decades, significant research efforts have been devoted to the selection of an appropriate laboratory test procedure and developing reliable fatigue models that could be used to predict the fatigue life of HMA pavements. Monismith and Deacon [17] suggested that the controlled-strain mode of loading be approached by asphalt pavements when the thickness of the HMA layer is less than 50 mm (except when the HMA layer is extremely stiff or the base is very weak). The researchers of the University of California Berkeley recommended that the repeated flexural beam (three point loading) fatigue test method under the controlled-strain mode of loading be a relatively simple test, which can best simulate field conditions, compared with various laboratory fatigue tests under the Strategic Highway Research Program (SHRP) Project [18]. Hajj et al. [19] conducted tests to evaluate the fatigue characteristics of HMA, designed using the Superpave volumetric method and Nevada’s Hveem method. Their tests used the flexural beam fatigue test under the strain-controlled mode of loading. The influence of long-term oven aging on the fatigue performance was also evaluated. Shen et al. [20] developed a new fatigue response model based on the dissipated energy equation and the equation correlating the cumulative energy and fatigue life under the same strain level. Zhesheng and Xiaoming [21] conducted five kinds of asphalt mixtures’ fatigue tests on the control strain mode. They concluded that asphalt mixtures’ logarithm fatigue life follows a normal distribution at the same strain level. Meanwhile, the strain level has a linear relationship with the logarithm fatigue life. In the fatigue testing of the control strain mode, when asphalt mixtures modulus is much lower, its fatigue life is much longer.
Based on the phenomenological approach, many fatigue response models have been generalized. For many years, the most commonly accepted model of the fatigue life for a given asphalt mixture can be characterized by the following relationships:
where, Nf is the fatigue life; ɛt or σt is the applied tensile strain or stress, respectively; and k1 and k2 are experimental coefficients. These relationships were consistently confirmed in the SHRP project for the ranges of stresses and strains to which laboratory specimens were subjected [18].
Monismith et al. [22] suggested introducing the mixture stiffness term to the original form so that the original effects of asphalt mixture could be taken into consideration:
where, Nf is the fatigue life; ɛt is the applied tensile strain; S0 is the mixture initial flexural stiffness; and k1, k2, and k3 are experimental coefficients.
Prior to Monismith’s contribution, Pell and Cooper [23] suggested introducing the effect of the volumetric asphalt content (Va) and the air void (AV) content to the fatigue performance model of HMA mixtures:
where, Nf is the fatigue life; ɛt is the applied tensile strain; S0 is the mixture initial flexural stiffness; Va is the asphalt content; AV is the air void content; and k1, k2, k3, and k4 are experimental coefficients. For asphalt mixture, the concept of an improved performance with a reduced air void content and/or increased asphalt content has often been expressed in terms of voids filled with asphalt (VFA). Therefore, Equation (4) can also be characterized by:
Hajj et al. [19] investigated the fatigue characteristics of Superpave and Hveem mixtures. In comparison with Equation (3), they concluded that the accuracy of Equation (4), in which the volumetric term is included, increases significantly.
However, little information is available on the fatigue model of polymer fiber-reinforced asphalt mixtures. None of these studies researched the flexural fatigue behavior of the composite. In this paper, the fatigue property of PAN fiber-reinforced asphalt mixtures is analyzed and a new fatigue equation for PAN fiber-reinforced asphalt mixtures has been generated.
2. Materials
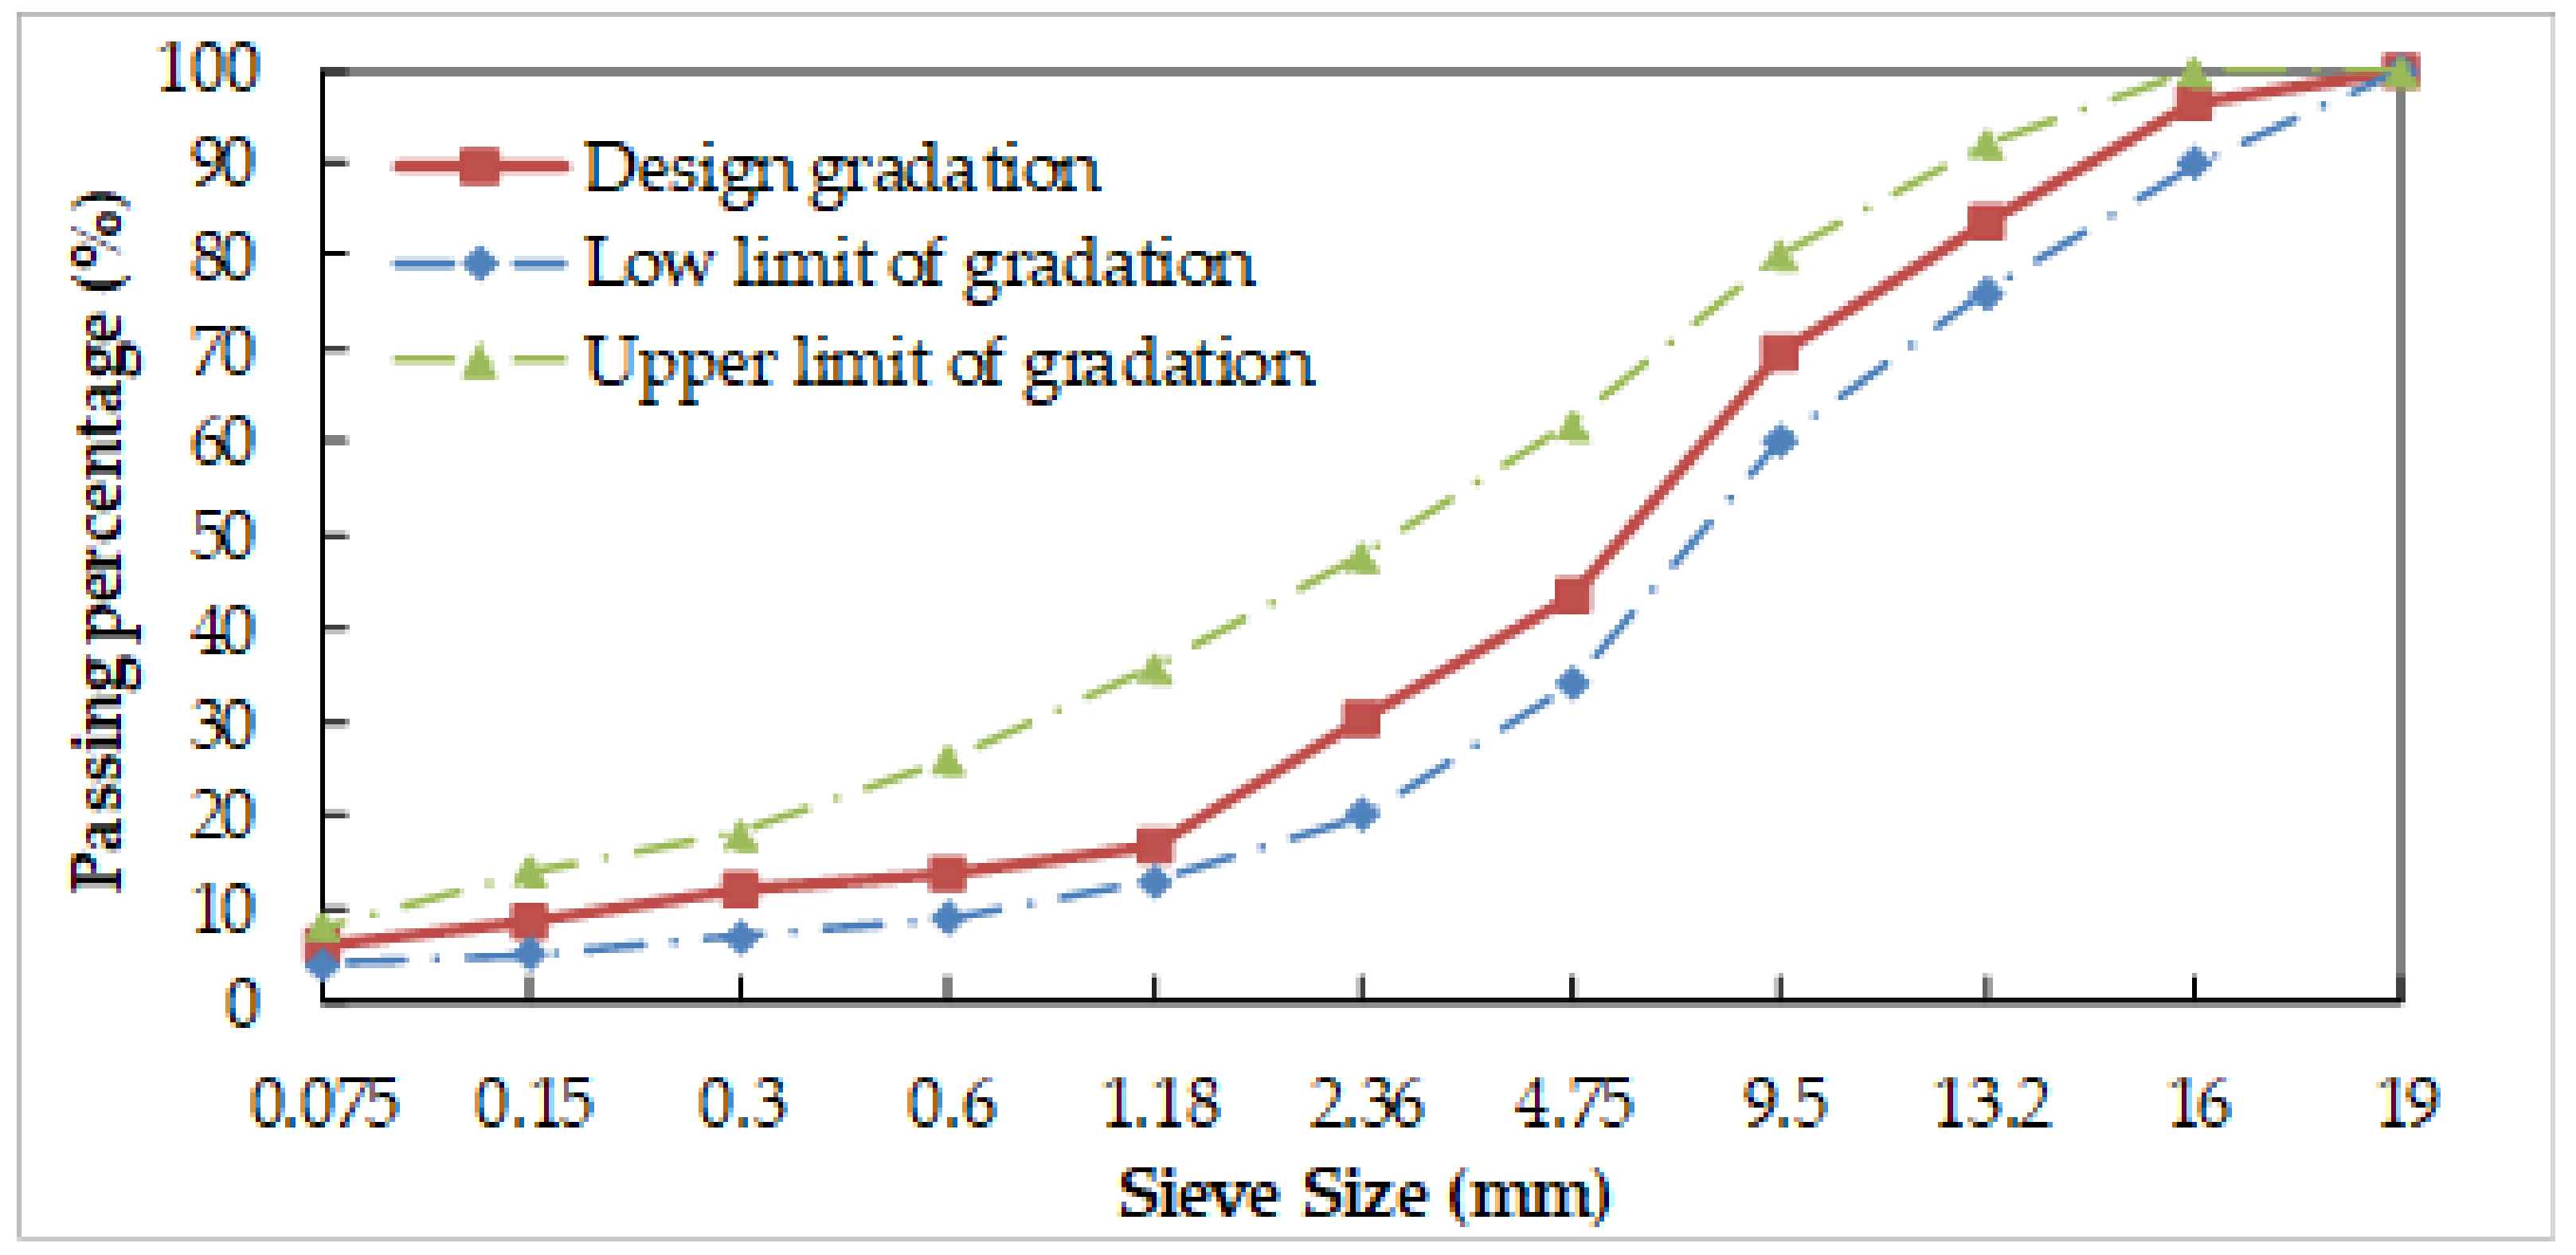
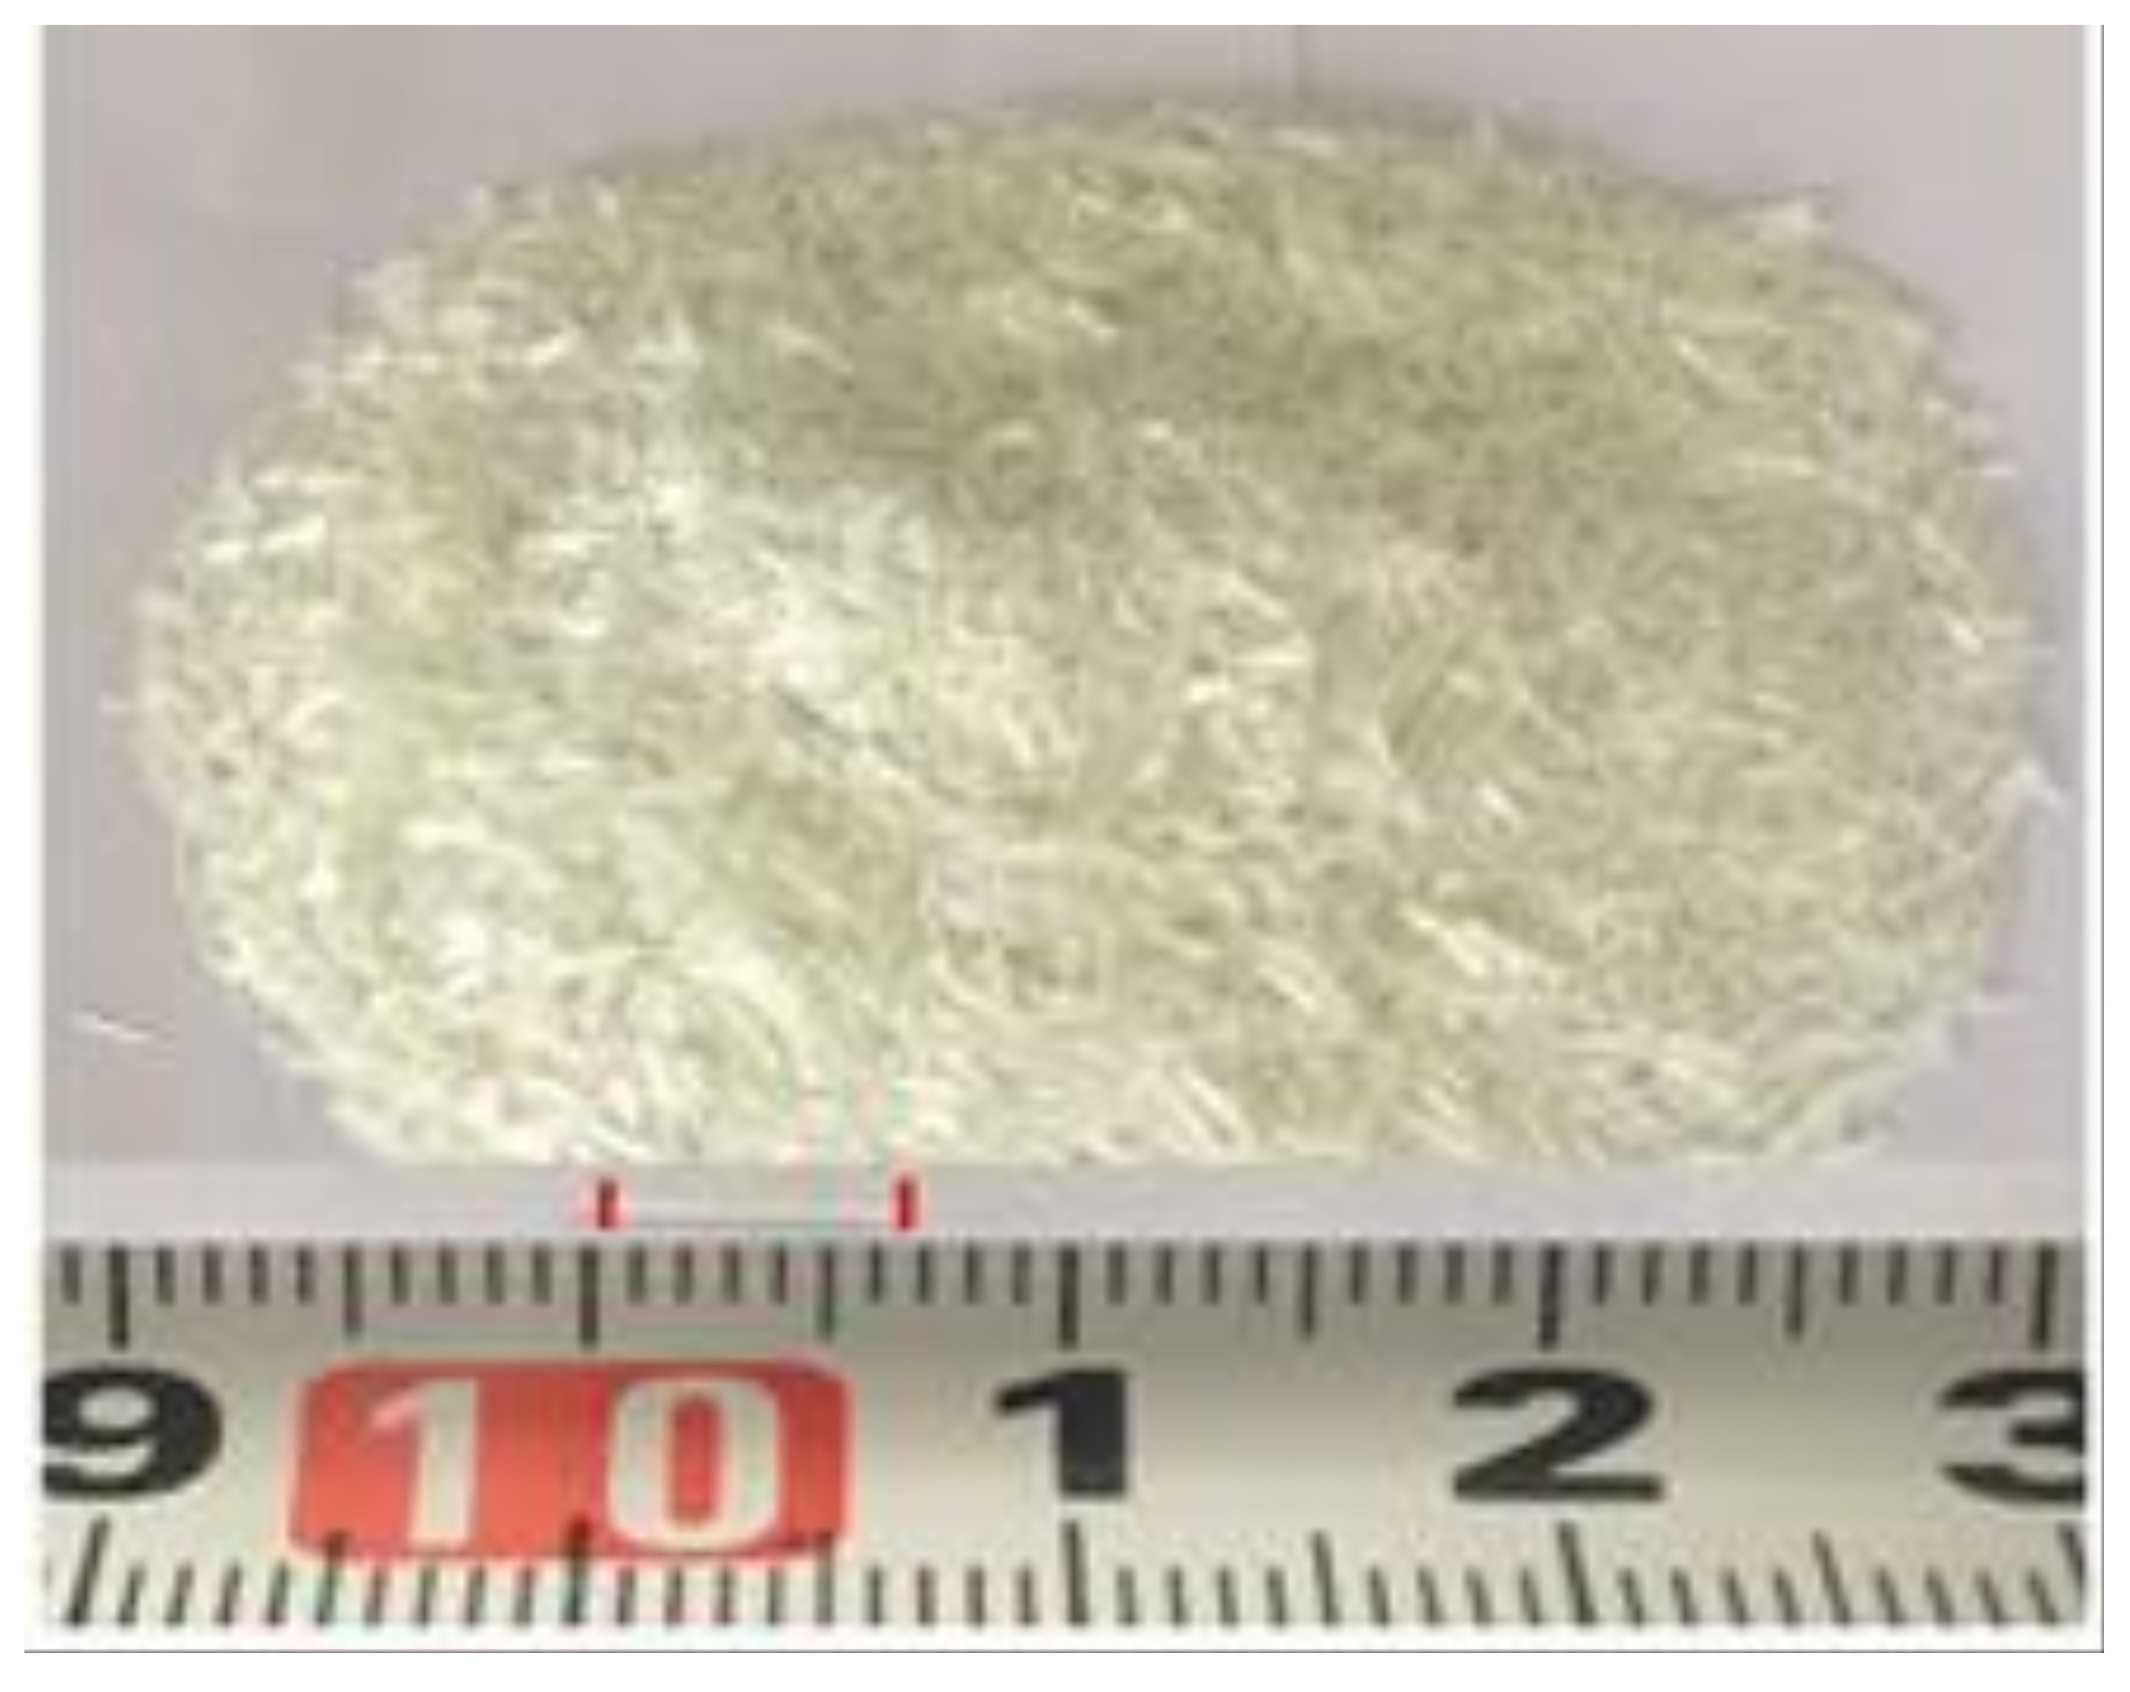
The aggregate used in this study was taken from a basalt quarry. It was completely crushed, with the larger particles having an angular shape and rough surface texture. Its basic properties are listed in Table 1. The design gradation of aggregate met the gradations requirements of the AC-16 dense-graded asphalt mixture according to the Chinese Technical Specifications for Construction of Highway Asphalt Pavements (JTG F40-2004) [24]. As shown in Figure 1, a 70# penetration “A” grade asphalt binder was selected. The main physical properties of the asphalt binder were tested following the Chinese Standard Test Methods of Bitumen and Bituminous Mixtures for Highway Engineering (JTG E20-2011) [25]. The results are listed in Table 2. All properties of the aggregate and asphalt comply with the requirements of the Chinese Technical Specifications for Construction of Highway Asphalt Pavements (JTG F40-2004) [24]. A commercially available PAN fiber was used to reinforce the asphalt mixture. The properties of the PAN fiber are presented in Table 3. Moreover, the PAN fibers are shown in Figure 2. In this study, four kinds of PAN fiber contents (0, 0.15%, 0.30%, and 0.45% by weight of the mixture) are used.
The Marshall method of mix design was used to determine the optimum asphalt content (OAC) for all kinds of asphalt mixture. The Marshall test results of all mixtures at the OAC are shown in Table 4.
3. Specimen Preparation and Test Procedure
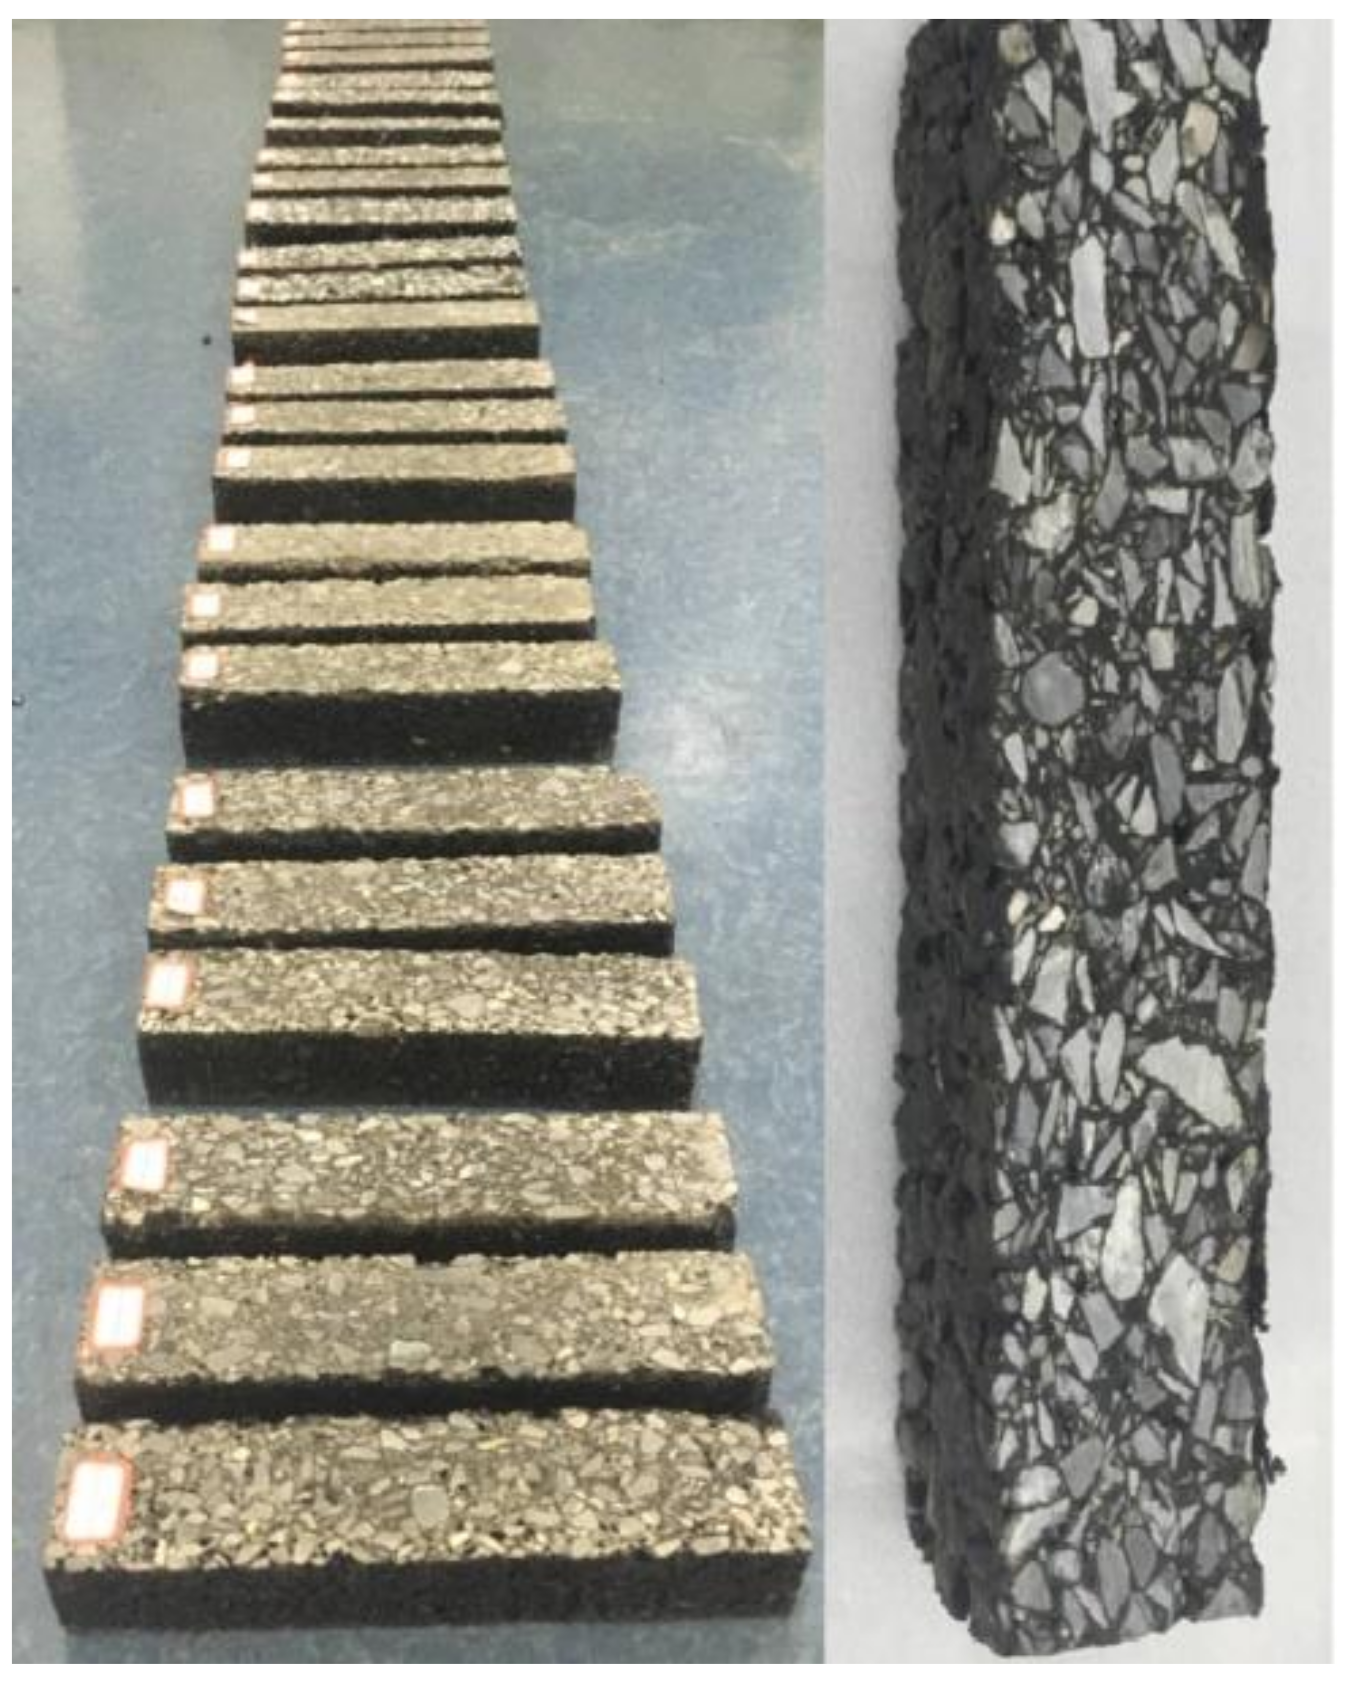
Three asphalt contents (OAC, OAC+0.5%, and OAC−0.5%) and four PAN fiber contents (0, 0.15%, 0.3%, and 0.45% by weight) were used in the experimental design. The mixture was compacted using a roller compactor following the Chinese Standard Test Methods of Bitumen and Bituminous Mixtures for Highway Engineering (JTG E20-2011) [25]. After compaction, the slabs were cut into flexural fatigue beam specimens with dimensions of 50 mm width, 50 mm height, and 250 mm length, as shown in Figure 3. At least three beams were prepared for every strain level. Air voids of flexural beams ranged between 7 ± 1%.
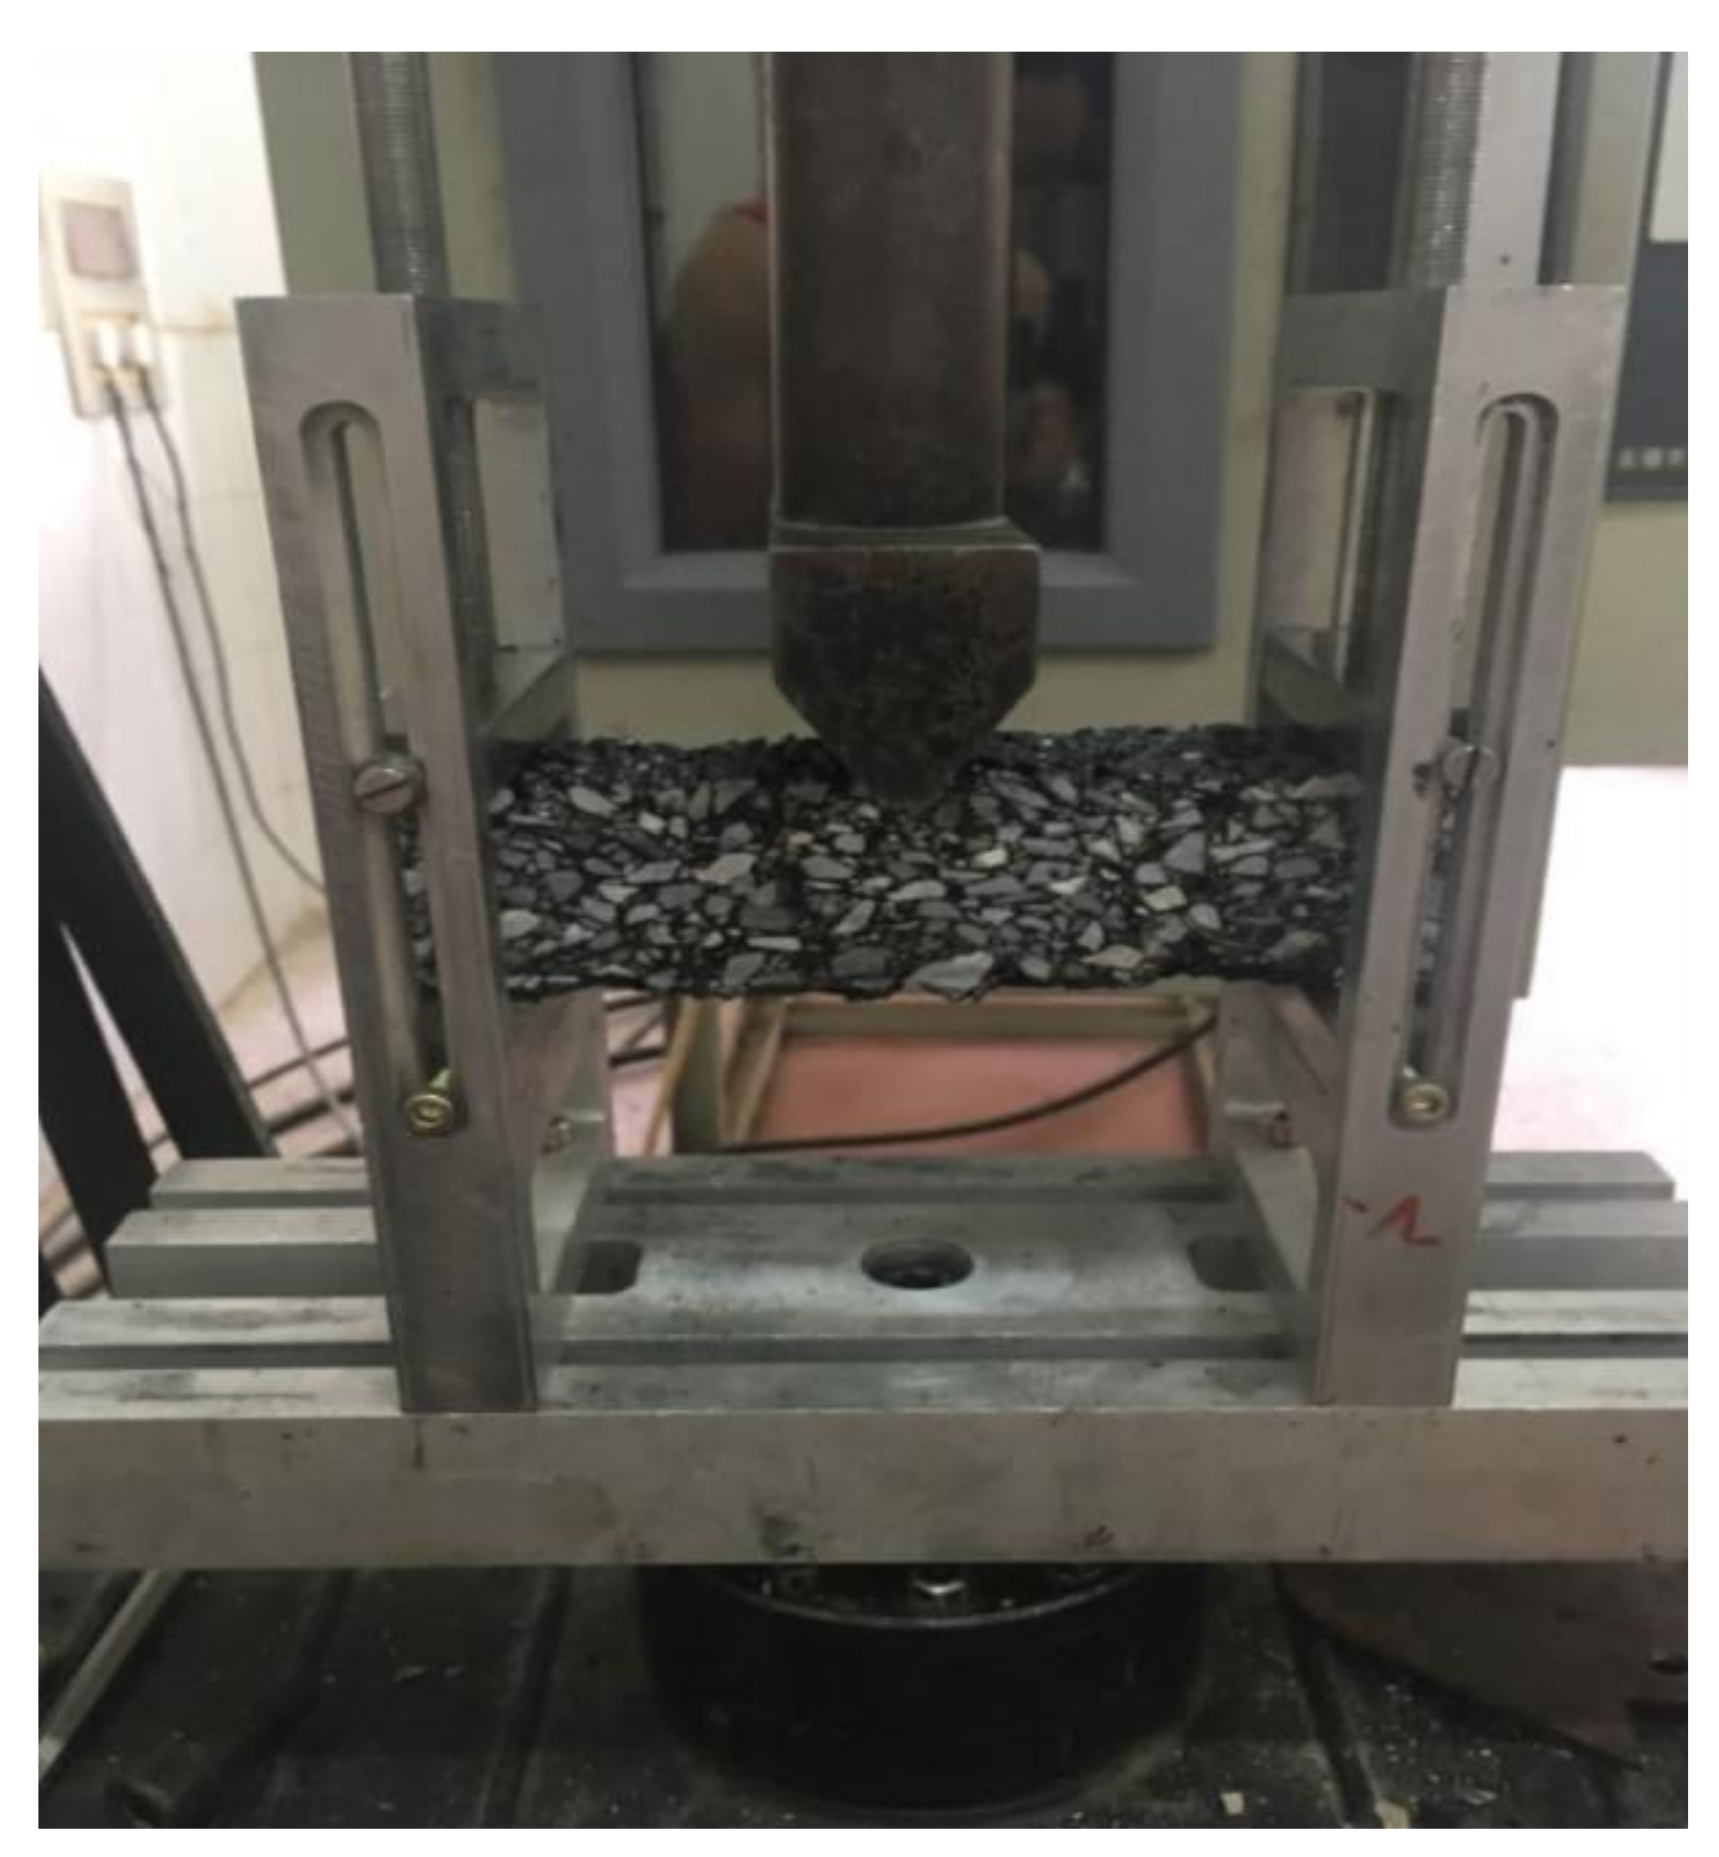
The fatigue tests shown in Figure 4 were performed by using a Mechanical Testing & Simulation (MTS) testing apparatus according to the Chinese Standard Test Methods of Bitumen and Bituminous Mixtures for Highway Engineering (JTG E20-2011) [25]. All fatigue tests were based on the strain-controlled mode of loading. A central-point load and a haversine-shaped wave at a frequency of 10 Hz were used in this study. The span of beam was 200 mm. All specimens were tested at 20 °C. Based on the ultimate flexural tensile-strain, five strain levels (600, 1000, 1500, 2000, and 2500 microstrain) were chosen for the mixture with fibers and four strain levels (600, 1000, 1200, and 1500 microstrain) were chosen for that without fibers.
During the fatigue tests on the strain-controlled mode, the fracture of the flexural beam is not often observed obviously. Therefore, the fatigue life is defined as the number of repetition cycles when the stiffness of the mixture reaches half of its initial stiffness value, taken at the 50th cycle. To minimize the effect of the variability in the stiffness caused by sample preparation and testing, the average initial stiffness of each mixture was defined as the geometric mean, calculated as follows:
where, S is the average initial stiffness; Si is the specimens’ initial stiffness; and n is number of specimens.
4. Test Results and Discussion
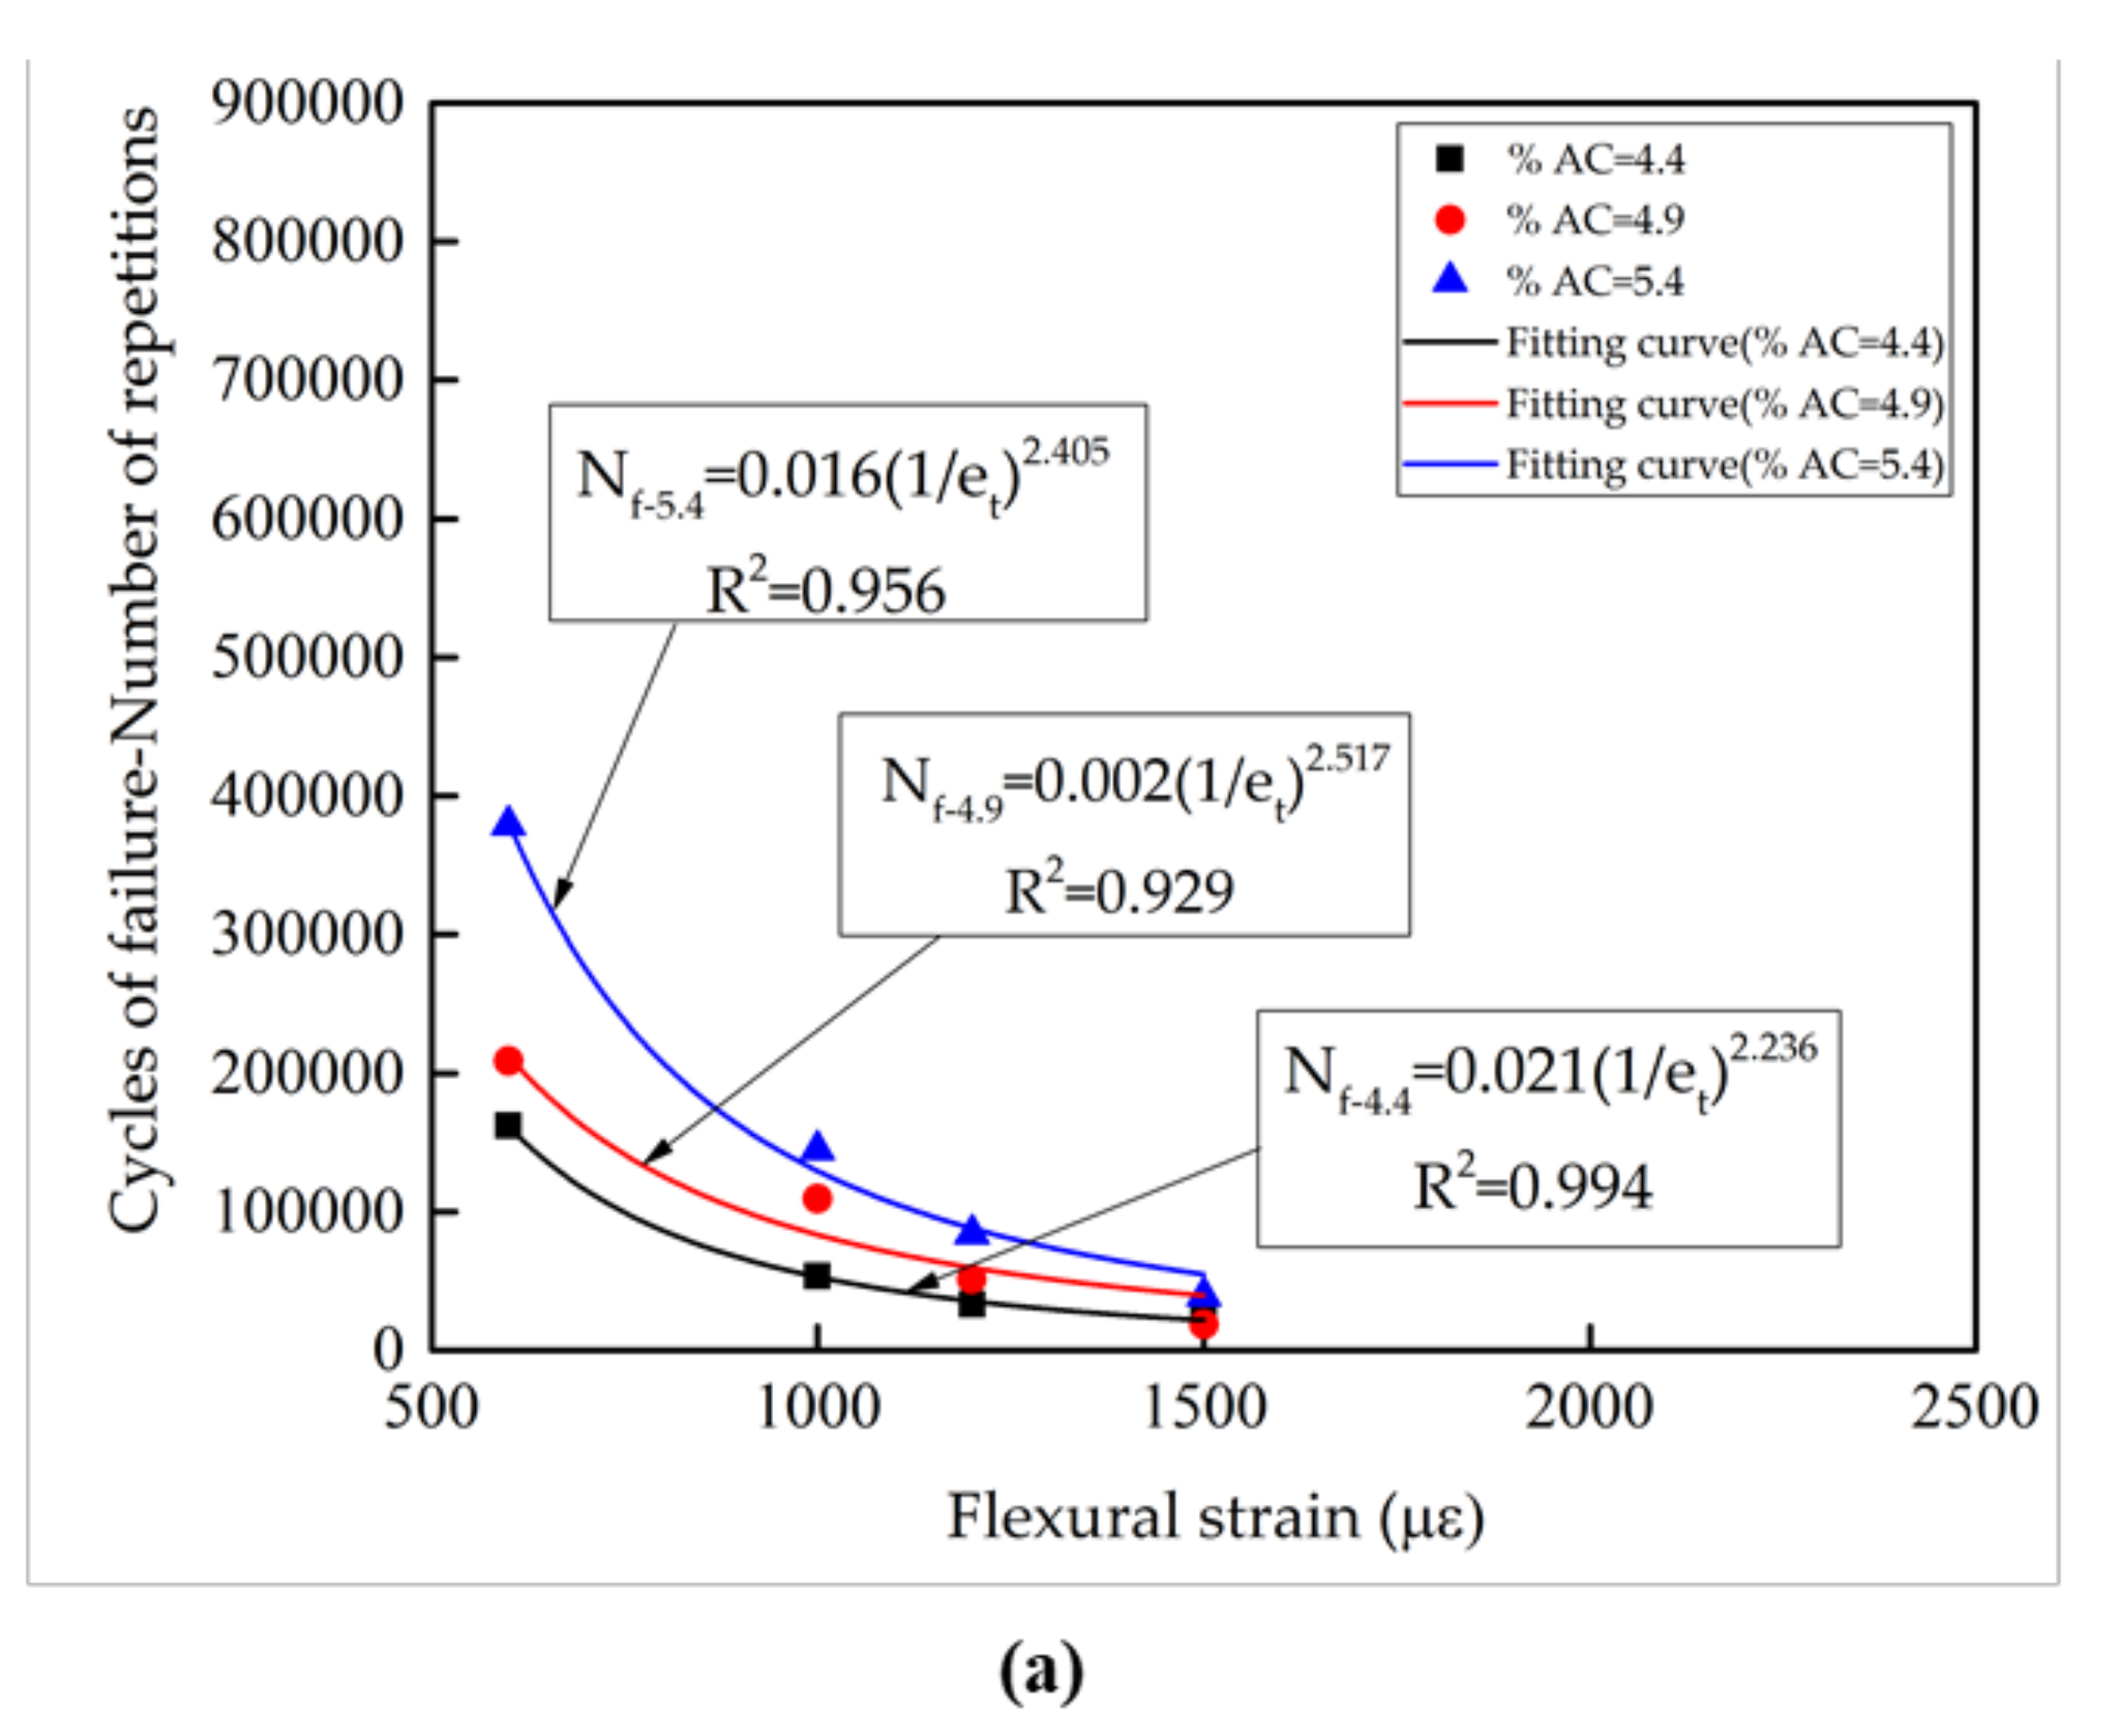
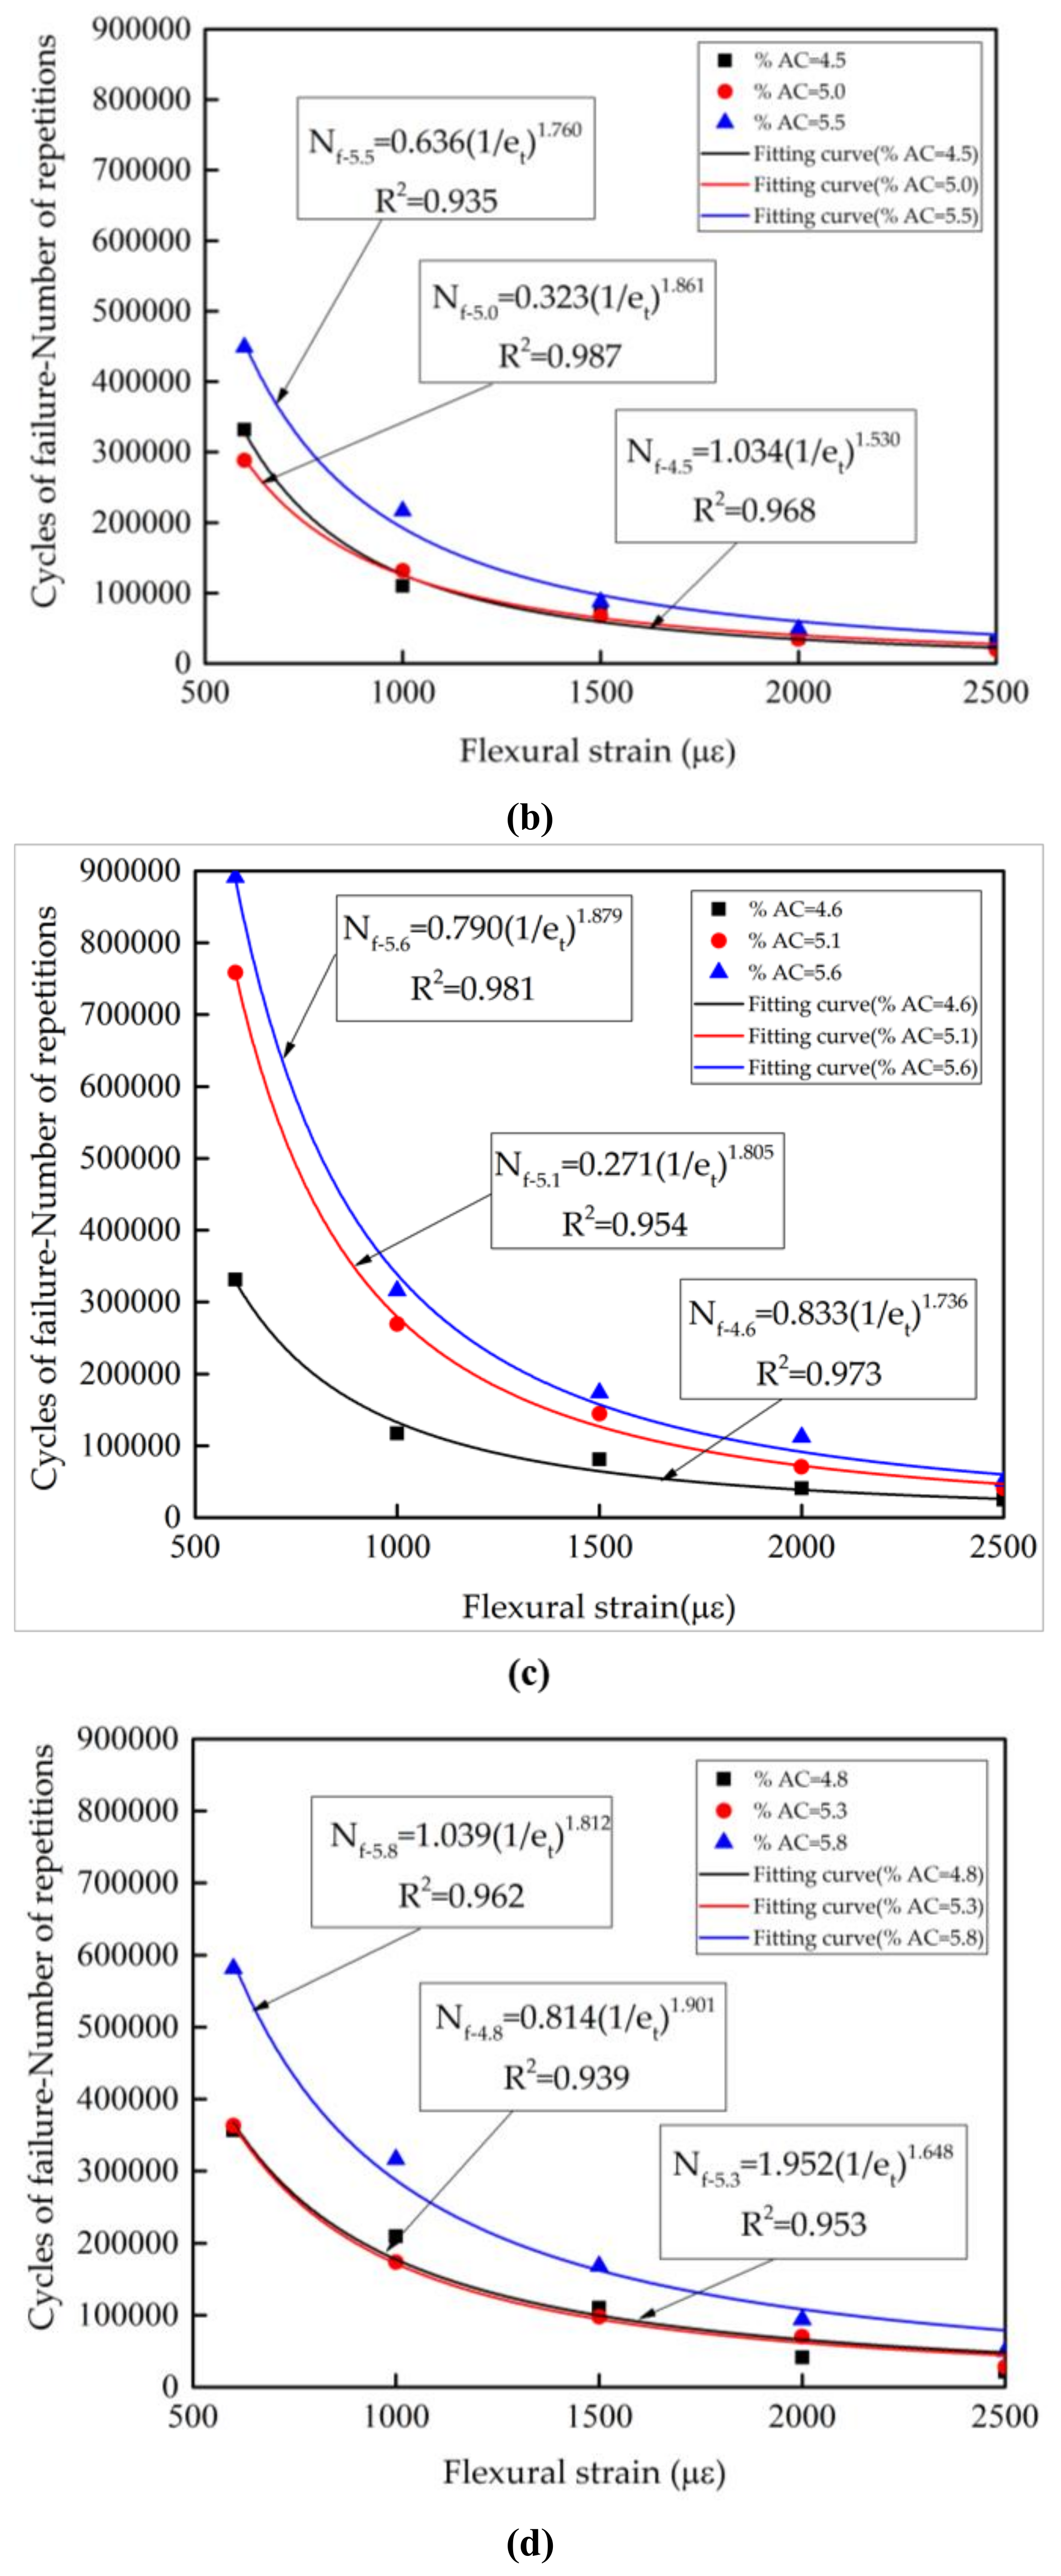
The fatigue test results of the fiber reinforced asphalt mixture with different fiber contents and asphalt contents are shown in Table 5 and Figure 5.
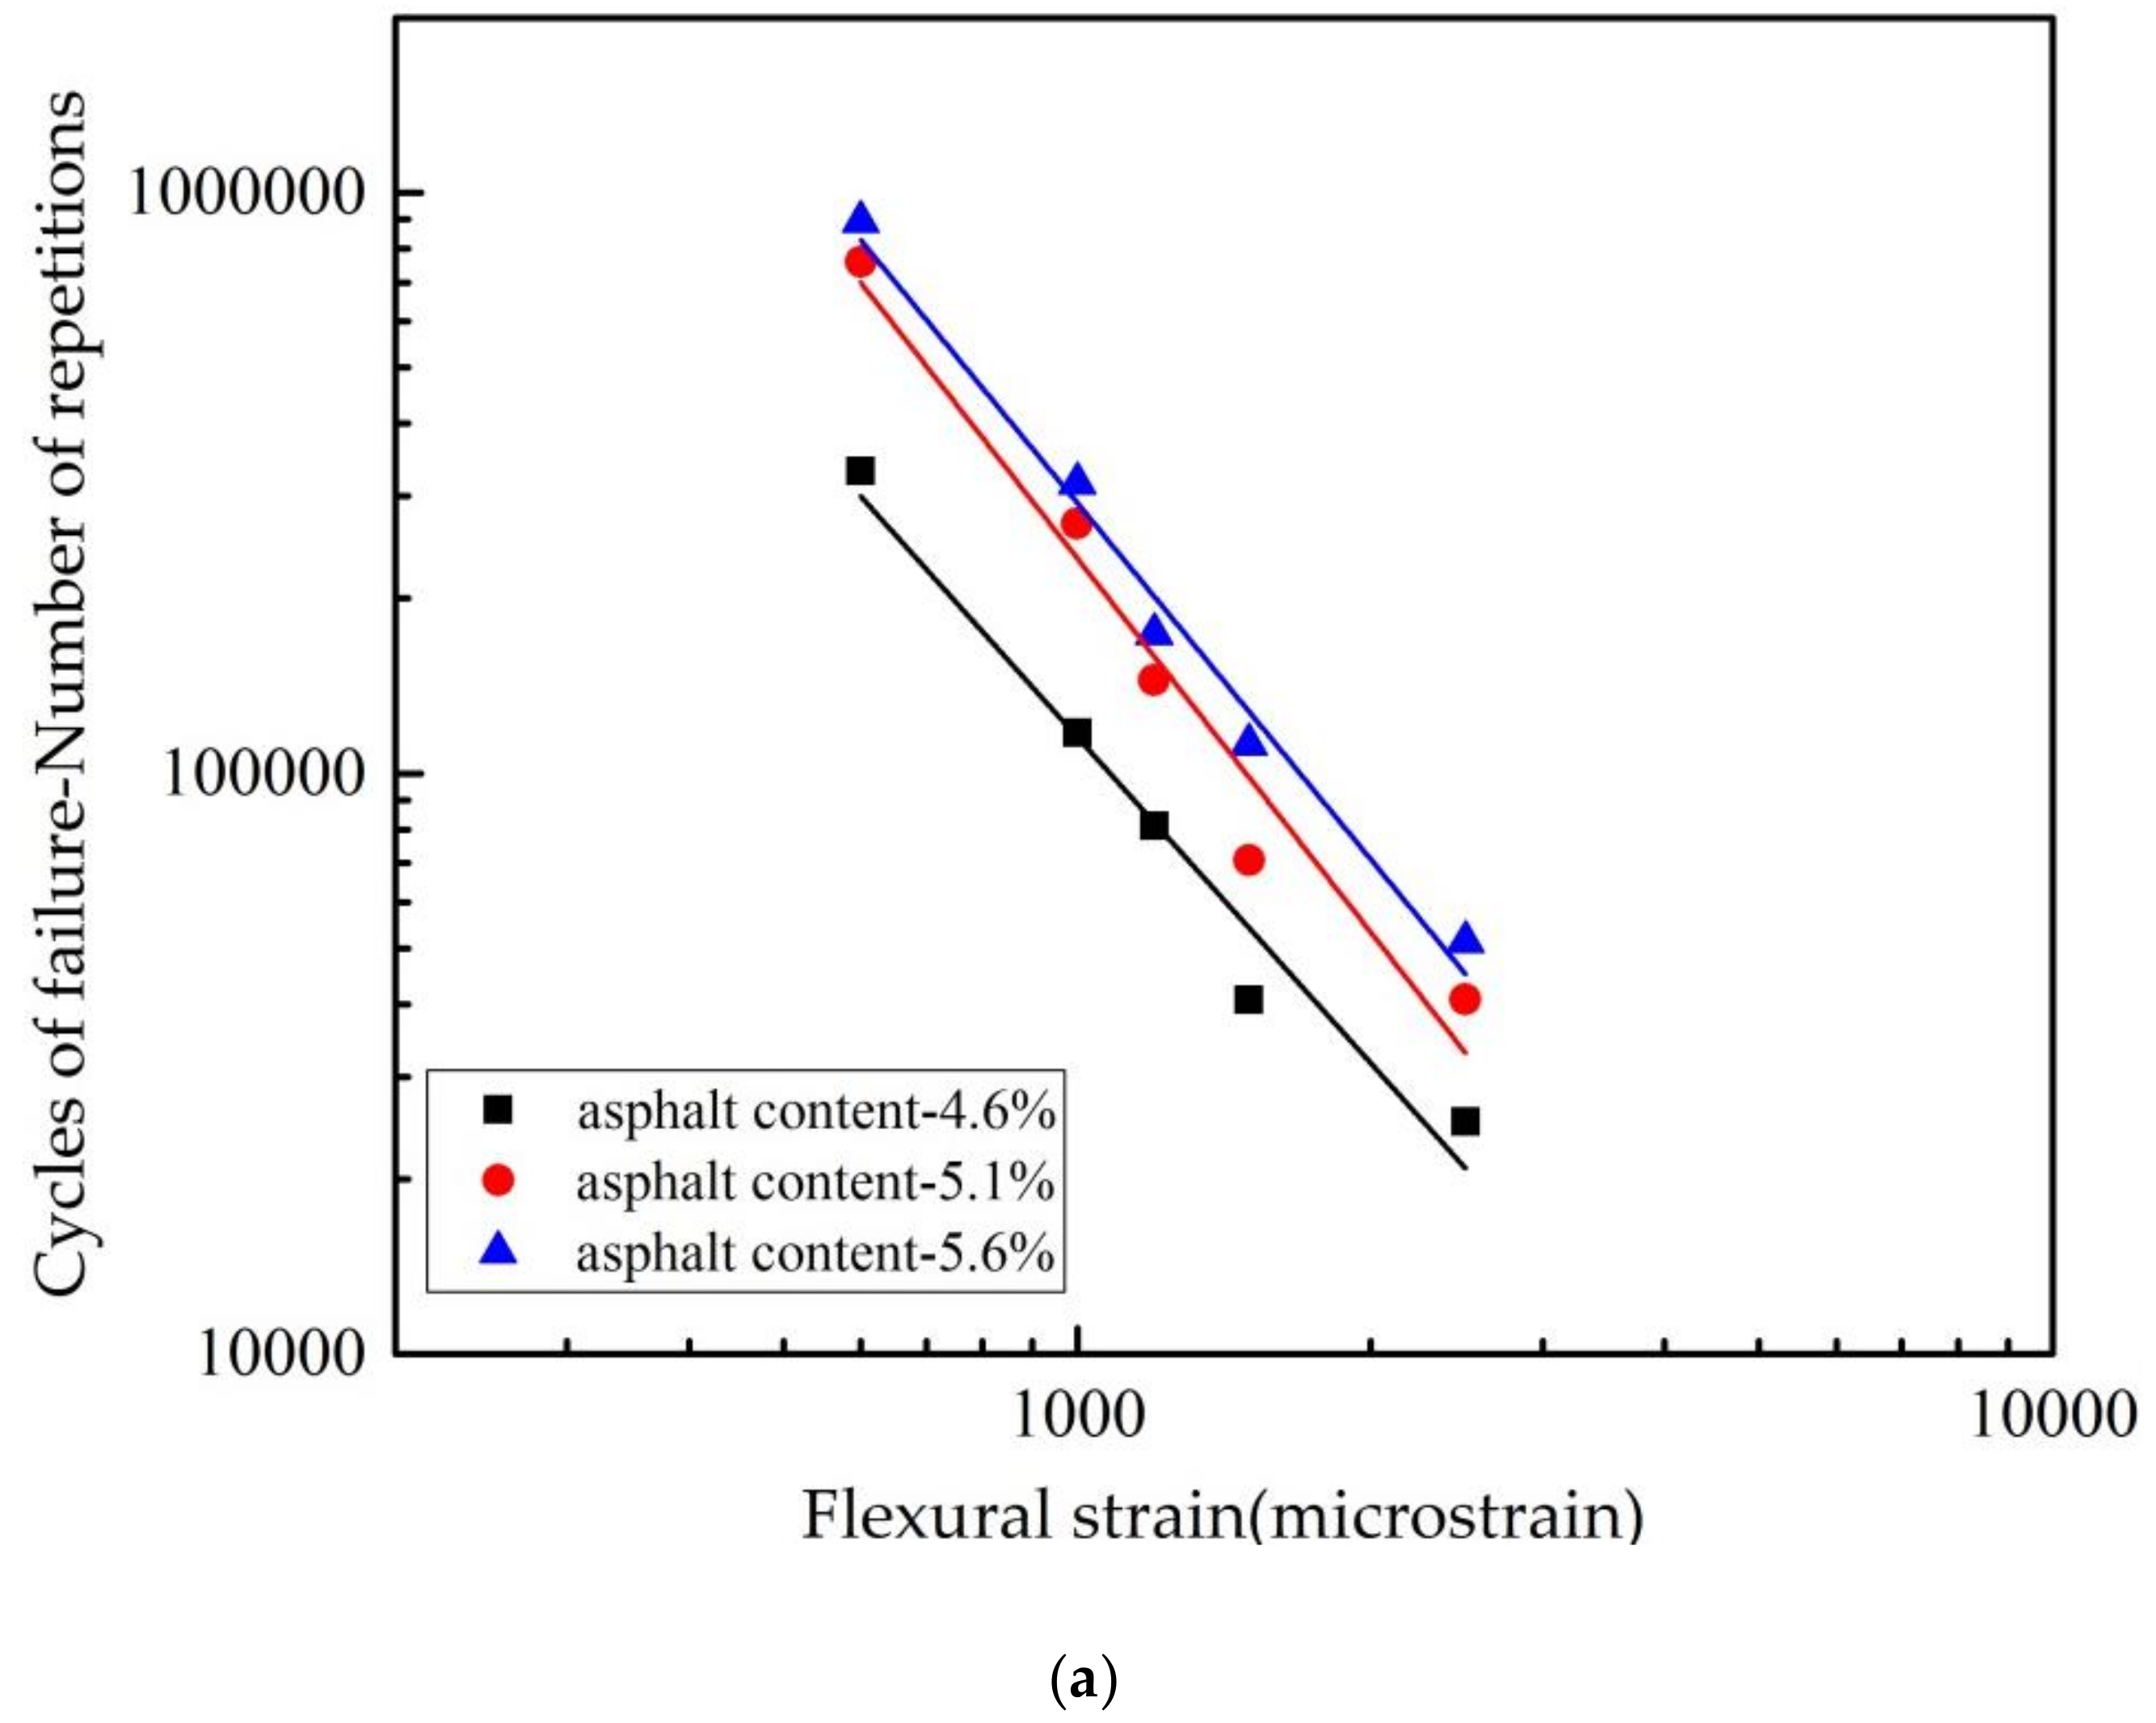
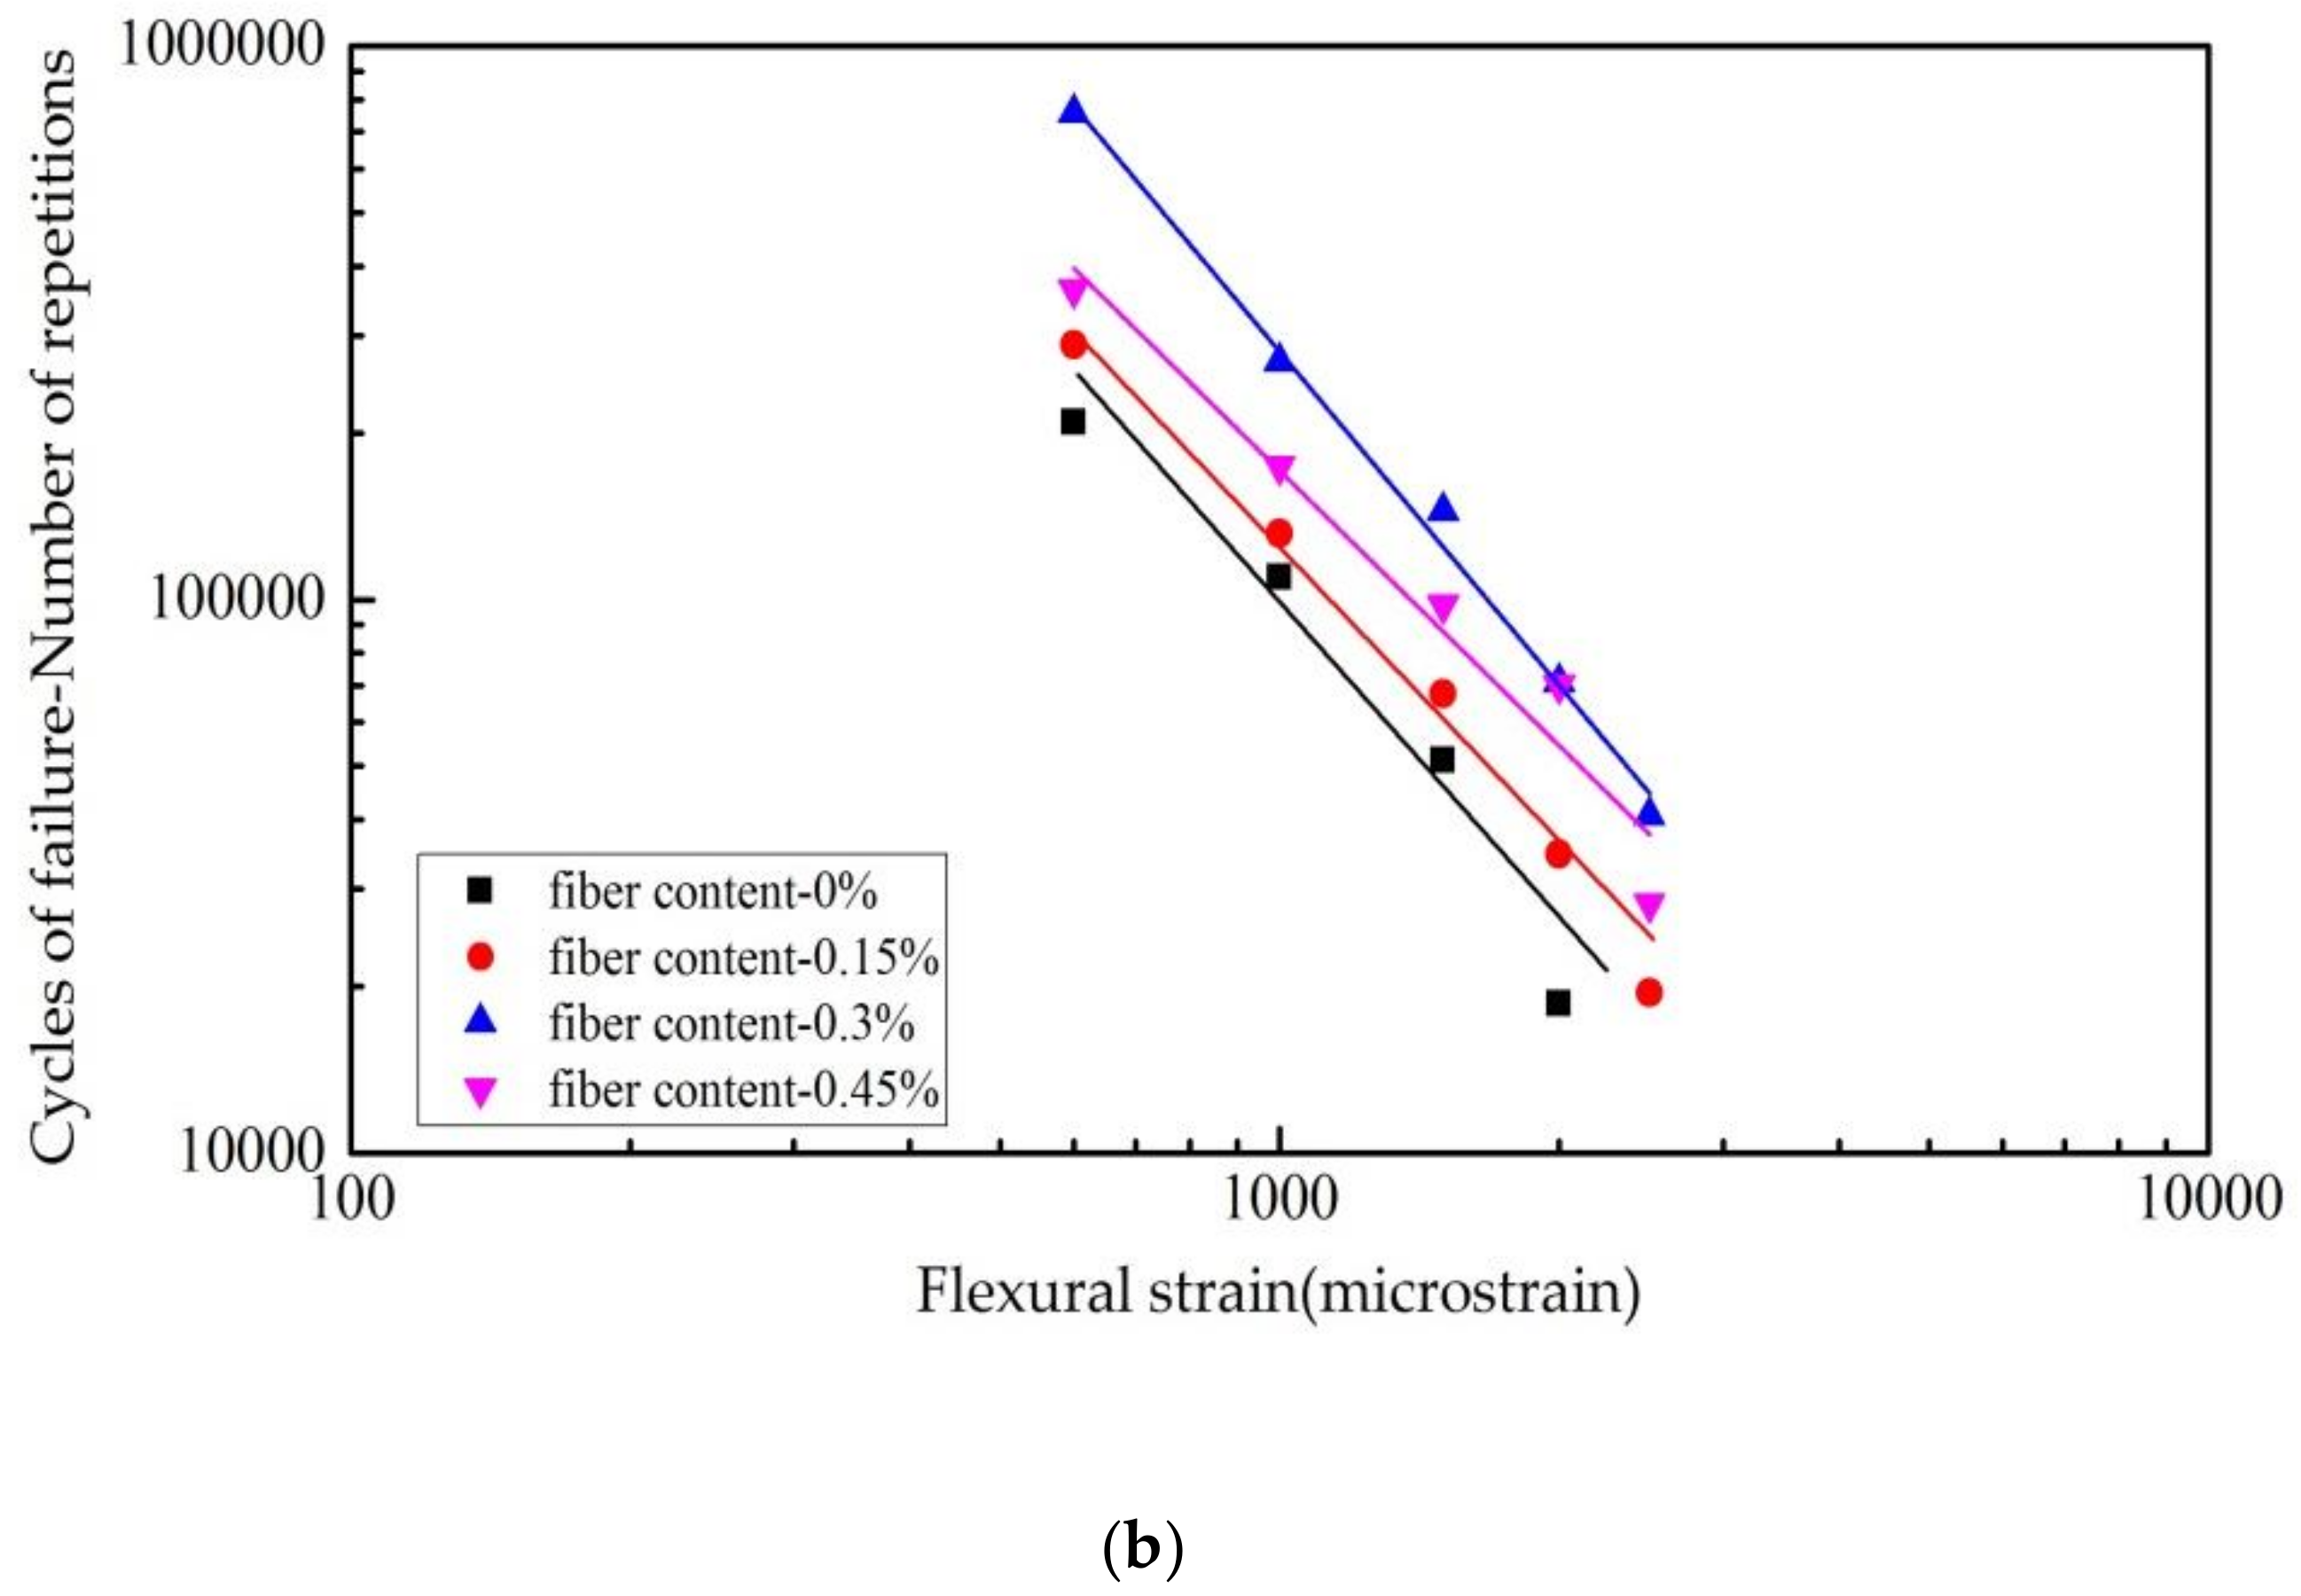
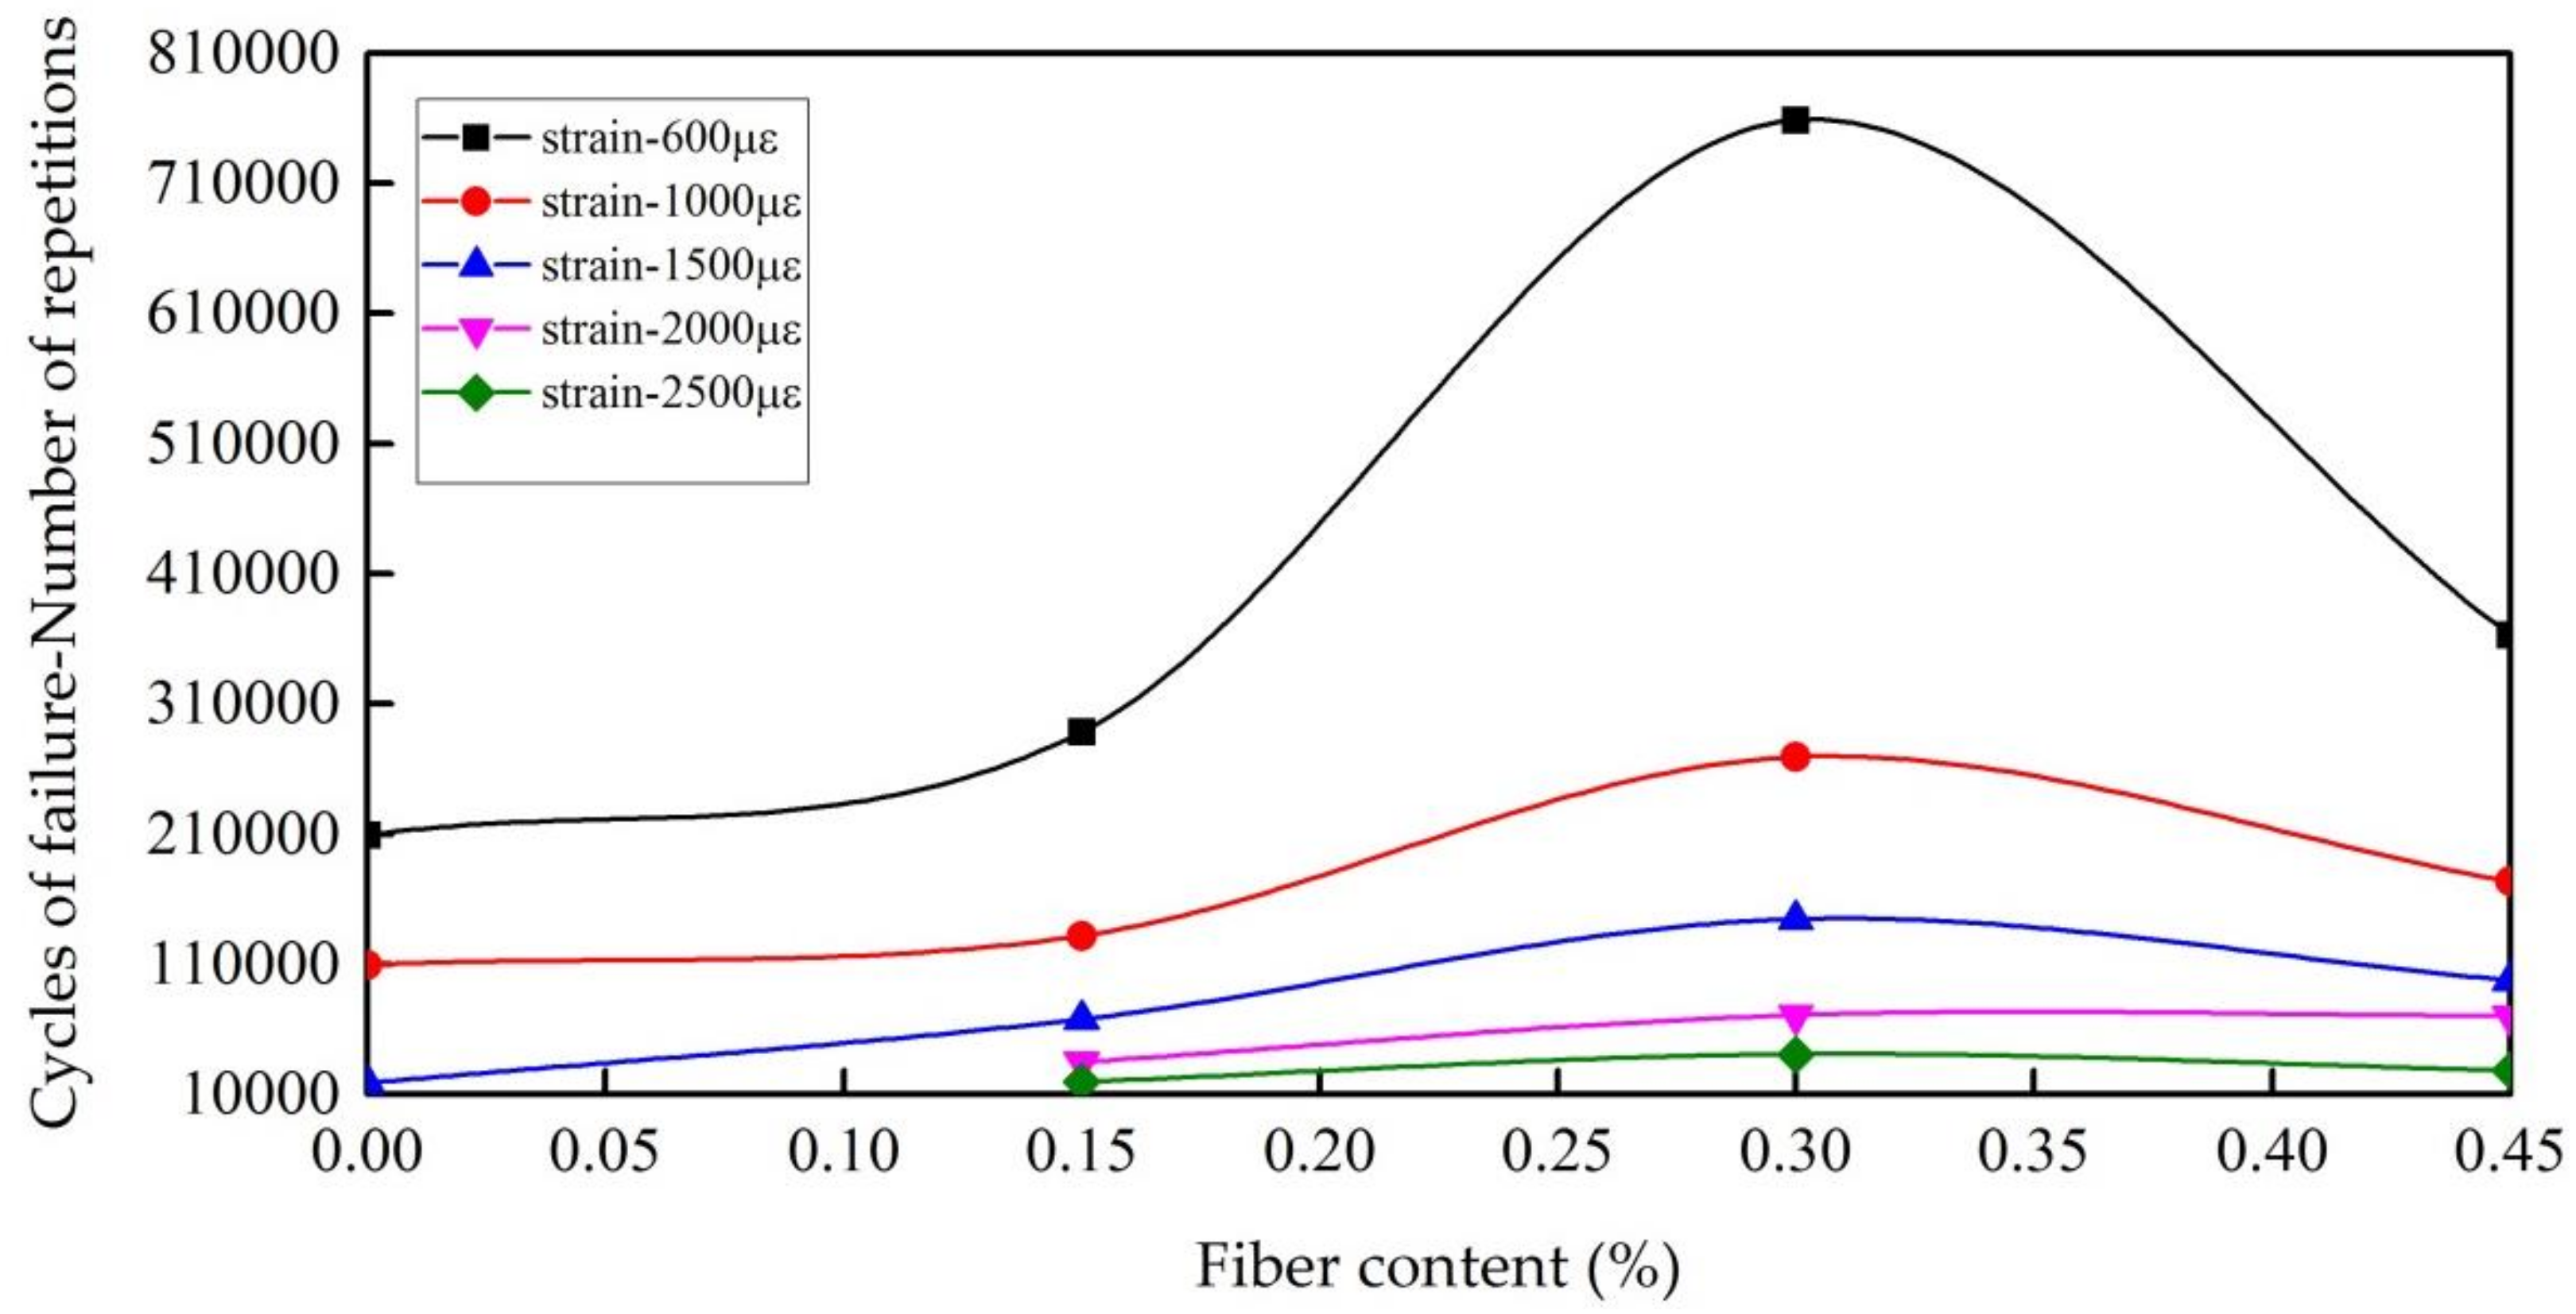
From Table 5 and Figure 5 and Figure 6, it can be seen that the regression results have shown that the correlation coefficient, R2, of each regression equation determined by Equation (1) is quite high. This means that the regression equation fits well. Compared with the mixture with fiber or without, the average value of the fatigue parameter, k2, declined by about 25%. It is shown that the fatigue sensitivity to the strain decreased significantly after adding fiber into the mixture. The anti-fatigue ability improved significantly. A seen in Figure 6a, the fatigue performance of the mixture was also improved with the asphalt content increasing at the same fiber content. It also can be seen from Figure 7, in the condition of low strain, that the effect of the fiber content on the fatigue life is more obvious than that in the condition of high strain.
In Figure 6b and Figure 7, the reinforced asphalt mixture obviously has an optimum fiber content for the fatigue life. When the fiber content is less than the optimum level, the fatigue life increases monotonically as the fiber content increases. Once above the optimum level, the fatigue life actually falls as fiber content increases. The potential reasons are:
- As seen from Table 4, the optimum asphalt content of 0.3% fiber content in the asphalt mixture increased by nearly 8% compared to that without fiber. The total surface area of aggregates is basically equal for the same gradation aggregates. This means that the thickness of the asphalt film around aggregates increases by nearly 8%, which is beneficial to the fatigue life of the asphalt mixture;
- On the one hand, the physical and chemical reactions occur on the interface between the asphalt and fiber; on the other hand, the asphalt mortar with a higher viscosity is formed after the addition of fibers. Therefore, the thickness of the structural asphalt film on the aggregate surface and the toughness of the asphalt, as well as the adhesive force to the aggregate, has been increased, which will help to improve the adhesive capacity between the aggregate and asphalt;
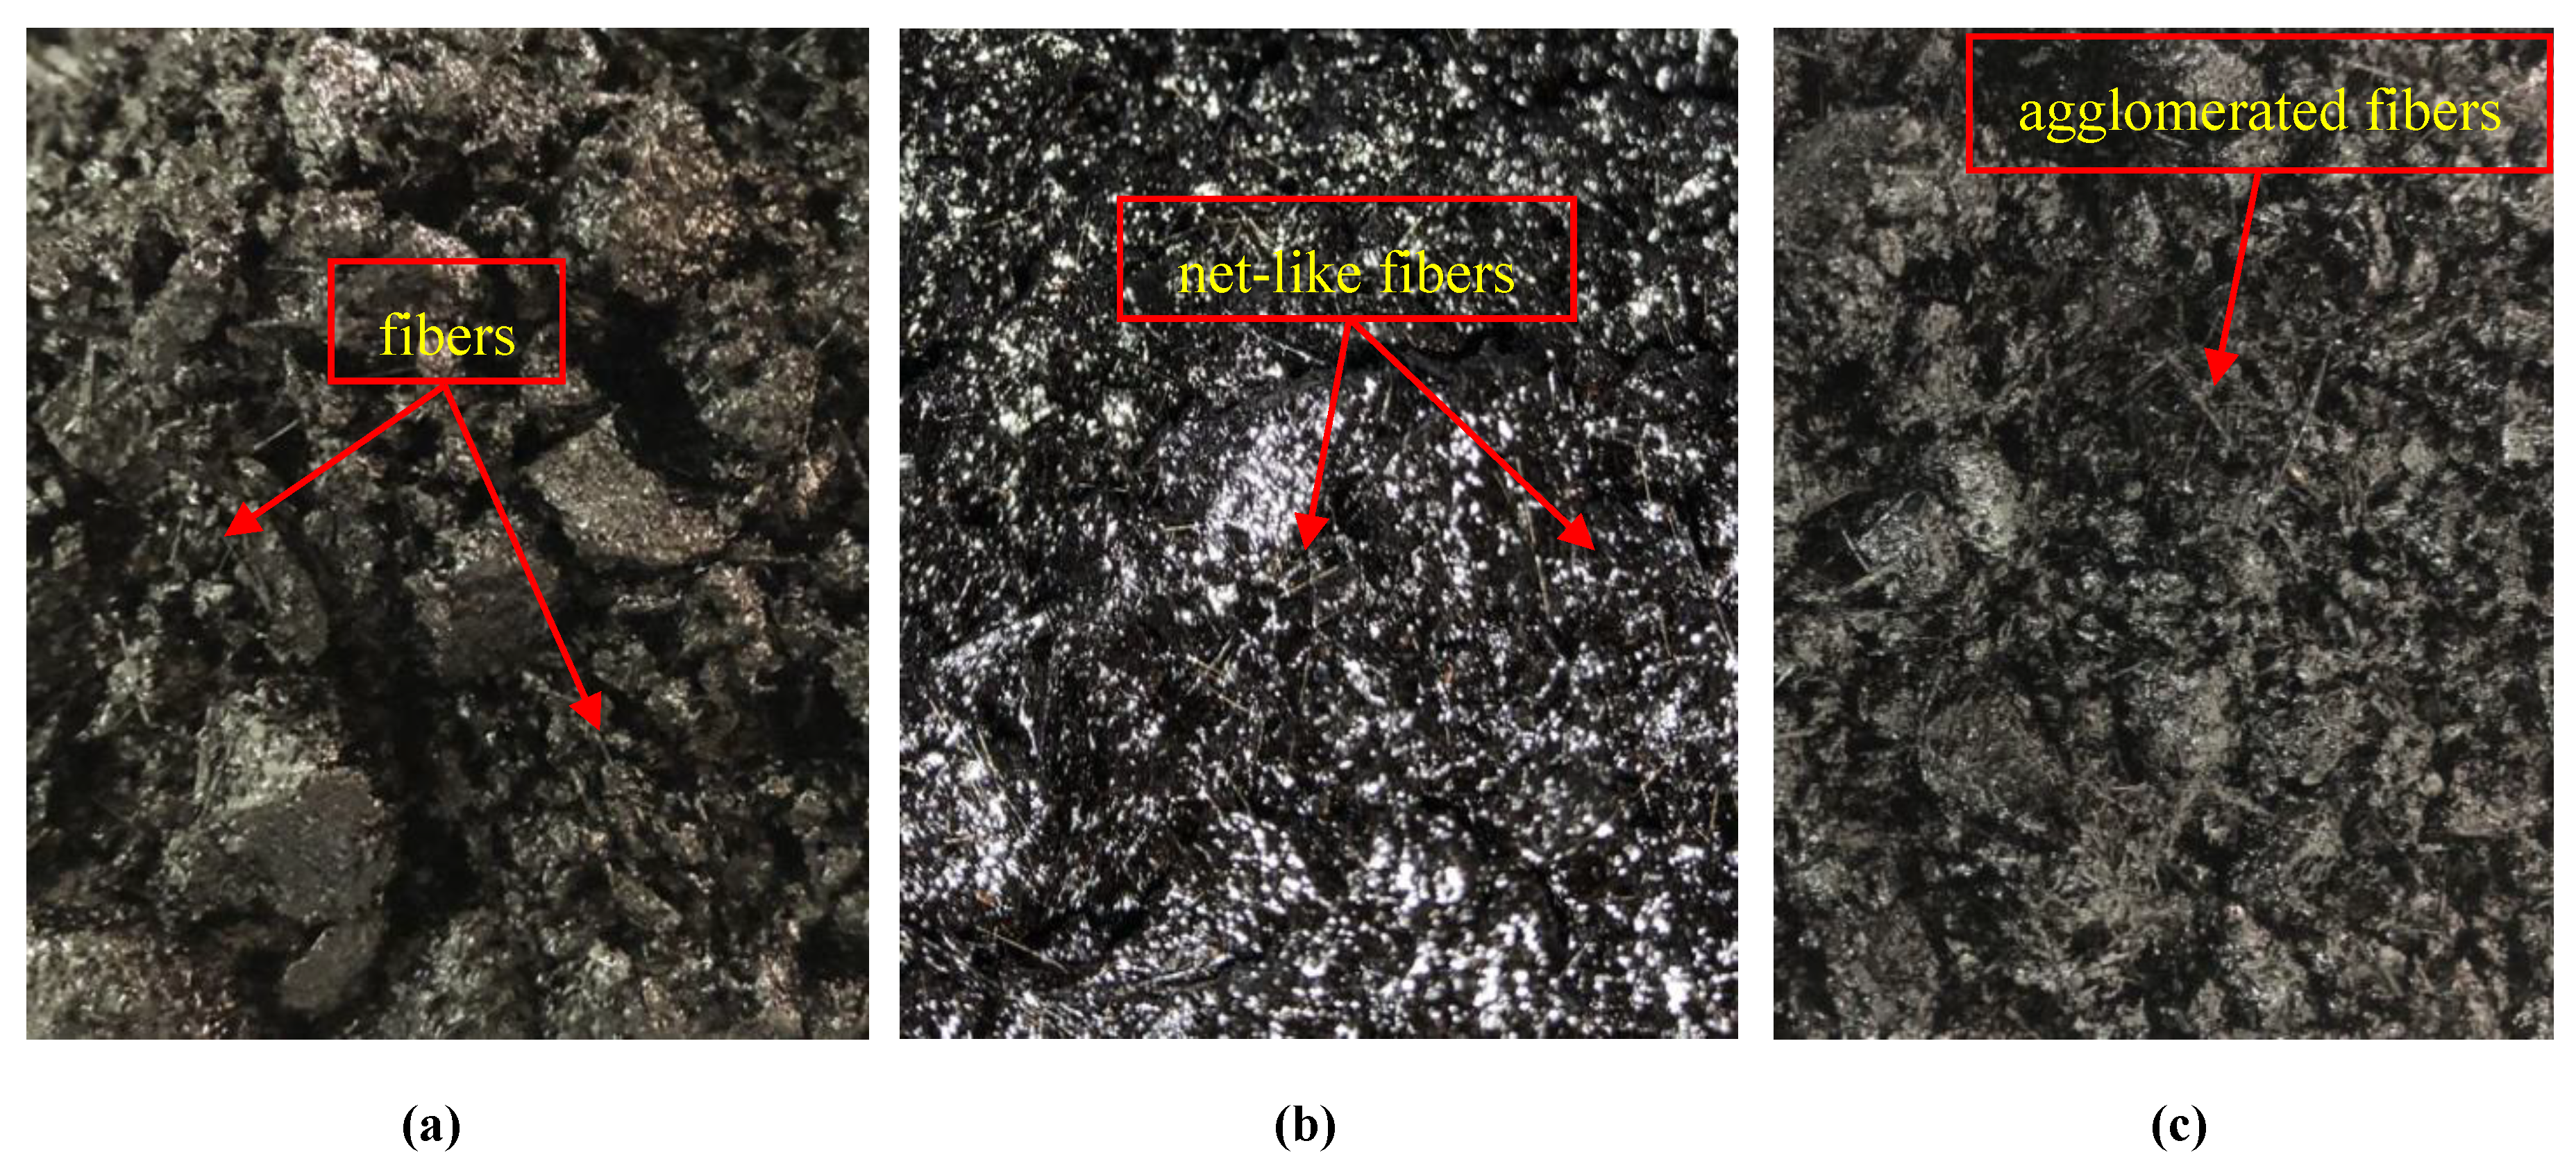
- A large number of fibers distributed randomly in three dimensions and evenly formed net-like structures in the mixture, which inhibited the appearance and propagation of cracks, as shown in Figure 8. The healing of cracks of asphalt pavement by themselves is enhanced and the occurrence of cracks is postponed. The reinforced role is similar to the traditional mortar mixed with short straws;
- With the mixture fiber content increasing, the aforesaid reinforced action will be more frequent and the fatigue life will be improved; and
- It also can be seen from Figure 8c, when the amount of fiber is excessive (above the optimum content), the redundant “free fibers” will appear in the mixture. Those “free fibers” even agglomerate somewhere. These “free fibers” and agglomerated fibers will weaken the cohesion between the asphalt and aggregate. It leads to a decrease of the fatigue life of the mixture.
5. The Fatigue Model of Fiber Reinforced Asphalt Mixture
According to the trial results, it was found that the strain and fiber content have a significant impact on the fatigue properties of the asphalt mixture by using statistical analysis of variance (ANOVA). Besides, the volume parameter, VFA, can also influence the fatigue properties of the asphalt mixture. However, the common fatigue models of asphalt mixture do not reflect the influence of fibers on the fatigue life. There exists an optimum fiber content (OFC) in the asphalt mixture from the above analysis. Therefore, a variable, (1 + 2OFC⋅FC − FC2), which can reflect the influence of the fiber on the fatigue life, is introduced. Based on Equation (5), a new fiber reinforced asphalt mixture fatigue equation is developed and characterized by Equation (7). The new model reflected the impact of the strain of loading, initial flexural stiffness of mixture, volumetric parameters, VFA, and the fiber content on the fatigue life. By fitting all the test data in this study by multiple nonlinear regressions, the regression coefficients, R2, are showed in Table 6. According to the test data, the results of Equations (3) and (5) after fitting are shown in Table 6.
where, Nf is the fatigue life; ɛt is the applied tensile strain; S0 is the mixture initial flexural stiffness; VFA is voids filled with asphalt; FC is the fiber content; OFC is the optimum fiber content; and k1, k2, k3, k4, and k5 are experimental coefficients.
By comparing the correlation coefficient, R2, of each regression fatigue equation, it can be concluded that after introducing fiber content into the fatigue equation, the correlation coefficient, R2, increases from about 81.6% to 95.4%. Therefore, the accuracy of the model (Equation (7)) is significantly improved, which can also be seen from the F statistics in Table 6.
From the fatigue models above, it is shown that fatigue life decreases as the strain level and the initial stiffness increase. The fatigue life increases with VFA increasing. It means that increasing the asphalt content and/or reducing air voids would increase the fatigue life. For the fiber content, when the content is less than the optimum fiber content, increasing the fiber content will also lead to an increase of the fatigue life. However, when the fiber content is above the optimum content level, the fatigue life will decline as the fiber content increases.
6. Conclusions
By comparing the fatigue test results of the mixture with and without PAN fibers, it was shown that the sensitivity of the fatigue life of the mixture to the strain was decreased significantly after adding fiber. Therefore, adding a proper content PAN fiber in asphalt mixture can significantly improve the anti-fatigue properties. At the same fiber content, the fatigue performance of the mixture was been improved and the fatigue sensitivity declined with an increasing asphalt content. The effect of the fiber content on the fatigue life at a low strain level was more obvious than that in the high strain level.
From a comparison of the asphalt mixture fatigue life with different fiber contents, it was obvious that reinforced asphalt mixture has an optimum fiber content. When the fiber content was less than the optimum fiber content, the fatigue life increased with the fiber content increasing. Once the fiber content exceeded its optimum level, the fatigue life deceased with the fiber content increasing.
By introducing a new variable that can reflect the effects of fiber on the fatigue life, a new fatigue model of fiber reinforced asphalt mixture was generated. Its accuracy has been improved significantly compared to other earlier models. Meanwhile, the model can preferably reveal the effect of the fiber content, strain level, initial stiffness, and VFA on the fatigue life. Fatigue life decreased as the strain level and the stiffness increased, while it increased as VFA increased. For the fiber content, when the content is less than the optimum fiber content, increasing the fiber content will improve the fatigue life; and while over the optimum content, increasing the fiber content will compromise the fatigue life.
Author Contributions
H.W. designed the experiment and wrote manuscript; Z.Y. and S.Z. conducted experiments and wrote manuscript; L.D. and K.J. helped analyzing experimental data.
Funding
This research was funded by “the National Natural Science Foundation of China, grant number 51478052”, and “Hunan Transportation Department, grant number 201302”, and “Guangdong Transportation Department, grant number 2013-01-002”.
Conflicts of Interest
The authors declare no conflict of interest.
References
- Pronk, A.C. Comparison of 2 and 4 point fatigue tests and healing in a 4 point dynamic bending test based on the dissipated energy concept. In Proceedings of the 8th International Conference on Asphalt Pavements, Seattle, DC, USA, 10–14 August 1997; pp. 986–994. [Google Scholar]
- Zheng, J.; Zhou, Z.; Zhang, Q. Design Theory and Methodology for Reducing Asphalt Pavement Cracks; People Communications Press: Beijing, China, 2003; ISBN 7-114-045913. [Google Scholar]
- Chen, X.; Li, N.; Hu, C.; Zhang, Z. Mechanical performance of fibers-reinforced asphalt mixture. J. Chang. Univ. (Nat. Sci. Ed.) 2004, 24, 1–6. [Google Scholar]
- Reed, B.F.; James, L.B. Polyester fibers in asphalt paving mixtures. AAPT 1996, 65, 387–409. [Google Scholar]
- Chen, H.; Xu, Q. Experimental study of fibers in stabilizing and reinforcing asphalt binder. Fuel 2010, 89, 1616–1622. [Google Scholar] [CrossRef]
- Ge, Z.; Wang, H.; Zhang, Q.; Xiong, C. Glass fiber reinforced asphalt membrane for interlayer bonding between asphalt overlay and concrete pavement. Constr. Build. Mater. 2015, 101, 918–925. [Google Scholar] [CrossRef]
- Kim, M.-J.; Kim, S.; Yoo, D.-Y.; Shin, H.-O. Enhancing mechanical properties of asphalt concrete using synthetic fibers. Constr. Build. Mater. 2018, 178, 233–243. [Google Scholar] [CrossRef]
- Xiang, Y.; Xie, Y.; Long, G. Effect of basalt fiber surface silane coupling agent coating on fiber-reinforced asphalt From macro-mechanical performance to micro-interfacial mechanism. Constr. Build. Mater. 2018, 179, 107–116. [Google Scholar] [CrossRef]
- Morea, F.; Zerbino, R. Improvement of asphalt mixture performance with glass macro-fibers. Constr. Build. Mater. 2018, 164, 113–120. [Google Scholar] [CrossRef]
- Klinsky, L.M.G.; Kaloush, K.E.; Faria, V.C.; Bardini, V.S.S. Performance characteristics of fiber modified hot mix asphalt. Constr. Build. Mater. 2018, 176, 747–752. [Google Scholar] [CrossRef]
- Sheng, Y.; Zhang, B.; Yan, Y.; Chen, H.; Xiong, R.; Geng, J. Effects of phosphorus slag powder and polyester fiber on performance characteristics of asphalt binders and resultant mixtures. Constr. Build. Mater. 2017, 141, 289–295. [Google Scholar] [CrossRef]
- Davar, A.; Tanzadeh, J.; Fadaee, O. Experimental evaluation of the basalt fibers and diatomite powder compound on enhanced fatigue life and tensile strength of hot mix asphalt at low temperatures. Constr. Build. Mater. 2017, 153, 238–246. [Google Scholar] [CrossRef]
- Dehghan, Z.; Modarres, A. Evaluating the fatigue properties of hot mix asphalt reinforced by recycled PET fibers using 4-point bending test. Constr. Build. Mater. 2017, 139, 384–393. [Google Scholar] [CrossRef]
- Badeli, S.; Carter, A.; Doré, G.; Saliani, S. Evaluation of the durability and the performance of an asphalt mix involving Aramid Pulp Fiber (APF) Complex modulus before and after freeze-thaw cycles, fatigue, and TSRST tests. Constr. Build. Mater. 2018, 174, 60–71. [Google Scholar] [CrossRef]
- Brovelli, C.; Crispino, M.; Pais, J.C.; Pereira, P.A.A. Assessment of Fatigue Resistance of Additivated Asphalt Concrete Incorporating Fibers and Polymers. J. Mater. Civ. Eng. 2014, 26, 554–558. [Google Scholar] [CrossRef] [Green Version]
- Guo, Q.; Li, L.; Cheng, Y.; Jiao, Y.; Xu, C. Laboratory evaluation on performance of diatomite and glass fiber compound modified asphalt mixture. Mater. Des. 2015, 66, 51–59. [Google Scholar] [CrossRef]
- Monismith, C.L.; Deacon, J.A. Fatigue of asphalt paving mixtures. Transp. Eng. J. 1969, 95, 317–346. [Google Scholar]
- Strategic Highway Research Program (SHRP). Fatigue Response of Asphalt-Aggregate Mixes; SHRP-A-404; National Research Council: Washington, DC, USA, 1994. [Google Scholar]
- Hajj, E.Y.; Sebaaly, P.E.; Weitzel, D. Fatigue characteristics of Superpave and Hveem mixtures. J. Transp. Eng. 2005, 131, 302–310. [Google Scholar] [CrossRef]
- Shen, S.; Carpenter, S.H. Application of the dissipated energy concept in fatigue endurance limit testing. J. Transp. Res. Board 2005, 1929, 165–173. [Google Scholar] [CrossRef]
- Ge, Z.; Huang, X. Study on asphalt mixtures fatigue properties by testing. J. Traffic Transp. Eng. 2002, 2, 34–37. [Google Scholar]
- Monismith, C.L.; Epps, J.A.; Finn, F.N. Improved asphalt mix design. J. Assoc. Asphalt Paving Technol. 1985, 54, 347–391. [Google Scholar]
- Pell, P.S.; Cooper, K.E. The effect of testing and mix variables on the fatigue performance of bituminous materials. J. Assoc. Asphalt Paving Technol. 1975, 44, 1–37. [Google Scholar]
- JTG F40-2004. In The Chinese Technical Specifications for Construction of Highway Asphalt Pavements; Renmin Communication Press: Beijing, China, 2004.
- JTG E20-2011. In The Chinese Standard Test Methods of Bitumen and Bituminous Mixtures for Highway Engineering; Renmin Communication Press: Beijing, China, 2011.
Figure 1.
AC-16 aggregate gradation curve.

Figure 2.
View of PAN fiber.

Figure 3.
Beam-shaped specimens prepared for the fatigue test.

Figure 4.
Fatigue test.

Figure 5.
Relationship between flexural strain and fatigue life (%AC is asphalt content in figure). (a) Without fiber; (b) 0.15% fiber content; (c) 0.30% fiber content; and (d) 0.45% fiber content.
Figure 5.
Relationship between flexural strain and fatigue life (%AC is asphalt content in figure). (a) Without fiber; (b) 0.15% fiber content; (c) 0.30% fiber content; and (d) 0.45% fiber content.


Figure 6.
Fatigue properties. (a) Different asphalt contents at 0.3% fiber content; (b) different fiber contents at the optimum asphalt content.
Figure 6.
Fatigue properties. (a) Different asphalt contents at 0.3% fiber content; (b) different fiber contents at the optimum asphalt content.


Figure 7.
Effect of fiber content on fatigue life at the same strain level.

Figure 8.
Distribution pattern of the fiber in the asphalt mixture. (a) 0.15% fiber content; (b) 0.3% fiber content; and (c) 0.45% fiber content.
Figure 8.
Distribution pattern of the fiber in the asphalt mixture. (a) 0.15% fiber content; (b) 0.3% fiber content; and (c) 0.45% fiber content.


Table 1.
Basic physical properties of the aggregate.
| Test Items | Los Angeles Abrasion (%) | Soundness (%) | Elongated and Flat Particles (%) | Water Absorption (%) | Apparent Specific Gravity |
|---|---|---|---|---|---|
| results | 17 | 1.4 | 8.2 | 1.27 | 2.741 |
Table 2.
Basic physical properties of the asphalt.
| Test Items | Penetration (25 °C, 0.1 mm) | Ductility (15 °C, cm) | Softening Point (°C) | Penetration Index | Viscosity at 60 °C (Pa.s) | Flash Point (°C) |
|---|---|---|---|---|---|---|
| results | 65 | >100 | 48 | −0.24 | 271 | 269 |
Table 3.
The properties of PAN fiber.
| Test Items | Diameter (μm) | Length (mm) | Tensile Strength (MPa) | Percentage of Max. Extend (%) | Initial Modulus (MPa) | Density (g/cm3) | Section Shape |
|---|---|---|---|---|---|---|---|
| results | 13 | 6 | >910 | 8–12 | 17100 | 1.18 | peanut |
Table 4.
Results of all of AC-16 mixtures at the optimum asphalt content (OAC) based on the Marshall method.
Table 4.
Results of all of AC-16 mixtures at the optimum asphalt content (OAC) based on the Marshall method.
| PAN Fiber Content by Weight (%) | OAC (%) | Air Voids (%) | VMA (%) | VFA (%) | Stability (kN) | Flow (0.1 mm) |
|---|---|---|---|---|---|---|
| 0 | 4.9 | 4.1 | 14.2 | 71.1 | 10.4 | 28.7 |
| 0.15 | 5.0 | 3.9 | 13.9 | 71.9 | 12.7 | 32.1 |
| 0.30 | 5.1 | 4.0 | 14.1 | 71.6 | 13.6 | 30.5 |
| 0.45 | 5.3 | 4.2 | 14.1 | 70.2 | 14.2 | 35.9 |
Table 5.
Test results of volumetric parameters and fatigue coefficients.
| Fiber Content (%) | Asphalt Content (%) | Volumetric Parameters | Strain Range (µε) | Fatigue Coefficients 1 | R2 (%) | |||
|---|---|---|---|---|---|---|---|---|
| Air Void (%) | VMA (%) | VFA (%) | ||||||
| k1 | k2 | |||||||
| 0 | 4.4 | 7.2 | 16.5 | 56.4 | 600–1500 | 0.021 | 2.236 | 99.4 |
| 4.9 | 6.9 | 17.9 | 61.5 | 600–1500 | 0.002 | 2.517 | 92.9 | |
| 5.4 | 7.5 | 16.6 | 54.9 | 600–1500 | 0.016 | 2.405 | 95.6 | |
| 0.15 | 4.5 | 6.8 | 17.9 | 62.1 | 600–2500 | 1.034 | 1.530 | 96.8 |
| 5 | 7.1 | 18.0 | 60.6 | 600–2500 | 0.323 | 1.861 | 98.7 | |
| 5.5 | 6.5 | 18.7 | 65.3 | 600–2500 | 0.636 | 1.760 | 93.5 | |
| 0.3 | 4.6 | 6.9 | 18.4 | 62.5 | 600–2500 | 0.833 | 1.736 | 97.3 |
| 5.1 | 6.7 | 18.8 | 64.3 | 600–2500 | 0.271 | 1.805 | 95.4 | |
| 5.6 | 7.4 | 18.0 | 59 | 600–2500 | 0.790 | 1.879 | 98.1 | |
| 0.45 | 4.8 | 7.2 | 17.0 | 57.7 | 600–2500 | 0.814 | 1.901 | 93.9 |
| 5.3 | 6.9 | 17.5 | 60.5 | 600–2500 | 1.952 | 1.648 | 95.3 | |
| 5.8 | 6.4 | 18.5 | 65.4 | 600–2500 | 1.039 | 1.812 | 96.2 | |
1 Fatigue coefficients, k1 and k2, are determined by Equation (1).
Table 6.
Regression coefficients and statistical parameters of fatigue equations.
| Fatigue Equations | k1 | k2 | k3 | k4 | k5 | R2 (%) | F Statistic |
|---|---|---|---|---|---|---|---|
| 5.437 × 10⁻⁴ | 1.746 | 1.032 | 2.968 | 9.931 | 95.4 | 254.92 | |
| 0.6355 | 1.369 | 1.216 | 3.200 | - | 81.6 | 113.73 | |
| 8.563 × 10⁶ | 1.598 | 2.164 | - | - | 76.5 | 76.49 |
© 2018 by the authors. Licensee MDPI, Basel, Switzerland. This article is an open access article distributed under the terms and conditions of the Creative Commons Attribution (CC BY) license (http://creativecommons.org/licenses/by/4.0/).
Share and Cite
MDPI and ACS Style
Wang, H.; Yang, Z.; Zhan, S.; Ding, L.; Jin, K. Fatigue Performance and Model of Polyacrylonitrile Fiber Reinforced Asphalt Mixture. Appl. Sci. 2018, 8, 1818. https://0-doi-org.brum.beds.ac.uk/10.3390/app8101818
AMA Style
Wang H, Yang Z, Zhan S, Ding L, Jin K. Fatigue Performance and Model of Polyacrylonitrile Fiber Reinforced Asphalt Mixture. Applied Sciences. 2018; 8(10):1818. https://0-doi-org.brum.beds.ac.uk/10.3390/app8101818
Chicago/Turabian StyleWang, Hui, Zhen Yang, Shihao Zhan, Lei Ding, and Ke Jin. 2018. "Fatigue Performance and Model of Polyacrylonitrile Fiber Reinforced Asphalt Mixture" Applied Sciences 8, no. 10: 1818. https://0-doi-org.brum.beds.ac.uk/10.3390/app8101818
Note that from the first issue of 2016, this journal uses article numbers instead of page numbers. See further details here.