Effect of Carrier Localization on Recombination Processes and Efficiency of InGaN-Based LEDs Operating in the “Green Gap”


STR Group—Soft-Impact, Ltd., P.O. Box 83, 27 Engels Ave., 194156 St. Petersburg, Russia
Appl. Sci. 2018, 8(5), 818; https://0-doi-org.brum.beds.ac.uk/10.3390/app8050818
Submission received: 16 March 2018
/
Revised: 3 May 2018
/
Accepted: 17 May 2018
/
Published: 18 May 2018
(This article belongs to the Special Issue Highly Efficient UV and Visible Light Sources)
Abstract
:A semi-empirical model of carrier recombination accounting for hole localization by composition fluctuations in InGaN alloys is extended to polar and nonpolar quantum-well structures. The model provides quantitative agreement with available data on wavelength-dependent radiative and Auger recombination coefficients in polar LEDs. Comparison of calculated internal quantum efficiencies of polar and nonpolar LEDs enables an assessment of the roles of carrier localization, quantum-confined Stark effect, and native material properties for the efficiency decline in the “green gap”.
1. Introduction
Recent progress in growth and fabrication technology has enabled the demonstration of InGaN-based light-emitting diodes (LEDs) with maximum external quantum efficiency (EQE) over ~80% in the violet-blue spectral range [1,2]. Currently, such LEDs still suffer from the efficiency droop, i.e., substantial non-thermal efficiency reduction at high operating currents mainly attributed to non-radiative Auger recombination in InGaN active regions. The history of studying the efficiency droop, identifying its dominant mechanisms, and searching for effective approaches for the droop reduction have been discussed in recent reviews [3,4,5,6]. One more problem limiting the performance of InGaN-based LEDs is the so called “green gap”, i.e., substantial EQE decline with the emission wavelength from blue (~430–440 nm) towards the green/yellow (~500–600 nm) spectral range. Indeed, the maximum EQE values of LEDs operating in the green, ~40–50% [7,8], and yellow, ~20% [9], spectral ranges are remarkably lower than that in the violet/blue one, which cannot be attributed to insufficient light extraction from the LED dice [10]. In addition, a remarkable increase in the threshold current density and decrease in the wall-plug efficiency of InGaN-based laser diodes is also observed in the same spectral range [11,12]. These “green gap” manifestations in both LEDs and laser diodes imply their common nature, pointing to some internal processes in the InGaN active regions.
A natural explanation for the “green gap” attributes the decline of LED internal quantum efficiency (IQE) to crystal quality degradation in InGaN quantum wells (QWs) with high InN molar fractions (see, e.g., [13]). The degradation may occur by either extended or point defect generation. In particular, a higher InN molar fraction necessary for long-wavelength emission produces a larger lattice constant mismatch between InGaN and the rest of the LED structure. In turn, the mismatch may evoke stress relaxation in InGaN QWs accompanied by misfit dislocation formation, if the well thickness exceeds its critical value. Estimation of the (0001)InGaN/GaN critical thickness shows that it only becomes comparable with typical QW widths in the green/yellow spectral range [14]. Point defect generation and parasitic impurity incorporation are also expected to be enhanced at high InN fractions because of the lower growth temperatures normally used for increasing the indium content in InGaN QWs [15].
The impact of crystal quality on non-radiative carrier recombination in InGaN QWs can be assessed by analyzing the Shockley-Read-Hall (SRH) recombination coefficient A introduced by the empirical ABC-model. The model considers carrier recombination in InGaN QWs to occur via three main channels: SRH defect-mediated recombination with the recombination coefficient A, radiative recombination with the coefficient B, and Auger recombination with the coefficient C. According to the original model of SRH recombination [16], its rate is proportional to the concentration of non-radiative centers. In addition, the value of A has also been found to correlate with the density of threading dislocations frequently controlling the rate of non-radiative recombination in nitride semiconductors [17].
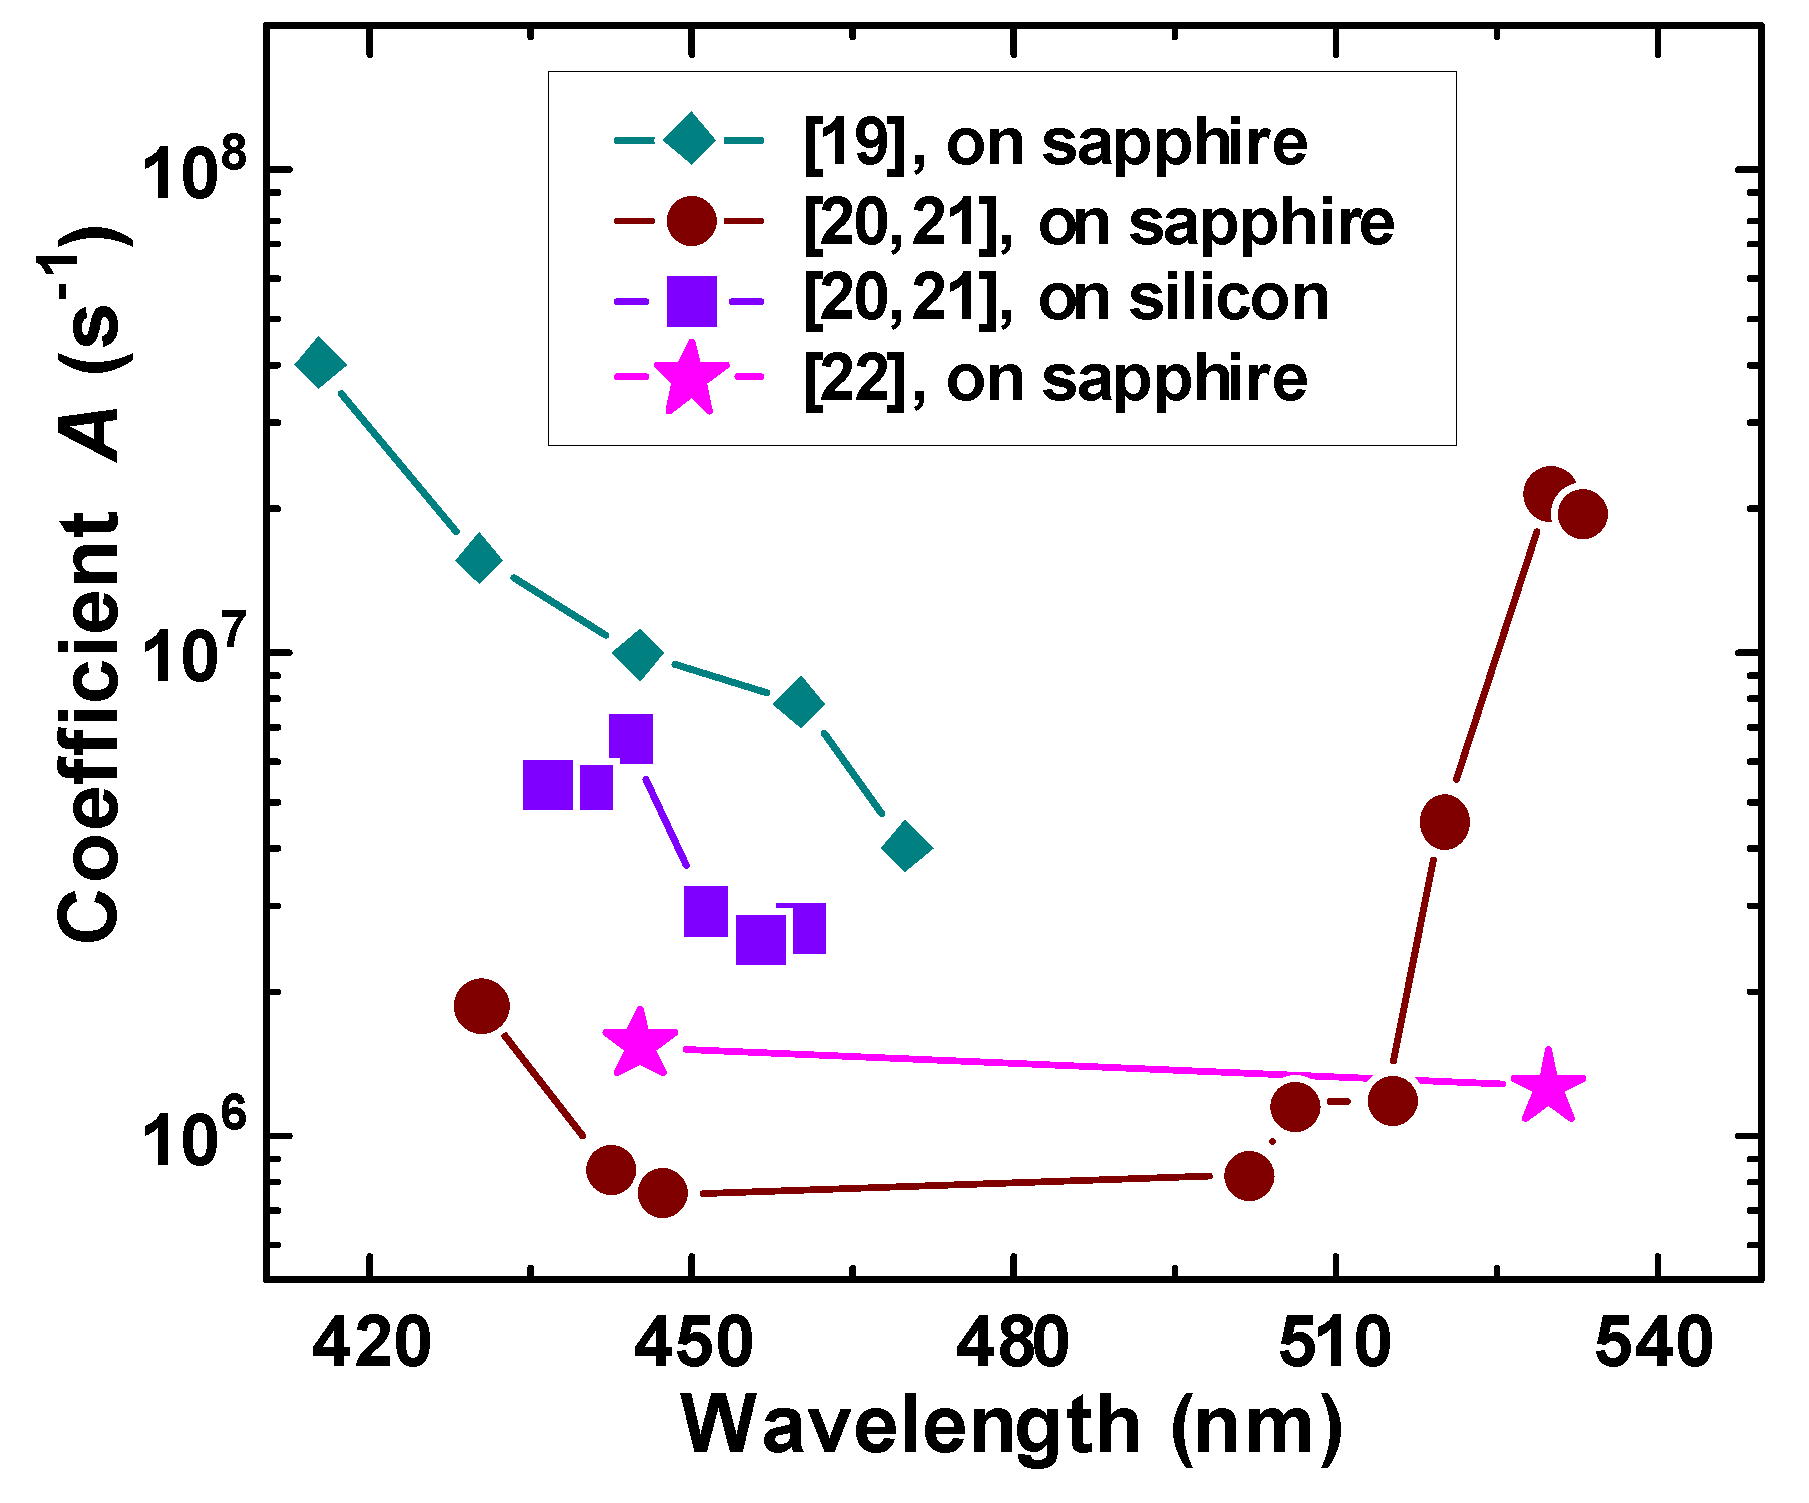
Generally, the recombination coefficients (RCs) can be estimated from coupled measurements of LED efficiency and differential carrier lifetime [18,19,20,21,22,23] as a function of operating current. Figure 1 summarizes the available data on the wavelength-dependent SRH recombination coefficient A. Despite a big difference in the measurements, one can see a reproducible decrease of the A-coefficient at λ = 420–450 nm, which is beyond the “green gap”. At longer wavelengths, 450–515 nm, where the “green gap” behavior of LED efficiency is already pronounced, the measured A-coefficients are practically independent of the wavelength. This is evidence for the fact that crystal quality degradation is not the major reason for the efficiency decline in the “green gap”. Only a dramatic rise in the A-coefficient observed in [20,21] at λ > 515 nm may be attributed to intensive defect generation. On the other hand, the spectral range of the wavelength-independent A-coefficient is shown in [22] to be extended up to λ = 540 nm.
David et al. [24] argued that A-coefficient cannot be regarded as a measure of defect density in InGaN QWs because of its dependence on the overlap of the electron and hole wave functions. Using the experimental correlation of A-coefficient with the overlap integral from [24] and calculating the overlap integral for a typical QW width of 3 nm, the A-coefficient was predicted to decrease no greater than by a factor of 1.4 in the spectral range from 435 to 530 nm. Such a gradual variation is negligible compared to the changes in the A-coefficient actually observed at the wavelengths longer than 515 nm and shorter than 440 nm (Figure 1). So, the impact of the electron and hole wave function overlap can be disregarded while discussing the influence of defect density on the SRH recombination coefficient.
Another commonly accepted explanation associates the LED efficiency decline in the “green gap” with the spatial separation of electron and hole wave functions in (0001)InGaN QWs caused by polarization fields, increasing with the indium molar fraction in the alloys (see, e.g., [25]). The separation, also known as the quantum-confined Stark effect (QCSE), is expected to lower the radiative recombination coefficient (RRC) B. In addition, a substantial rise in the Auger recombination rate with the polarization field is predicted theoretically in [26]. Both factors should lower the LED efficiency at longer wavelengths. In order to overcome the negative impact of polarization fields, the use of nonpolar and semipolar crystal orientations for LED fabrication has been suggested (see, e.g., [27]). Resulting, in particular, in the development of blue LEDs with extremely low efficiency droop [28], this idea did not come into action in full measure for the “green gap”. Indeed, the comparison of numerous data on polar and nonpolar/semipolar LEDs, including those grown on native GaN substrates, demonstrated no remarkable difference between the slopes of the “green gap” efficiency decline in polar and nonpolar/semipolar LEDs in contrary to natural expectations [29]. Therefore, the built-in polarization field in the polar LED structures cannot be considered alone as the principal factor responsible for the “green gap”, similar to the degradation of InGaN crystal quality.
Recently, implication of carrier localization caused by composition fluctuations in InGaN alloys into the “green gap” problem has been demonstrated by atomistic simulations [30] and a simple semi-empirical model [22,31]. The atomistic approach [30] considered the reduction in RRC caused by the spatially uncorrelated localization of electrons and holes inside a polar InGaN QW. Borrowing other RCs from experiment [20,21], the authors of [30] attributed ~70% of the LED efficiency decline to QCSE and ~30% to the effect of uncorrelated electron and hole localization. The semi-empirical model developed for bulk InGaN alloys reproduced qualitatively well the experimental wavelength dependence of both RRC and the Auger recombination coefficient (ARC) from [20,21], and qualitatively explained the anomalous rise in RRC with temperature reported in [22] but failed in the prediction of the absolute values of these RCs [31]. The latter fact was attributed to neglecting QCSE in polar QW-based LED structures. So, the relative roles of QCSE and carrier localization for InGaN-based LEDs still remain unclear despite the practical importance of this assessment.
It should be noted that the idea of uncorrelated (independent) carrier localization in polar InGaN QWs was suggested for the first time in earlier work by Morel et al. [32], based on a universal non-exponential decay of time-resolved photoluminescence (PL) at low, <10 K, temperatures. A strong carrier localization assumed from the data analysis in [32] was attributed to fluctuations of either InGaN composition or QW width.
Another earlier study [33] considered low-temperature PL from quasi-bulk (50–100 nm) very-diluted (0.4–2.0% of In) InGaN layers sandwiched between thick GaN claddings. Observation of distinct fine structures in the emission spectra enabled the authors of [33] to associate the observed peaks with clusters containing two or three neighboring In atoms capable of capturing holes. The localization energies of holes in the above clusters estimated from the emission peak positions were about 35–50 meV and about 65–80 meV, respectively, whereas no evidence for electron localization was found in [33]. These data demonstrated that (i) composition fluctuations in InGaN alloys are a factor largely responsible for hole localization and (ii) the hole localization has an atomistic character.
The atomistic nature of hole localization has also been demonstrated theoretically in [34,35]. Here, the electronic structure of cubic InGaN alloys was calculated by using the pseudopotential supercell technique. Despite the absence of electronic states in the energy gap, strong resonant localization of holes by the In–N–In–N–In atomic chains was predicted, so that the chains played a role of deep acceptors. The hole wave functions were found to be highly anisotropic with a specific size of about 0.7 nm obtained by averaging over all directions for In0.2Ga0.8N alloys. No electron localization was identified in the study. Additional simulations of spherical In0.76Ga0.24N/In0.33Ga0.67N quantum dots 2.8 nm in diameter have shown that hole localization is insensitive to the quantum-confining potential formed in the quantum dot, but occurs at a dot corner due to a local strain [35].
Important data on the hole localization by composition fluctuations in AlGaN alloys have been reported in [36]. In this paper, real composition fluctuations in bulk Al0.25Ga0.75N and a GaN/AlGaN QW grown by metalorganic vapor phase epitaxy were restored by atomic-probe tomography by making necessary statistical corrections. Then, the obtained composition profiles were used in quantum-mechanical simulations of the conduction and valence band profiles perturbed by fluctuations and, finally, the emission spectra of the Al0.25Ga0.75N alloy and GaN/AlGaN QW were calculated, providing good agreement with the measured spectra. Based on the above data, the localization radius of holes of about 0.9–1.5 nm and the respective localization energies of about 40–60 meV were estimated. Though these results are relevant to AlGaN alloys, they clearly indicate that the hole localization by composition fluctuations occurs on an atomic scale and provides rather high localization energies.
The study reported in this paper is aimed at better understanding the role of QCSE, carrier localization, and other factors for efficiency limitation of the LEDs emitting in the “green gap” spectral range. For this purpose, the semi-empirical approach [31] is extended to polar and nonpolar InGaN QWs. RRC and ARC predicted by the extended model will be shown to agree quantitatively with the data of [20,21] obtained for polar LEDs. Calculation of theoretical wavelength-dependent internal quantum efficiencies (IQEs) of polar and nonpolar LEDs based on these RCs and their comparison with each other enables an assessment of the roles of QCSE and carrier localization in the “green gap” efficiency decline. The results obtained by the new model are also compared with other theories suggested previously for RRC and ARC.
2. Model
As previously presented in [31], holes are assumed to be localized by composition fluctuations somewhere inside an InGaN QW having the width d. The localization is regarded as strong enough, so that holes do not “feel” the confining potential of the QW, similar to the case of quantum dot examined in [35]. This allows the use of a dummy hole wave function,
resembling the three-dimensional hydrogen-like one used in [31]. Here, ρ is the in-plane radius-vector, z is the coordinate normal to QW interfaces and directed along the (0001) axis of the crystal in the case of a polar LED, uhh is the heavy-hole Bloch function, a is the localization radius assumed for simplicity to be the same for lateral and normal directions, and z0 (0 ≤ z0 ≤ d) is the hole localization point inside the QW (due to translational symmetry, the lateral position of the localized hole can be chosen at ρ = 0).
Two-dimensional electrons, assumed to be incapable of capturing by composition fluctuations due to a rather light effective mass, have the wave function:
where, ue and ψ(z) are the Bloch and the envelope wave functions of the electron, respectively, having the normalization width ; S is the plane-wave normalization area; and k is the in-plane wave vector of the electron. The assumption that the localized hole does not “feel” the confinement potential of the InGaN QW requires a to be much less than d. In this case, the electron envelope function ψ(z) varies slightly inside the region of hole localization.
2.1. Radiative Recombination Coefficient
In order to calculate the optical matrix element Meh, the envelope function ψ(z) is approximated by the first two terms of its Taylor series in the vicinity of z0. Due to the even symmetry of the hole wave function, the second term does not contribute to the matrix element, giving:
where Pt is the Kane’s matrix element coupled S-like electron Bloch function ue with X(Y)-like hole Bloch function uhh (see, e.g., [37]). Expression (3) is valid, if . The accuracy of the above expression may be further improved by accounting for an additional (third) term in the Taylor series expansion of the electron envelope function. This results in substituting ψ(z0) with ψ(z0) + a2ψ″(z0) in Equation (3), where ψ″ is the second derivative of the electron envelope wave function. In this case, the model applicability becomes determined by a less strict inequality: .
A conventional procedure has been applied to calculate RRC, which is similar to that applied to free electron/acceptor recombination without the k-selection rule [38,39]. First, using the Fermi’s Golden Rule and accounting for the equilibrium photon population, the recombination rate of a localized hole with electrons in all the allowed quantum states is found. Then, the recombination rate is averaged over all possible positions z0 of the localized hole inside the QW. Finally, dividing the above recombination rate by the electron concentration provides the RRC. Essential simplification can be achieved by substituting in the calculations the momentum-dependent electron kinetic energy (ħ is the Planck constant and me is the electron effective mass) with a mean electron energy Ee. This energy is equal to kT (k is the Boltzmann constant and T is temperature) in the case of non-degenerate electrons and nearly equal to ½Fn (Fn is the quasi-Fermi level position counted from the conduction band edge), if electrons are degenerate. In this case, the optical matrix element Meh defined by Equation (3) becomes momentum-independent and summation over all possible states of electrons in the QW can be reduced to their sheet concentration. As a result, the following analytical expression can be obtained for the sheet RRC:
Here, is the specific frequency of optical transitions, is the dimensionless energy factor, is the hole localization energy, α is the fine-structure constant, nr is the group refractive index, Eg is the InGaN energy gap, is the energy associated with the Kane’s matrix element Pt, m0 is the electron mass, c is the light velocity, and is the square of the electron envelope wave function averaged over all possible positions z0 of the localized hole. Using the material-dependent frequency νB provides compact expressions for the RRCs not only for the case considered above, but also for radiative processes with k-selection rules involving free electrons and holes in bulk materials and QWs [31].
Averaging of the magnitude of the electron wave function over possible positions of localized holes should account for their distribution function. At the high electric field F induced in a polar (0001)InGaN QW, i.e., at , all the holes are pushed to the bottom interface (z = 0); therefore, can be approximately substituted with . In contrast, at the low electric field inside the QW, i.e., at , the probability of hole localization is assumed to be uniformly distributed across the well, so that can be obtained numerically: . Here, the former and the latter way of averaging are applied to polar and nonpolar QWs, respectively.
2.2. Auger Recombination Coefficient
Following [40], the rate of Auger recombination of a localized hole and electron with the energy transfer to another electron is assumed to be equal to the rate of the electron energy loss via Coulomb collisions with other electrons. Therefore, sheet ARC: , where σ is the one-dimensional cross-section of the electron capture by localized hole, v is the electron velocity, nsh is the sheet electron density in InGaN QW, and I is the parameter proportional to the square of the overlap integral between the electron and hole wave functions. For two-dimensional electrons: , where is the energy relaxation time [41], and ED is the binding energy of a shallow donor in InGaN calculated within effective mass approximation. Estimating the overlap integral in a manner suggested in [40], , and accounting for the fact that the electron kinetic energy, , should be equal to the energy transferred from one electron to another, i.e., , one can derive the following expression for the sheet ARC:
Here, is the frequency of the Auger recombination typical for microscopic processes involving two electrons and a hole and . Equations (4) and (5) show that the ratio is practically independent of the hole localization radius at , like in the case of bulk InGaN alloys [31].
As soon, as the sheet RRC and ARC are found from Equations (4) and (5), the corresponding three-dimensional recombination coefficients B and C can be calculated by using the following relationships: and .
The above theory considers the microscopic mechanism of Auger recombination involving a localized hole and two free electrons in InGaN QW. Generally, there is an alternative recombination channel, involving two localized holes and a free electron. This recombination mechanism seems, however, to be substantially suppressed. Indeed, if holes are localized on different sites inside the QW, the overlap of their wave functions is extremely small due to a small localization radius originating from the atomistic character of localization. In contrary, probability of the hole localization on the same site is very low because of the hole Coulomb repulsion. The predicted dominance of the microscopic process with two electrons and a hole, as compared to the alternative one, correlates with the observations reported in [42].
2.3. Localization Energy
A key point of any theory considering composition fluctuations in a semiconductor alloy is finding a correlation between its composition and the capability of the alloy to localize either electrons or holes. A straightforward approach for ternary alloys, like InxGax−1N, implies selecting an averaging volume Va centered at the point with the radius-vector r, counting the number of atoms of a certain kind, e.g., those of In, contained in the volume, and then determining a local alloy composition x(r) as the ratio of the number of In atoms to the total number of all cations in the volume Va. At the next step, spatial variations of the conduction and valence band edges, EC(r) and EV(r), are determined using the obtained x(r) and known relationships between the alloy composition, its bandgap, and band offsets. Finally, Schrödinger equations are solved with EC(r) and EV(r) serving as the potential energy profiles for electrons and holes and confined states of the carriers are found, providing their localization energy. Such an approach has been used, in particular, in [36], where the composition fluctuations were evaluated experimentally using atomic probe tomography.
A pitfall of the above approach is the choice of the averaging volume. Indeed, in view of general statistical trends, larger Va results in lower relative composition fluctuations and, eventually, in a weaker carrier localization. In order to avoid the uncertainty in the choice of Va, the averaging volume should be found self-consistently with the solution of the Schrödinger equations in such a way as to nearly correspond to the volume occupied by a carrier wave function in the localized state. The above self-consistence exists ab initio in the method of optimal fluctuation (see [43] for a review of the method and relevant results), which predicts that the density of localized states g(E) vary with energy E counted from the edge of either the conduction or valence band towards the mid of the bandgap as with the localization energy:
where β is the rate of the corresponding band edge variation with the alloy composition x, meff is the carrier effective mass, and ncs is the concentration of cation sites in the crystal lattice. Expression (6) for the energy Et is valid if: (i) composition fluctuations have a thermodynamic character; (ii) they occur in an ideal alloy, i.e., that having negligible enthalpy of mixing; and (iii) the number of In atoms in the optimal fluctuation . Estimations show that the latter two assumptions are not satisfied in real InGaN compounds. First, the InGaN alloys are far from ideal, tending to phase separation due to a large lattice constant mismatch between InN and GaN. Second, the typical number of In atoms in the optimal fluctuation is about six to eight because of the atomistic character of hole localization. This makes the condition invalid. Therefore, Equation (6) is used in this study only as a general relationship between the localization energy EL and alloy composition x, whereas Et is regarded as a fitting parameter. A similar approach has been previously applied to the bulk InGaN alloys [31].
3. Results and Discussion
3.1. Recombination Coefficients
In order to compare the theory with the experiment, the data on wavelength-dependent RRCs and ARCs from [20] have been chosen as those providing the best correlation with independently estimated IQEs of state-of-the-art LEDs (see [10] for a summary of the reported efficiencies). These data were preliminarily refined to account for the wavelength dependence of light extraction efficiency [44] of the SQW LEDs studied in [20,21]. Here, the QW width d = 2.5 nm was found to best reproduce all experimental current densities at which the LEDs approached maximum IQE values. The points corresponding to the refined data for LED structures grown on sapphire and silicon substrates are plotted in Figure 2 and Figure 3 by circles and squares, respectively.
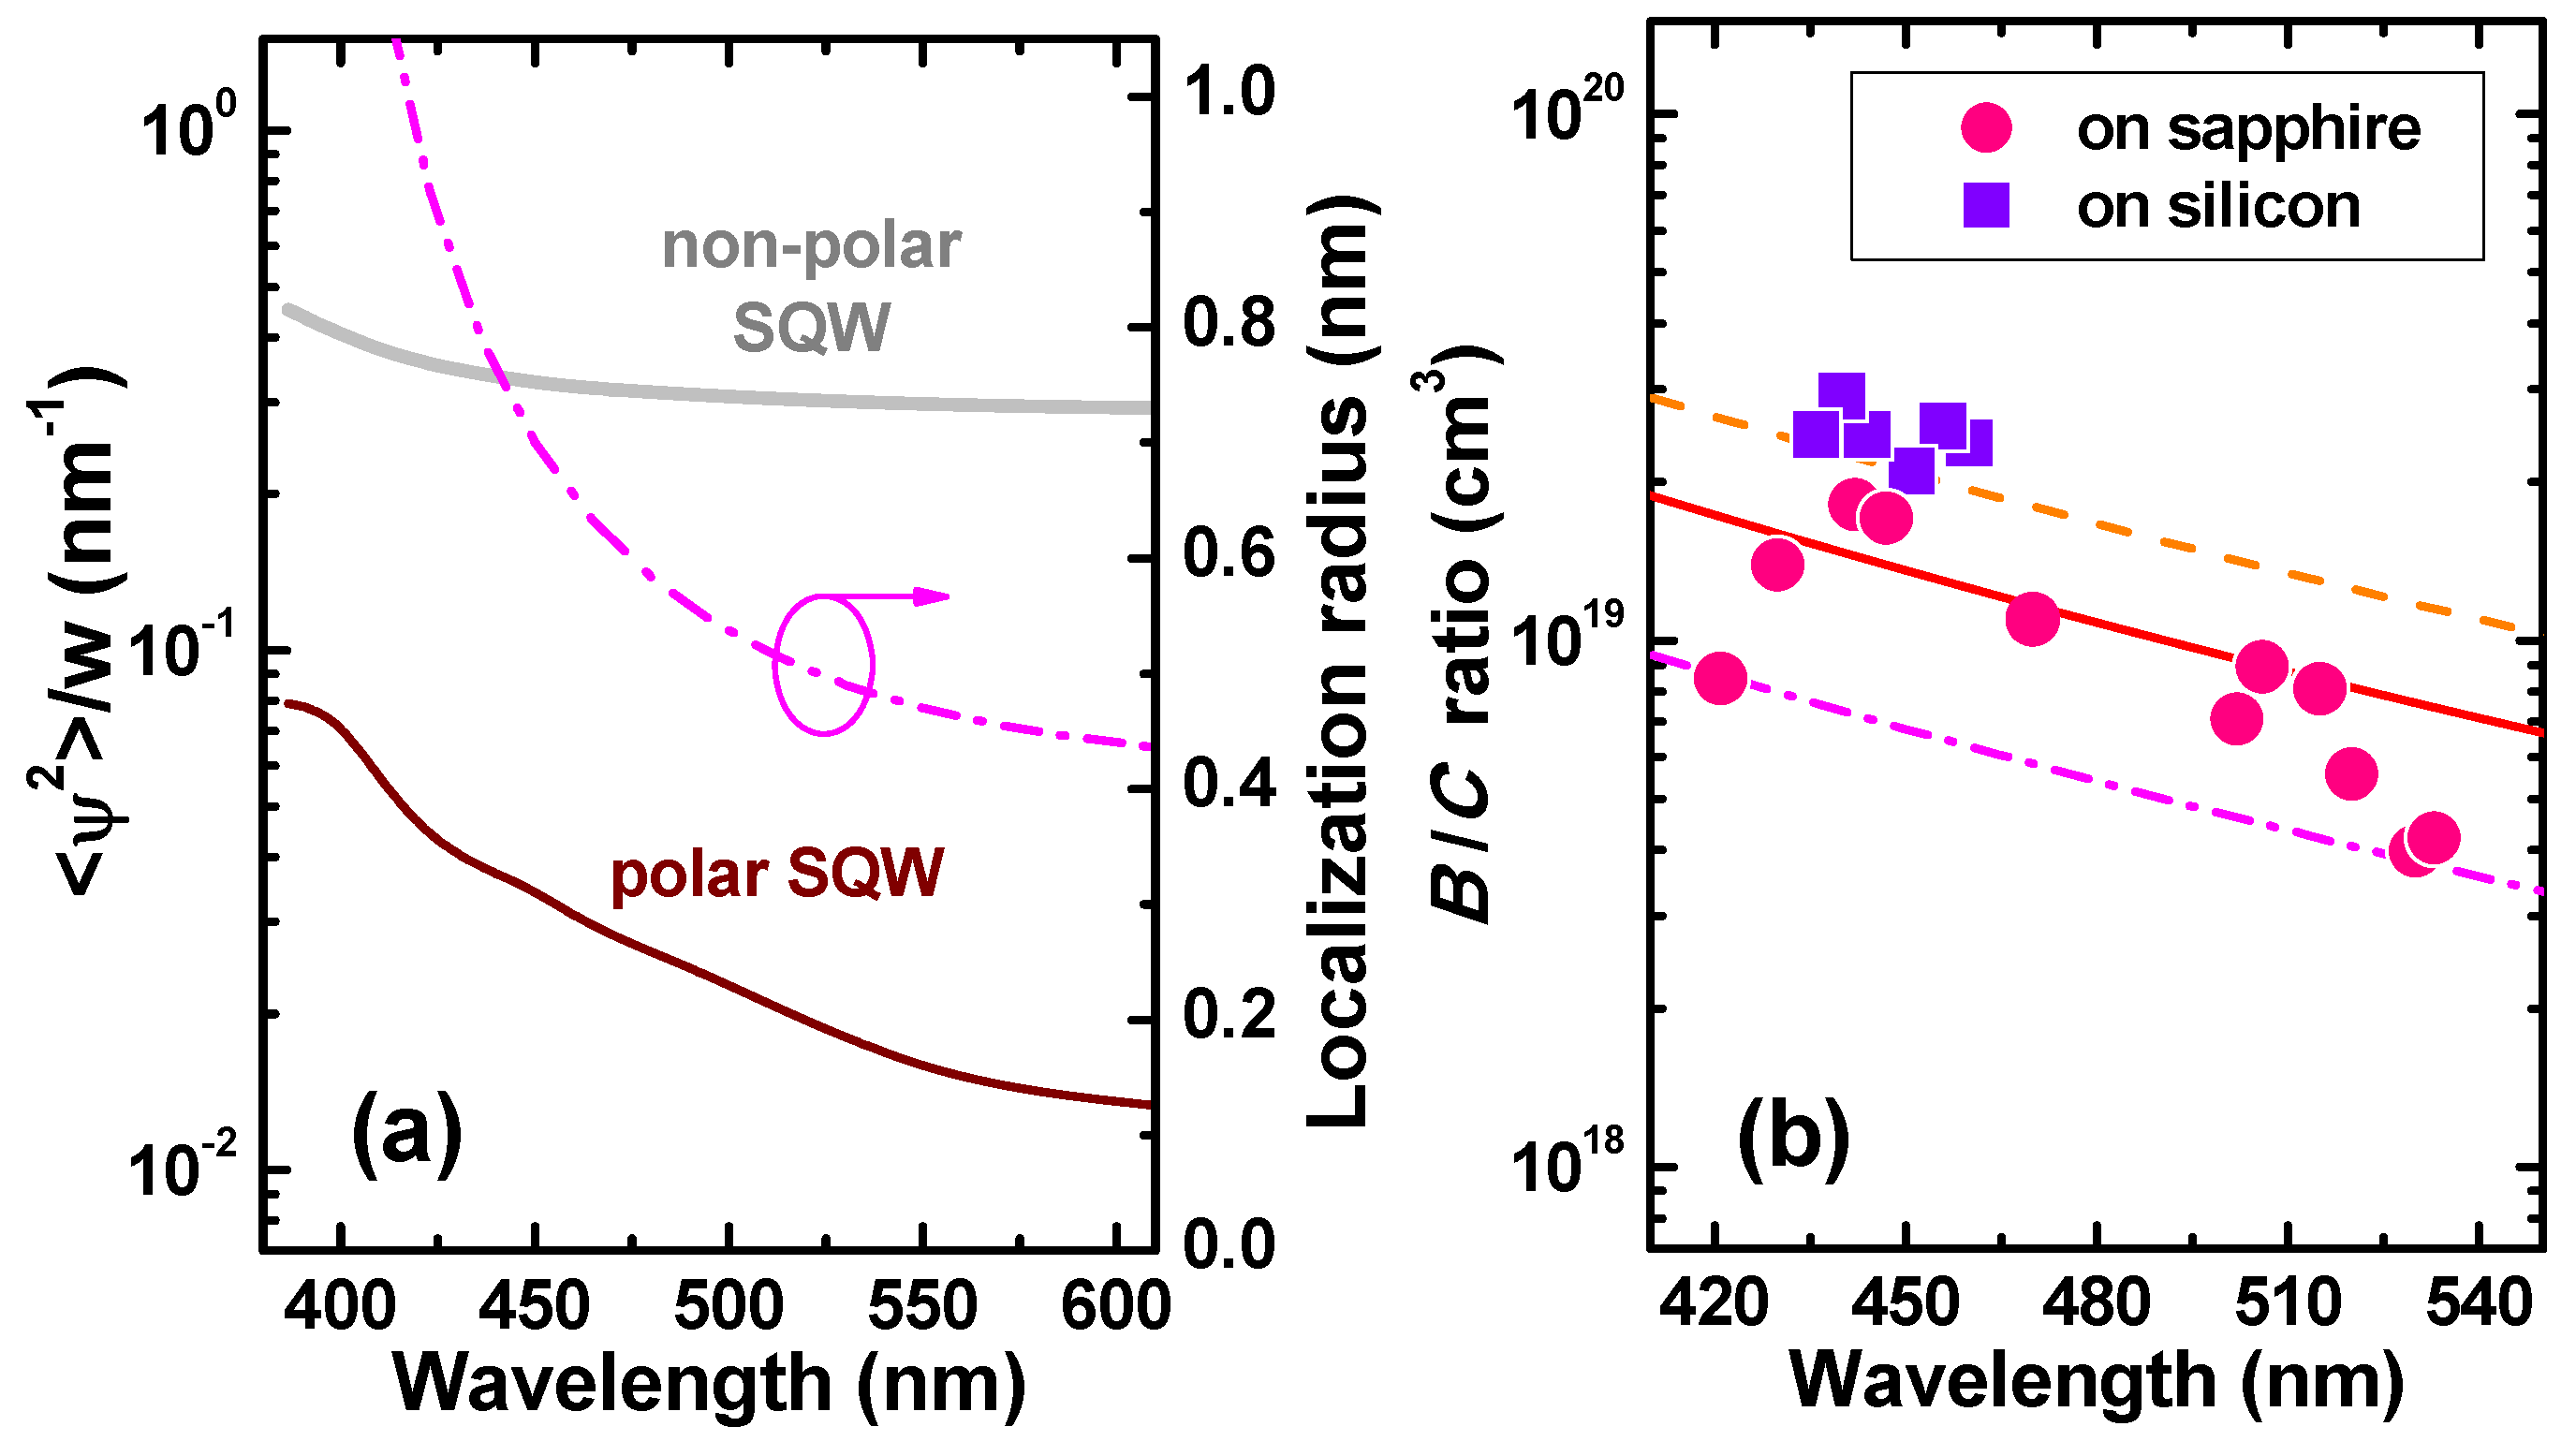
To calculate RRC and ARC by Equations (4) and (5), the electron envelope function was simulated using the SiLENSe 5.11 package [45]. Figure 2a compares values computed for [0001]-polar and nonpolar SQW LED structures. One can see that they differ by a factor of 6/23 at 400/600 nm, which originates from the electron and hole spatial separation in polar InGaN QW due to the built-in polarization field, becoming ever stronger with the emission wavelength.
The present model predicts the B/C ratio to be practically independent of the hole localization radius and to depend on the material properties of InGaN alloys only. This prediction is validated in Figure 2b comparing the experimental and theoretical B/C ratios calculated for Ee varied from 26 meV (thermal energy at room temperature) to 80 meV. One can see that the experimental points corresponding to LED structures grown on sapphire substrates agree well with the theory, whereas the data for the structures grown on silicon substrates lie slightly beyond the theoretical predictions.
In order to get a closer correlation between the absolute values of experimental and theoretical RCs, the parameter Et was changed from 1.85 eV recommended in [31] to 2.0 eV, corresponding to the localization energy variation from 24 meV at 420 nm to 96 meV at 550 nm. These values are comparable with localization energies reported in [33] and associated with two- and three-atomic In clusters. The wavelength dependence of the respective localization radius is shown in Figure 2a. Here, the condition , at which Equations (3) and (4) are valid, is met at the wavelengths longer than ~435 nm. At shorter wavelengths, down to ~410 nm, the approximations provide an inaccuracy of less than ~20%, which is within the scatter of the measured recombination coefficients (see Figure 3). At Et = 2.0 eV, the localization radius a varies from 0.92 nm at 420 nm to 0.47 nm at 550 nm, as is shown in Figure 2. The sub-nanometer scale of the localization radius variation agrees well with the mean dimensions (nearly equal to 2a) of the hole wave functions obtained in [35,46,47] by ab initio calculations.
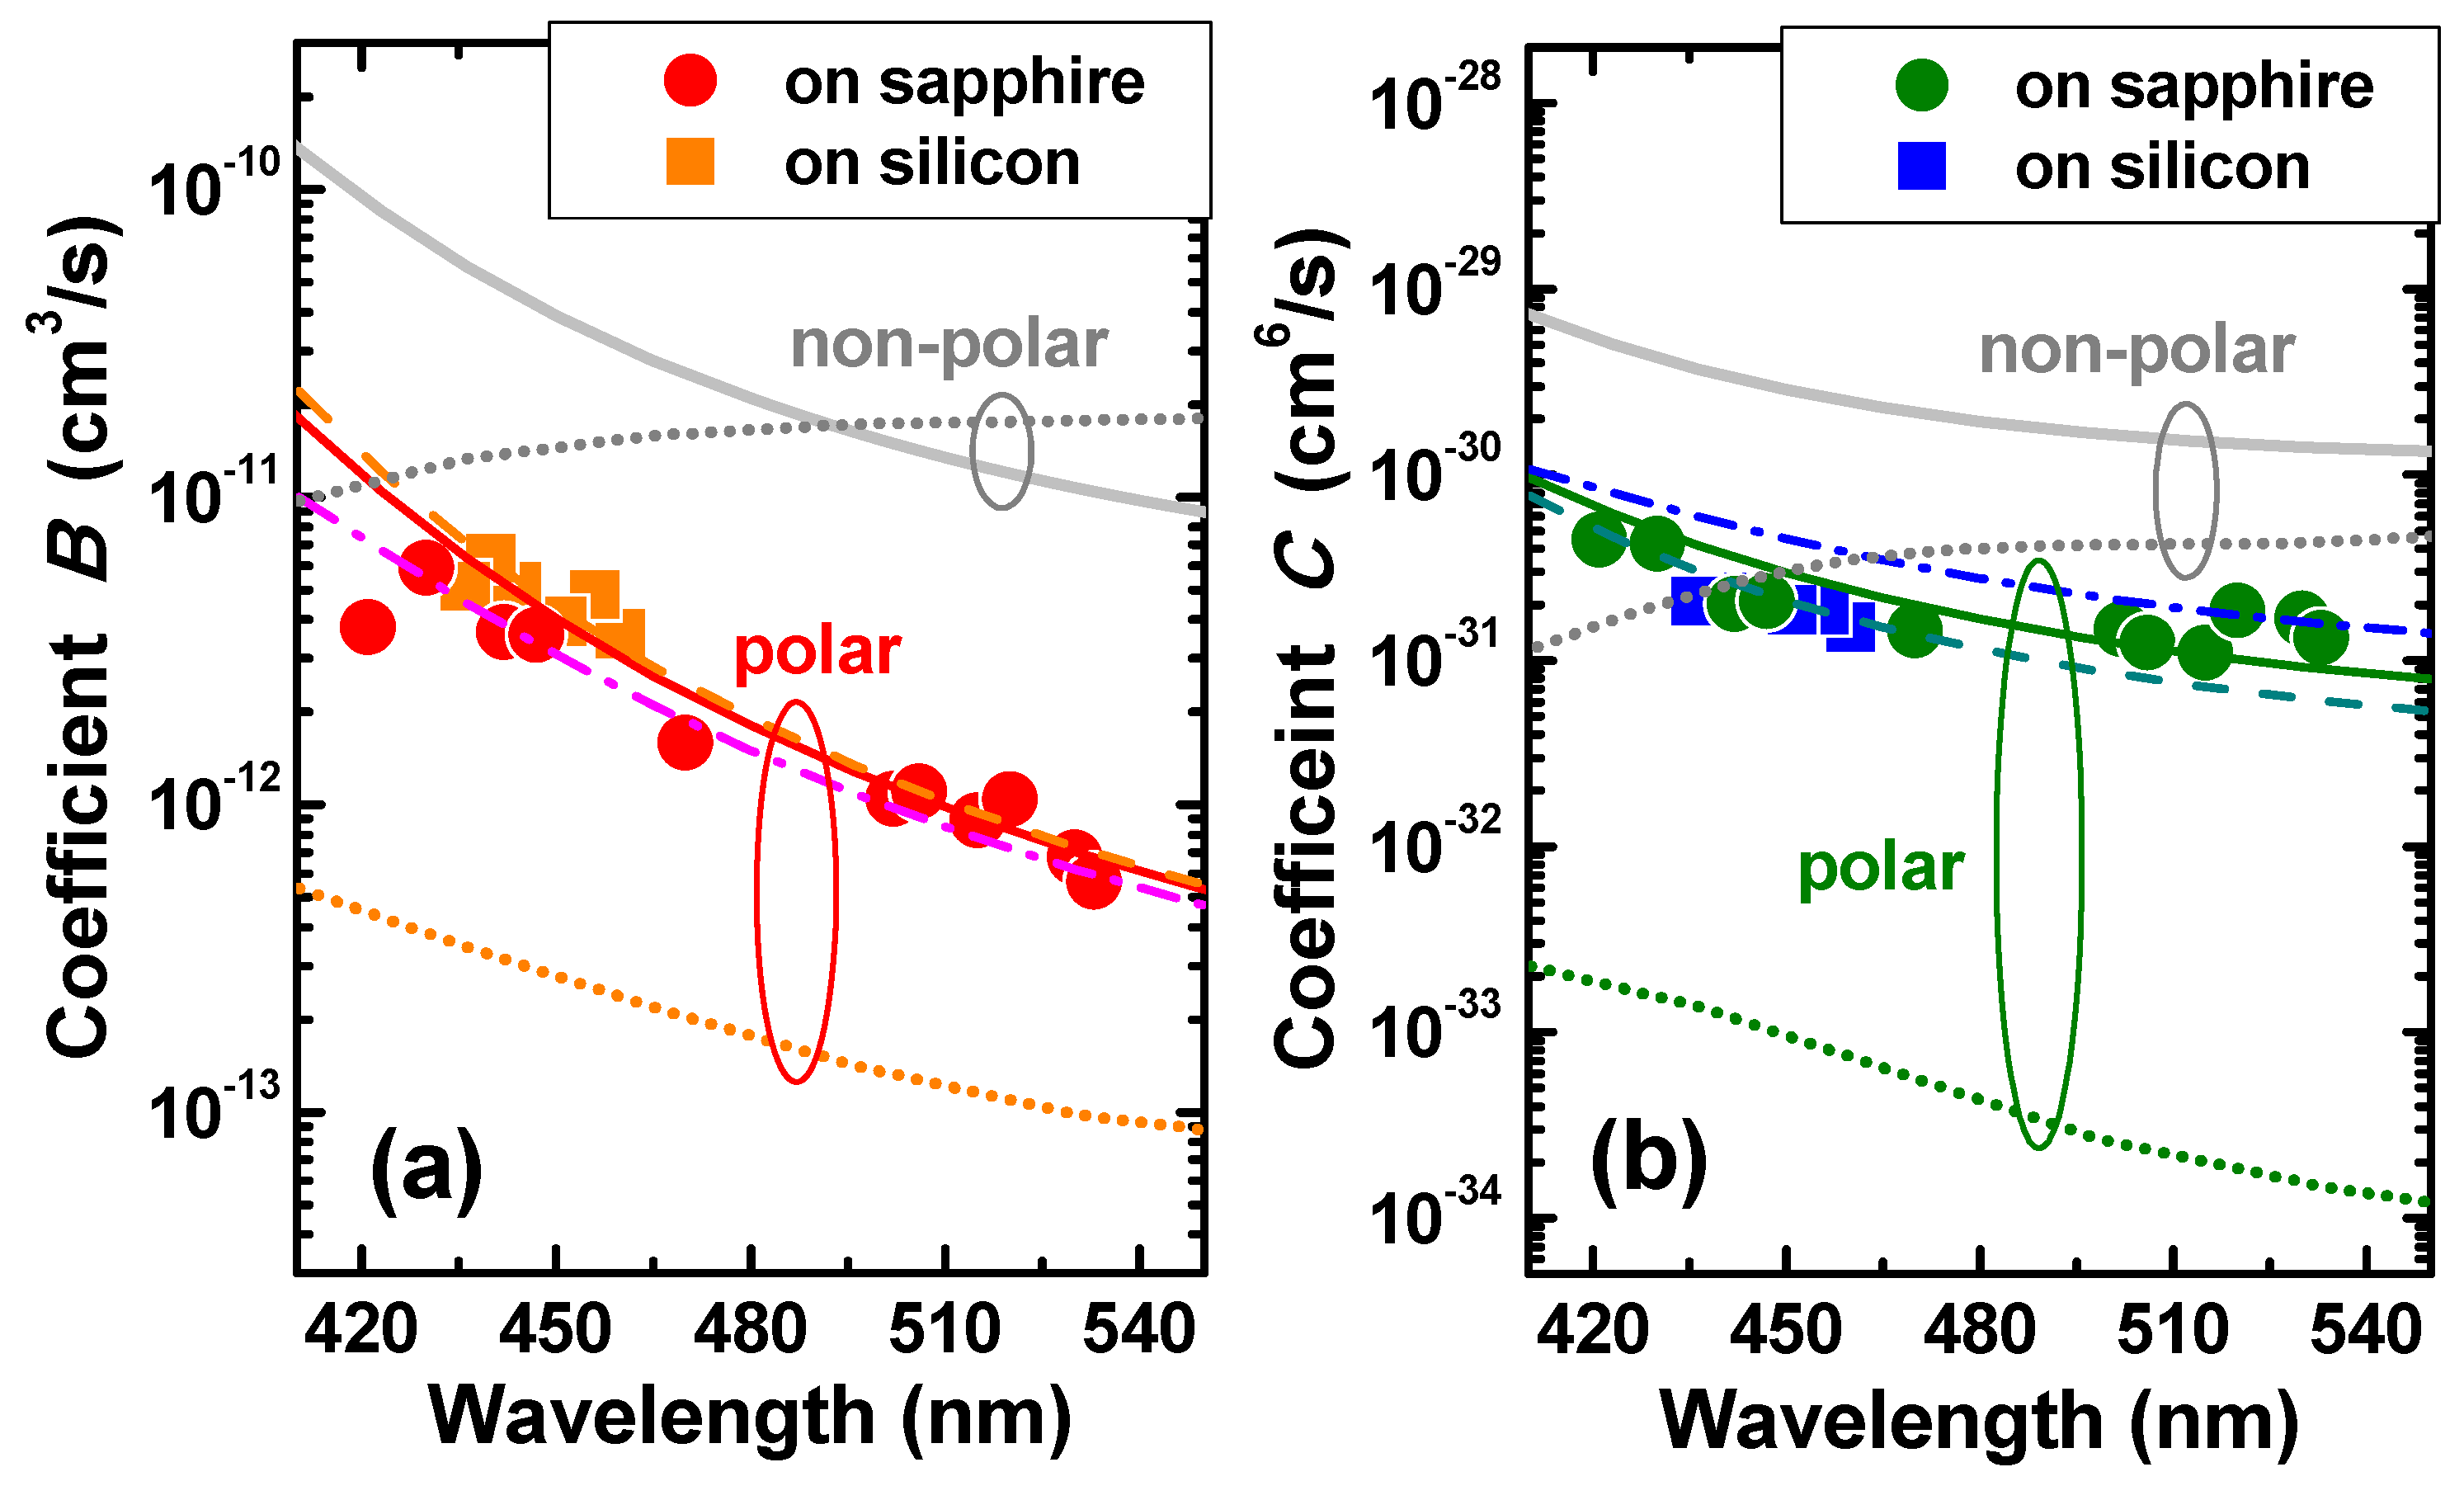
Figure 3 compares experimental and theoretical RRC and ARC calculated for [0001]-polar SQW LED structure vs. emission wavelength. All the calculations were carried out with wavelength-dependent material parameters, like electron and hole effective masses, energy gaps, Kane’s energy EP, etc. The comparison demonstrates good quantitative agreement between the theory and experiment achieved simultaneously for both RCs. RRC is found to depend weakly on Ee, whereas ARC is proportional to the mean electron energy. RCs calculated for nonpolar LED structure (grey solid lines in Figure 2), appear to be much higher than those corresponding to the polar structure, which is the consequence of the difference in the seen in Figure 2a. Since the theoretical B/C ratio does not depend on , according to Equations (3) and (4), the ratios plotted in Figure 2b by lines actually correspond to both polar and nonpolar LED structures.
Dotted lines in Figure 3 show the results of ab initio simulations of the recombination coefficients reported in [48] for 3 nm InGaN/GaN QWs. In the case of polar QW, the simulation predicts a decrease in both RRC and ARC with the emission wavelength, which is in qualitative agreement with observations [20,21]. However, the theoretical values of RRC and ARC are one and two-three orders of magnitude lower than the experimental ones. In the case of nonpolar QW, the simulations [48] predict that both RRC and ARC will increase with wavelength, which is the trend opposite to that predicted by the semi-empirical model. Though data on the spectral dependence of RCs in nonpolar InGaN QWs are not available to date, the above trend seems to be erroneous. Indeed, using the RRC and ARC obtained in [48] and the experimental SRH recombination coefficient A (see Figure 1), one can calculate the dimensionless factor and then the maximum IQE value as a function of wavelength. They are predicted in such a way that IQEmax would grow with the wavelength, which contradicts the observed efficiency decline of the nonpolar LEDs in the “green gap” [15].
In contrast, the semi-empirical model presented in this paper implies that both RRC and ARC in a nonpolar InGaN QW decrease with its emission wavelength (see Figure 3). Estimation of IQEmax via Q-factor shows the emission efficiency to decline when the hole localization becomes stronger, i.e., when the localization radius decreases. The prediction of the model is in line with the data reported in [49], where the efficiency droop in nonpolar InGaN QWs was observed at lower optical excitation powers, and if the InGaN material exhibited a stronger disorder, this resulted in a deeper carrier localization.
One more alternative model of the Auger recombination in InGaN QWs mediated by interface roughness has been suggested in [50]. Authors of the paper have considered enhancement of Auger recombination caused by violation of the momentum selection rule and originating from fluctuations of the QW width. Unfortunately, an accompanying effect, i.e., suppression of the recombination rate due to decreasing overlap of the electron and hole wave functions due to lateral carrier localization, was not accounted for in the model, making its quantitative predictions doubtful. Besides, the model does not regard any correlations between the width fluctuations, InGaN composition, and conditions of QW growth. Until such a correlation is established, the model of [50] seems to be ineffective for predicting trends in the LED efficiency variation inside the “green gap”.
3.2. Efficiency of Polar and Nonpolar LEDs in the “Green Gap”
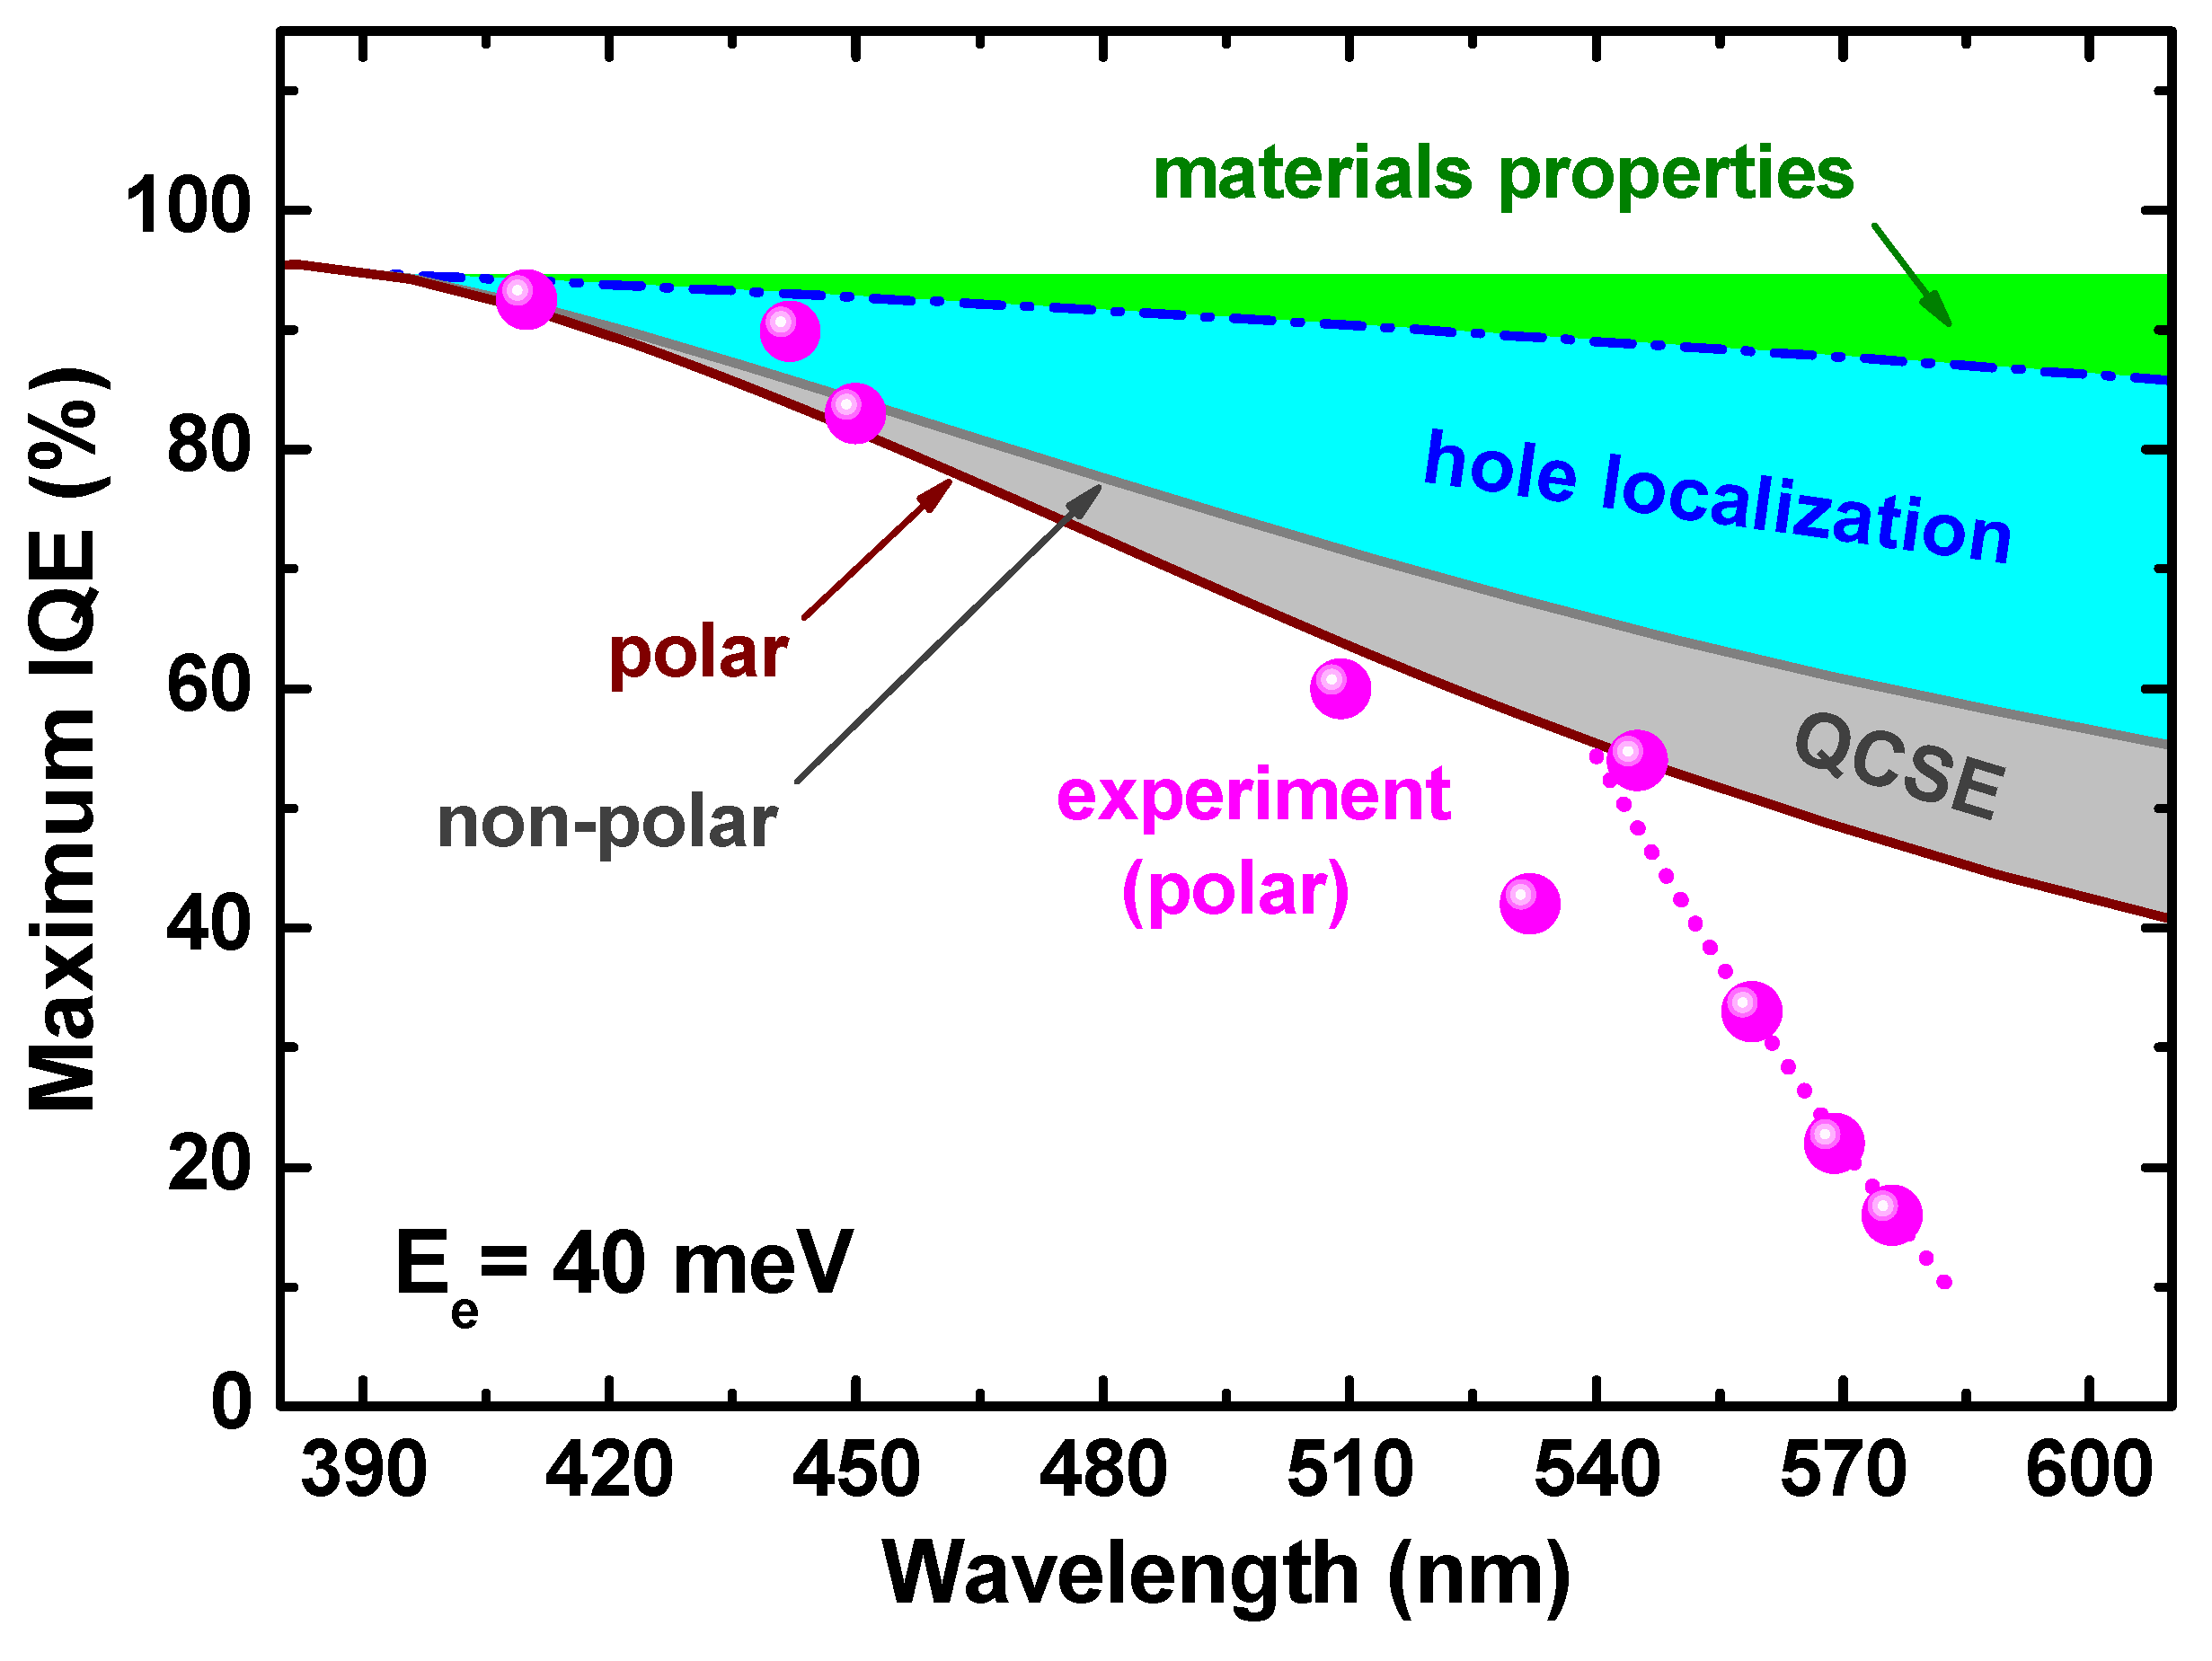
Using the theoretical RRC and ARC and experimental SRH coefficient A = 7 × 10⁵ s−1 being nearly constant in the spectral range of 440–520 nm (see Figure 1), the factor and then IQEmax were calculated for the polar LED structure versus emission wavelength (Figure 4). The obtained curve fits the experimental points obtained from independent IQE evaluations very well (see [10] for summary of the data) at wavelengths shorter than ~540 nm. However, at longer wavelengths, the experimental IQEmax declines much faster than it is predicted by the theory (dotted line in Figure 3 shows this trend). It looks like intensive defect formation starts to occur at about 540 nm, resulting in additional IQE reduction.
In order to assess the roles of QCSE and carrier localization for the efficiency of LEDs emitting in the “green gap” spectral range, one can compare IQEs of polar and nonpolar LEDs, which is possible by using the theoretical RCs plotted in Figure 3. For this, however, it is necessary to properly account for the variation of the SRH coefficient A with the crystal orientation. The importance of such an account follows, in particular, from time-resolved measurements of carrier dynamics in polar and nonpolar InGaN QWs: the nonpolar QWs exhibit much shorter carrier life times than the polar ones [51].
Unfortunately, detailed experimental information on the RCs of nonpolar LEDs and their wavelength dependence is not available in the literature. Therefore, the following approach has been applied to compare IQEs of LEDs at different crystal orientations. First, the SRH coefficient A was chosen for nonpolar LED in such a way as to provide the IQE value of 94.3% at 395 nm, equal to that of the polar LED. Then, the coefficient A = 4.7 × 10⁶ s−1 obtained in this manner was expanded over the whole spectral range, similar to the case of polar LEDs. Finally, Q-factor and IQEmax were calculated for nonpolar LEDs, using the estimated SRH coefficient and wavelength-dependent RRC and ARC from Figure 3.
Despite the vanished built-in polarization field, IQEmax of nonpolar LEDs is found to decrease substantially with the emission wavelength, similar to the case of polar LEDs (Figure 4). Being in line with the experimental behavior reviewed in [29], this result points out the importance of carrier localization for the efficiency of nonpolar LEDs. Breakdown of theoretical IQE losses in the “green gap” shown in Figure 4 demonstrates that about 53% of the efficiency decline can be attributed to hole localization, whereas only 29% is related to QCSE; the remaining 18% of the IQE reduction corresponds to variation of the native InGaN parameters, Eg, EP, and carrier effective masses, with wavelength. Since composition fluctuations are unavoidable in InGaN-based LEDs of any crystal orientation, the carrier localization seems to be the major mechanism limiting the device efficiency in the “green gap”.
3.3. Model Limitations and Outlook for Future Studies
The results presented in Section 3.1 show that the suggested semi-empirical model reproduces the wavelength dependence of both RRC and ARC from [20,21] quantitatively well, if the only adjustable parameter of the model Et is properly fitted. The model has, however, some intrinsic limitations originating from the fact that the most important parameter of the model, localization energy or localization radius, is fitted rather than derived theoretically and calculated. Since the composition fluctuations in InGaN alloys produce a variety of localized holes distributed inside the energy gap with a certain density of states (DOS), g(E), the localization radius in Equations (4) and (5) should be regarded as a parameter averaged over the ensemble of localized holes [22]. If g(E) is known, the averaging accounted for the Fermi distribution function of holes would enable a prediction of the dependences of the RCs on temperature and carrier concentration. However, it is impossible with the current model based on fitting to the data obtained at room temperature.
Thus, the evaluation of DOS of localized holes becomes a key point for gaining a deeper insight into localization phenomenon. The asymptotic (far from the valence band edge) behavior of DOS has been provided by the optimal-fluctuation method but it is found to be inapplicable directly to InGaN alloys (see Section 2.3). Generally, DOS can be obtained by ab initio calculations. Those closest to an evaluation of DOS were the authors of [47], who investigated the energy distribution and spatial localization of a large number of ground and excited hole states in nonpolar InGaN QWs. However, the cluster of 82,000 atoms considered in [47] was insufficiently large to avoid the dependence of the obtained energy distribution on a particular configuration of In atoms in the cluster. Therefore, the evaluation of localized hole DOS and its dependence on the InGaN composition still remains problematic.
Knowledge of g(E) for the correct estimation of the temperature-dependent localization radius is quite important in view of the anomalous behavior (increasing with temperature) of experimental RRC in blue and green LEDs revealed recently in [22]. In that study, such a behavior was explained qualitatively by assuming an exponential decrease of g(E) inside the InGaN energy gap. Leaving aside a discussion on the correctness of this assumption, I will show below how the data from [22] can be used for additional validation of the current semi-empirical model.
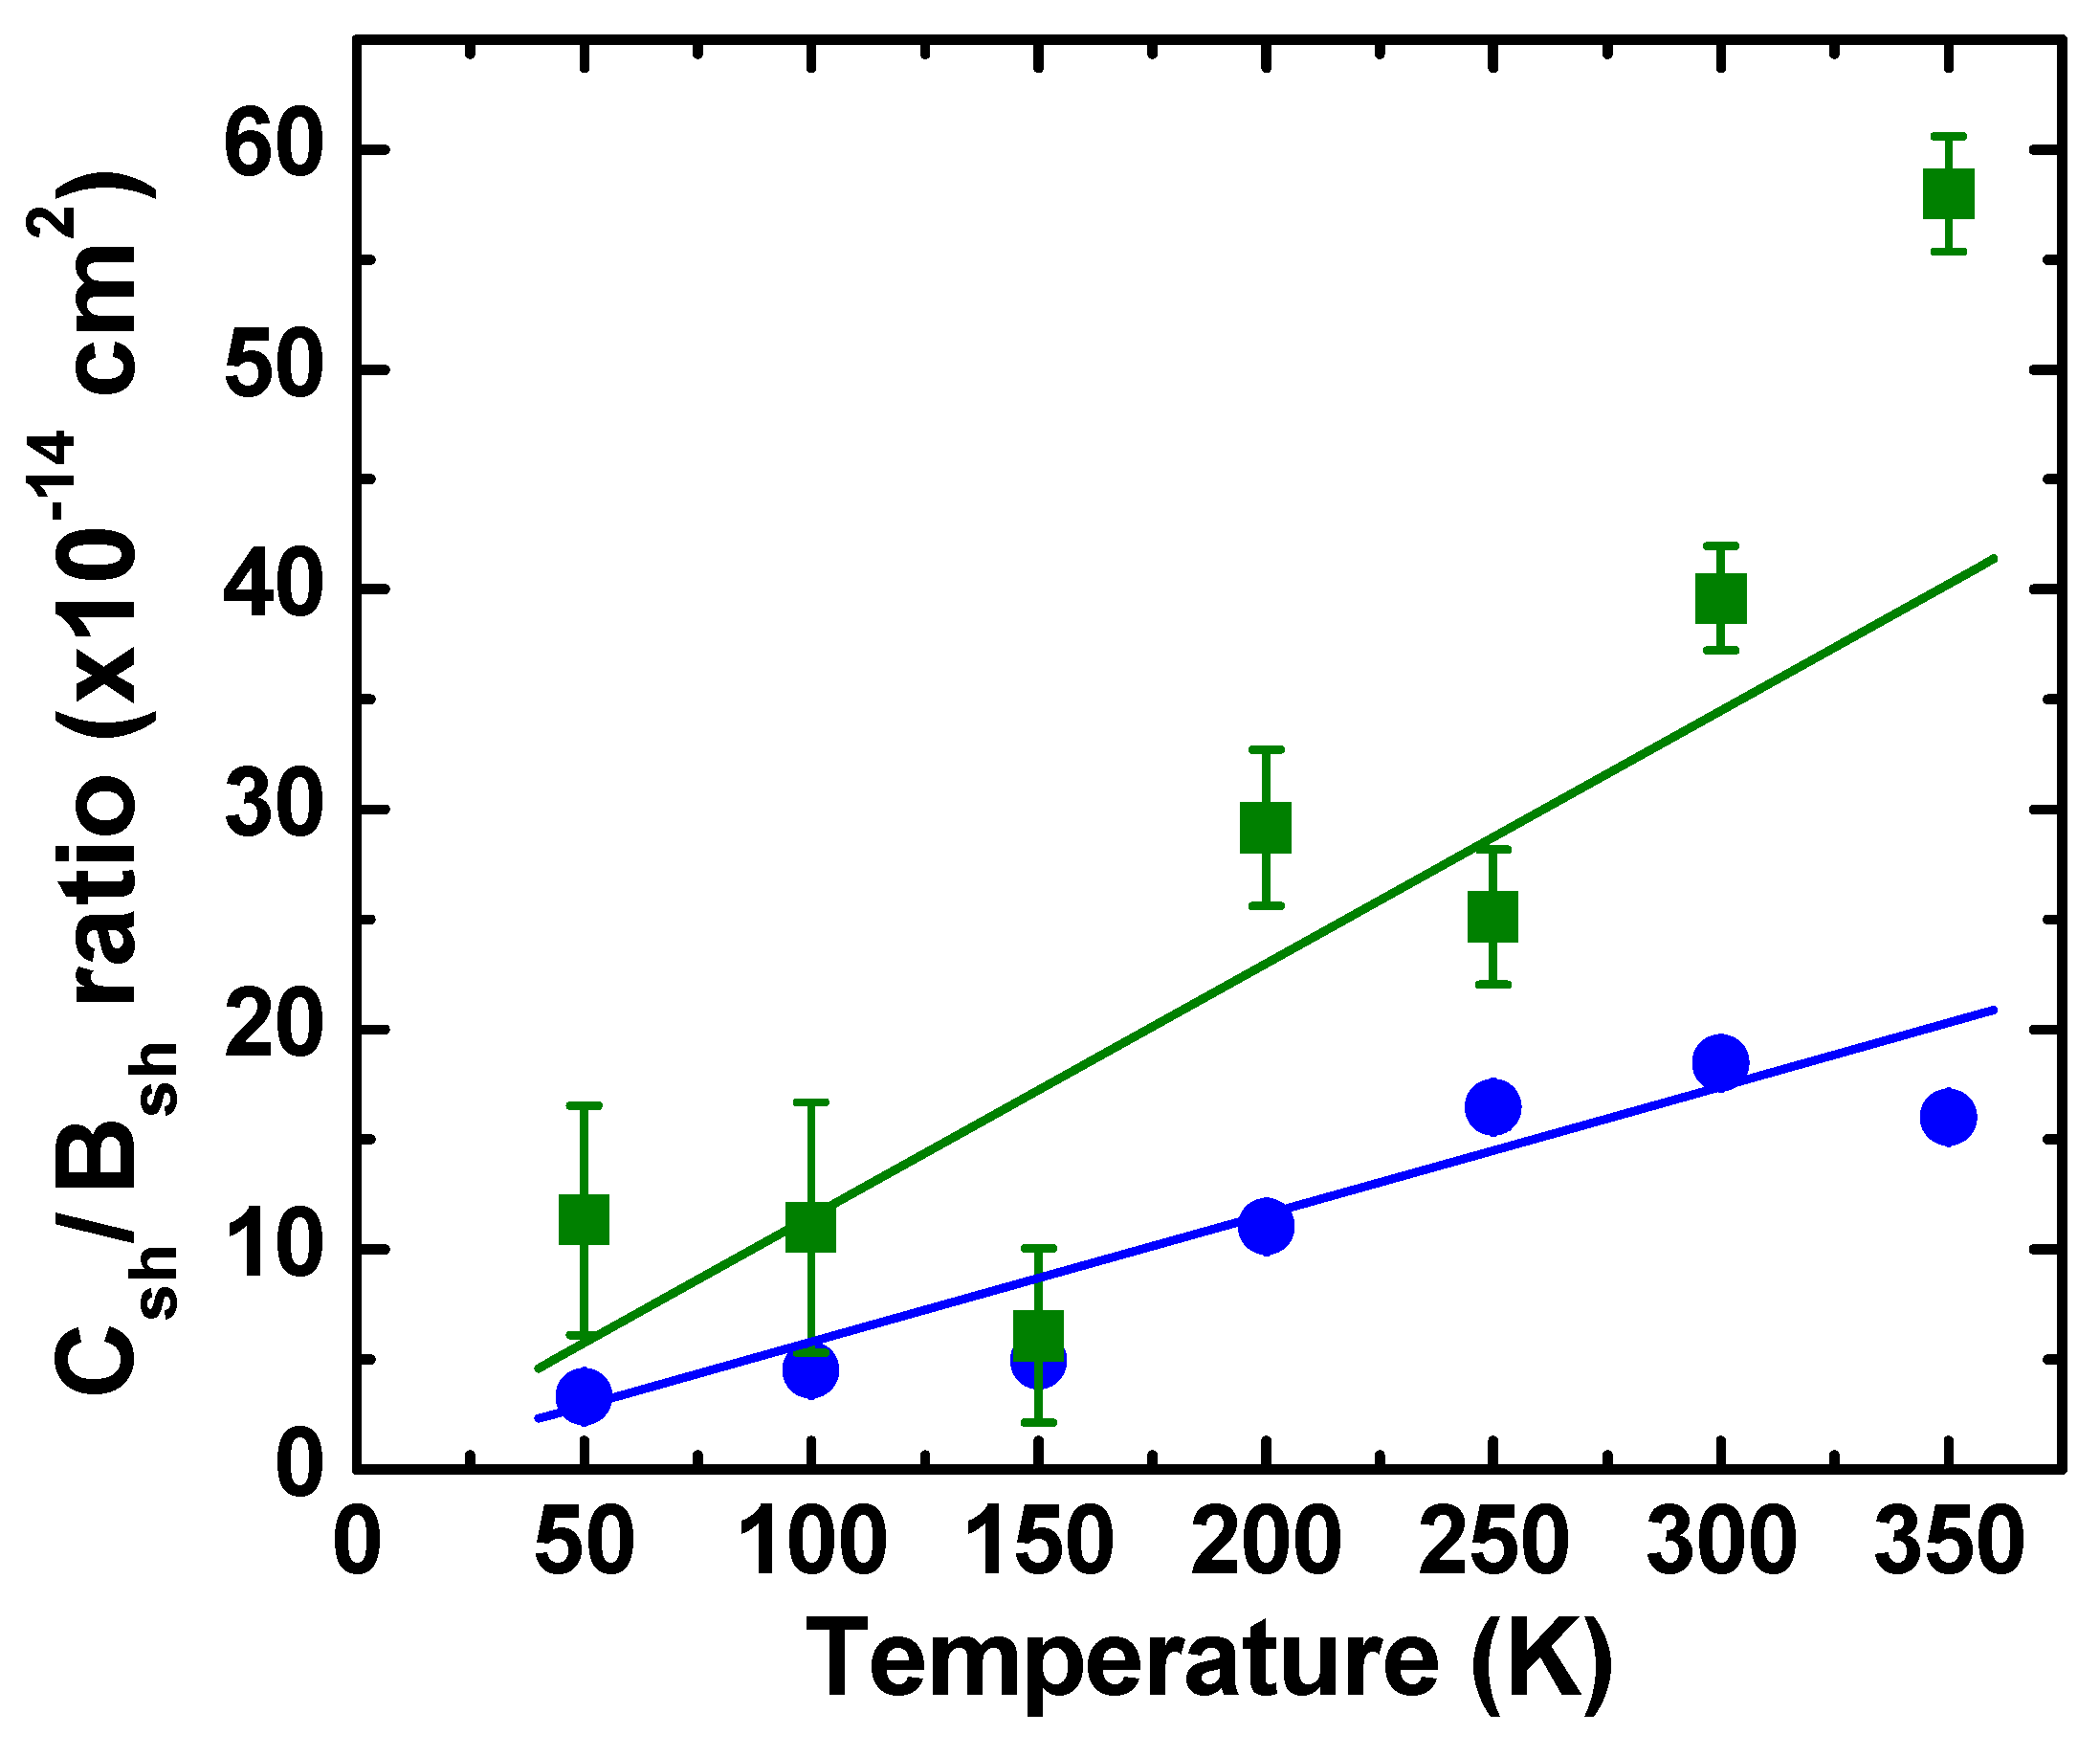
According to Equations (4) and (5), the Csh/Bsh ratio does not include the localization radius a and is proportional to the mean electron energy Ee nearly equal to thermal energy kT in the case of non-degenerate electrons. Figure 5 shows the experimental Csh/Bsh ratios versus temperature estimated from the data of [22,52]. The bars at the data points corresponding to green LED indicate the errors originating from an evaluation of the Q-factor from the current dependence of LED efficiency; the errors are especially pronounced at low temperatures, 50–100 K, where the efficiency is hardly approximated by the ABC-model (see [22] for more details on the experimental method). Similar bars for blue LEDs do not exceed the size of symbols. One can see from Figure 5 that the Csh/Bsh ratios depend nearly linearly on temperature, maybe except for the points corresponding to T = 350 K. Moreover, the slopes of the linear dependences are scaled with the LED emission wavelengths as , in accordance with the suggested model. Remarkable deviation of the experimental points from the above trends observed at T = 350 K may be evidence for the transition from the localization-mediated to conventional free carrier-mediated recombination processes. The latter issue, however, requires a special examination.
The transition from localization-mediated to free-hole mediated recombination is also expected to occur at high current densities due to filling the localized states with non-equilibrium holes. This transition should be accompanied by changes of all RCs to those that can be calculated by conventional theory accounting for the k-selection rule. Prediction of the transition point requires knowing the DOS of localized holes, which is a task for future studies. Experimentally, such a transition has not been identified to date.
The semi-empirical model discussed in this paper addresses the influence of carrier localization on radiative and Auger recombination. On the other hand, strong hole localization may also affect SRH recombination, including its dependence on crystal orientation. The latter factor has been studied both experimentally and theoretically in [24] for the case of free carrier-mediated SRH recombination. In order to account for the impact of hole localization on the SRH recombination coefficient, it is necessary to consider either hole tunneling from its localized state to a deep point defect or hopping transfer of holes from the localized state to the defect. The influence of the hole localization on the SRH non-radiative recombination is expected, however, at lower InGaN compositions providing emission wavelengths shorter than 450 nm, where the experimental SRH recombination coefficients tend to increase (see Figure 1).
4. Conclusions
A semi-empirical model accounting for hole localization by InGaN composition fluctuations has been extended to QWs of polar and nonpolar orientations. The extended model provides quantitative predictions for radiative and Auger RCs as a function of emission wavelength, which is confirmed by direct comparison with available data. Both RCs are found to decrease with the wavelength due to hole localization enhanced at higher InN fractions in InGaN alloys. However, a greater importance of RRC for the Q-factor and, hence, for IQE, eventually leads to a substantial efficiency decline with the emission wavelength.
Breakdown of the carrier losses up to ~540 nm made by a comparison of IQEs of polar and nonpolar LED structures attributes ~53% of the efficiency decline to carrier localization, ~29% to QCSE, and ~18% to variation of native material properties with the emission wavelength. This explains observations of pronounced efficiency reduction with the wavelength in nonpolar and semipolar LEDs, where QCSE is eliminated or largely reduced. Since the composition fluctuations are unavoidable in InGaN alloys, the carrier localization seems to be a fundamental factor limiting the efficiency of long-wavelength nitride LEDs.
Among the unresolved problems, determination of the localized hole density of states seems to be of primary importance. This would allow researchers to predict the dependence of the RRC and ARC on temperature and carrier concentration, which is necessary for the optimization of conventional (large-size) and micro-LEDs made of InGaN compounds. Impact of the hole localization on SRH recombination in InGaN alloys is another subject for future studies, which is of special interest for violet and near-UV LEDs.
Due to the common nature of carrier localization, application of the semi-empirical model to AlGaN alloys utilized as the materials for active regions of deep-UV LEDs also seems to be promising in order to better understand the factors limiting the efficiency of these devices. For this purpose, however, getting any experimental information on the recombination coefficients of deep-UV LEDs would be quite desirable.
Acknowledgments
I would like to thank Felix Nippert from Technische Universität Berlin for providing low-temperature data on recombination coefficients and helpful discussion.
Conflicts of Interest
The author declares no conflict of interest.
References
- Narukawa, Y.; Ichikawa, M.; Sanga, D.; Sano, M.; Mukai, T. White light emitting diodes with super-high luminous efficacy. J. Phys. D Appl. Phys. 2010, 43, 354002. [Google Scholar] [CrossRef]
- Hurni, C.A.; David, A.; Cich, M.J.; Aldaz, R.I.; Ellis, B.; Huang, K.; Tyagi, A.; DeLille, R.A.; Craven, M.D.; Steranka, F.M.; et al. Bulk GaN flip-chip light-emitting diodes with optimized efficiency for high-power operation. Appl. Phys. Lett. 2015, 106, 031101. [Google Scholar] [CrossRef]
- Avrutin, V.; Ahmad Hafis, S.; Fan, Z.; Ösgür, Ü.; Morkoç, H.; Matulionis, A. InGaN light-emitting diodes: Efficiency-limiting processes at high injection. J. Vac. Sci. Technol. A 2013, 31, 050809. [Google Scholar] [CrossRef]
- Cho, J.; Schubert, E.F.; Kim, J.K. Efficiency droop in light-emitting diodes: Challengies and counter-measures. Laser Photonics Rev. 2013, 7, 408–421. [Google Scholar] [CrossRef]
- Verzellesi, G.; Saguatti, D.; Meneghini, M.; Bertazzi, F.; Goano, M.; Meneghesso, G.; Zanoni, E. Efficiency droop in InGaN/GaN blue light-emitting diodes: Physical mechanisms and remedies. J. Appl. Phys. 2013, 114, 071101. [Google Scholar] [CrossRef]
- Weisbuch, C.; Piccardo, M.; Martinelli, L.; Iveland, J.; Peretti, J.; Speck, J.S. The efficiency challenge of nitride light-emitting diodes for lighting. Phys. Status Solidi A 2015, 212, 899–913. [Google Scholar] [CrossRef]
- Peter, M.; Laubsch, A.; Bergbauer, W.; Meyer, T.; Sabathil, M.; Baur, J.; Hahn, B. New developments in green LEDs. Phys. Status Solidi A 2009, 206, 1125–1129. [Google Scholar] [CrossRef]
- Alhassan, A.I.; Farrel, R.M.; Saifaddin, B.; Mughal, A.; Wu, F.; DenBaars, S.P.; Nakamura, S.; Speck, J.S. High luminous efficacy green light-emitting diodes with AlGaN cap layer. Opt. Express 2016, 24, 17868–17873. [Google Scholar] [CrossRef] [PubMed]
- Saito, S.; Hashimoto, R.; Hwang, J.; Nunoue, S. InGaN Light-Emitting Diodes on c-Face Sapphire Substrates in Green Gap Spectral Range. Appl. Phys. Express 2013, 6, 111004. [Google Scholar] [CrossRef]
- Karpov, S.Y. Light-emitting diodes for solid-state lighting: Searching room for improvements. Proc. SPIE 2016, 9768, 97680C. [Google Scholar] [CrossRef]
- Sizov, D.; Bhat, R. Gallium Indium Nitride-Based Green Lasers. J. Lightw. Technol. 2012, 30, 679–699. [Google Scholar] [CrossRef]
- Takagi, S.; Ueno, M.; Katayama, K.; Ikegami, T.; Nakamura, T.; Yanashima, K. High-Power and High-Efficiency True Green Laser Diodes. SEI Tech. Rev. 2013, 77, 102–106. [Google Scholar]
- Langer, T.; Jönen, H.; Kruse, A.; Bremers, H.; Rossow, U.; Hangleiter, A. Strain-induced defects as nonradiative recombination centers in green-emitting GaInN/GaN quantum well structures. Appl. Phys. Lett. 2013, 103, 022108. [Google Scholar] [CrossRef]
- Lobanova, A.V.; Kolesnikova, A.L.; Romanov, A.E.; Karpov, S.Y.; Rudinsky, M.E.; Yakovlev, E.V. Mechanism of stress relaxation in (0001)InGaN/GaN via formation of V-shaped dislocation half-loops. Appl. Phys. Lett. 2013, 103, 152106. [Google Scholar] [CrossRef]
- Hammersley, S.; Kappers, M.J.; Massabuau, F.C.P.; Sahonta, S.L.; Dawson, P.; Oliver, R.A.; Humphreys, C.J. Effects of quantum well growth temperature on the recombination efficiency of InGaN/GaN multiple quantum wells that emit in the green and blue spectral regions. Appl. Phys. Lett. 2015, 107, 132106. [Google Scholar] [CrossRef]
- Shockley, W.; Read, W.T., Jr. Statistics of the Recombination of Holes and Electrons. Phys. Rev. 1952, 87, 835–842. [Google Scholar] [CrossRef]
- Dai, Q.; Schubert, M.F.; Kim, M.H.; Kim, J.K.; Schubert, E.F.; Koleske, D.D.; Crawford, M.H.; Lee, S.R.; Fischer, A.J.; Thaler, G.; et al. Internal quantum efficiency and nonradiative recombination coefficient of GaInN/GaN multiple quantum wells with different dislocation densities. Appl. Phys. Lett. 2009, 94, 111109. [Google Scholar] [CrossRef]
- Eliseev, P.G.; Osin’ski, M.; Li, H.; Akimova, I.V. Recombination balance in green-light-emitting GaN/InGaN/AlGaN quantum wells. Appl. Phys. Lett. 1999, 75, 3838–3840. [Google Scholar] [CrossRef]
- David, A.; Grundmann, M.J. Influence of polarization fields on carrier lifetime and recombination rates in InGaN-based light-emitting diodes. Appl. Phys. Lett. 2010, 97, 033501. [Google Scholar] [CrossRef]
- Schiavon, D.; Binder, M.; Peter, M.; Galler, B.; Drechsel, P.; Scholz, F. Wavelength-dependent determination of the recombination rate coefficients in single-quantum-well GaInN/GaN light emitting diodes. Phys. Status Solidi B 2013, 250, 283–290. [Google Scholar] [CrossRef]
- Schiavon, D. Analysis of the Green Gap Problem in III-Nitride LEDs. Ph.D. Thesis, University of Ulm, Ulm, Germany, 2014. [Google Scholar]
- Nippert, F.; Karpov, S.Y.; Callsen, G.; Galler, B.; Kure, T.; Nenstiel, C.; Wagner, M.R.; Straßburg, M.; Lugauer, H.J.; Hoffmann, A. Temperature-dependent recombination coefficients in InGaN light-emitting diodes: Hole localization, Auger processes, and the green gap. Appl. Phys. Lett. 2016, 109, 161103. [Google Scholar] [CrossRef]
- David, A.; Young, N.G.; Hurni, C.A.; Craven, M.D. All-optical measurements of carrier dynamics in bulk-GaN LEDs: Beyond the ABC approximation. Appl. Phys. Lett. 2017, 110, 253504. [Google Scholar] [CrossRef]
- David, A.; Hurni, C.A.; Young, N.G.; Craven, M.D. Field-assisted Shockley-Read-Hall recombinations in III-Nitride quantum wells. 2017, 111, 233501. [Google Scholar] [CrossRef]
- Crawford, M.H. LEDs for Solid-State Lighting: Performance Challenges and Recent Advances. IEEE J. Sel. Top. Quantum Electron. 2009, 15, 1028–1040. [Google Scholar] [CrossRef]
- Vaxenburg, R.; Rodina, A.; Lifshitz, E.; Efros, A.L. The role of polarization fields in Auger-induced efficiency droop in nitride-based light-emitting diodes. Appl. Phys. Lett. 2013, 103, 221111. [Google Scholar] [CrossRef]
- DenBaars, S.P.; Feezell, D.; Kelchner, K.; Pimputkar, S.; Pan, C.-C.; Yen, C.-C.; Tanaka, S.; Zhao, Y.; Pfaff, N.; Farrell, R.; et al. Development of gallium-nitride-based light-emitting diodes (LEDs) and laser diodes for energy-efficient lighting and displays. Acta Mater. 2013, 61, 945–951. [Google Scholar] [CrossRef]
- Pan, C.-C.; Tanaka, S.; Wu, F.; Zhao, Y.; Speck, J.S.; Nakamura, S.; DenBaars, S.P.; Feezell, D. High-Power, Low-Efficiency-Droop Semipolar (20) Single-Quantum-Well Blue Light-Emitting Diodes. Appl. Phys. Express 2012, 5, 062103. [Google Scholar] [CrossRef]
- Pristovsek, M.; Humphreys, C.J.; Bauer, S.; Knab, M.; Thonke, K.; Kozlowski, G.; O’Mahony, D.; Maaskant, P.; Corbett, B. Comparative study of (0001) and (112) InGaN based light emitting diodes. Jpn. J. Appl. Phys. 2016, 55, 05FJ10. [Google Scholar] [CrossRef]
- Auf der Maur, M.; Pecchia, A.; Penazzi, G.; Rodrigues, W.; Di Carlo, A. Efficiency Drop in Green InGaN/GaN Light Emitting Diodes: The Role of Random Alloy Fluctuations. Phys. Rev. Lett. 2016, 116, 027401. [Google Scholar] [CrossRef] [PubMed]
- Karpov, S.Y. Carrier localization in InGaN by composition fluctuations: Implication to “green gap”. Photonics Res. 2017, 5, A7. [Google Scholar] [CrossRef]
- Morel, A.; Lefebre, P.; Kalliakos, S.; Taliercio, T.; Bretagnon, T.; Gil, B. Donor-acceptor-like behaviour of electron-hole pair recombination in low-dimensional (Ga,In)N/GaN systems. Phys. Rev. B 2003, 68, 045331. [Google Scholar] [CrossRef]
- Reznitsky, A.; Klochikhin, A.; Permogorov, S.; Tenishev, L.; Lundin, W.; Usikov, A.; Schmidt, M.; Klingshirn, C. Localization of Excitons at Small in Clusters in Diluted InGaN Solid Solutions. Phys. Status Solidi C 2002, 280–283. [Google Scholar] [CrossRef]
- Bellaiche, L.; Mattila, T.; Wang, L.-W.; Wei, S.-H.; Zunger, A. Resonant hole localization and anomalous optical bowing in InGaN alloys. Appl. Phys. Lett. 1999, 74, 1842–1844. [Google Scholar] [CrossRef]
- Kent, P.R.C.; Zunger, A. Carrier localization and the origin of luminescence in cubic InGaN alloys. Appl. Phys. Lett. 2001, 79, 1977–1979. [Google Scholar] [CrossRef]
- Rigutti, L.; Mancini, L.; Lefebvre, W.; Houard, J.; Hernàndez-Maldonado, D.; Di Russo, E.; Giraud, E.; Butté, R.; Carlin, J.-F.; Grandjean, N.; et al. Statistical nanoscale study of localized radiative transitions in GaN/AlGaN quantum wells and AlGaN epitaxial layers. Semicond. Sci. Technol. 2016, 31, 095009. [Google Scholar] [CrossRef]
- Chuang, S.L.; Chang, C.S. k·p method for strained wurtzite semiconductors. Phys. Rev. B 1996, 54, 2491–2504. [Google Scholar] [CrossRef]
- Lasher, G.; Stern, F. Spontaneous and Stimulated recombination Radiation in Semiconductors. Phys. Rev. 1964, 133, A553–A563. [Google Scholar] [CrossRef]
- Levanyuk, A.P.; Osipov, V.V. Edge luminescence of direct-bandgap semiconductors. Sov. Phys. Uspekhi 1981, 24, 187–215. [Google Scholar] [CrossRef]
- Abakumov, V.N.; Perel, V.I.; Yassievich, I.N. Nonradiative Recombination in Semiconductors; Elsevier Science Publishers B. V.: Amsterdam, The Netherlands, 1991; pp. 227–238. [Google Scholar]
- Esipov, S.E.; Levinson, I.B. Electron temperature in a two-dimensional gas: Energy losses to optical phonons. Sov. Phys. JETF 1986, 63, 191–199. [Google Scholar]
- Galler, B.; Lugauer, H.-J.; Binder, M.; Hollweck, R.; Folwill, Y.; Nirschl, A.; Gomez-Iglesias, A.; Hahn, B.; Wagner, J.; Sabathil, M. Experimental Determination of the Dominant Type of Auger Recombination in InGaN Quantum Wells. Appl. Phys. Express 2013, 6, 112101. [Google Scholar] [CrossRef]
- Efros, A.L.; Raikh, M.E. Effect of Composition Disorder on the Electronic Properties of Semiconducting Mixed Crystals. In Optical Properties of Mixed Crystals; Elliott, R.J., Ipatova, I.P., Eds.; Elsevier Science Publishers B. V.: Amsterdam, The Netherlands, 1988; pp. 135–173. [Google Scholar]
- Karpov, S.Y.; Binder, M.; Galler, B.; Schiavon, D. Spectral dependence of light extraction efficiency of high-power III-nitride light-emitting diodes. Phys. Status Solidi RRL 2015, 9, 312–316. [Google Scholar] [CrossRef]
- SiLENSe—Software Tool for Light Emitting Diode (LED) Bandgap Engineering. Available online: http://www.str-soft.com/products/SiLENSe/index.htm (accessed on 4 March 2018).
- Watson-Parris, D.; Godfrey, M.J.; Dawson, P.; Oliver, R.A.; Galtrey, M.J.; Kappers, M.J.; Humphreys, C.J. Carrier localization mechanism in InxGa1−xN/GaN quantum wells. Phys. Rev. B 2011, 83, 115321. [Google Scholar] [CrossRef]
- Tanner, D.P.; Caro, M.A.; O’Reilly, E.P.; Schulz, S. Atomistic analysis of the electronic structure of m-plane InGaN/GaN quantum wells: Carrier localization effects in ground and excited states due to random alloy fluctuations. Phys. Status Solidi B 2016, 253, 853–860. [Google Scholar] [CrossRef]
- Jones, C.M.; Teng, C.-H.; Yan, Q.; Ku, P.-C.; Kioupakis, E. Impact of carrier localization on recombination in InGaN quantum wells and the efficiency of nitride light-emitting diodes: Insight from theory and numerical simulations. Appl. Phys. Lett. 2017, 111, 113501. [Google Scholar] [CrossRef]
- Shahmohammadi, M.; Liu, W.; Rossbach, G.; Lahourcade, L.; Dussaigne, A.; Bougerol, C.; Butté, R.; Grandjean, N.; Deveaud, B.; Jacopin, G. Enhancement of Auger recombination induced by carrier localization in InGaN/GaN quantum wells. Phys. Rev. B 2017, 95, 125314. [Google Scholar] [CrossRef]
- Tan, C.-K.; Sun, W.; Wierer, J.J., Jr.; Tansu, N. Effect of interface roughness on Auger recombination in semiconductors quantum wells. AIP Adv. 2017, 7, 035212. [Google Scholar] [CrossRef]
- Funato, M.; Kawakami, Y. Excitonic properties of polar, semipolar, and nonpolar InGaN/GaN strained quantum wells with potential fluctuations. J. Appl. Phys. 2008, 103, 093501. [Google Scholar] [CrossRef] [Green Version]
- Nippert, F.; Technische Universität Berlin, Berlin, Germany. Personal communication, 2018.
Figure 1.
Experimental Shockley-Read-Hall recombination coefficients as a function of emission wavelength of polar LEDs grown on different substrates.
Figure 1.
Experimental Shockley-Read-Hall recombination coefficients as a function of emission wavelength of polar LEDs grown on different substrates.

Figure 2.
Averaged square of electron envelope function computed for [0001]-polar and nonpolar SQW LED structures and localization radius (a) and theoretical and experimental B/C ratio of polar SQW LEDs (b) as a function of wavelength. Symbols are data from [20,21]; dashed, dash-dotted, and solid lines in (b) correspond to the electron energy Ee of 26, 80, and 40 meV, respectively. In the plot (a), there is an arrow pointing out to the right vertical axis with the corresponding title. In the plot (b), red, orange, and purple lines are mentioned as “solid”, “dashed”, and “dash-dotted” lines, respectively.

Figure 3.
RRC (a) and ARC (b) of [0001]-polar and nonpolar SQW LED structures as a function of emission wavelength. Symbols are data from [20,21]; dashed, dash-dotted, and solid lines correspond to calculations with mean electron energies of 26, 80, and 40 meV, respectively. Dotted lines show the recombination coefficients reported in [48]. The red, orange, and purple lines are mentioned in the capture as “solid”, “dashed”, and “dash-dotted” lines, respectively.

Figure 4.
Maximum IQE versus emission wavelength. Balls are experimental points summarized in [10]. Solid lines are theoretical estimates for [0001]-polar and nonpolar SQW LED structures, whereas the dotted line indicates the experimental trend in IQE variation at wavelengths longer than 540 nm. Dash-dotted line shows the IQE decrease caused by variation of the intrinsic material properties with the wavelength.

Figure 5.
Experimental Csh/Bsh ratios for blue (445 nm) and green (530 nm) LEDs obtained from the data of [22,52] as a function of temperature. Circles and squares correspond to blue and green LEDs, respectively. Bars indicate the errors originating from uncertainty in the Q-factor evaluation. Lines drawn for eyes indicate the experimental trends.

© 2018 by the author. Licensee MDPI, Basel, Switzerland. This article is an open access article distributed under the terms and conditions of the Creative Commons Attribution (CC BY) license (http://creativecommons.org/licenses/by/4.0/).
Share and Cite
MDPI and ACS Style
Karpov, S.Y. Effect of Carrier Localization on Recombination Processes and Efficiency of InGaN-Based LEDs Operating in the “Green Gap”. Appl. Sci. 2018, 8, 818. https://0-doi-org.brum.beds.ac.uk/10.3390/app8050818
AMA Style
Karpov SY. Effect of Carrier Localization on Recombination Processes and Efficiency of InGaN-Based LEDs Operating in the “Green Gap”. Applied Sciences. 2018; 8(5):818. https://0-doi-org.brum.beds.ac.uk/10.3390/app8050818
Chicago/Turabian StyleKarpov, Sergey Yu. 2018. "Effect of Carrier Localization on Recombination Processes and Efficiency of InGaN-Based LEDs Operating in the “Green Gap”" Applied Sciences 8, no. 5: 818. https://0-doi-org.brum.beds.ac.uk/10.3390/app8050818
Note that from the first issue of 2016, this journal uses article numbers instead of page numbers. See further details here.