Fractal Behavior of Particle Size Distribution in the Rare Earth Tailings Crushing Process under High Stress Condition

1
School of Resources and Environment Engineering, Jiangxi University of Science and Technology, Ganzhou 341000, China
2
Department of Biomedical and Dental Sciences and Morphofunctional Imaging, University of Messina, Via Consolare Valeria c/o A.O.U. Policlinico “G. Martino”, I, 98125 Messina, Italy
*
Authors to whom correspondence should be addressed.
Appl. Sci. 2018, 8(7), 1058; https://0-doi-org.brum.beds.ac.uk/10.3390/app8071058
Submission received: 26 April 2018
/
Revised: 23 June 2018
/
Accepted: 25 June 2018
/
Published: 28 June 2018
(This article belongs to the Special Issue Fractal Based Information Processing and Recognition)
Abstract
:To disclose the fractal transformation mechanism of the size distribution of rare earth tailing particles, this paper utilizes the side confined uniaxial compression test to study the evolution rule of the particle size distribution of the rare earth tailing and the particle breakage features under the high stress condition. The fractal behavior of the particle size distribution in the crushing process is studied based on the fractal model and the particle size distribution. The experimental results show that, under the high stress condition, the particle size distribution tends towards fractal distribution due to the particle breakage of the rare earth tailing. The crushing process is closely related to the breakage amount of the particles and can be described with the increased fractal dimension. Although the initial distribution and particle size of the rare earth tailings are different, the measured data of the particle size distribution with the fractal dimension greater than 2.2 shows fairly strict self-similarity, and this value can be taken as the lower limit value of the fractal dimension when the particle size distribution tends towards fractal distribution. When the particle size distribution becomes a fractal distribution due to the particle breakage, the ratio between the volumetric strain and the relative breakage rate remains constant and is slightly affected by the initial distribution uniformity and particle size.
1. Introduction
Ionic type rare earth is one of the most precious and rare types of ore in the world and is found in the strong mantle rock of shallow ground [1]. At present, the in situ leaching mining method is a mature mining technology, which takes advantage of the chemical replacement reaction of leaching solutions in the process of orebody seepage to achieve the recovery of rare earth cations and thus realizes the extraction of rare earth elements [2]. The tailings of ionic type rare earth leached in situ as a kind of typical granular soil is very important in the rare earth mine repair works. The particle breakage of the tailings under the action of external forces changes the particle size distribution of the tailings, which affects its mechanical property seriously. The particle size distribution of soil is mainly reflected by the particle breakage amount [3].
Many experimental results show that the soil particles of any initial distribution will tend to be of a self-similar fractal distribution as the degree of particle fragmentation deepens [4,5]. Many scholars have proposed different breakage quantification methods through following up the variation of particle size distribution during the crushing process [6,7]. Among them, the concept of relative breakage proposed by Hardin [6] is widely accepted, which divides the particle size distribution of soil into initial distribution before breakage, current distribution after breakage and limit distribution when the breakage terminates. In addition, Hardin [6] put forward the particle breakage quantification index through comparing the state of current distribution with that of the limit distribution. Therefore, the definition of this index is built on the assumption that the particle breakage will eventually stop and reach a limit distribution. Thus far, relevant scholars have carried out many experimental studies to verify that the particle breakage of the granular soil will not last forever, and have conducted ring-shear test under high strain on the breakable calcareous sand, with the purpose to increase the particle breakage amount as much as possible and achieve limit distribution. The limit distribution obtained by these experiments is the fractal distribution without exception [8,9,10,11]. However, these experiments neglected the survey on the particle size distribution during the crushing process, so that the evolutionary rule of the fractal distribution is not well understood. Mandelbrot (1982) introduced the fractal geometry to describe the dimensional properties of irregular shapes, which are produced in such a way that they cannot be described by Euclidean geometry [12]. Although this concept could describe complex natural phenomena by a simple exponential function, it failed to describe the distribution of crushing or comminution products [13]. In addition, it is known that the single linear Gates–Gaudin–Schuhmann (GGS) model is in some cases unable to fully describe the particle size distribution of comminution products. To overcome this shortcoming, piecewise regression analysis was used to predict the size distributions derived, after grinding for various periods four mono-sized fractions of quartz and marble in a laboratory ball mill. Thus, the existing relationships between energy input and particle size distribution were improved by considering the effects of the feed size and material type. The new relationships obtained can be used for a more accurate estimation of the required energy for breakage [14]. Particle size distributions (PSDs) are often rendered as cumulative functions, either as number of particles larger than a certain diameter, or as mass smaller than a certain diameter. The fractional exponent of the number/mass-size power law has been interpreted as the fractal dimension of the distribution [13]. An application of PSD in comminuted chromites by means of the fractal mass distribution is presented [15].
Some scholars [16,17] believe that, as the particle breakage amount increases, the soil particles of any initial distribution will tend towards a kind of self-similar fractal distribution and there has been a general consensus about this assumption. However, there is no clear report on the targeted research on the fractal behavior of the particle size distribution during the crushing process. Because The change of the particle size distribution caused by particle breakage is dynamic, it is difficult to establish a quantitative relationship between the change of the particle size distribution and its mechanical behavior [17]. The potential value of this research is that, if the fractal behavior of particle size distribution in the crushing process is recognized, the fractal model can be utilized to predict the change of the particle size distribution. The fractal behavior can be connected to the mechanical response of the soil and included into the study on the constitutive relation which considers the particle breakage. Considering the particle breakage, some scholars have described the particle size distribution at the critical state as the fractal distribution, which is used to study the constitutive model of the granular soil [18,19].
During the continuous crushing process of the initially uniformly distributed granular soil, there is an evolutionary process that tends towards fractal distribution. In this paper, the side confined uniaxial compression test under high stress conditions is carried out to investigate the rare earth tailings of different initial distributions. The fractal characteristics of the size distribution under different stress level is investigated and the fractal behavior of the particle size distribution in the process of rare earth tailings breakage is studied.
2. Fractal Model
The fractal relation of the soil particle size distribution is generally defined using the relationship between the cumulative number of the soil particles with the grain size [16]. However, the particle size distribution of soil is usually expressed as the quality of soil particles at different particle size intervals and within certain particle size range and is obtained using the screening method or equivalent particle size method. Within the particle size range investigated, dM and dm are set as the maximum grain size and the minimum grain size respectively, di is the diameter of the ith sieve pore (i = 1, 2, …, n). If the difference of relative density and shape of the soil particles in each grain grade is neglected, Tyler et al. [20] put forward a fractal model of particle size distribution expressed with the relationship between the cumulative mass and particle size of the soil particles:
where δ describes the particle size, M(δ < di) is the cumulative mass of the soil particles whose grain size is smaller than di, MT is the total mass of soil particles and D is the fractal dimension.
M(δ < di)/MT = (di/dM)3−D
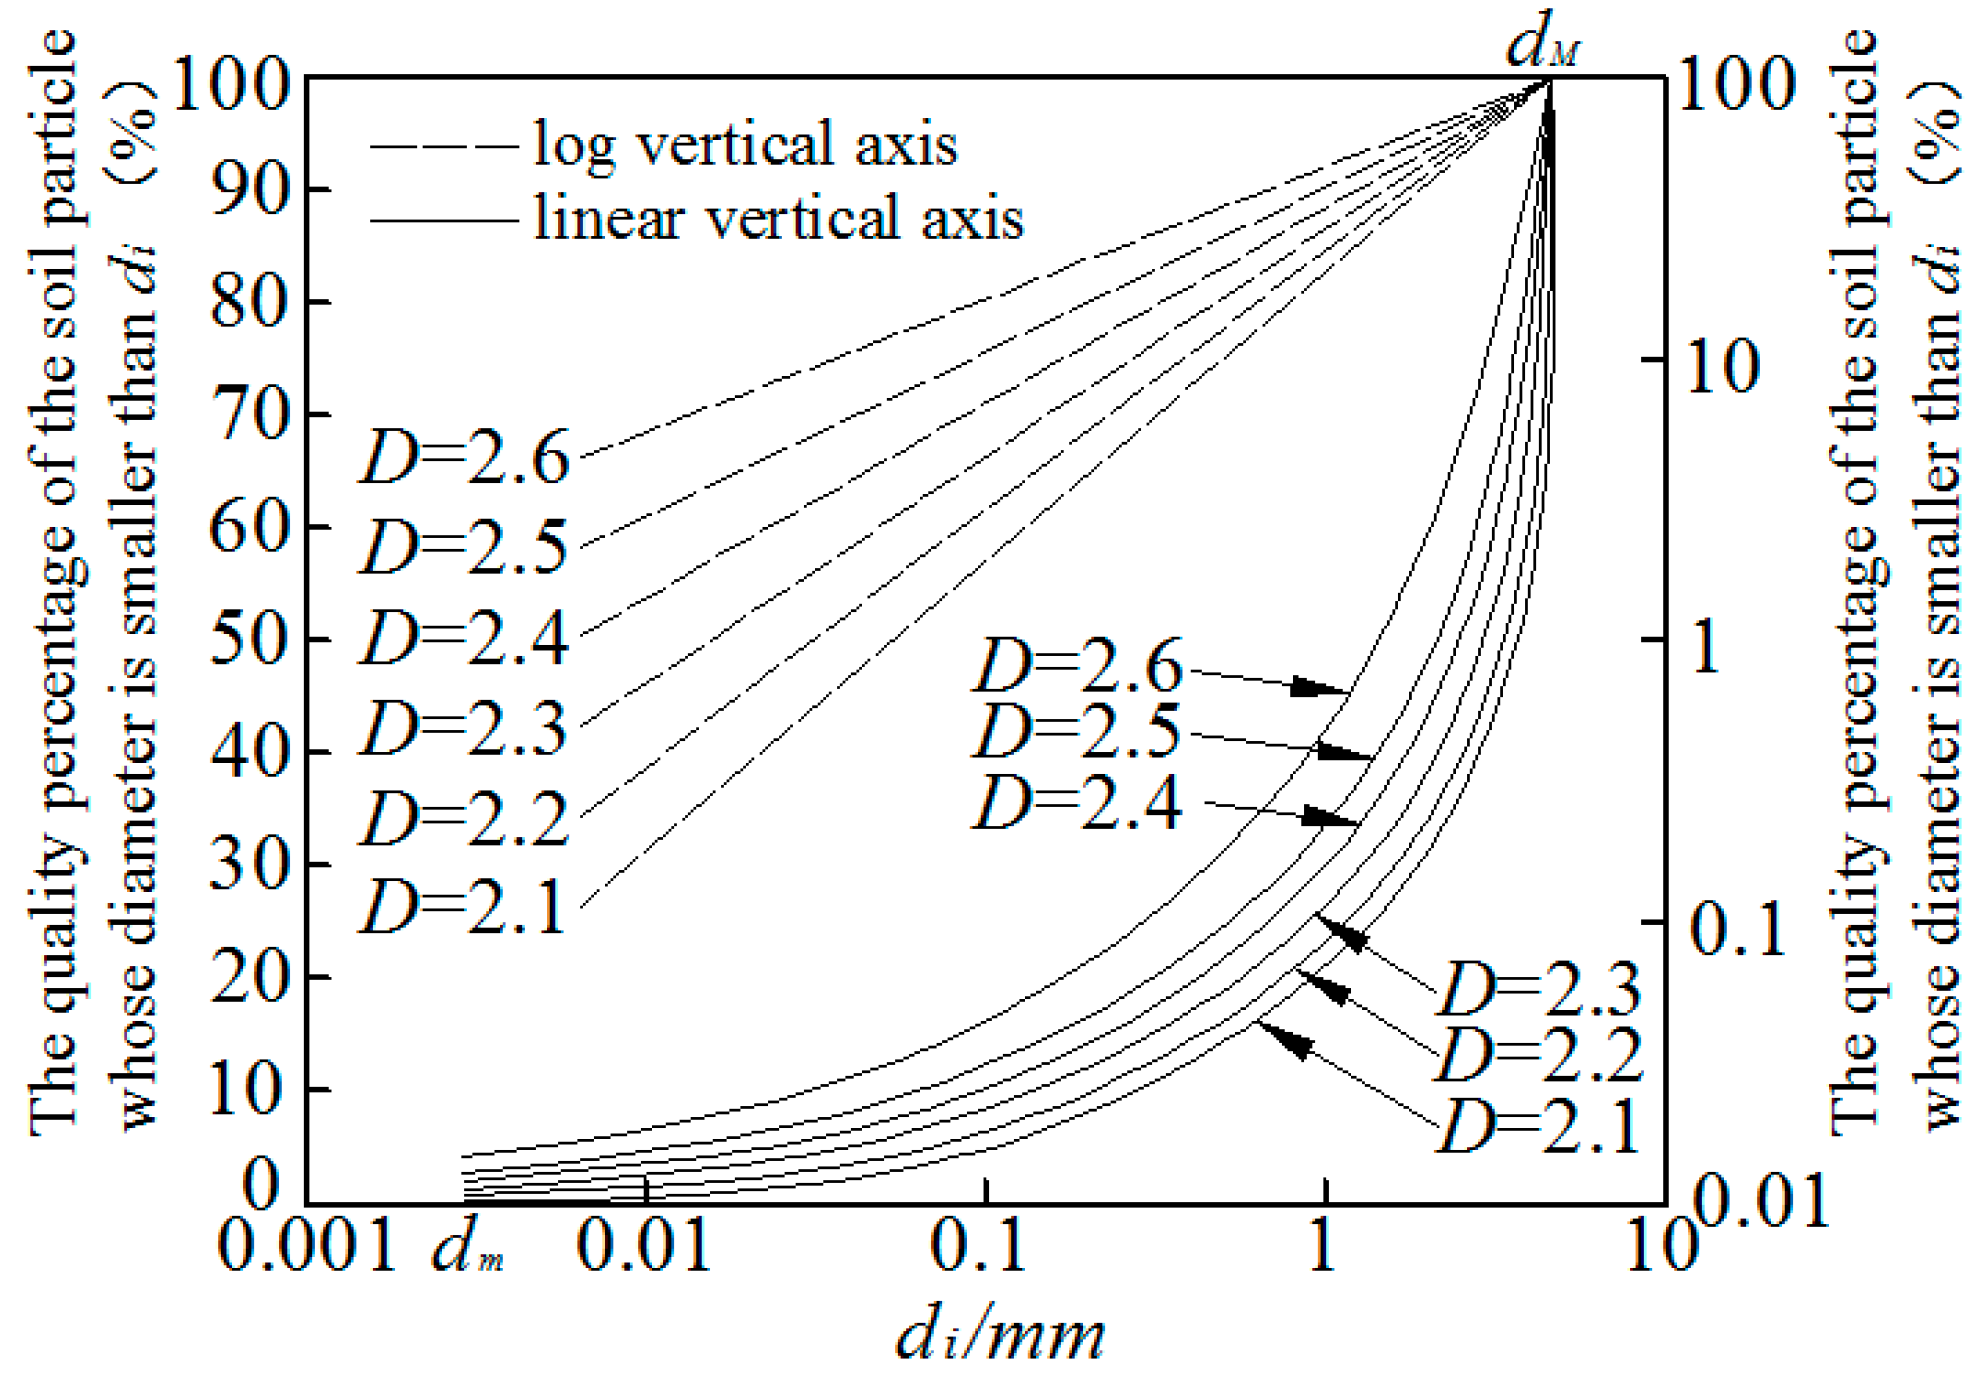
The fractal model represented by Equation (1) has been widely used in the particle size distribution of the soil. The left side of the equation refers to the quality percentage of the soil particle whose diameter is smaller than di and it is consistent with the frequently used grain size distribution curve. As shown in Figure 1, dM and dm are given. Equation (1) is used to draw the particle size distribution curve of different D values on the semi-logarithmic and double-logarithmic coordinate axes and strictly self-similar particle size distribution curve can be seen. It is a cluster of concave upward curves on the semi-logarithmic coordinate axis and a cluster of strait lines on the double-logarithmic coordinate axis. In addition, the larger the value of D is, the higher the content of fine materials in the particle size distribution is. This paper uses Equation (1) to describe the fractal relationship of the particle size distribution during the particle crushing process.
3. Relative Breakage Rate
The definition of relative breakage rate Br is shown in Figure 2. Hardin [6] defined the area A surrounded by the grain size distribution curve and the 0.074 mm grain size breaking line as the breakage potential, i.e., the particle crushing potential. He also defined the difference of the breakage potential before the particle crushing and after the particle crushing as breakage Bt. Br is the ratio between Bt and Bp, the breakage potential before the crushing. Since Hardin confines the grain breakage in the range of d ≥ 0.074 mm (d refers to the diameter of the particle) and assumes that, when the crushing terminates, the diameter of all the particles will be smaller than 0.074 mm. Therefore, a uniformly distributed particle system is formed with the diameter smaller than 0.074 mm.
Much experimental evidence shows that the particle breakage is not limited to the particles whose diameter is larger than 0.074 mm. In reality, with the rise of the load, the particle distribution gradually tends towards a self-similar fractal distribution. Based on this, Einav [7] revised the limit distribution when the crushing terminates into a fractal distribution, Fu(d) = (d/dM)α, and put forward the improvement form of Hardin index, which is shown in Figure 2.
In Figure 2, α = 0.4, which is obtained according to the experimental results of Coop et al. Apparently, Equation (1) and the fractal distribution result expressed by Fu(d) is consistent, and D = 3 − α = 2.60. Hardin indicators have been widely used. In recent years, the Einav indicators are also used frequently [21,22]. However, the comparison between the two indicators is seldom seen, especially in terms of the rule of response of these two indicators to the fractal feature of the particle size distribution and the stress–strain appearance. Therefore, this paper utilizes these two indicators to quantify the particle breakage and conducts application comparison.
4. Soil Sample and Test Method
The soil sample used in this experiment is the tailings of ionic type rare earth leached in situ, which is very important in rare earth mine repair works. The SiO2 content in rare earth tailings is 79.48–80.94%, which is measured with XRD, suggesting that its major component is quartz and a small amount of feldspar [1,2]. The relative density of the rare earth tailings was 2.72 after test [1,2]. After the proper amount of rare earth tailings is dried, the sample is prepared using the sieving method. Referring to the relevant test experience of similar soil sample, the breakage degree of the equally distributed soil particles is more serious compared with that of the non-evenly distributed soil particles under the same stress level. Therefore, to increase the particle breakage amount and investigate the impact of initial particle size on breakage, the soil samples with a particle size range of 2–5 mm (T1 sample) and 0.5–2 mm (T2 sample) were prepared. In T2 sample, the particles with the diameter of 0.5–1 mm accounts for 50% and the particles with the diameter of 1–2 mm accounts for 50%. To investigate the effect of initial distribution uniformity on breakage, experiment is carried out to the natural graded soil sample (T3 Sample) whose particle size is within the range of 0.074–5 mm. The initial particle size distribution of the soil sample is shown in Figure 3 and Table 1.
The side confined uniaxial compression test adopts self-made device, which is the stress control type and allows for a vertical compression stress up to 500 MPa to the test sample. The diameter of the pressure chamber of the device is 79.8 mm, and the height is 20 mm. The chamber is made of the steel mold with a diameter of 285 mm and a thickness of 120 mm. The sample in the pressure chamber is laterally restrained by the steel mold with thick walls. The rigidity of steel mold is very strong, so even under very large compressive stress, the deformation of the device is still negligible [23]. The vertical load of the sample is provided by a set of 1000 KN tester. The load is imposed by a steel piston whose diameter matches the pressure chamber and is measured by the external pressure sensor installed at the top of the piston.
The 150 g rare earth tailings are taken as the sample. Sand rain technology is adopted for loading the sample (i.e., maintaining a constant drop distance when filling the sand through a funnel). The samples maintained the same initial dry density (1.65 g/cm3) and void ratio (0.75) for subsequent comparison. Before loading, the piston was painted with silicon grease to reduce the impact of side friction. Two dial indicators were installed symmetrically at each side of the piston to measure the vertical compression displacement of the sample and the average value of the measuring result was taken as the vertical deformation of the sample.
To investigate the grain breakage condition under different stress levels, nine levels of vertical stress were preset: σv = 0.8, 1.6, 3.2, 6.4, 12.8, 25.6, 51.2, 102.4, and 204.8 MPa. Gradation loading was adopted and the load increment ratio was 1.0, i.e., the loading gradation was 0.1, 0.2, 0.4, 0.8, 1.6, 3.2, 6.4, 12.8, 25.6, 51.2, 102.4 and 204.8 MPa. The load kept constant for each gradation loading. The next level of loading was not carried out until the measured deformation terminated and then terminated when the selected stress was achieved. The vertical strain under each stress level was calculated based on the initial height of the sample and the measured vertical deformation. It should be pointed out that, in the uniaxial side confined compression test, the volumetric strain εv, as proposed below, was the vertical strain.
When the experiment terminated, the samples were carefully taken out and grading analysis was carried out. To investigate the grain breakage condition in a wider particle size range, the particle size distribution data were obtained through combining two kinds of sizing test, i.e., the soil particles with a grain size of over 0.074 mm were obtained through screen classification and the soil particles with a grain size of less than 0.074 mm were measured by the Mastersizer 2000 laser particle size analyzer produced by Malvern of the UK (Measures materials from 0.02 µm to 2000 µm). The soil particle with a minimum particle size of 1.1 μm was measured. According to the obtained particle size distribution data, the relative breakage rate of samples under various stress levels was analyzed using the indexes defined by Hardin [6] and Einav [7]. To analyze the fractal behavior of the particle size distribution under different strain levels of the samples, the fractal dimension was estimated based on Equation (1) and the measured data of the particle size distribution. The specific method is: plotting using the log value of M(δ < d)/MT and d/dM and carrying out linear regression analysis. If the measured data have linear relationships and the slope is k, D = 3 − k.
5. Results and Analysis
5.1. Fractal Behavior of Particle Size Distribution during the Crushing Process
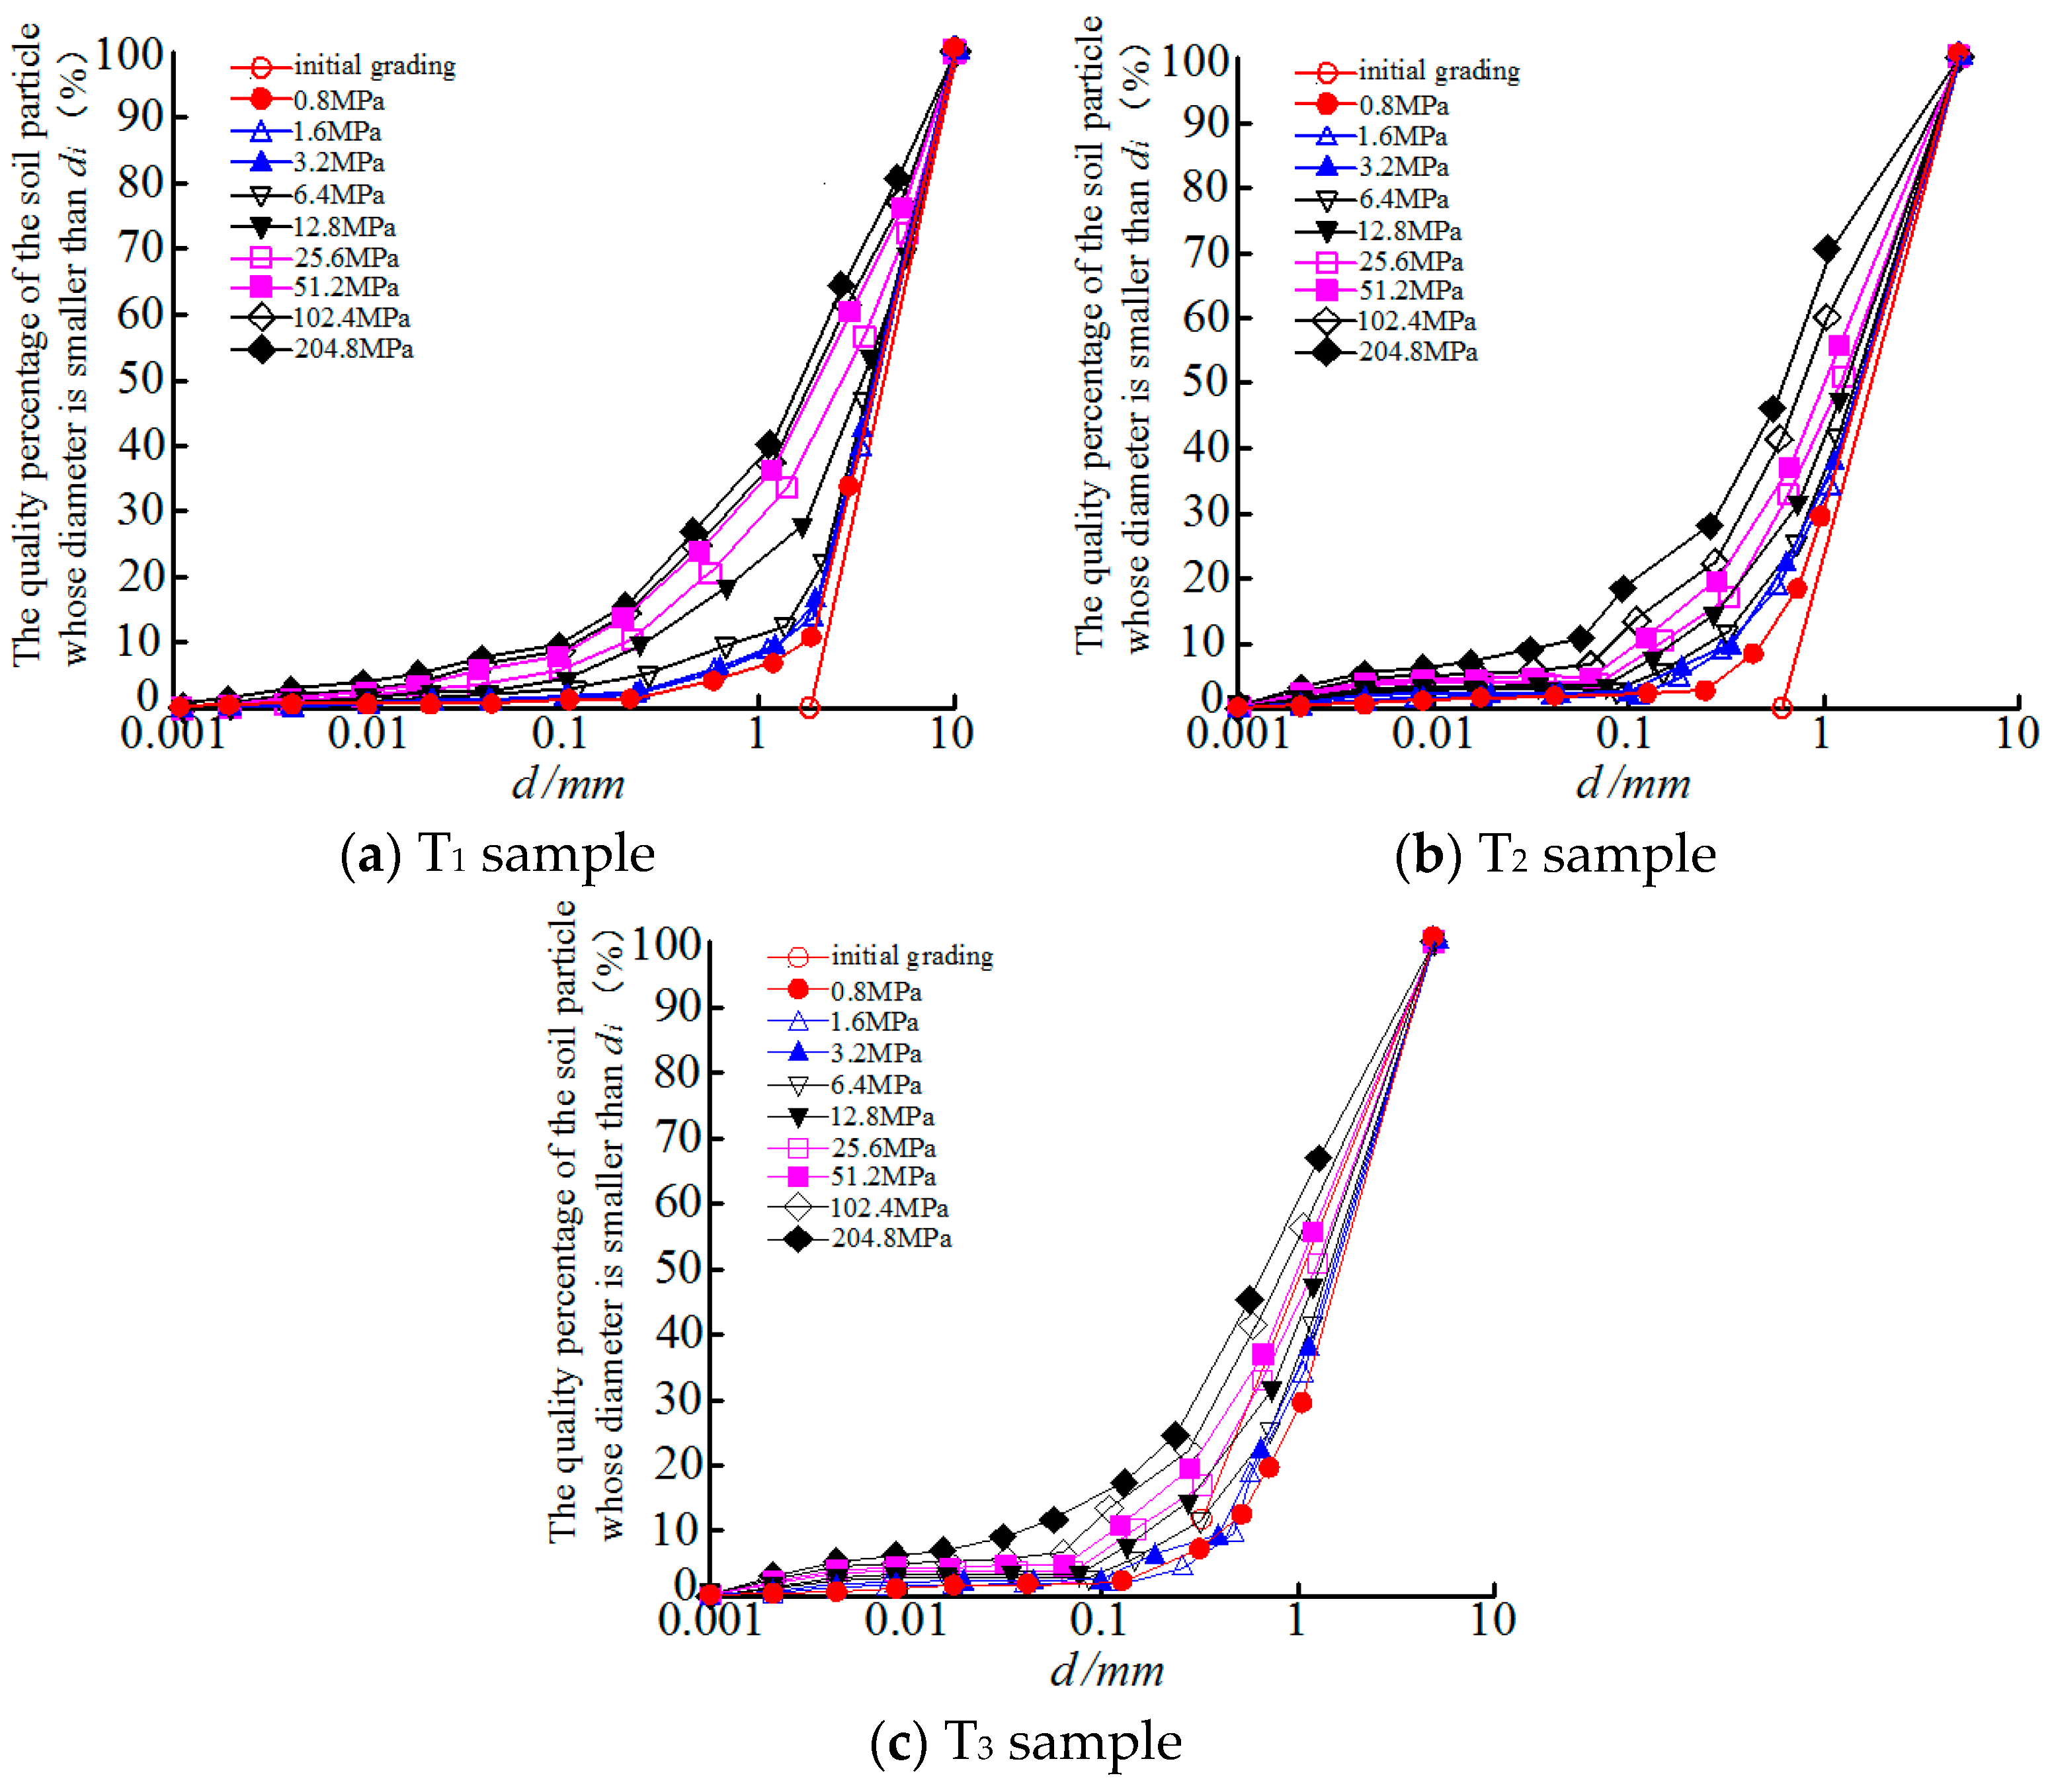
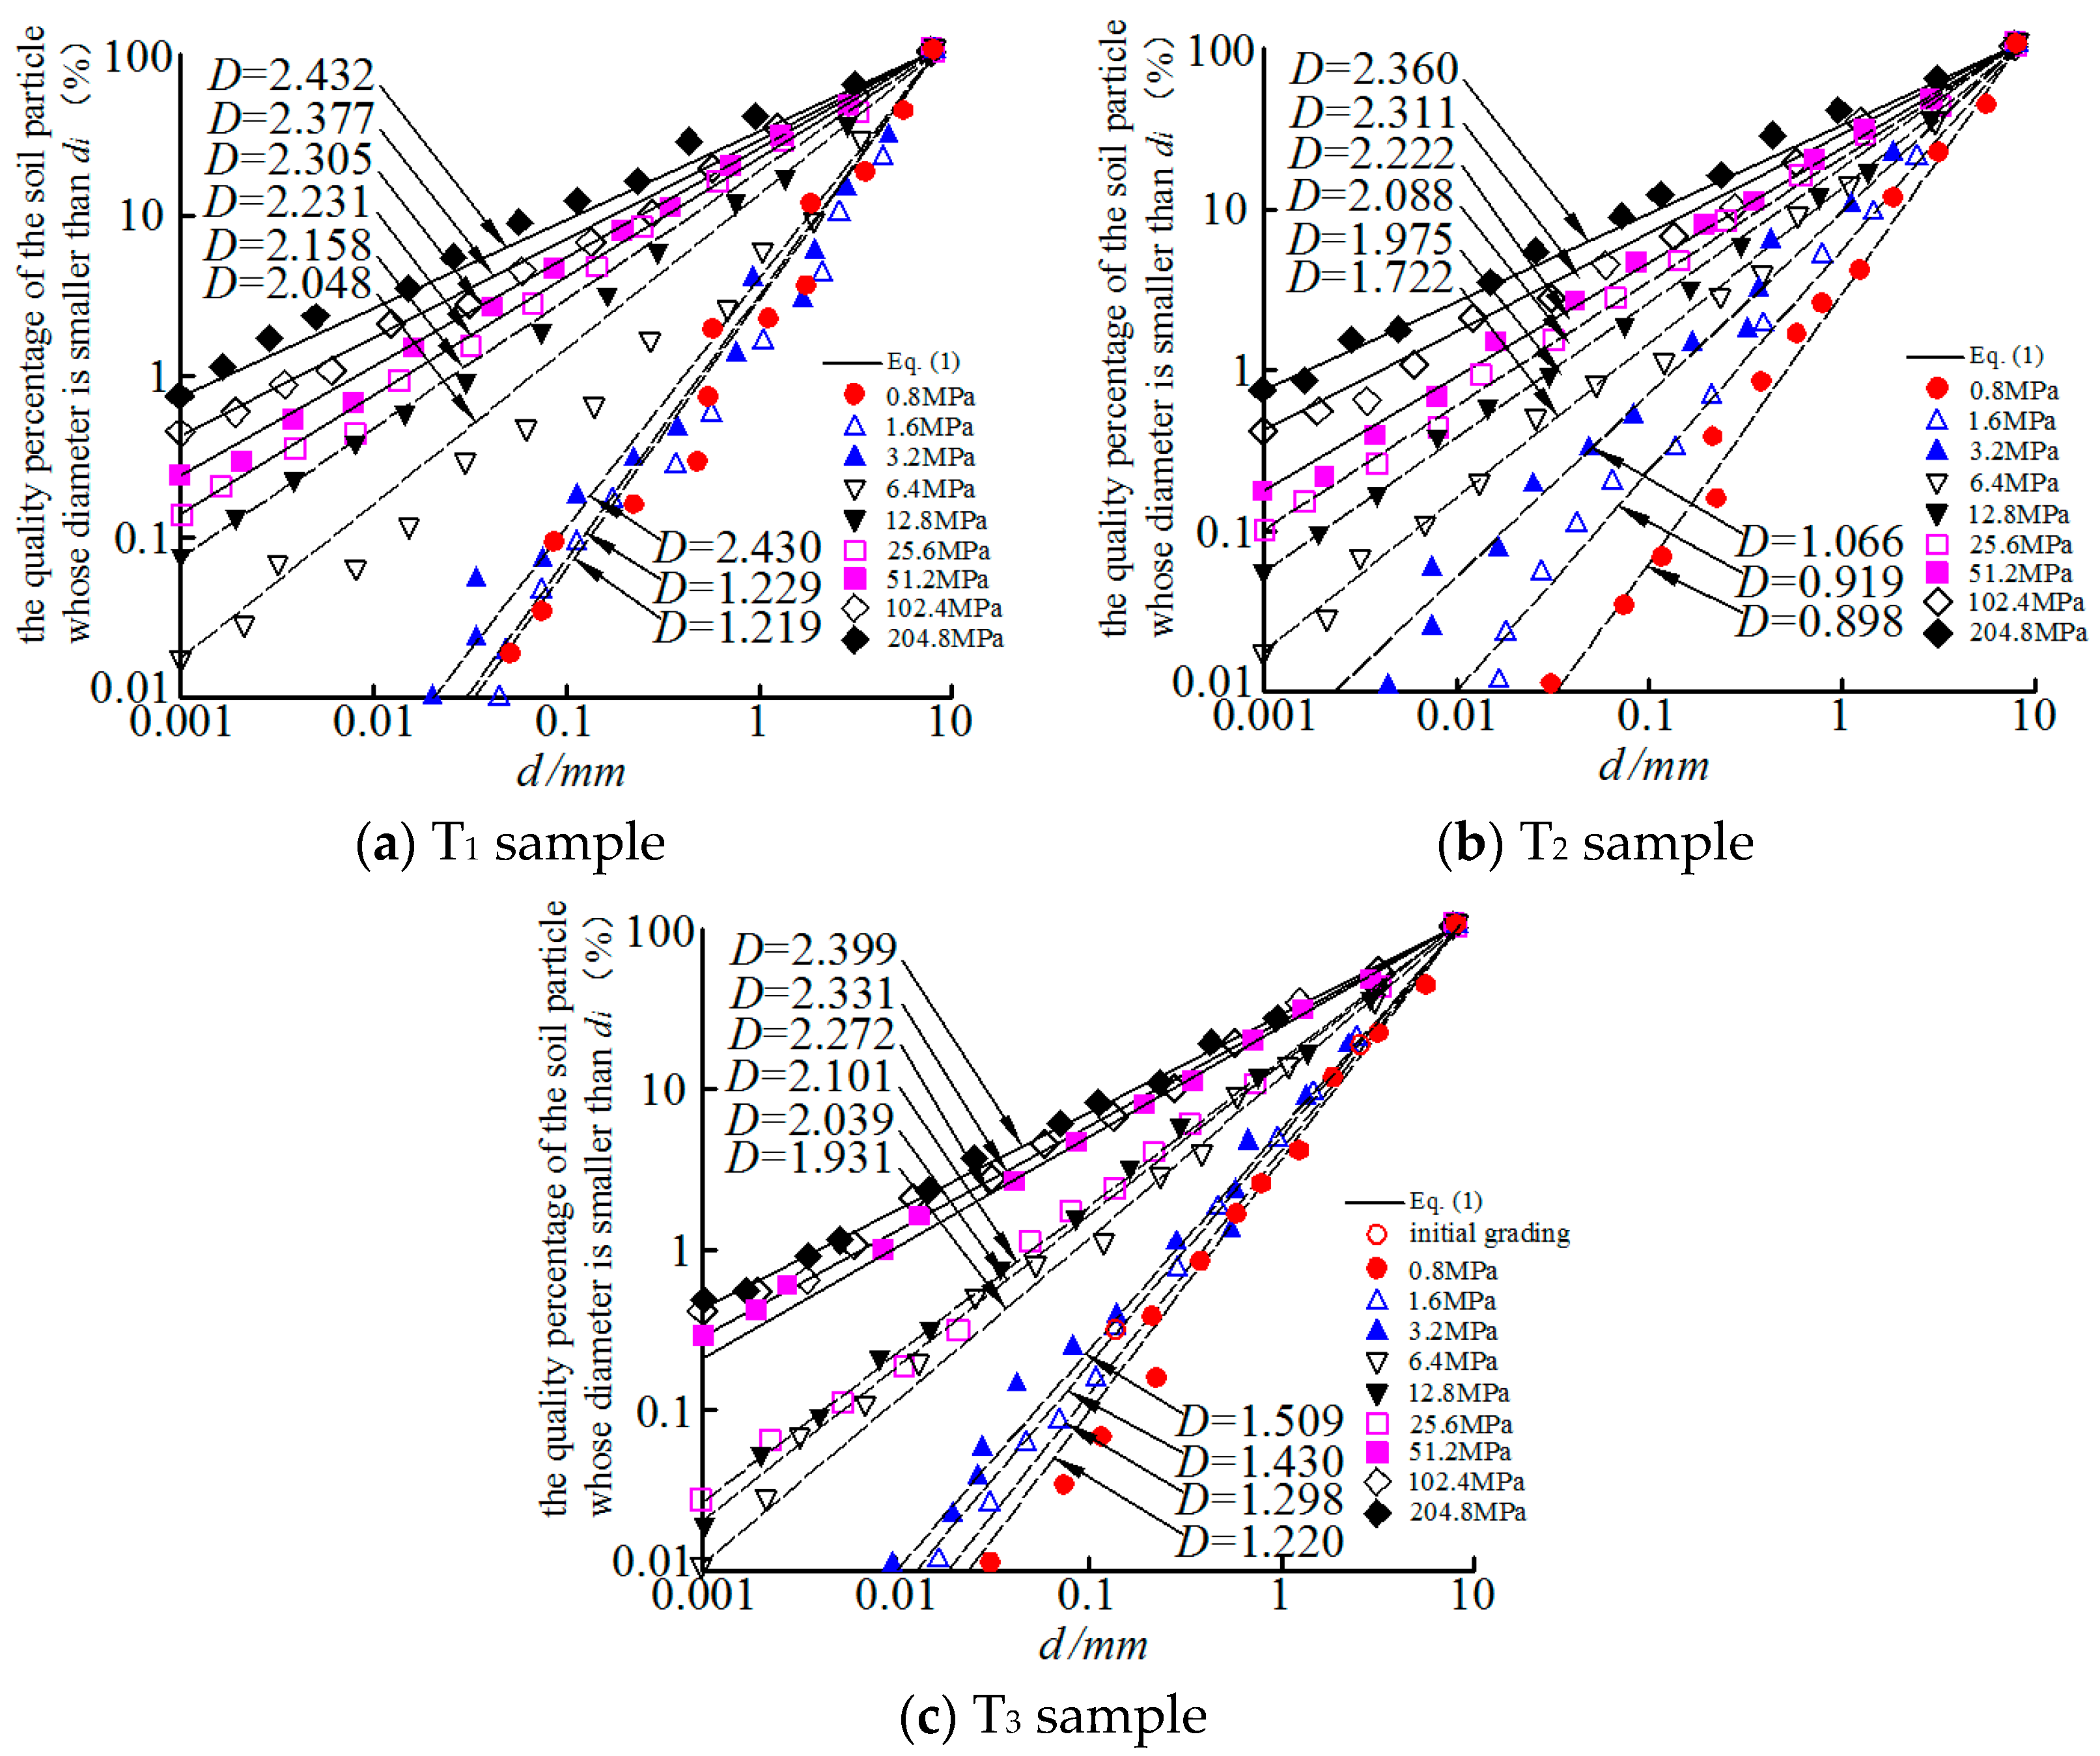
Figure 4 shows the particle size distribution curve of each sample at each stress level. In Figure 4, a small number of fine particles were produced due to the crushing in sample T1 and T3 with relatively large initial particle size at the minimum stress level of 0.8 MPa. However, for T2 sample with relatively small initial particle size, this kind of situation occurred when the stress level is 1.6 MPa. For the initially evenly distributed T1 sample and T2 sample, with the rise of the stress level, the grain breakage degree intensifies and the samples tend to be unevenly distributed.
In Figure 4, at the highest stress level of 204.8 MPa, although the fine grains produced by crushing increased substantially, most of the initial large particles are retained and did not disappear due to the crushing. This may be explained by the fact that, during the crushing process, the big particles are cushioned by smaller particles around them, which enhances the anti-crushing ability of big particles. Therefore, smaller particles are more likely to be broken. Tsoungui et al. [24] observed the buffering effect through test and numerical simulation, and found that, when the large particles were cushioned, their neighboring small particles were crushed continuously. The fractal behavior of particle size distribution can be preliminarily investigated with the particle size distribution curves in Figure 4.
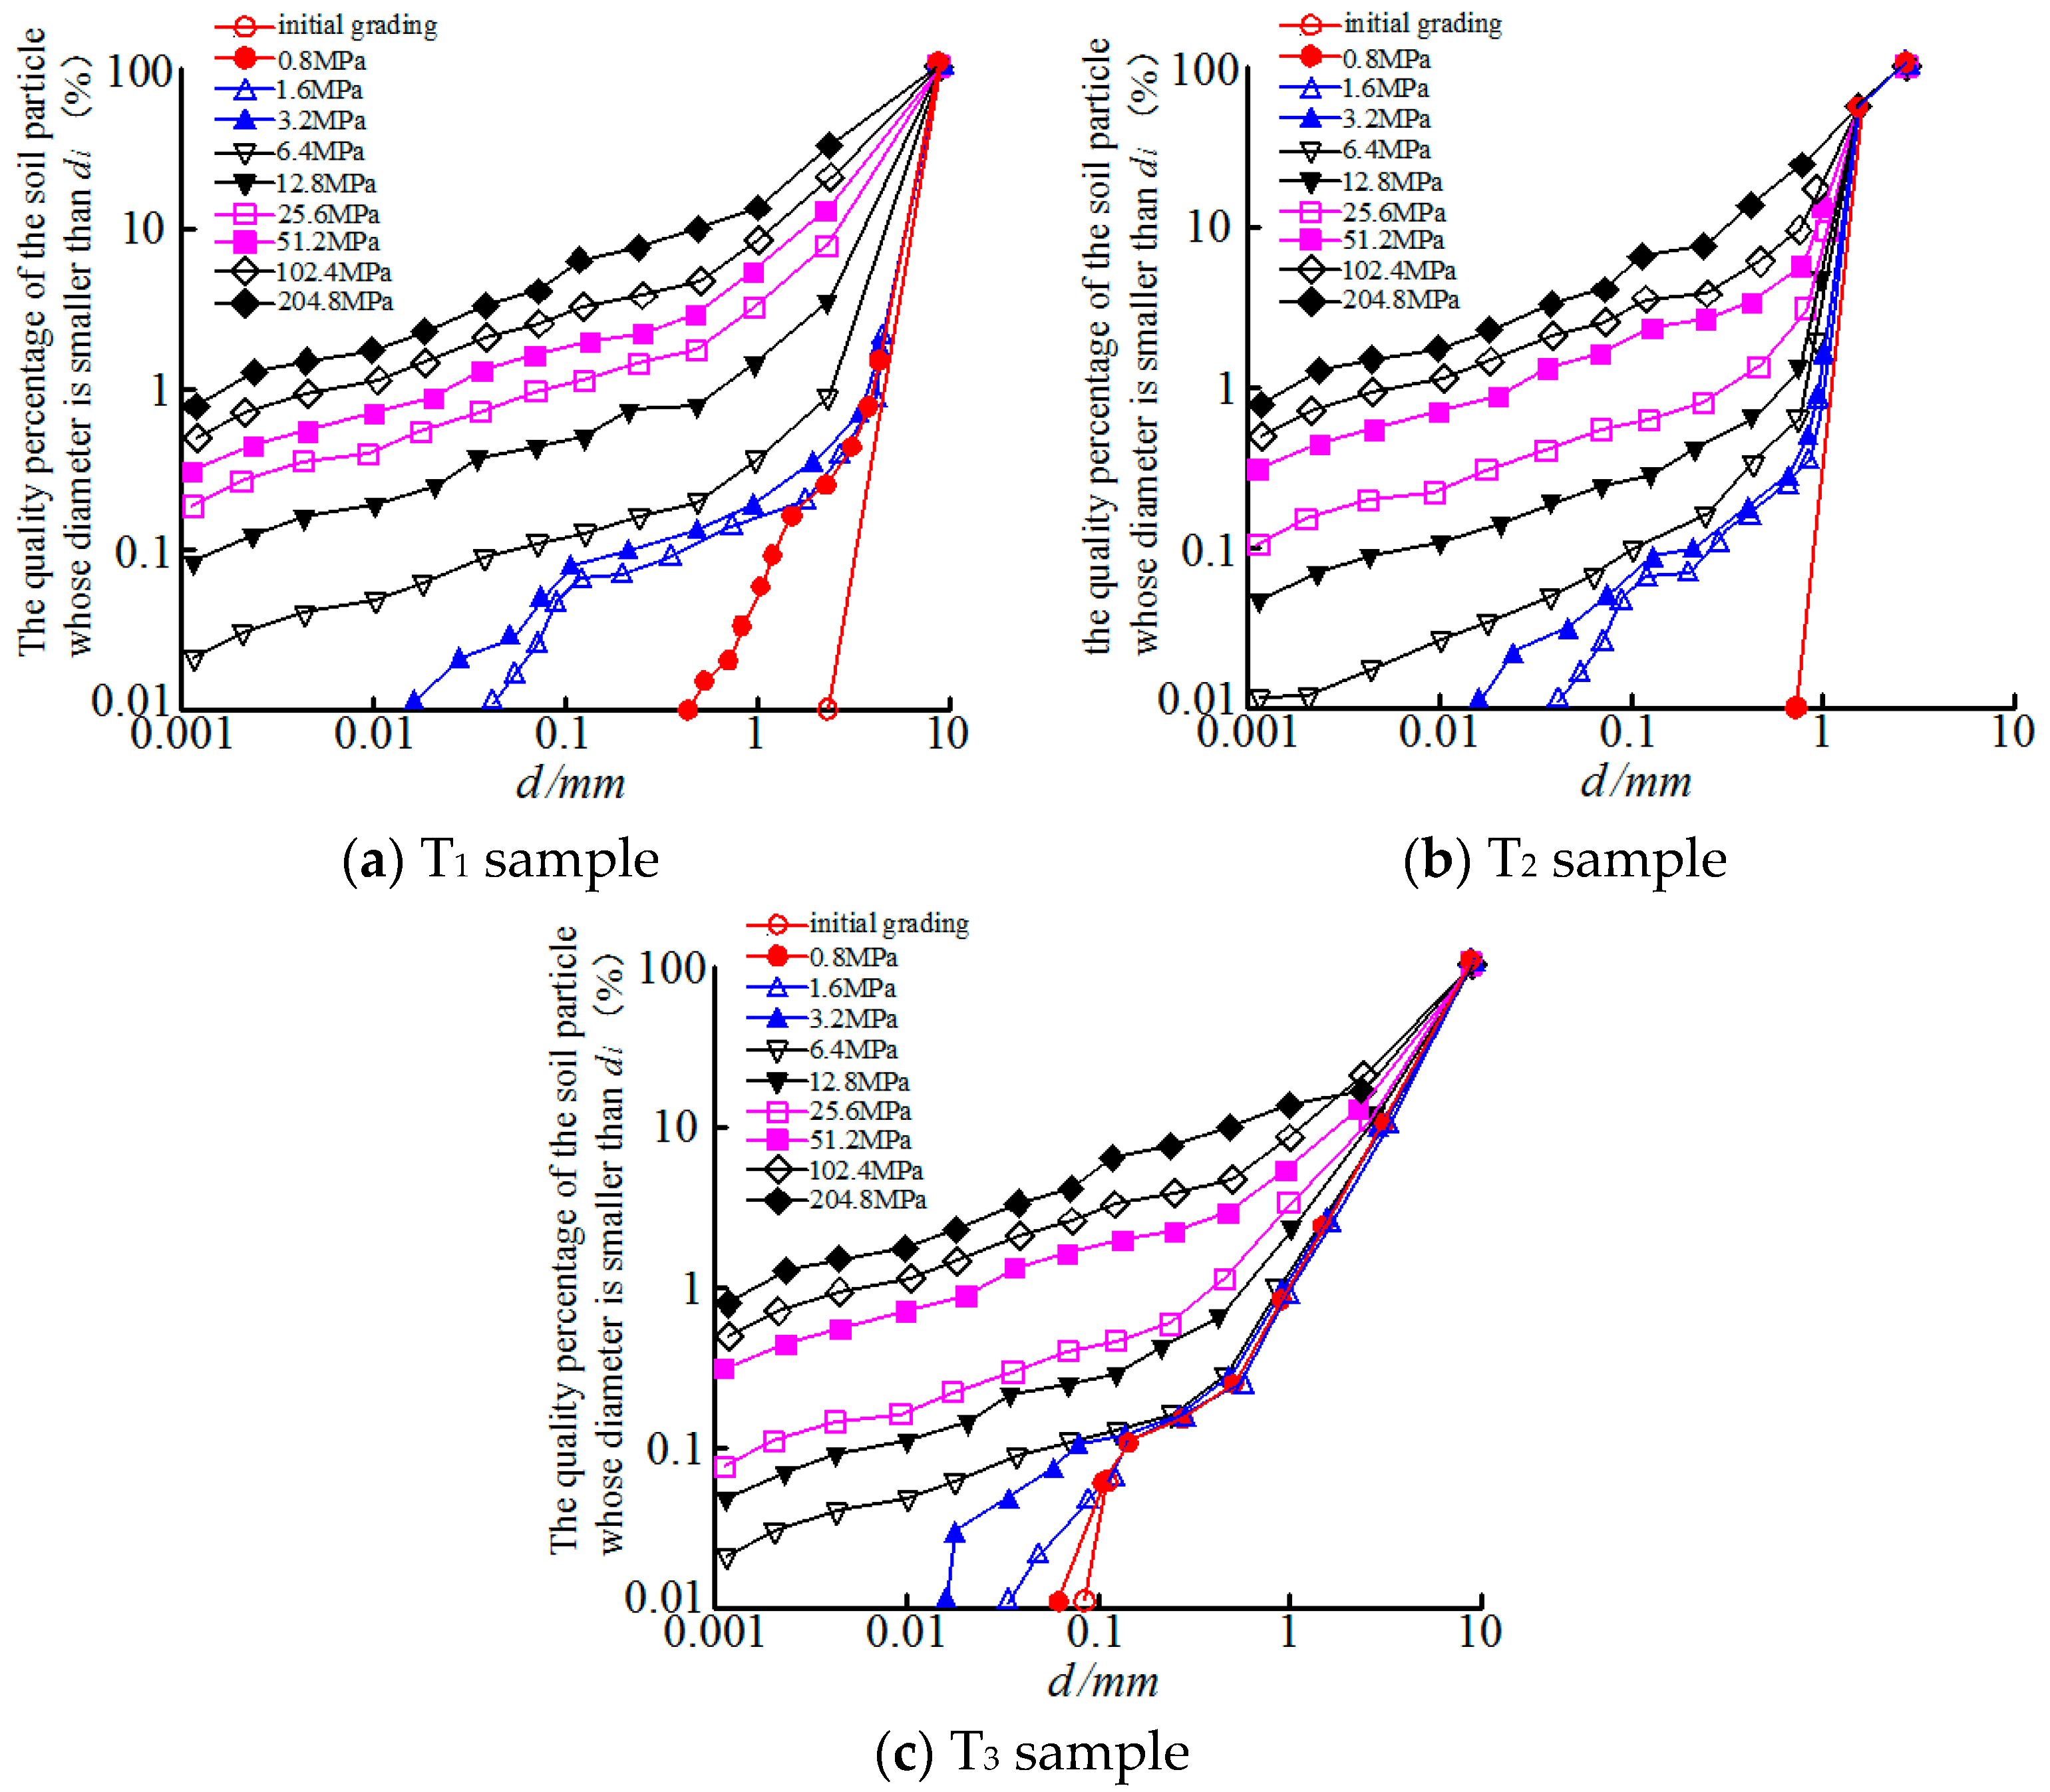
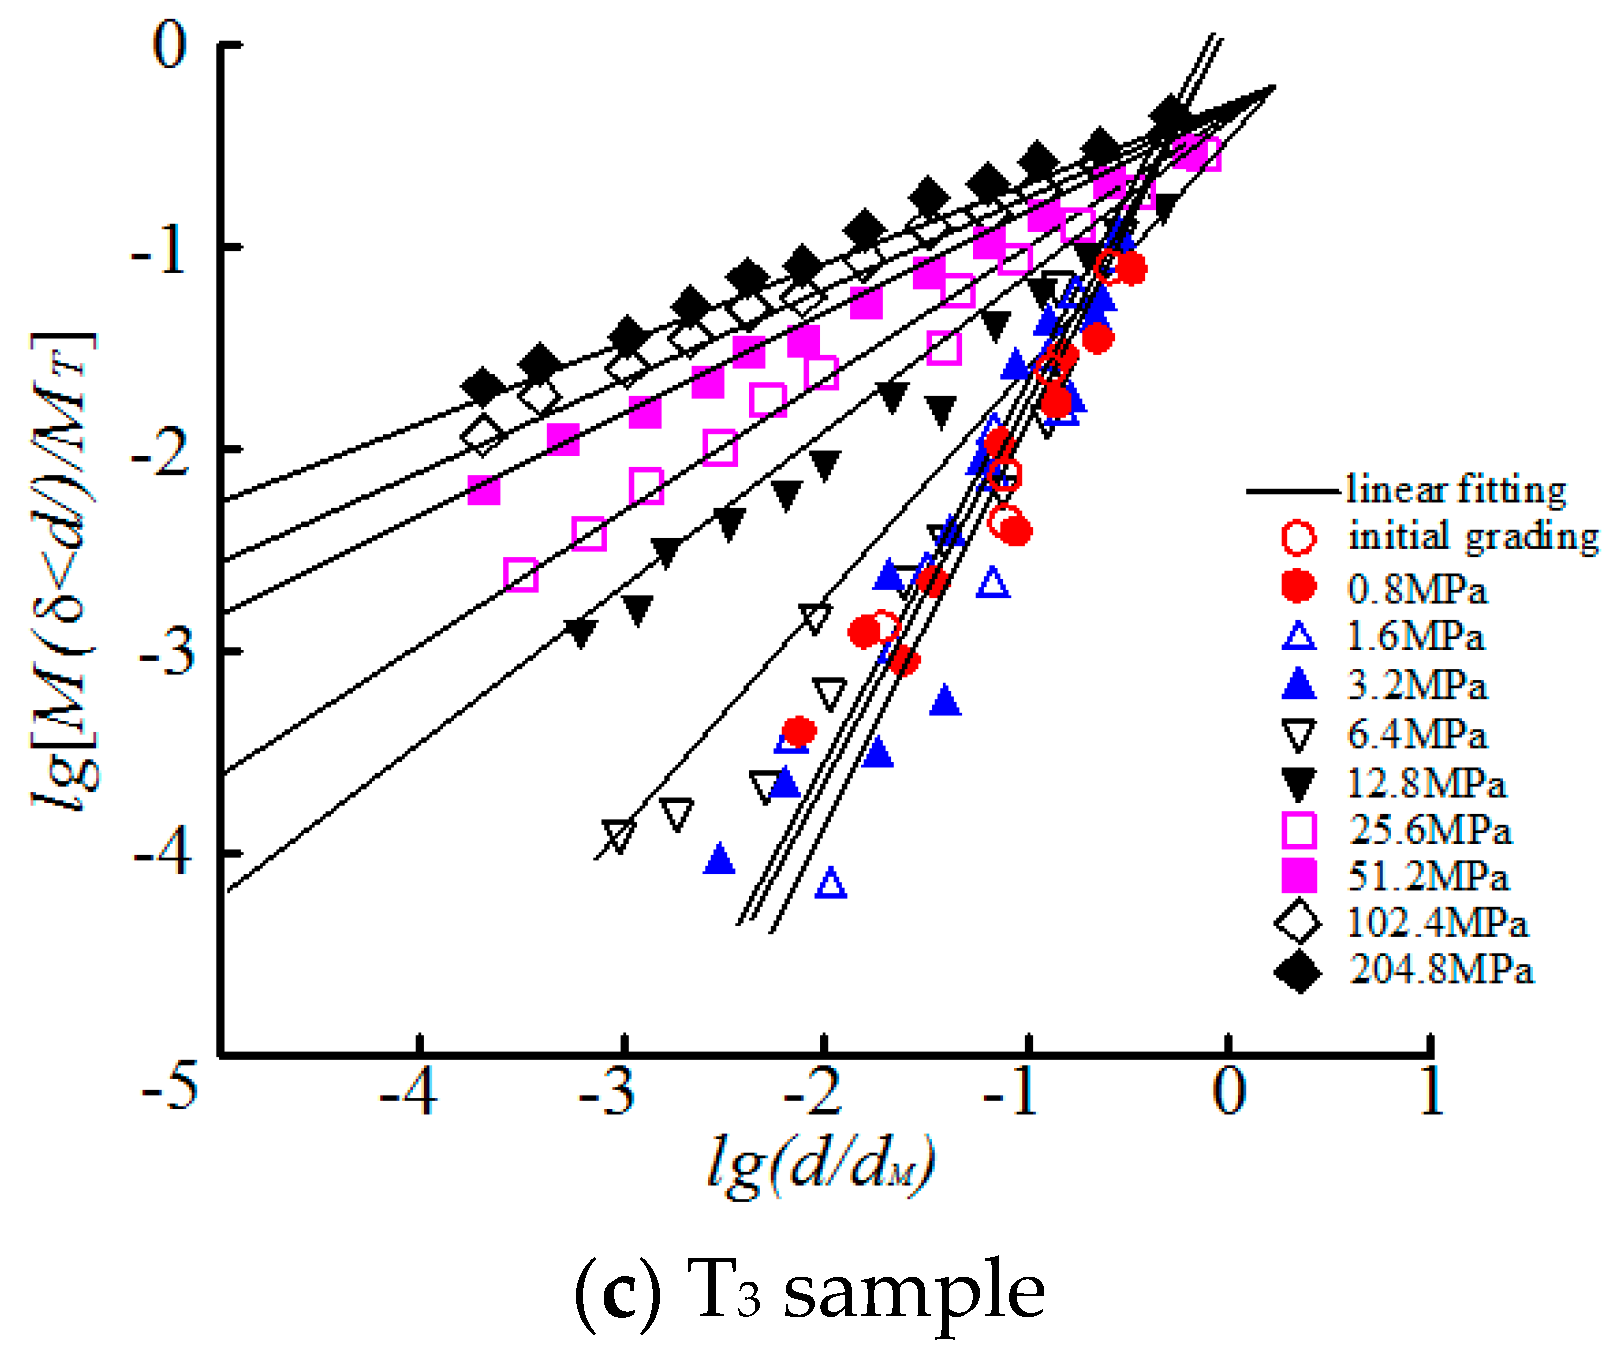
Is represented by the double logarithmic coordinate axis, which is shown in Figure 5. The shape of the particle size distribution curve was observed. It was found that, at the low stress level, the curve shape is similar to that on the semi-log axis, which is of the concave upward shape.
However, with the rise of the stress level, the curve turns straight from bending, and the fractal features are gradually apparent. At high stress level (25.6–204.8 MPa for T1 sample and 51.2–204.8 MPa for T2 sample and T3 sample), the particle size distribution curve is appropriately a straight line, and the fractal features are apparent. During the grain crushing process, the transformation of different initial distribution of the soil particles to the fractal distribution is a gradually changing process. The fractal characteristics of the particle size distribution under each stress level can be deeply learned through carrying out linear regression analysis based on the measured particle size distribution data and Equation (1). The results are shown in Figure 6. The fractal dimension D obtained and corresponding fitted relation coefficient R are listed in Table 2. The value of D rises with the growth of grain breakage. The significance level of self-similarity of particle size distribution data also greatly improves.
The self-similarity of particle size means that, although the grain size is different, the grains all maintain the same crushing probability. Sammis [8] provided the following explanation: the stress distribution of all particles can be maximized with the fractal distribution of the particles. The probability of breakage is not controlled by the particle’s self-strength, but is controlled by the size of its adjacent particles. Once the self-similar fractal distribution is achieved, the particle has the same crushing probability in all directions, so the self-similarity is maintained. However, McDowell et al. [25] held that the crushing probability is not only controlled by the size of adjacent particles, but also related to the number of contact points between particles. The theoretical curve of the particle size distribution is predicted based on the value of D in Table 2 and Equation (1) and a comparison was made between the theoretical data and the measured data of the particle size. The degree of coincidence of the measured data and the strictly self-similar fractal distribution was investigated. It can be seen in Figure 7 that the particle size distribution is represented by the double logarithm axis. Since Equation (1) is a strictly self-similar fractal distribution, the theoretical curve of the particle size distribution is linear. It was found through comparing the measured data and the theoretical curve that, for each test sample at different initial status, the linear relation of the measured data with D value greater than 2.2 is fairly sound, and is quite consistent with the corresponding theoretical curve (the solid line in Figure 7), so that it has fairly strict self-similar nature. The linear relation of the measured data with D value smaller than 2.2 goes bad, gradually deviating from the corresponding theoretical curve (the imaginary line in Figure 7), and with the decrease of value D, the deviation is getting serious and serious and the data points become non-linear.
From the above analysis, the following can be obtained: the significance level and fractal dimension of the self-similarity of the measured data of the particle size distribution are very sensitive to the accuracy of the prediction results in Equation (1). The D value corresponding to the R value with relative low significance level will lead to a great error between the measured data of particle size distribution and theoretical distribution. Therefore, in the study of the grain breakage, when the initial uniform particle size distribution is described as fractal distribution, the significance level of the self-similarity of particle size distribution should be tested first to determine whether the particle size distribution has finished the transformation to fractal distribution. In addition, for the model prediction of particle size distribution curve, it is necessary to adopt the fractal parameters with relatively strict self-similarity to avoid large error of the prediction results.
5.2. Stress Strain and Relative Breakage Rate in the Crushing Process
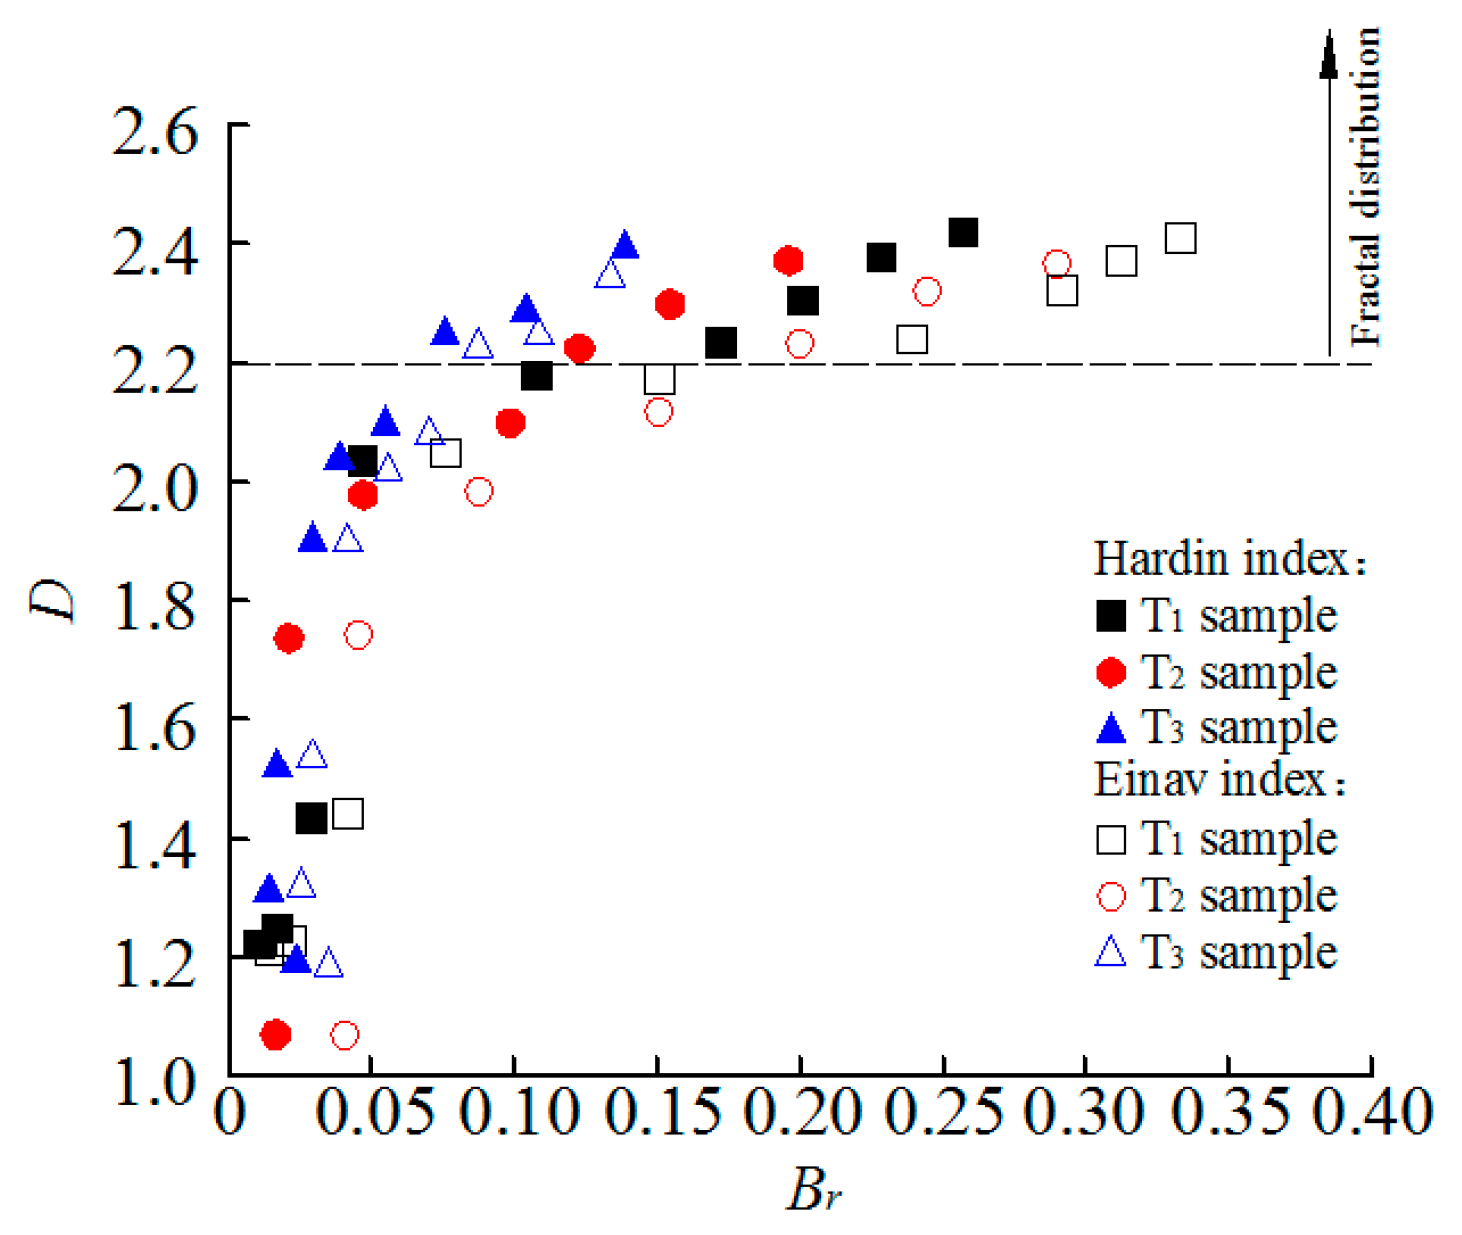
According to the previous analysis, the particle size distribution when the D value is larger than 2.2 is taken as the boundary for fractal distribution and the mutual impact mechanism between the fractal distribution and Br, σv and εv during the evolutionary process of particle size distribution is studied. Among them, Br is analyzed separately as per Hardin index and Einav index.
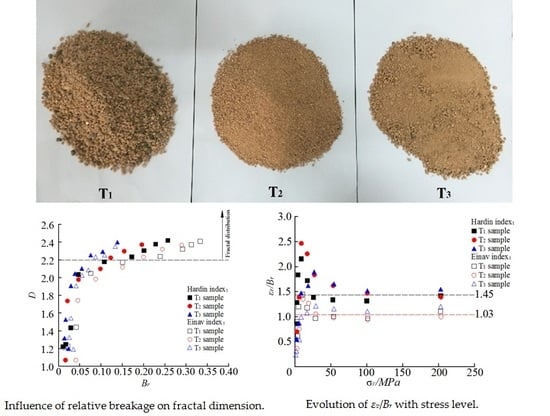
Figure 8 shows the impact of relative breakage rate on fractal dimension. Under the same breakage state, the breakage amount described by Hardin indexes is smaller than that described by Einav indexes. The value of D of each sample grows with the rise of Br. When the breakage develops to a certain degree, fractal distribution occurs (above the imaginary line in Figure 8). When the initial distribution is different, the amount of breakage needed to evolve into fractal distribution is also different. The T1 sample with relatively large initial particle requires larger breakage amount compared with T2 sample with relatively small particles, and the T3 sample with sound grain size distribution requires a smaller amount of breakage amount compared with T1 and T2 with poor grain size distribution. When the particle distribution evolves to fractal distribution, D increases linearly with Br.
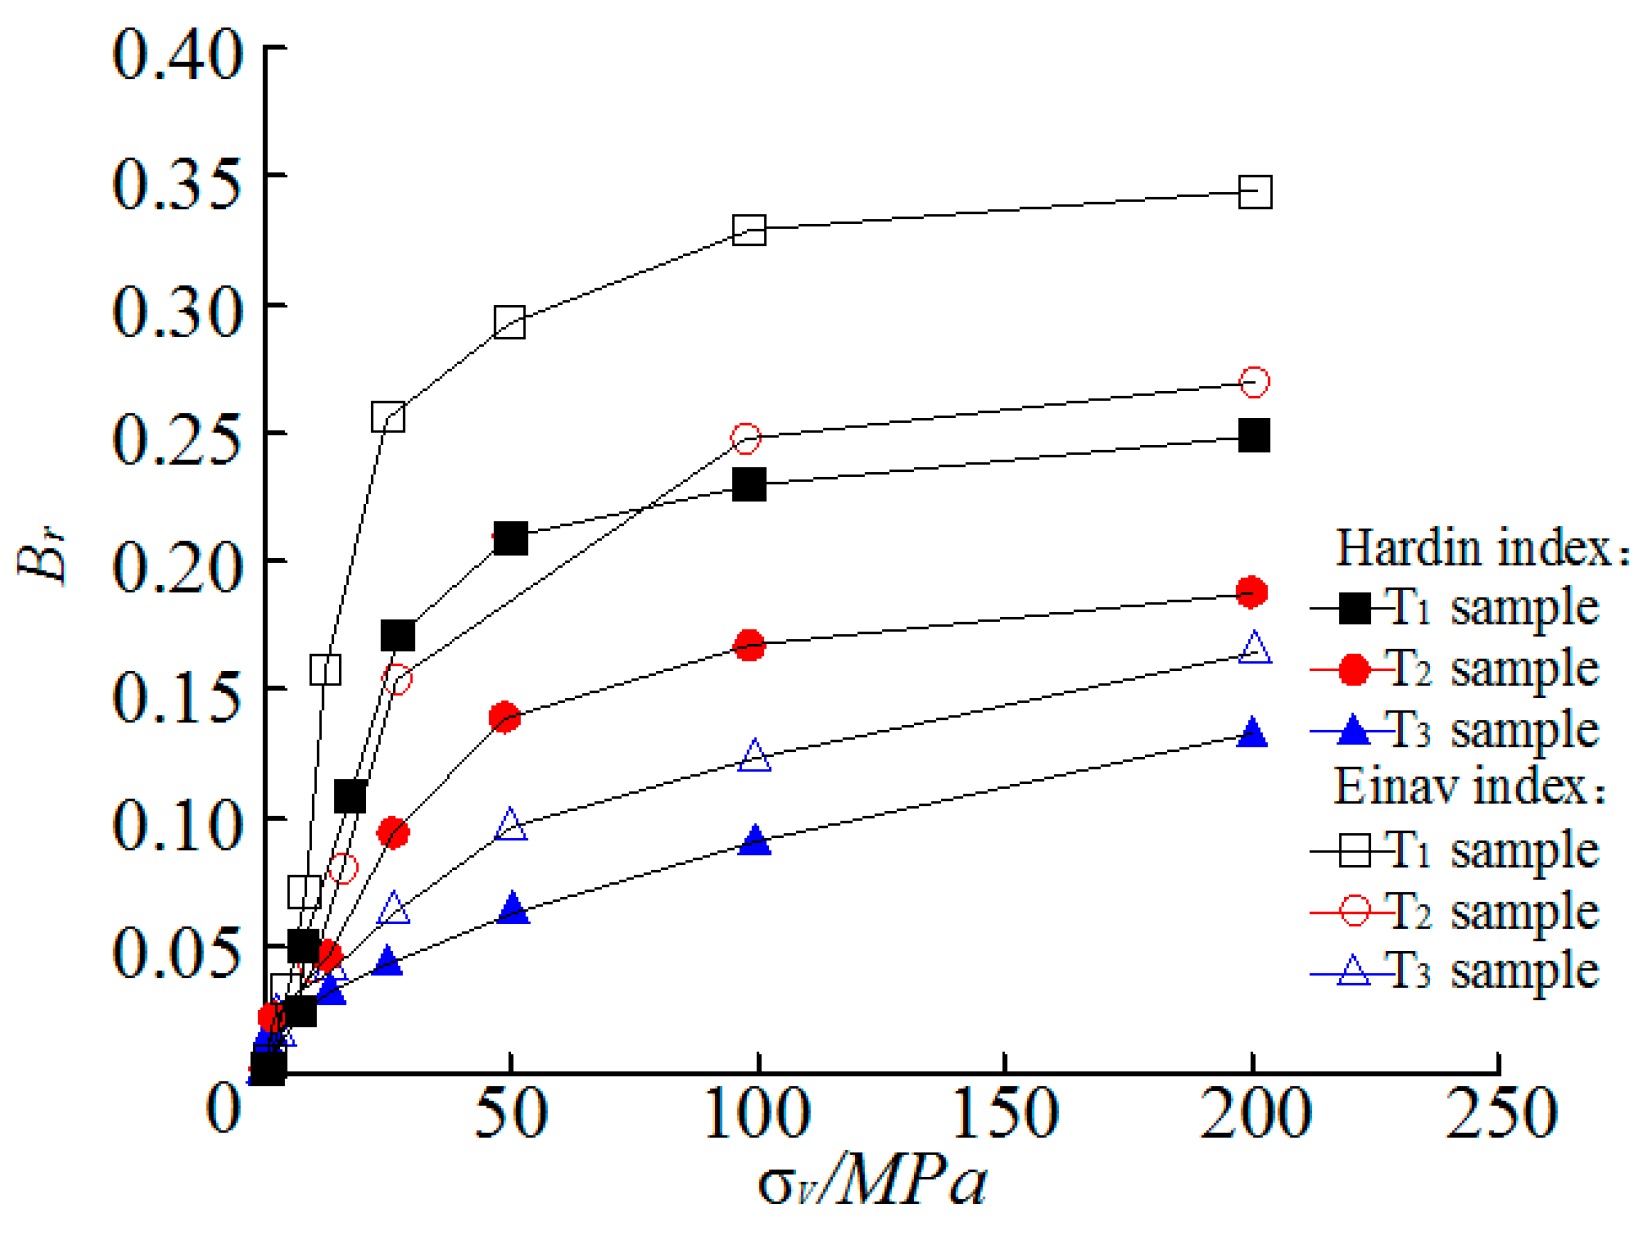
Figure 9 indicates the impact of stress level on the relative breakage rate. Under the same stress level, Br is affected by the initial distribution and is related to the critical crushing stress of particles. The critical stress of the sample with relatively large initial grains and poor grain size distribution is relatively small, so Br is relatively large. The critical stress of the sample with relatively small initial grains and sound grain size distribution is relatively large, so Br is relatively small.
Figure 9 also indicates that Br increases with the rise of σv, but the amplification is decreasing. The Br–σv curve presents an inferior fovea shape. Therefore, the following explanation could be provided: with the rise of σv, the particle number caused by breakage is increasing constantly and the contact point between particles is also increasing accordingly. Although the total stress imposed on the whole particle is still increasing, the average stress of the contact points between the particles actually declined. Therefore, the amplification of Br becomes smaller and smaller with the rise of σv. However, at the fractal stage, the amplification of Br of the samples becomes fairly consistent with the growth of σv, suggesting that the particle breakage is slightly affected by the initial distribution.
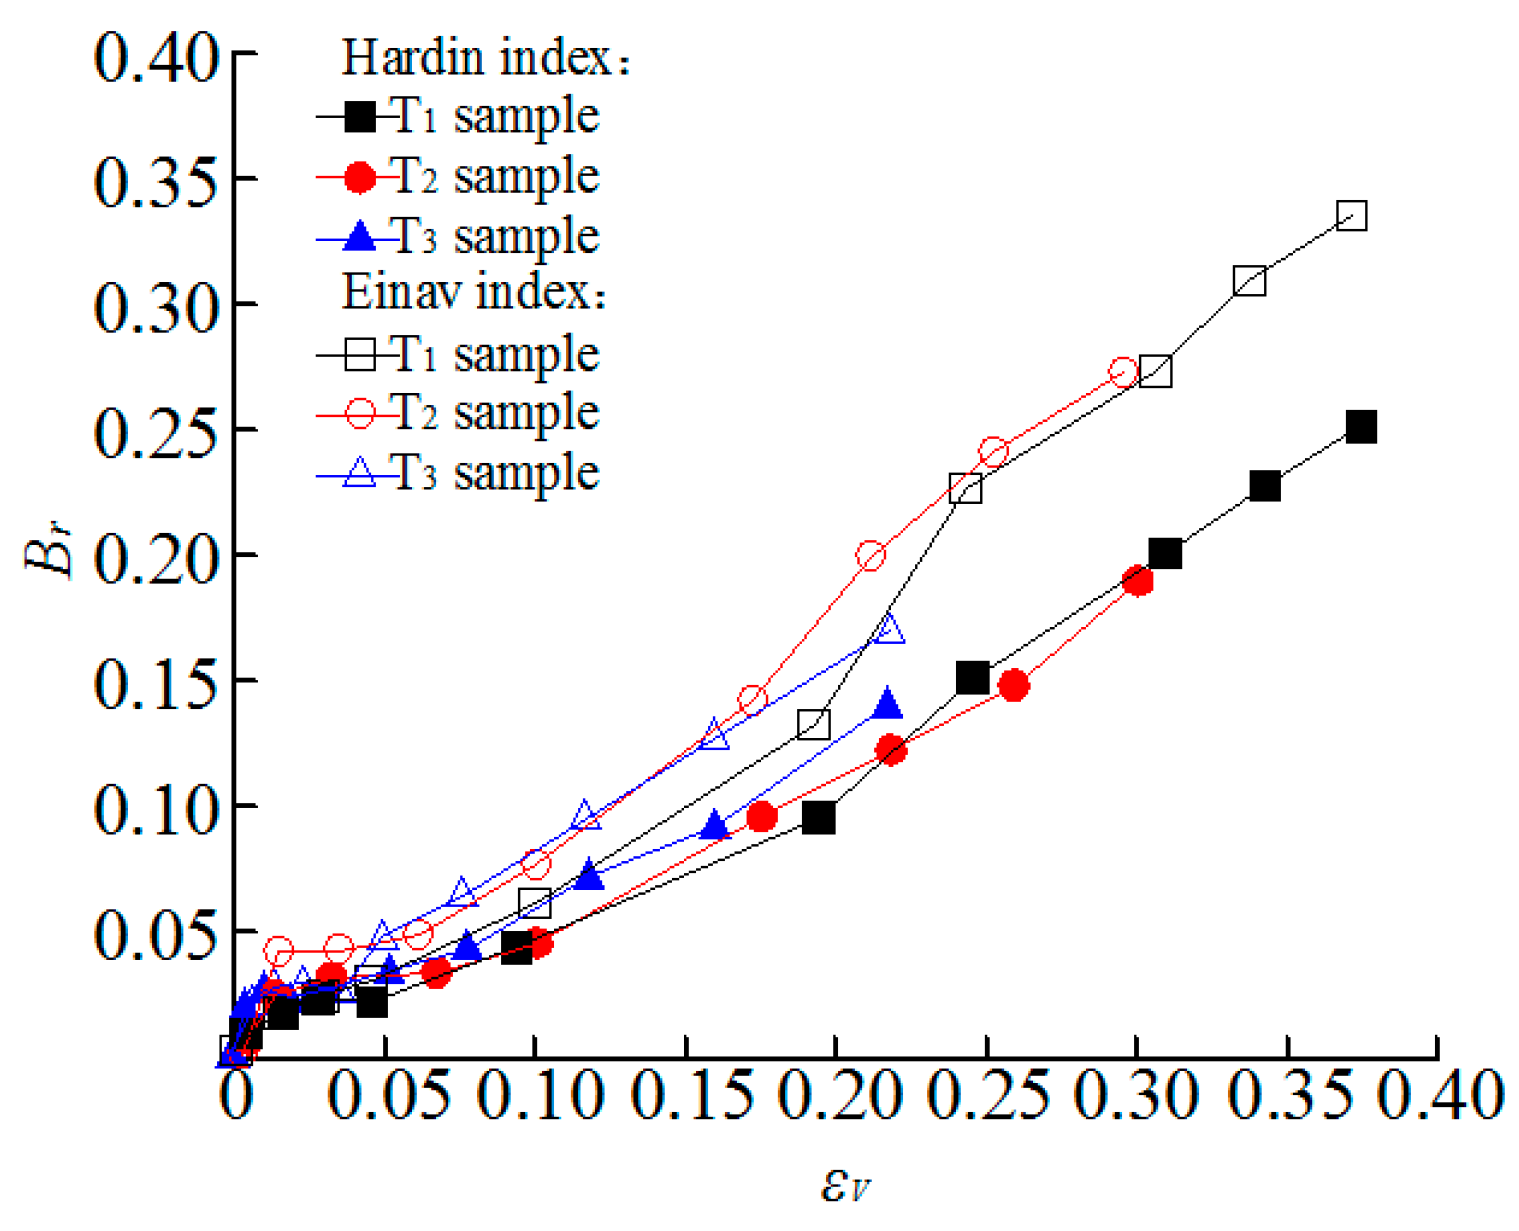
Figure 10 shows the effect of volumetric strain on relative breakage rate. Different from the Br–σv relationship, when the grain breakage develops to a certain degree, especially at the fractal distribution stage when the grain breakage terminates and the stabilized gradation is achieved, Br increases linearly with the rise of εv appropriately and is slightly affected by the initial distribution and initial particle size. It can be seen in Figure 9 and Figure 10 that, although the breakage rate of the same breakage state is different when it is described using Einav index and Hardin index and the Einav breakage rate is larger than Hardin breakage rate, the rule of change of the rate of breakage described by the two with the vertical stress and volumetric strain is consistent.
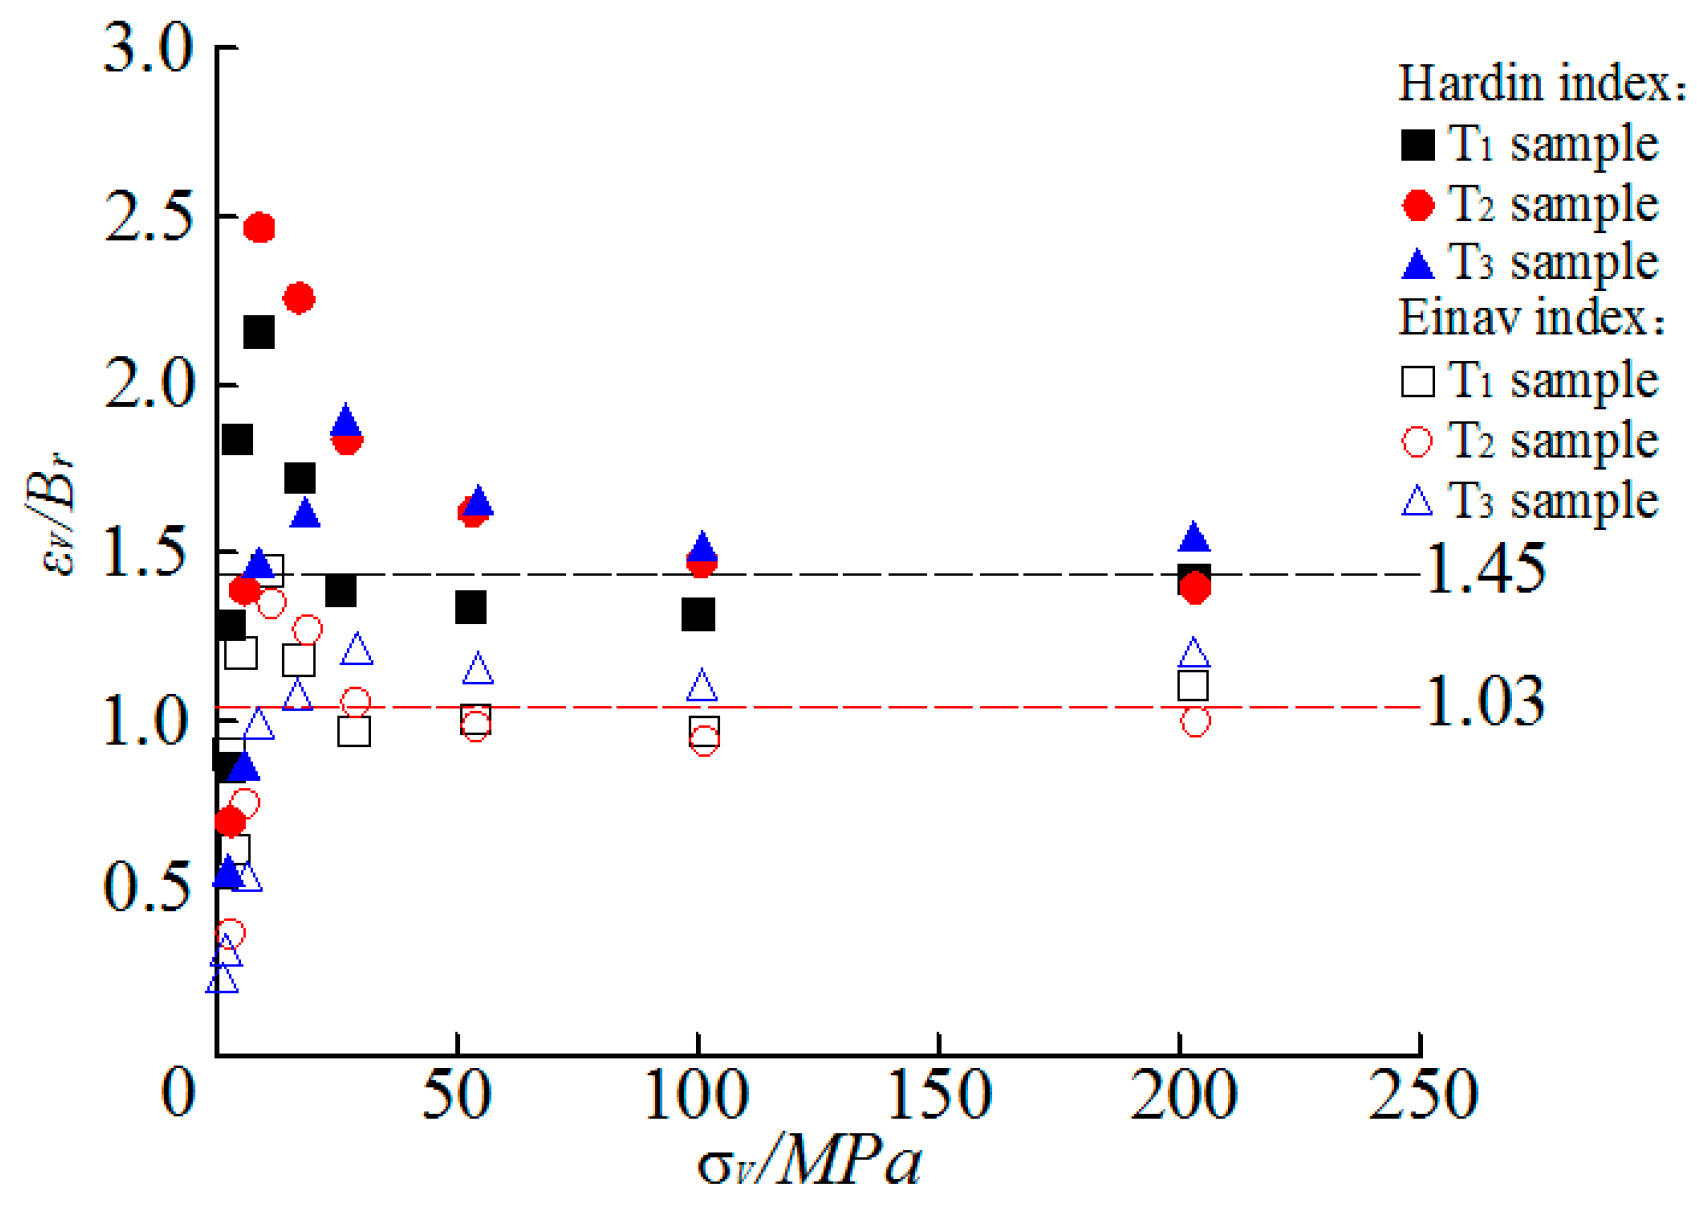
The change rule of the volumetric strain and the breakage rate of the sample with the breakage development was further investigated. Figure 11 presents the relationship between the ratio (εv/Br) of the volumetric strain and the relative breakage rate and the stress level, indicating that, with the development of grain breakage, the increase of εv/Br remains almost constant with the growth of σv at the fractal distribution stage, and the constant value of εv/Br of each sample is relatively appropriate, indicating that εv and Br are directly correlated and that εv/Br is slightly affected by the initial distribution and particle size of the particles. The imaginary line in Figure 11 indicates that the constant value of εv/Br corresponding to Hardin index is about 1.45 and the constant value of εv/Br corresponding to Einav index is about 1.03.
In fact, early scholars have observed similar phenomena in the triaxial and ring-shear tests on the calcareous sand [9,10]. Actually, Br adopts the Hardin index and it is found that the constant status of εv/Br lasts until the particle breakage terminates. However, since there is no detailed investigation on the particle size distribution in the crushing process, there is no such analysis that it is an important characteristic of the fractal distribution stage for εv/Br to keep constant.
In the process of particle crushing, for the granular soils which tend to be of fractal distribution, εv/Br remains constant and is slightly affected by the initial status. There are two potential functions: (1) it provides a criterion for the fractal distribution trend of particle size distribution in particle crushing process; (2) it provides a simple method for estimating the particle size breakage rate. Because if the particle size distribution is fractal, it is only necessary to measure the volumetric strain in the crushing experiment and there is no need to terminate the test to carry out grain size analysis. The relative breakage rate of particles can be estimated roughly through the constant ratio of the volumetric strain and the breakage rate.
6. Conclusions
In this paper, the uniaxial side confined compression test under high stress condition was carried out to study the evolutionary rule and fractal behavior of the particle size distribution of the rare earth tailings during the crushing process at different initial state. The following six points are concluded:
- (1)
- With the development of particle breakage, the quartz sand-gravel with different initial distribution and particle size all tends towards self-similar fractal distribution and this process is related to the breakage amount of the particles.
- (2)
- The particle breakage growth can be described using the increased fractal dimension. For the particles of the rare earth tailings at different initial status, the measured data of the particle size distribution with the fractal dimension greater than 2.2 all show fairly strict self-similarity, so that this value can be taken as the lower limit value of the fractal dimension when the particle size distribution tends towards fractal distribution.
- (3)
- The significance level of the self-similarity of the measured data of the particle size distribution are very sensitive to the prediction results of the particle size distribution model. The particle size distribution predicted by the fairly strict self-similar fractal parameters are quite consistent with the actually measured data.
- (4)
- In the same breakage state, the breakage rate defined by Hardin index is smaller than that defined by the Einav index. However, the two kinds of breakage rate are consistent in terms of the variation rule with the vertical stress and volumetric stress.
- (5)
- The ratio of the volumetric strain to the breakage rate remains constant, and is slightly affected by the evenness of the initial distribution and particle size when the particle size distribution tends towards fractal distribution. This feature can be utilized to identify the fractal distribution. It also means that, if the particle size distribution is fractal in the experiment, there is no need to terminate the test to carry out particle size analysis, and the particle breakage rate can be estimated only through measuring the volumetric strain.
- (6)
- Under the condition of high stress, the particle crushing process of rare earth tailings tends to be of fractal distribution, which provides a possibility for the model prediction of particle size distribution. However, when the particle size distribution of the particle breakage is described as fractal distribution, the degree of particle breakage should be examined to confirm whether it can facilitate the transition to fractal distribution and fairly strict self-similar fractal parameters shall be adopted when carrying out model prediction to avoid relatively large error of the predicted results. Further research needs to be done to learn the fractal behavior of other types of soil samples in the crushing process, and to clarify the effect of different soil sample properties on the fractal behavior of particle size distribution.
In fact, it is difficult to perform tests using higher stress levels than 204.8 MPa due to the limitation of the instrument. Our future work will focus on the high stress levels.
Author Contributions
Conceptualization, W.Z.; Data curation, F.Y.; Formal analysis, F.Y.; Funding acquisition, W.Z.; Project administration, W.Z.; Supervision, A.C.; Writing—original draft, and F.Y.; Writing—review and editing, A.C.
Acknowledgments
The authors gratefully acknowledge the financial support from the Project supported by the National Natural Science foundation of China (Nos. 51504102, 51764014, and 51404111), China Postdoctoral Science Foundation (No. 2017M622099), National key technologies Research & Development program (No. 2017YFC0804601), and Program of Qingjiang Excellent Young Talents, Jiangxi University of Science and Technology.
Conflicts of Interest
The authors declare no conflicts of interest.
References
- Wang, X.J.; Zhuo, Y.L.; Zhao, K. Experimental measurements of the permeability characteristics of rare earth ore under the hydro-chemical coupling effect. RSC Adv. 2018, 8, 11652–11660. [Google Scholar] [CrossRef] [Green Version]
- Wang, X.J.; Zhuo, Y.L.; Deng, S.Q. Experimental research on the impact of ion exchange and infiltration on the microstructure of rare earth orebody. Adv. Mater. Sci. Eng. 2017, 1, 1–8. [Google Scholar] [CrossRef]
- Yin, Z.Y.; Xu, Q.; Hu, W. Constitutive relations for granular materials considering particle crushing: Review and development. Chin. J. Geotech. Eng. 2012, 34, 2170–2180. [Google Scholar]
- Lee, K.L.; Farhoomand, I. Compressibility and crushing of granular soils in anisotropic triaxial compression. Can. Geotech. J. 2011, 4, 68–86. [Google Scholar] [CrossRef]
- Lade, P.V.; Yamamuro, J.A.; Bopp, P.A. Crushing of soil particles. J. Geotech. Eng. 1996, 122, 309–316. [Google Scholar] [CrossRef]
- Hardin, B.O. Crushing of soil particles. J. Geotech. Eng. 1985, 111, 1177–1192. [Google Scholar] [CrossRef]
- Einav, I. Breakage mechanics—Part I: Theory. J. Mech. Phys. Solid. 2007, 55, 1274–1297. [Google Scholar] [CrossRef]
- Sammis, C.; King, G.; Biegel, R. The kinematics of gouge deformations. Pure Appl. Geophys. 1987, 125, 777–812. [Google Scholar] [CrossRef]
- Luzzani, L.; Coop, M.R. On the relationship between particle breakage and the critical state of sands. Soil Found. 2002, 42, 71–82. [Google Scholar] [CrossRef]
- Coop, M.R.; Sorensen, K.K.; Freitas, T.B. Particle breakage during shearing of a carbonate sand. Géotechnique 2004, 54, 157–163. [Google Scholar] [CrossRef]
- Miao, G.; Airey, D. Breakage and ultimate states for a carbonate sand. Géotechnique 2013, 63, 1221–1229. [Google Scholar] [CrossRef]
- Mandelbrot, B.B. The Fractal Geometry of Nature; W.H Freeman and Co.: New York, NY, USA, 1982. [Google Scholar]
- Stamboliadis, E.; Petrakis, E.; Pantelaki, O. Variation of dimensional properties of particulate materials during grinding and their non-fractal nature. Can. Metall. Q. 2011, 50, 119–126. [Google Scholar] [CrossRef]
- Petrakis, E.; Stamboliadis, E.; Komnitsas, K. Evaluation of the relationship between energy input and particle size distribution in comminution with the use of piecewise regression analysis. Part. Sci. Technol. 2017, 35, 479–489. [Google Scholar] [CrossRef]
- Tasdemir, A. Fractal evaluation of particle size distributions of chromites in different comminution environments. Miner. Eng. 2009, 22, 156–167. [Google Scholar] [CrossRef]
- Turcotte, D.L. Fractals and fragmentation. J. Geophys. Res. 1986, 91, 1921–1926. [Google Scholar] [CrossRef]
- Li, G.; Liu, Y.J.; Yin, Z.Y. Grading effect on critical state behavior of granular materials. Chin. J. Geotech. Eng. 2014, 36, 452–457. [Google Scholar]
- Liu, M.C.; Gao, Y.F.; Liu, H.L. Effect of particle breakage on strength and deformation of modeled rockfills. Chin. J. Geotech. Eng. 2011, 33, 1691–1699. [Google Scholar]
- Muir, D.D.; Maeda, K. Changing grade of soil: Effect on critical states. Acta Geotech. 2008, 3, 3–14. [Google Scholar] [CrossRef]
- Tyler, S.W.; Wheatacraft, S.W. Fractal scaling of soil particle-size distributions: Analysis and limitations. Soil Sci. Soc. Am. J. 1992, 56, 362–369. [Google Scholar] [CrossRef]
- Hu, W.; Yin, Z.Y.; Dano, C. Constitutive study of crushable granular materials. Can. Geotech. J. 2011, 32, 159–165. [Google Scholar]
- Sun, Y.F.; Liu, H.L.; Yang, G. Yielding function for coarse aggregates considering gradation evolution induced by particle breakage. Can. Geotech. J. 2011, 34, 3479–3484. [Google Scholar]
- Zhang, J.R.; Zhu, J.; Huang, W.J. Crushing and fractal behaviors of quartz sand-gravel particles under confined compression. Can. Geotech. J. 2008, 30, 783–789. [Google Scholar]
- Tsoungui, O.; Vallet, D.; Charmet, J.C. Numerical model of crushing of grains inside two-dimensional granular materials. Powder Technol. 1999, 105, 190–198. [Google Scholar] [CrossRef]
- Mcdowell, G.R.; Bolton, M.D.; Robertson, D. The fractal crushing of granular materials. Can. Geotech. J. 1996, 44, 2079–2102. [Google Scholar] [CrossRef]
Figure 1.
Particle size distribution curves defined by Equation (1).

Figure 2.
Definition of relative breakage.

Figure 3.
The soil sample (the tailings of ionic type rare earth leached in situ).

Figure 4.
Evolution of particle size distributions (semi-logarithmic axes): (a) T1 sample, (b) T2 sample and (c) T3 sample.
Figure 4.
Evolution of particle size distributions (semi-logarithmic axes): (a) T1 sample, (b) T2 sample and (c) T3 sample.

Figure 5.
Evolution of particle size distributions (double logarithmic axes): (a) T1 sample, (b) T2 sample and (c) T3 sample.
Figure 5.
Evolution of particle size distributions (double logarithmic axes): (a) T1 sample, (b) T2 sample and (c) T3 sample.

Figure 6.
Linear fitting for lg[M(δ < d)/MT] and lg(d/dM): (a) T1 sample, (b) T2 sample and (c) T3 sample.
Figure 6.
Linear fitting for lg[M(δ < d)/MT] and lg(d/dM): (a) T1 sample, (b) T2 sample and (c) T3 sample.


Figure 7.
Comparison between results of Equation (1) and measured data of particle size distribution: (a) T1 sample, (b) T2 sample and (c) T3 sample.
Figure 7.
Comparison between results of Equation (1) and measured data of particle size distribution: (a) T1 sample, (b) T2 sample and (c) T3 sample.

Figure 8.
Influence of relative breakage on fractal dimension.

Figure 9.
Influence of stress level on relative breakage.

Figure 10.
Influence of volumetric strain on relative breakage.

Figure 11.
Evolution of εv/Br with stress level.


Table 1.
Initial particle size distribution of soil samples (%).
| The Sample Number | Particle Size/mm | |||||
|---|---|---|---|---|---|---|
| 5–2 | 2–1 | 1–0.5 | 0.5–0.25 | 0.25–0.1 | 0.1–0.074 | |
| T1 | 100 | 0 | 0 | 0 | 0 | 0 |
| T2 | 0 | 50 | 50 | 0 | 0 | 0 |
| T3 | 33.8 | 34.2 | 21.2 | 10 | 0.5 | 0.3 |
Table 2.
Values of fractal dimension and regression coefficient.
| Stress Level | T1 Sample | T2 Sample | T3 Sample | |||
|---|---|---|---|---|---|---|
| D | R | D | R | D | R | |
| 0 | - | - | - | - | 1.430 | 0.9444 |
| 0.8 | 1.219 | 0.9353 | 0.898 | 0.9333 | 1.220 | 0.9549 |
| 1.6 | 1.229 | 0.9667 | 0.919 | 0.9739 | 1.298 | 0.9669 |
| 3.2 | 1.430 | 0.9797 | 1.066 | 0.9742 | 1.509 | 0.9777 |
| 6.4 | 2.048 | 0.9841 | 1.722 | 0.9578 | 1.931 | 0.9672 |
| 12.8 | 2.158 | 0.9948 | 1.975 | 0.9766 | 2.039 | 0.9814 |
| 25.6 | 2.231 | 0.9984 | 2.088 | 0.9908 | 2.101 | 0.9891 |
| 51.2 | 2.305 | 0.9989 | 2.222 | 0.9976 | 2.272 | 0.9977 |
| 102.4 | 2.377 | 0.9983 | 2.311 | 0.9977 | 2.331 | 0.9985 |
| 204.8 | 2.432 | 0.9977 | 2.360 | 0.9983 | 2.399 | 0.9963 |
© 2018 by the authors. Licensee MDPI, Basel, Switzerland. This article is an open access article distributed under the terms and conditions of the Creative Commons Attribution (CC BY) license (http://creativecommons.org/licenses/by/4.0/).
Share and Cite
MDPI and ACS Style
Zhong, W.; Yue, F.; Ciancio, A. Fractal Behavior of Particle Size Distribution in the Rare Earth Tailings Crushing Process under High Stress Condition. Appl. Sci. 2018, 8, 1058. https://0-doi-org.brum.beds.ac.uk/10.3390/app8071058
AMA Style
Zhong W, Yue F, Ciancio A. Fractal Behavior of Particle Size Distribution in the Rare Earth Tailings Crushing Process under High Stress Condition. Applied Sciences. 2018; 8(7):1058. https://0-doi-org.brum.beds.ac.uk/10.3390/app8071058
Chicago/Turabian StyleZhong, Wen, Fucai Yue, and Armando Ciancio. 2018. "Fractal Behavior of Particle Size Distribution in the Rare Earth Tailings Crushing Process under High Stress Condition" Applied Sciences 8, no. 7: 1058. https://0-doi-org.brum.beds.ac.uk/10.3390/app8071058
Note that from the first issue of 2016, this journal uses article numbers instead of page numbers. See further details here.