Article

Hybrid Battery/Lithium-Ion Capacitor Energy Storage System for a Pure Electric Bus for an Urban Transportation Application

1
Department ETEC Mobility, Logistics and Automotive Technology Research Group (MOBI), Vrije Universiteit Brussel, Pleinlaan 2, 1050 Brussels, Belgium
2
Flanders Make, 3001 Heverlee, Belgium
3
JSR Micro N.V., Technologielaan 8, 3001 Leuven, Belgium
4
JM Energy Corporation, 8565 Nishi-ide Ooizumi-cho, Hokuto City, Yamanashi 409-1501, Japan
*
Author to whom correspondence should be addressed.
Submission received: 30 May 2018 / Revised: 12 July 2018 / Accepted: 17 July 2018 / Published: 19 July 2018
(This article belongs to the Special Issue Plug-in Hybrid Electric Vehicle (PHEV))

Abstract

:

Featured Application

A potential application for this research work is the pure electric bus with energy recovery capability. With the hybrid energy storage system based on Lithium-ion battery and Lithium-ion Capacitor, the bus will have a longer range, a higher efficiency and a lower cost in comparison to a bus with non-hybrid energy storage system or a bus with hybrid energy storage based on battery and super-capacitors.

Abstract

Public transportation based on electric vehicles has attracted significant attention in recent years due to the lower overall emissions it generates. However, there are some barriers to further development and commercialization. Fewer charging facilities in comparison to gas stations, limited battery lifetime, and extra costs associated with its replacement present some barriers to achieve better acceptance. A practical solution to improve the battery lifetime and driving range is to eliminate the large-magnitude pulse current flow from and to the battery during acceleration and deceleration. Hybrid energy storage systems which combine high-power (HP) and high-energy (HE) storage units can be used for this purpose. Lithium-ion capacitors (LiC) can be used as a HP storage unit, which is similar to a supercapacitor cell but with a higher rate capability, a higher energy density, and better cyclability. In this design, the LiC can provide the excess power required while the battery fails to do so. Moreover, hybridization enables a downsizing of the overall energy storage system and decreases the total cost as a consequence of lifetime, performance, and efficiency improvement. The aim of this paper is to investigate the effectiveness of the hybrid energy storage system in protecting the battery from damage due to the high-power rates during charging and discharging. The procedure followed and presented in this paper demonstrates the good performance of the evaluated hybrid storage system to reduce the negative consequences of the power peaks associated with urban driving cycles and its ability to improve the lifespan by 16%.

1. Introduction

In recent years, the use of electric vehicles (EVs) has spread widely due to the fewer pollutants they send into the environment. However, there are still some obstacles on the way of their further adoption, including the higher cost in comparison to internal combustion engine vehicles (ICEVs), lower energy density than ICEVs, and their problem in providing the high-power demand during sudden acceleration. To overcome the pricing issue, many Governments encourage car manufacturers and buyers by providing subsidies for further research and development and to reduce the manufacturing cost. Apart from the pricing, a good energy storage system (ESS) capable of providing enough energy for better mileage and enough power for acceleration still needs to be improved in the future. Many analyses in the literature show that the average power demand in vehicular applications is much lower than the peak power demand so that the peak to average power ratio is between 4 and 7 [1]. This requirement raises the need for a special type of EES for EVs. Among the different energy storage systems presented in the market, lithium-ion batteries (LiBs) attract a great deal of attention for their high energy density, however, their low power specification (peak to average ratio between 0.5 and 2 [1]) makes them unfavorable for acceleration purposes [2]. Moreover, high charging/discharging rates when they are used in urban driving cycles has a negative effect on their performance by affecting the efficiency, lifetime, and internal resistance value [3].
Among the different type of LiBs available in the market, lithium iron phosphate (LFP) batteries have shown a significant potential for sudden power consumption and a better cyclability in comparison to the other types of LiBs, but, their lifespan and reliability need to be studied more. Super-capacitors (SCs) are another candidate which can be used as ESS in EVs. They have a higher power density in comparison to the LiBs, as well as a higher cyclability and reliability, nevertheless, they have a lower energy density in the range of 4–7 Wh/kg. As mentioned before, the ESS should be able to fulfill both the power and energy demand for the EVs. One possible solution is to overdesign either of them, which creates an expensive, voluminous, and heavy ESS. Another possibility is to externally combine LiBs as a high-energy system with SCs as a high-power storage system. With this combination, the energy and power density of the entire system can be improved. However, these energy storage systems have different charge and discharge behaviors as LiBs are non-linear devices and SC are rather linear. Moreover, having a lower voltage level than batteries, SCs need to be connected to the DC link through a DC/DC converter, which increases the cost and complexity of the system.
SCs can also be replaced by a hybrid super-capacitor (HSC). HSC is an emerging technology which has attracted a great deal of attention in recent years. Many studies have been presented in the literature aiming to make HSC environmentally friendly and cost effective in comparison to competing technologies while keeping the surface area as high as possible [4,5]. HSC, also known as a lithium-ion capacitor (LiC), is an internal hybrid energy storage device where its structure consolidates SC and LiB technologies. Its basic structure includes a positive electrode with activated carbon, as in super-capacitors, and a negative electrode based on Li-Ion-doped carbon similar to the LiBs [6]. The application of LiCs is increasing quickly due to advantages that they have compared to the SCs, including a high power capability around 10 kW/kg, a higher maximum voltage (3.8 V) and a higher energy density (up to 14 Wh/kg) [7]. However, having a higher voltage level does not necessarily eliminate their need for DC/DC convertor for hybrid application, but it decreases the cost and loss of the convertor significantly since a part of hybridization is done internally in the LiC cells.
In the literature, different methods of hybridization have been presented and their pros and cons from different points of view have been studied. The main topologies examined in the scientific literature can be divided into passive and active topologies. The passive topology which is the simplest hybridization method is achieved by the direct parallel connection of two or more energy storage technology. This topology is cheap, light, easy to implement, highly dynamic, yet has some negative points. Due to the direct connection, power sharing cannot be controlled, and the usable capacity is limited by the operating voltage of the battery. To operate each energy storage system in an optimal way, an active topology is introduced. There are many types of active topologies based on the number of decoupled energy storage systems with convertors, such as DC/DC convertors [8].
Hybrid energy storage systems (HESS) also have been studied from the control strategy point of view in many studies. In [9], a novel controller for a HESS has been proposed which aims to decrease the frequency effect induced on the SC in the process of power sharing. In [10] a new combination of SC and multi-speed transmission system and the usage of regenerative breaking energy was used to increase the energy density of the EVs and make them comparable with ICEVs. In [11], a near-optimal power management strategy was proposed. The presented method was verified for different state of charge and state of health of the battery which can reduce the C-rate of the battery by 10%. In [12], authors investigated the effect of driving cycle characteristics on the optimization result of the HESS and concluded that those results can be generalized to practical bus lines.
As stated before, none of the available researches considered the application of LiC in the HESS and the effect of this combination on the lifetime performance was not studied before.
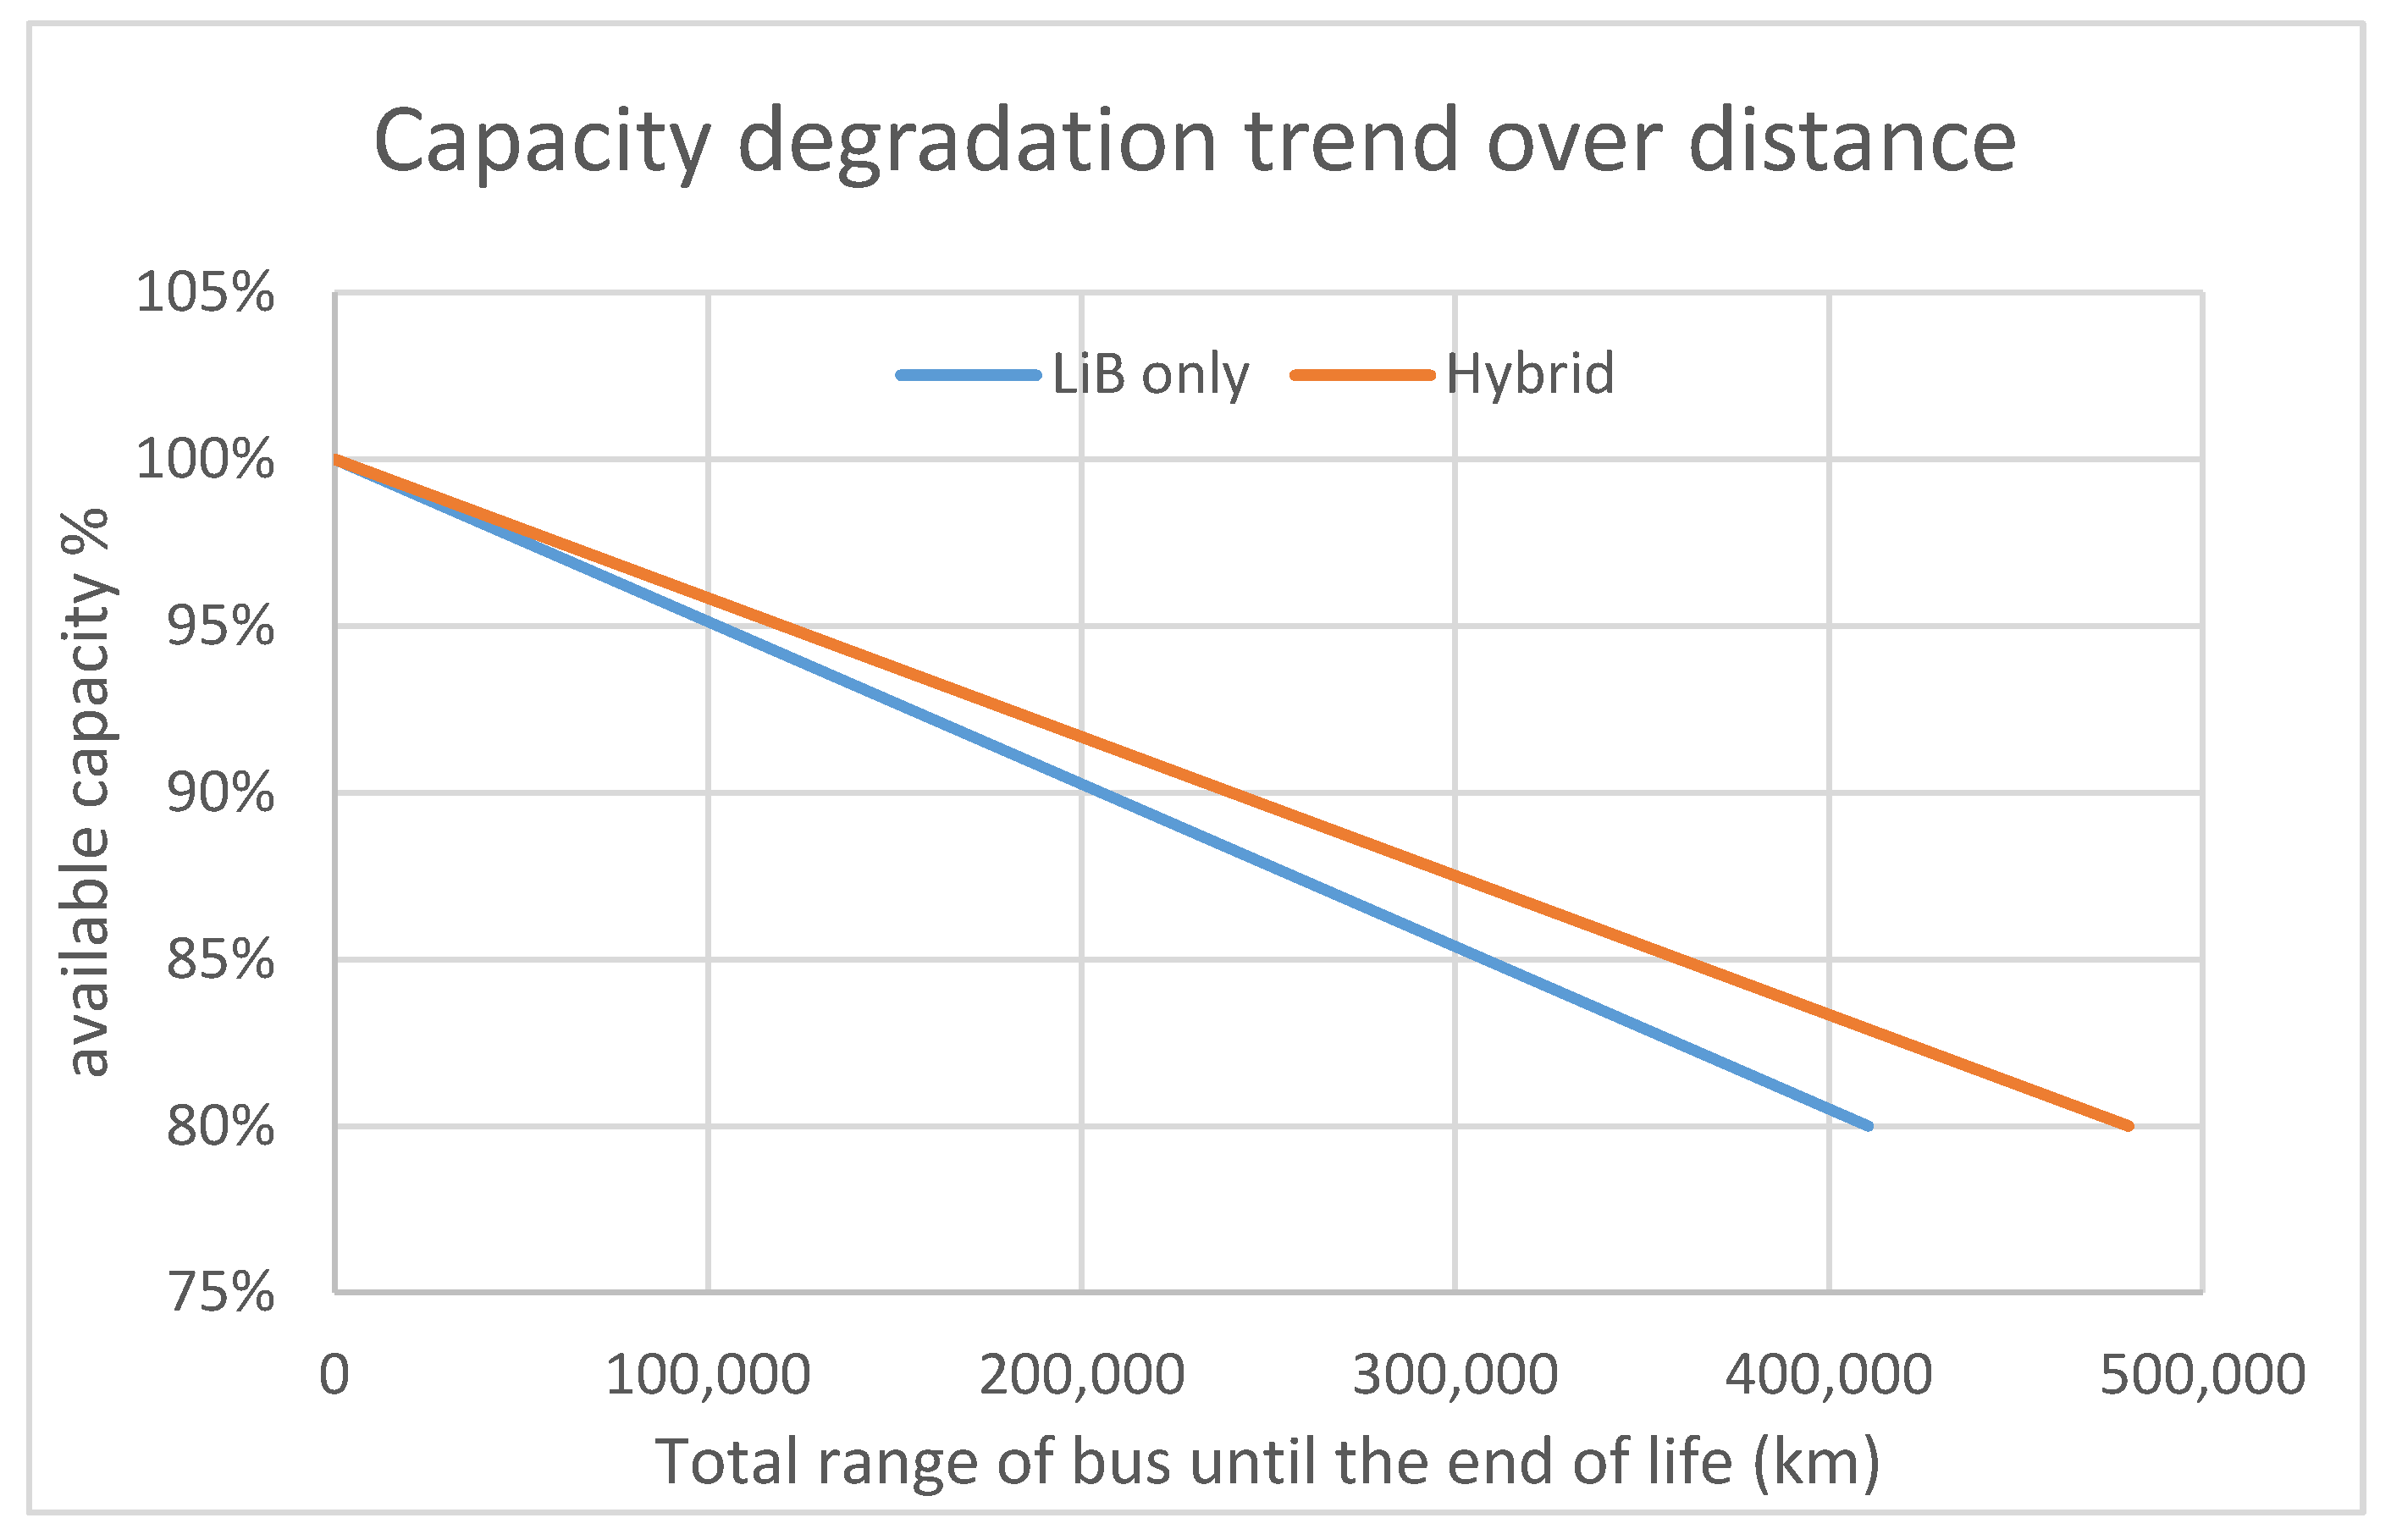
This paper investigates the effect of hybridization of LiB and LiC on the lifetime performance of a HESS for an urban electric bus. In this regard, a developed lifetime model of a 20 Ah nickel manganese cobalt oxide (NMC) lithium-ion battery in combination with a LiC 2300 F lifetime model developed in our laboratory (mobility, logistics, and automotive technology (MOBI) research center, Vrije Universiteit Brussel (VUB)) was used for simulation purposes. The result approves the effectiveness of hybridization by increasing the lifetime by 16%.
This paper is organized as follows: in Section 2 the electro-thermal and lifetime model of a NMC 20 Ah battery is briefly explained. Section 3 presents a detailed description of the LiC electro-thermal and lifetime model. The hybridization and load sharing methodology is illustrated in Section 4. Further analysis of the driving cycle and power and energy requirements for a pure electric bus is presented in Section 5. Simulation results and discussions are given in Section 6 and, finally, the conclusion is presented in Section 7.

2. Electrothermal and Lifetime Model Explanation for 20 Ah NMC Cell

The model used in this study is a combination of electro-thermal and lifetime model and has been comprehensively explained in [13]. The proposed model is based on the electrical equivalent circuit (EEC) approach which has been presented in [14] and, thus, will not be detailed here.

2.1. Electrical Model

The voltage behavior of the NMC cell was determined by an equivalent circuit model (ECM). The ECM is composed of two parallel RC branches and one ohmic resistor, which is called as a second-order electric model. The ohmic resistance R o , concentration polarization resistance R 1 , and the activation polarization resistance R 2 are estimated based on the experimental results and empirical equations obtained from curve fitting techniques and, thus, the model can accurately simulate the cell’s voltage behavior during transient states of charging and discharging. The general equation is defined as [15]:
V b a t t = O C V   R O I b a t t   R 1 I 1 R 2 I 2
where the open circuit voltage is abbreviated as O C V , I b a t t is the battery current, I 1 is the current in the resistor in the first R-C branch and I 2 is the current in the resistor in the second R-C branch and V b a t t is the terminal voltage of the battery. The equivalent circuit of the second-order Thevenin model is shown in Figure 1.

2.2. Thermal Model

A transient heat equation which is derived from the first law of thermodynamics is used to describe the thermal distribution in the LiB cell, where the amount of generated heat must be stored inside the cell or transferred from the cell to its surroundings [16]:
ρ C p   d T d t = [ λ x   2 T   2 x + λ y   2 T   2 y + λ z   2 T   2 z   ] + q ˙
where q ˙   ( W / m 3 ) and T   ( K ) denote the heat source and the temperature of the cell, respectively. The heat flux transferred from the cell to its surroundings is expressed as follows:
[ λ x T x + λ y T y + λ z T z   ] | b o u n d a r i e s = h ( T T a ) | b o u n d a r i e s
where h   ( W / m ² · K ) and T a   ( K ) denote the convective heat coefficient, and ambient temperature, respectively. The heat source in the electrode domain is computed from the Bernardi equation [17], where its simplified form can be expressed as follows:
q ˙ = I ( U V ) T I U T
where I   ( A ) is the current flowing through the cell, U   ( V ) the open circuit voltage, V   ( V ) the terminal voltage, and U T ( V / K ) is the entropy coefficient.
The heat source of the tabs is computed through this relation:
q ˙ = R I 2 V t a b ; R = ρ l S
where R   ( ) , I   ( A ) , V t a b   ( m 3 ) , ρ   (   m ) l   ( m ) , , and S   ( m 2 ) are the electrical resistance, current rate, volume, resistivity, length, and cross-section of the associated tab, respectively.
For more details about this thermal model, readers are referred to [18]. The proposed 0-D thermal model is used to calculate the temperature evolution of the cell based on the current profile and the initial temperature. This temperature change is later used for a more accurate parameter estimation as all parameters shown in Figure 1 are temperature-dependent.

2.3. Lifetime Model

The lifetime model was developed using an empirical approach, as explained in [19]. The capacity degradation trend and internal resistance increase for both the calendaring and cycling aging phenomena were investigated fully and based on the curve fitting techniques. The aging phenomena affects the parameters shown in the ECM in Figure 1. These parameters are adjusted based on the cycling and storage conditions and are stored in the lookup tables for lifime model implementation. Figure 2 and Figure 3 show the internal resistance incremental trend and capacity degradation trend based on the number of cycles, respectively. As it is seen in Figure 2, the internal resistance ( R O ,   R 1 ,   R 2 ) increases with the increase of number of cycles. In this figure, the effect of depth of discharge (DoD) on the internal resistance growth is also seen. As shown in Figure 3 the capacity decreases with the increase of number of cycle. This can be translated as a decrease in the capacitance size in the ECM shown in Figure 1. The first step for lifetime estimation is to calculate the equivalent number of cycles. In this regard, the total energy throughput to the cell is divided by the nominal energy of the cell to calculate the equivalent number of cycles. Then, by referring to the look-up tables, according to the DoD, the equivalent number of cycles, the cycling temperature, and the appropriate values for parameters of the ECM shown in Figure 1 are selected.

3. Electrothermal and Lifetime Model Explanation for LiCs

The electrothermal and lifetime model for LiCs have been created based on the empirical approaches as explained in [20]. It consists of three parts similar to the LiB model including: the electrical model, thermal model, and lifetime model.

3.1. Electrical and Thermal Model

The electrical and thermal models as shown in Figure 4, are fully dependent on each other.
The electrical part of the above-mentioned model is a first order electric circuit as shown in Figure 5. The parameters values ( O C V ,   R O ,   C P ,   and   R P ) are extracted during experiments at different conditions, including different temperatures, states of charge (SoC), and current rates. The terminal voltage in the first order electric circuit is calculated based on the Equation (6):
V t = O C V ( S o C ) I L R 0 V c p
where R o   is   the ohmic resistance, R P is concentration polarization resistance, O C V is the open circuit voltage, I L is the LiC current, I C P is the current in the C P branch, I R P is the current in the R P branch, and V t is the terminal voltage of the LiC.
All parameters shown in Figure 5 are temperature-dependent. In order to have a more accurate estimation, the surface temperature of the cell is modeled with a first-order electric circuit. As shown in Figure 6, the heat source, initial temperature, and ambient temperature are essential. The heat source represents power loss in the cell and arises from two references:
  • internal resistance ( R i n t =   R o +   R p ) , which is called “irreversible heat source”; and
  • the entropy changes, which is called “reversible heat source”.
The first one is always positive and is due to the ion and electron movement, while the second one can be positive or negative and is generated in the chemical reaction. The power loss is calculated by Equation (7) [20]:
P l =   I c e l l 2   ( R i n t ( I c e l l , S o C ) )   I c e l l T c e l l V O C V ( T c e l l , ,   S o C ) T c e l l
where the I c e l l is the cell’s current, R i n t represents the entire internal resistance, and T c e l l is the cell’s surface temperature. The circuit components shown in Figure 6 are described as follow: the P g is the power loss generated in the cell, C t h is the thermal capacity of the cell, R t h represents the thermal conductivity resistance from the cell’s center to the surface, R c o n is the conductivity resistance from the surface to the ambient, and T a is the ambient temperature.
Finally, in order to calculate the power loss for charge and discharge conditions, the power loss is calculated by considering the proportional coefficients ( α   and   β ) as shown in Equation (8):
P l t o t =   α P l c h +   β P l d i s s  
which P l c h represents the power loss during the charge process and P l d i s s gives the power loss during the discharge phase. It has been observed in the experiments that LiCs absorb heat while charging and release heat while discharging. However, the absorbed heat and generated heat are not equal when a same value of current is applied. Moreover, at higher value of charge and discharge current, the exothermic part dominates the endothermic one. As shown in Equation (8), α and β are used to consider this phenomenon. In this equation, α   represents the portion of the total heat source that is generated during the charge process and is mostly negative, and β donates the portion of the total heat source during the discharge times and is always positive. These parameters are current-dependent and are estimated by applying dynamic and steady state load profiles to the cell at different ambient temperatures. A non-linear least square technique is used for estimation. These values are given in Table 1 and are detailed in [20]. P l t o t is the total heat source ( P g ) in the presented model in Figure 6.

3.2. Lifetime Model

The lifetime of all types of the energy storage technologies is affected by two phenomena:
  • calendar effect; and
  • cycling effect.
The calendar effect occurs while the cell is placed in the storage room for a long time or when it is in the rest period, for example, when the car is not in use for a certain time, the battery system is considered in the calendar mode. Many parameters take part in this phenomenon, like the storage temperature, and the storage SoC. Cycling, on the other hand, is the application in which the cells are used to deliver energy to the load. In these usages, they are charged a discharged fully or partially with different current rates and at different ambient temperatures. Therefore, the lifetime of the cell is affected by different parameters, like the cell temperature, the current rate, the depth of discharge, and the frequency level. In order to study this effect, many experiments were performed in our facilities in the battery innovation center (BIC), MOBI group, VUB University. The lifetime models for LiB and LiC have been explained in [6,13], respectively. Figure 7 and Figure 8 show the capacity and internal resistance trends for the 2300 F LiC cells. As it is seen in Figure 7, the capacity decreases as the number of cycle increases. Moreover, the ambient temperature plays a role in the degradation. The lower the temperature, the lower the capacity degradation. Figure 8 shows the cycling effect on the internal resistance variation. As it is seen, for the cell at 45 °C, after 150,000 cycles, the internal resistance increase tends to a large temperature raise in the cell and, as a result, the test was stopped due to the safety measures. It is also clear in the result that the resistance rise for 45 °C and 0 °C is higher than at 25 °C, which is due to the rapid solid electrolyte interface (SEI) formation on the anode at those temperatures [21].

4. Hybridization and Load Sharing Methodology

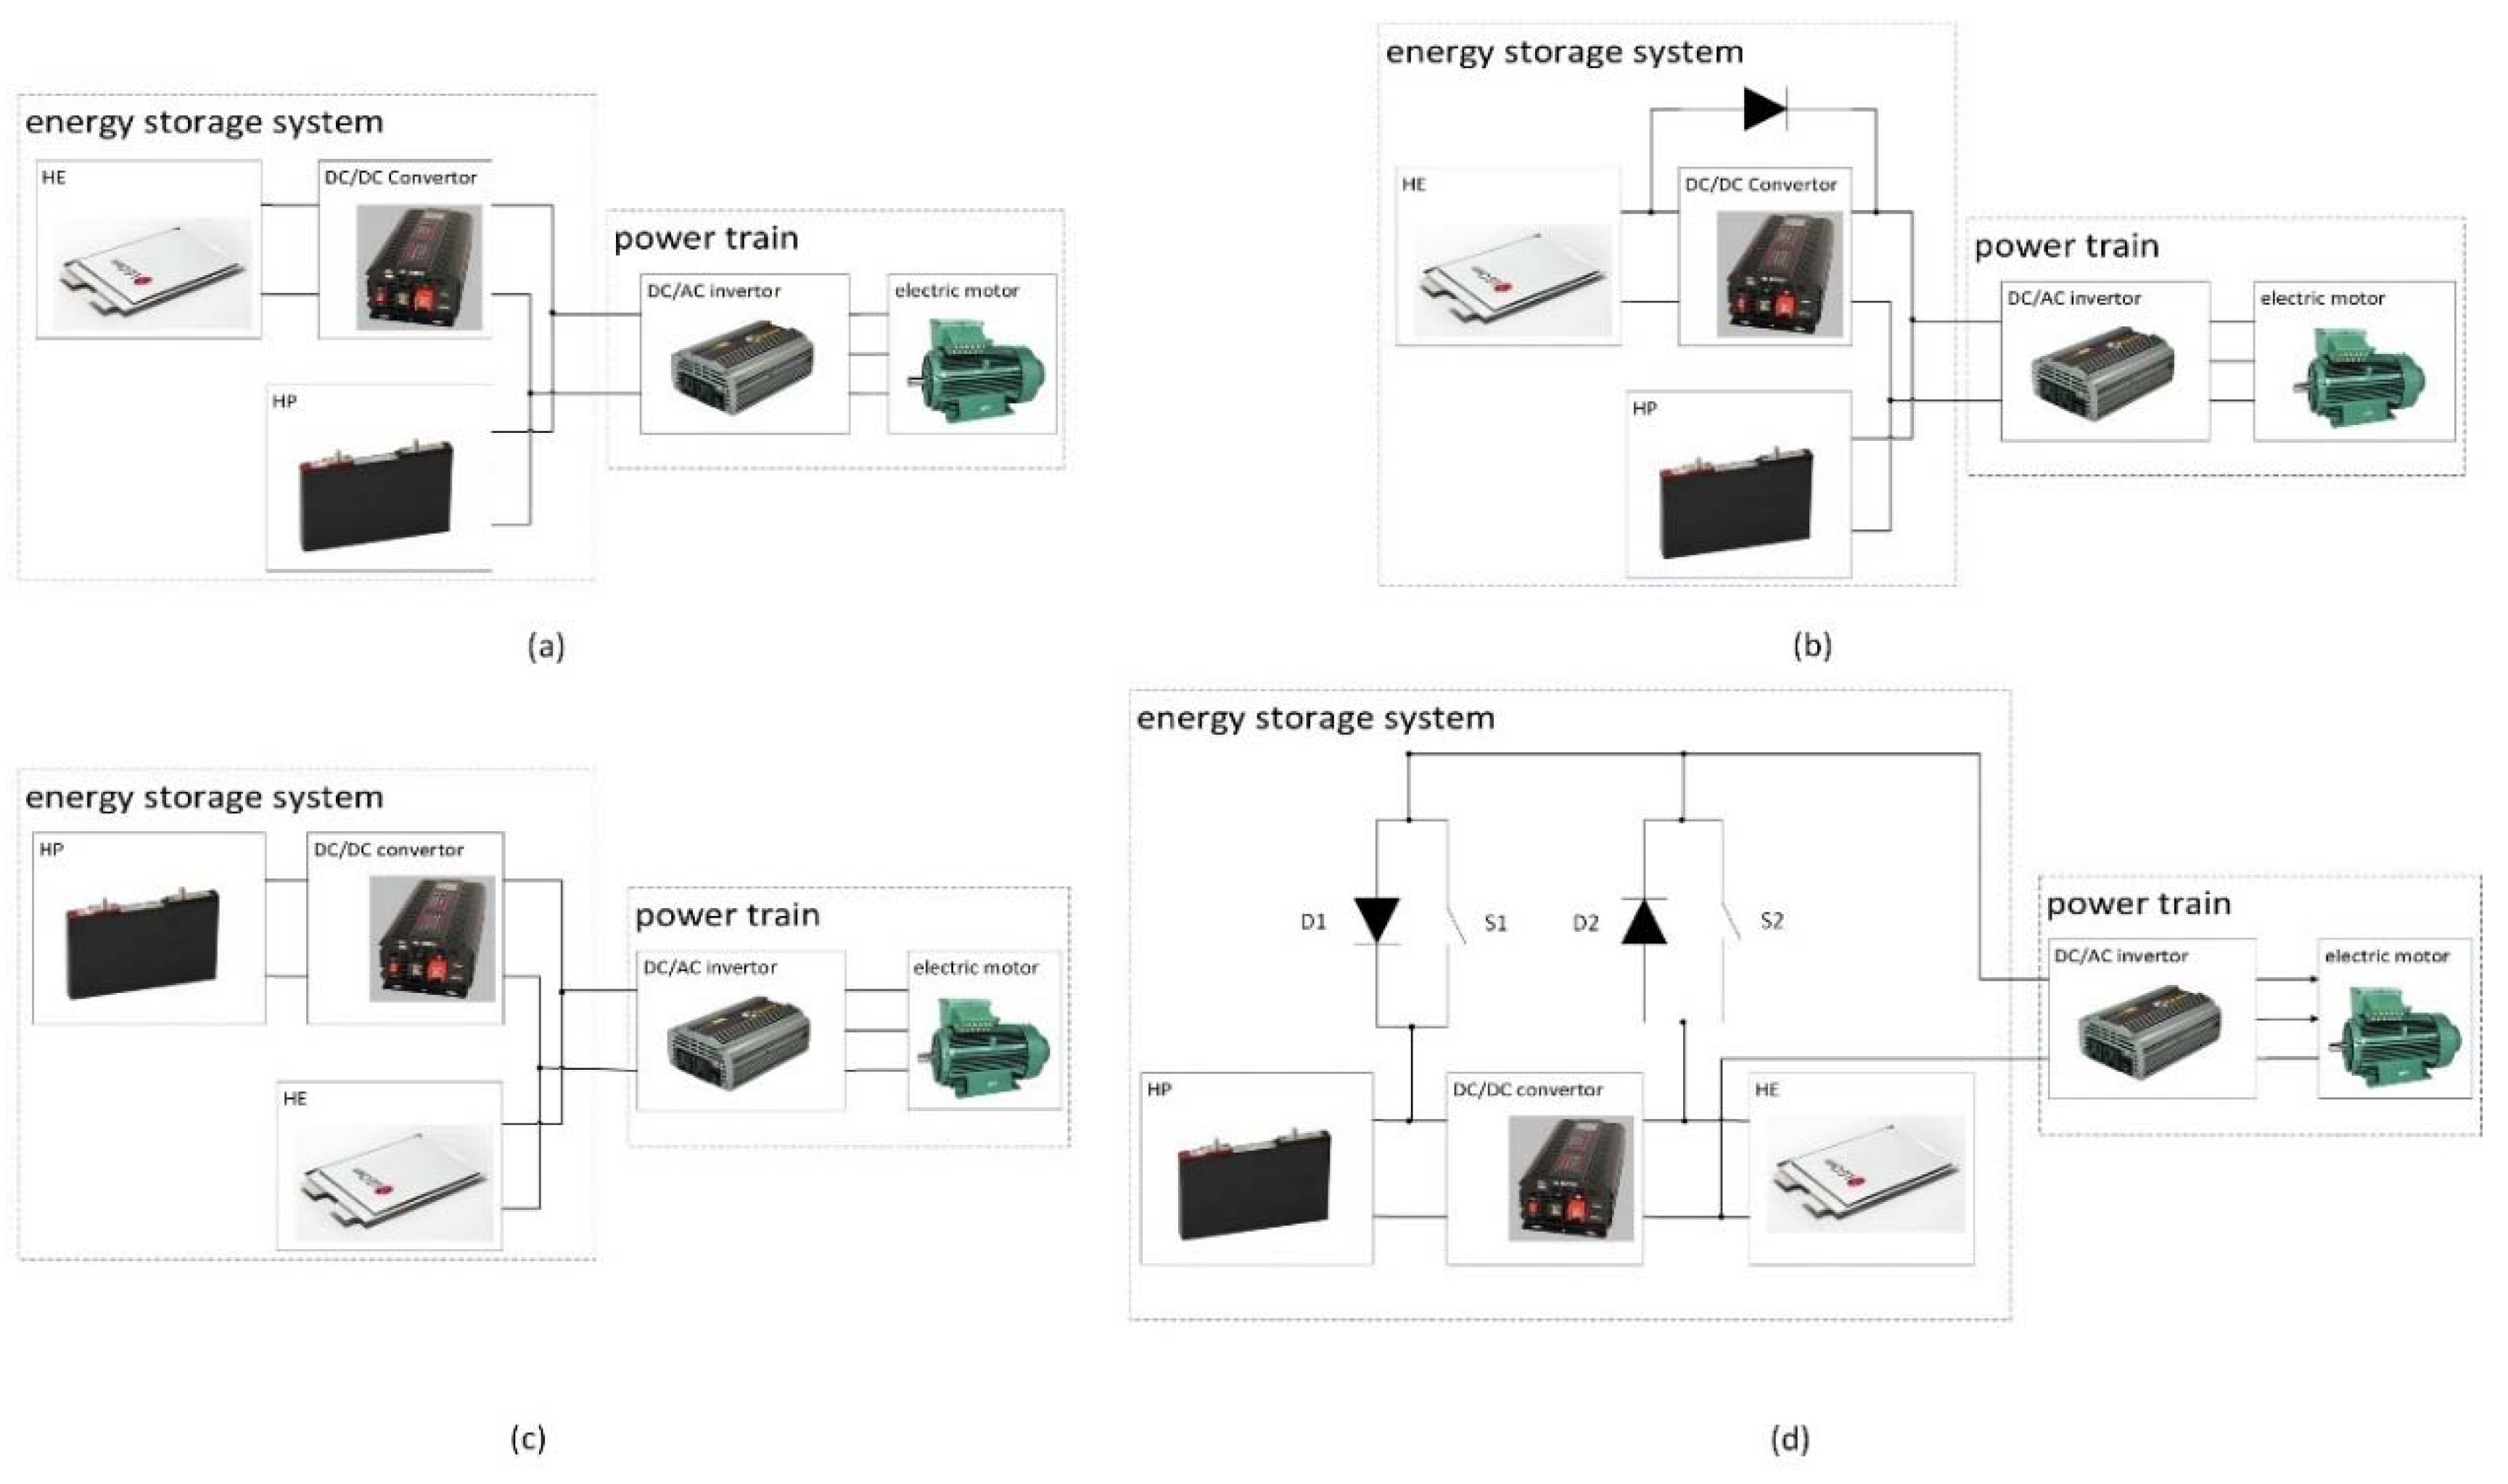
As briefly mentioned in the introduction, there are two main topologies to realize a hybrid unit with a high power (HP) storage system which is realized by means of super-capacitor or lithium-ion capacitors and a high energy (HE) storage system which is realized by means of a battery:
  • active topology [8], and
  • passive topology [8].
There is also a combination of those two methods which is called the semi-active topology [22]. A review article [23] validates the performance and cost efficiency of the semi-active topology in comparison to the passive and fully-active topology. Since the purpose of this study is to investigate the hybridization effect on the lifetime improvement of the energy storage system and to extend the range of the urban electric bus with one fully-charged ESS, a semi-active topology of hybridization is used herein. Some of the semi-active topologies are shown in Figure 9.
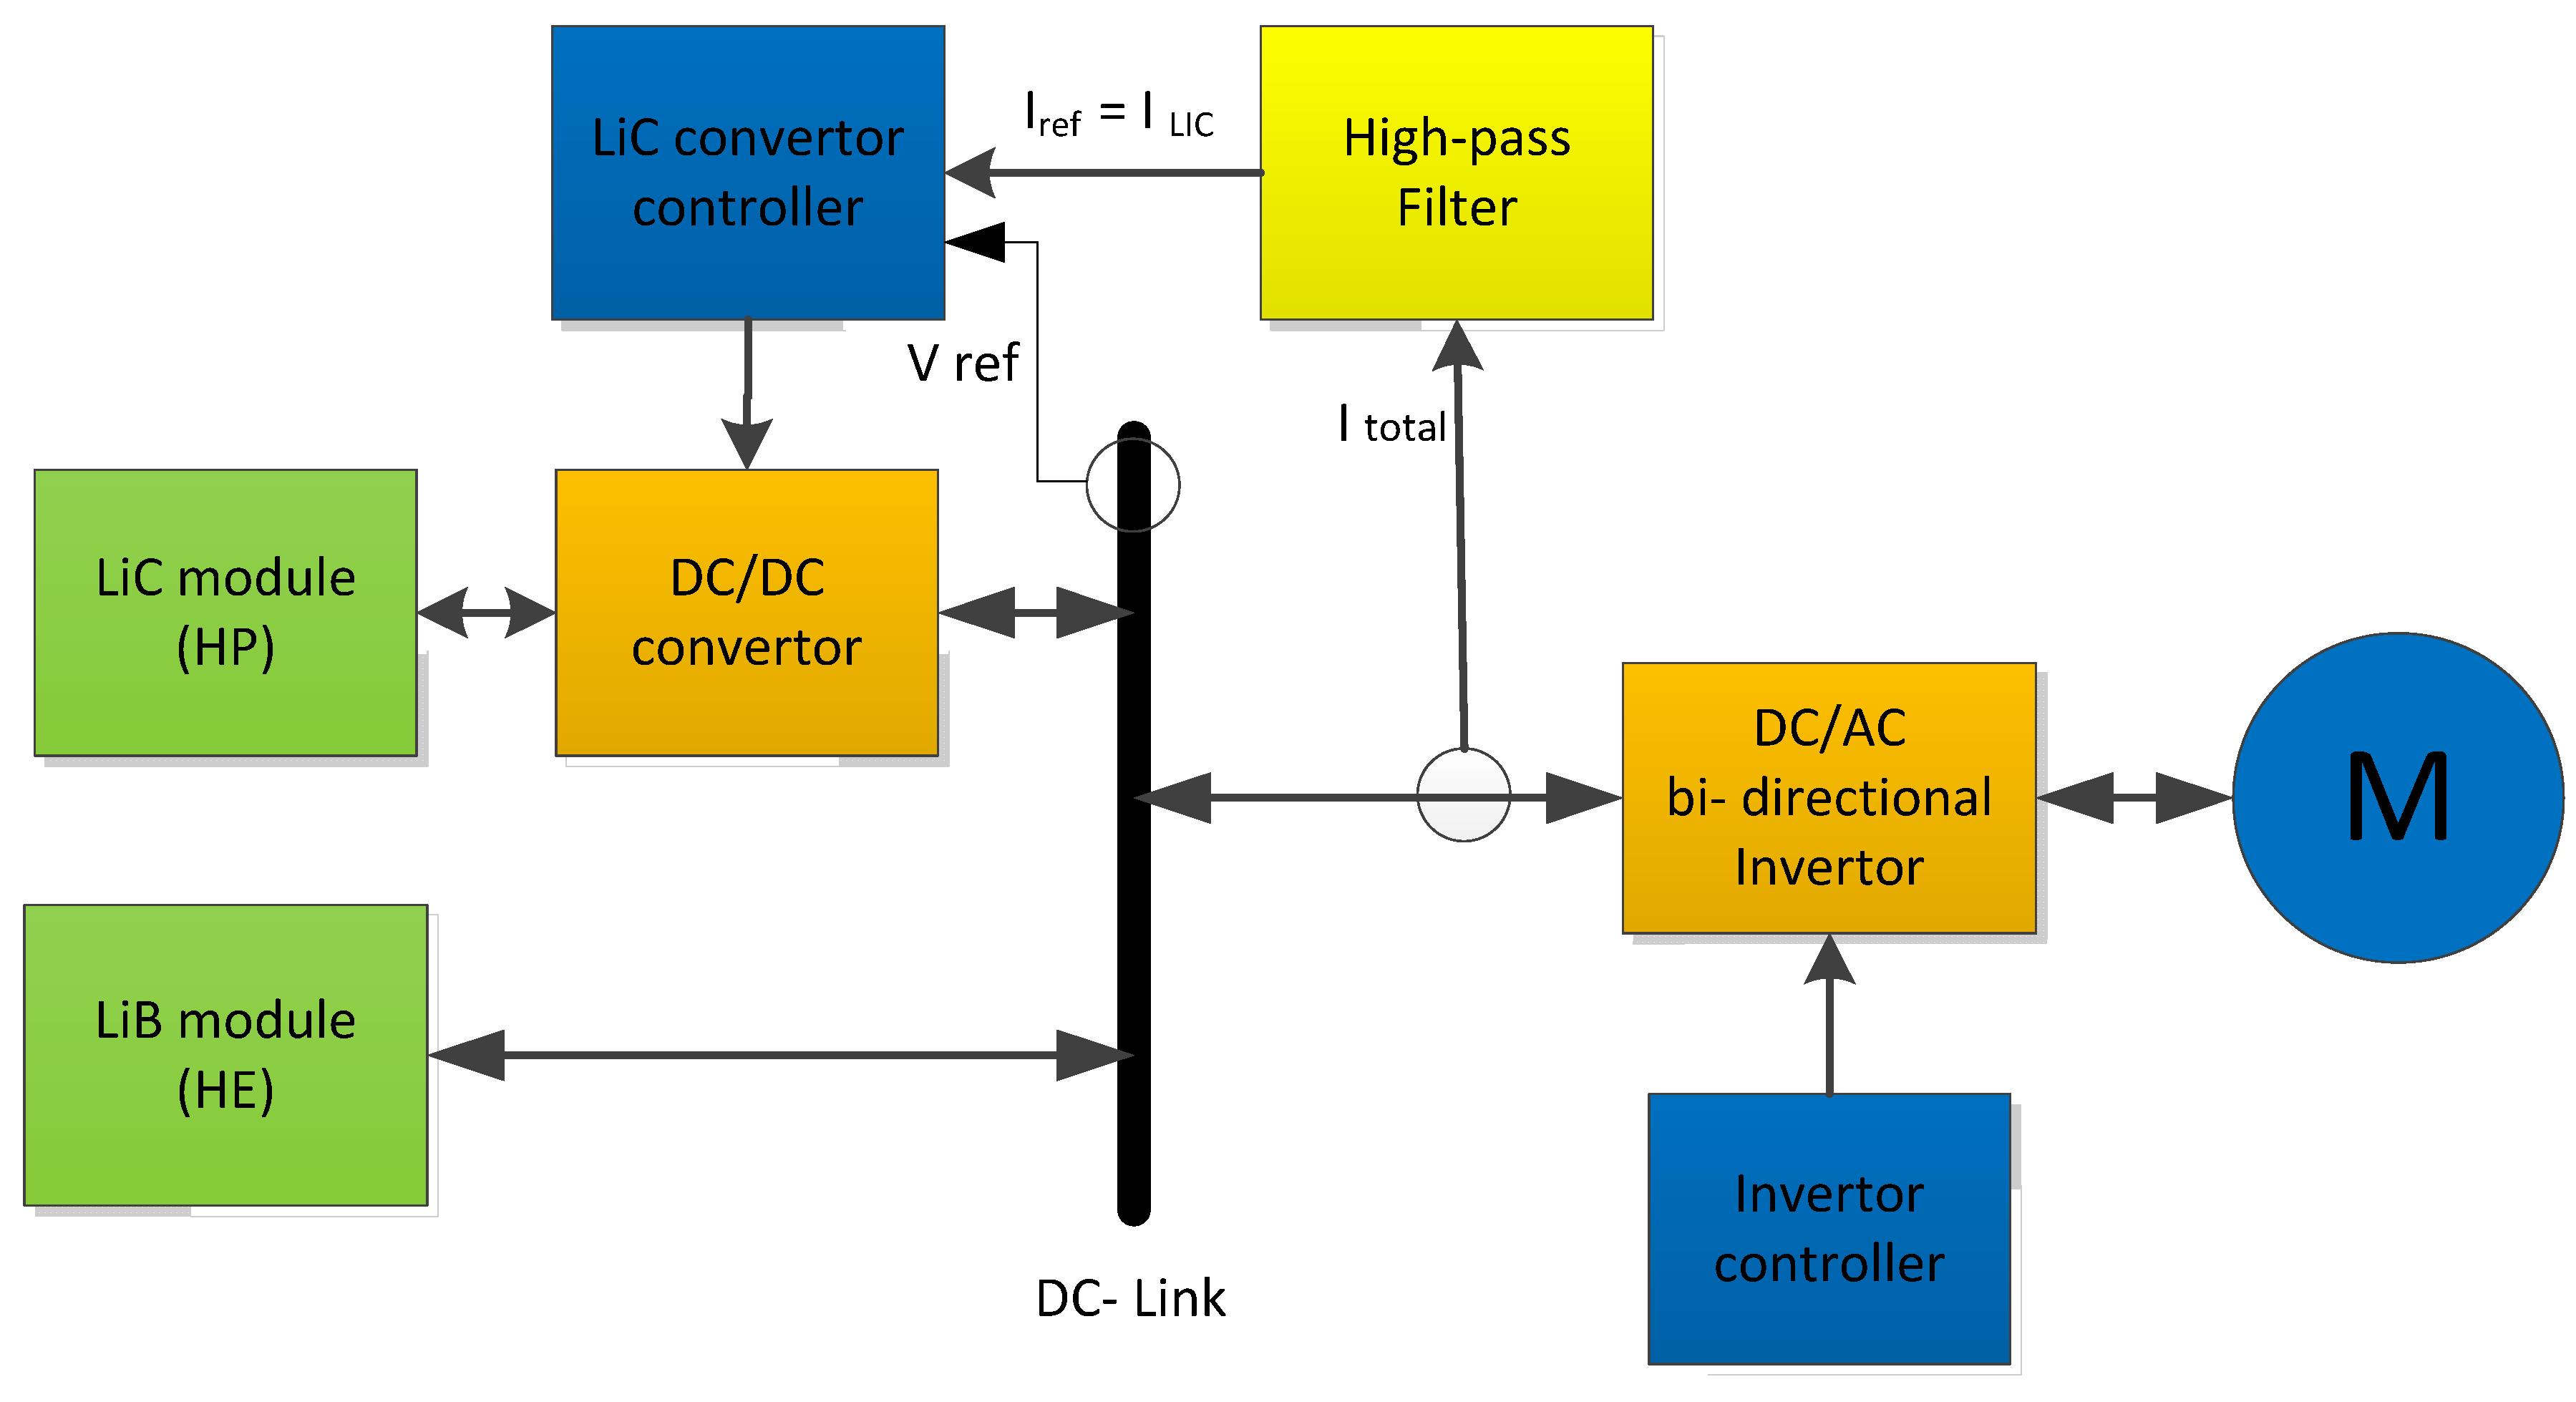
As the voltage level of the LiC module is different than the LiB module, the selected semi-active topology in this study, as shown in Figure 10, only utilizes a bi-directional DC/DC convertor to adjust the voltage level of the HP source with the voltage level of the HE source. In order to maintain this, a low-complexity control system with less computational demanding is proposed. The simplified diagram of the control unit is shown in Figure 10.
The controller also aims to limit the LiC current below the maximum value, which is 1200 A, and is given in the datasheet [24]. Moreover, it aims to keep the SoC of the LiC within the acceptable range. The maximum value of the current is also limited by the safety measures to keep the cells’ temperature below 70 °C. The acceptable range of SoC is defined by the control strategy. In this study, the initial SoC of the LiCs is kept at 50% in order to have enough stored energy to deliver to the bus during acceleration, as well as to have free capacity to store energy which goes back to the cell during the regenerative braking. Clearly, the SoC cannot go over 100% or below 0%, however, by limiting the SoC of LiCs to a narrower window (for example, 20% to 80%), LiB-ESS is asked to work with a higher current which, as a result, is imposed to a high-frequency current component. The range of the SoC needs to be defined so as to optimize the cost, size, volume, and lifetime of the entire system.
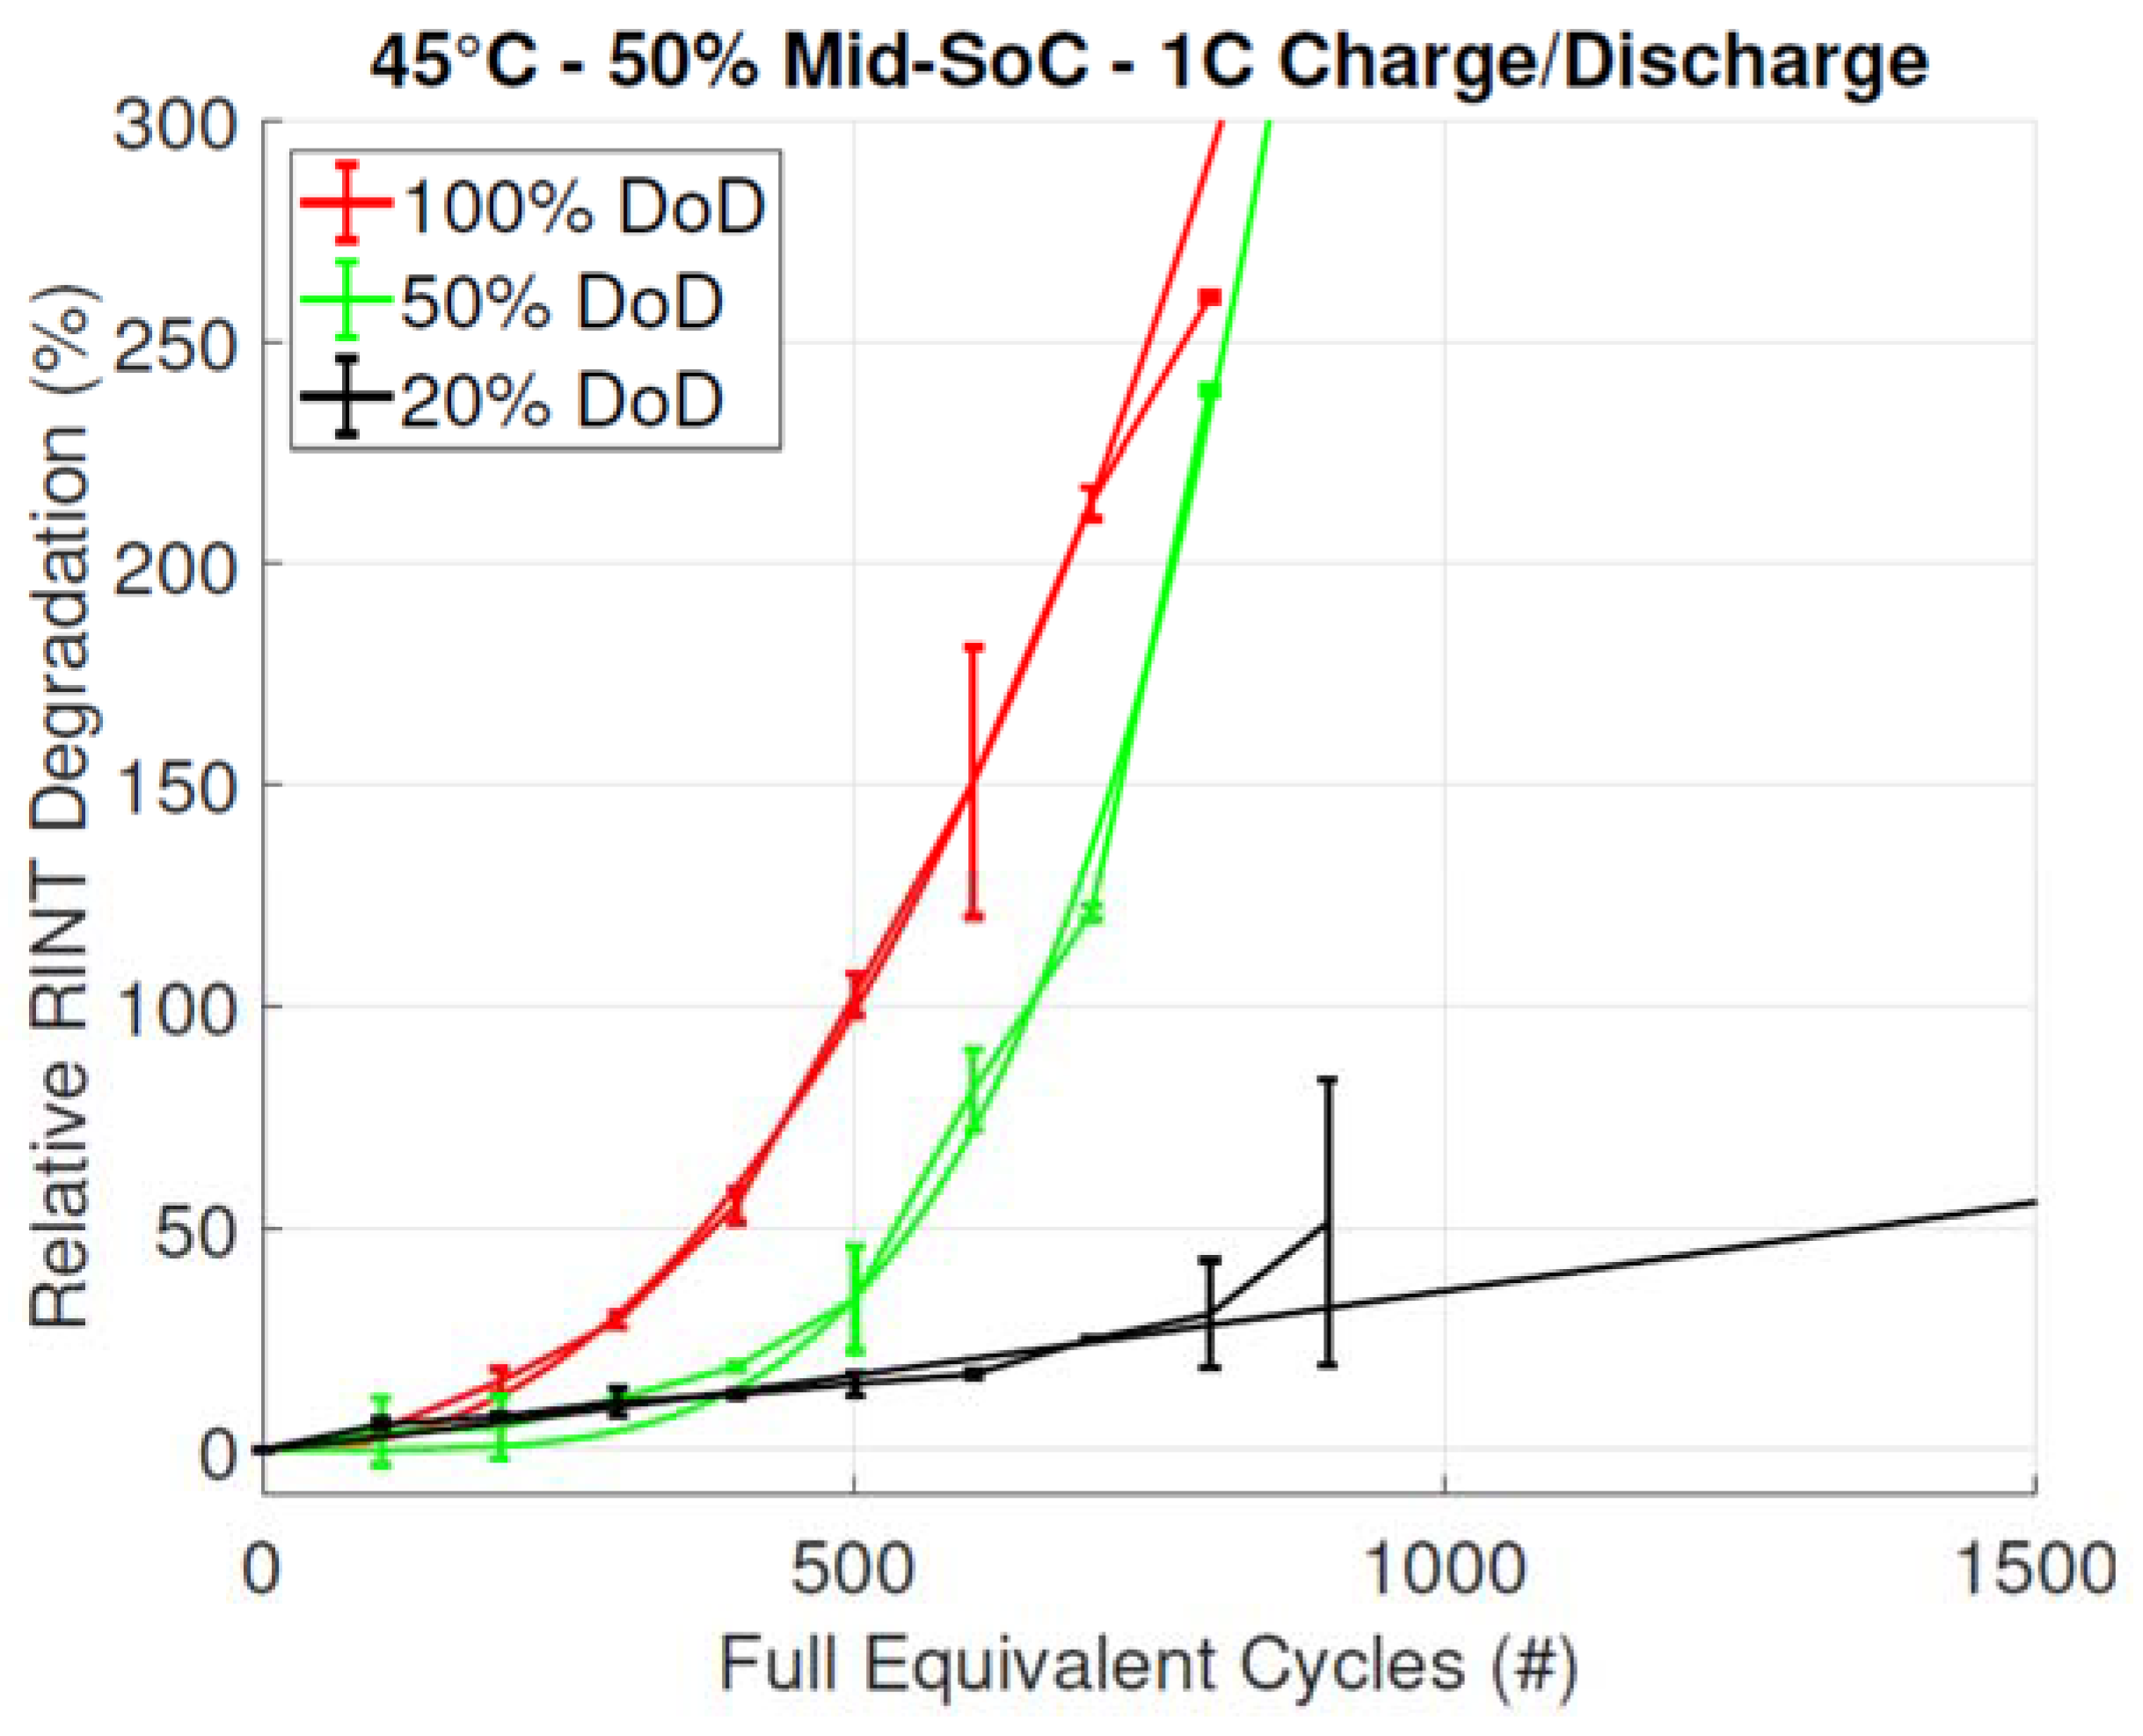
The control system is composed of a high-pass filter which is used to separate the high-frequency current components. These high-frequency components of the load are asked to be delivered by the LiC module. As a consequence, the high-current stress factor is removed from the battery and its lifetime is improved. As it is seen in Figure 2 and is explained in [13], a higher DoD tends to a higher increase in the internal resistance and a faster degradation in the capacity of the cell. By eliminating the high-frequency current components from the LiBs, these cells are imposed to a lower DoD which consequently improves the lifetime. In this study, the high-frequency current component ( I r e f ) is used as a reference for the LiC control unit. The DC-link voltage is also used as a reference voltage ( V r e f ) for the LiC controller. 
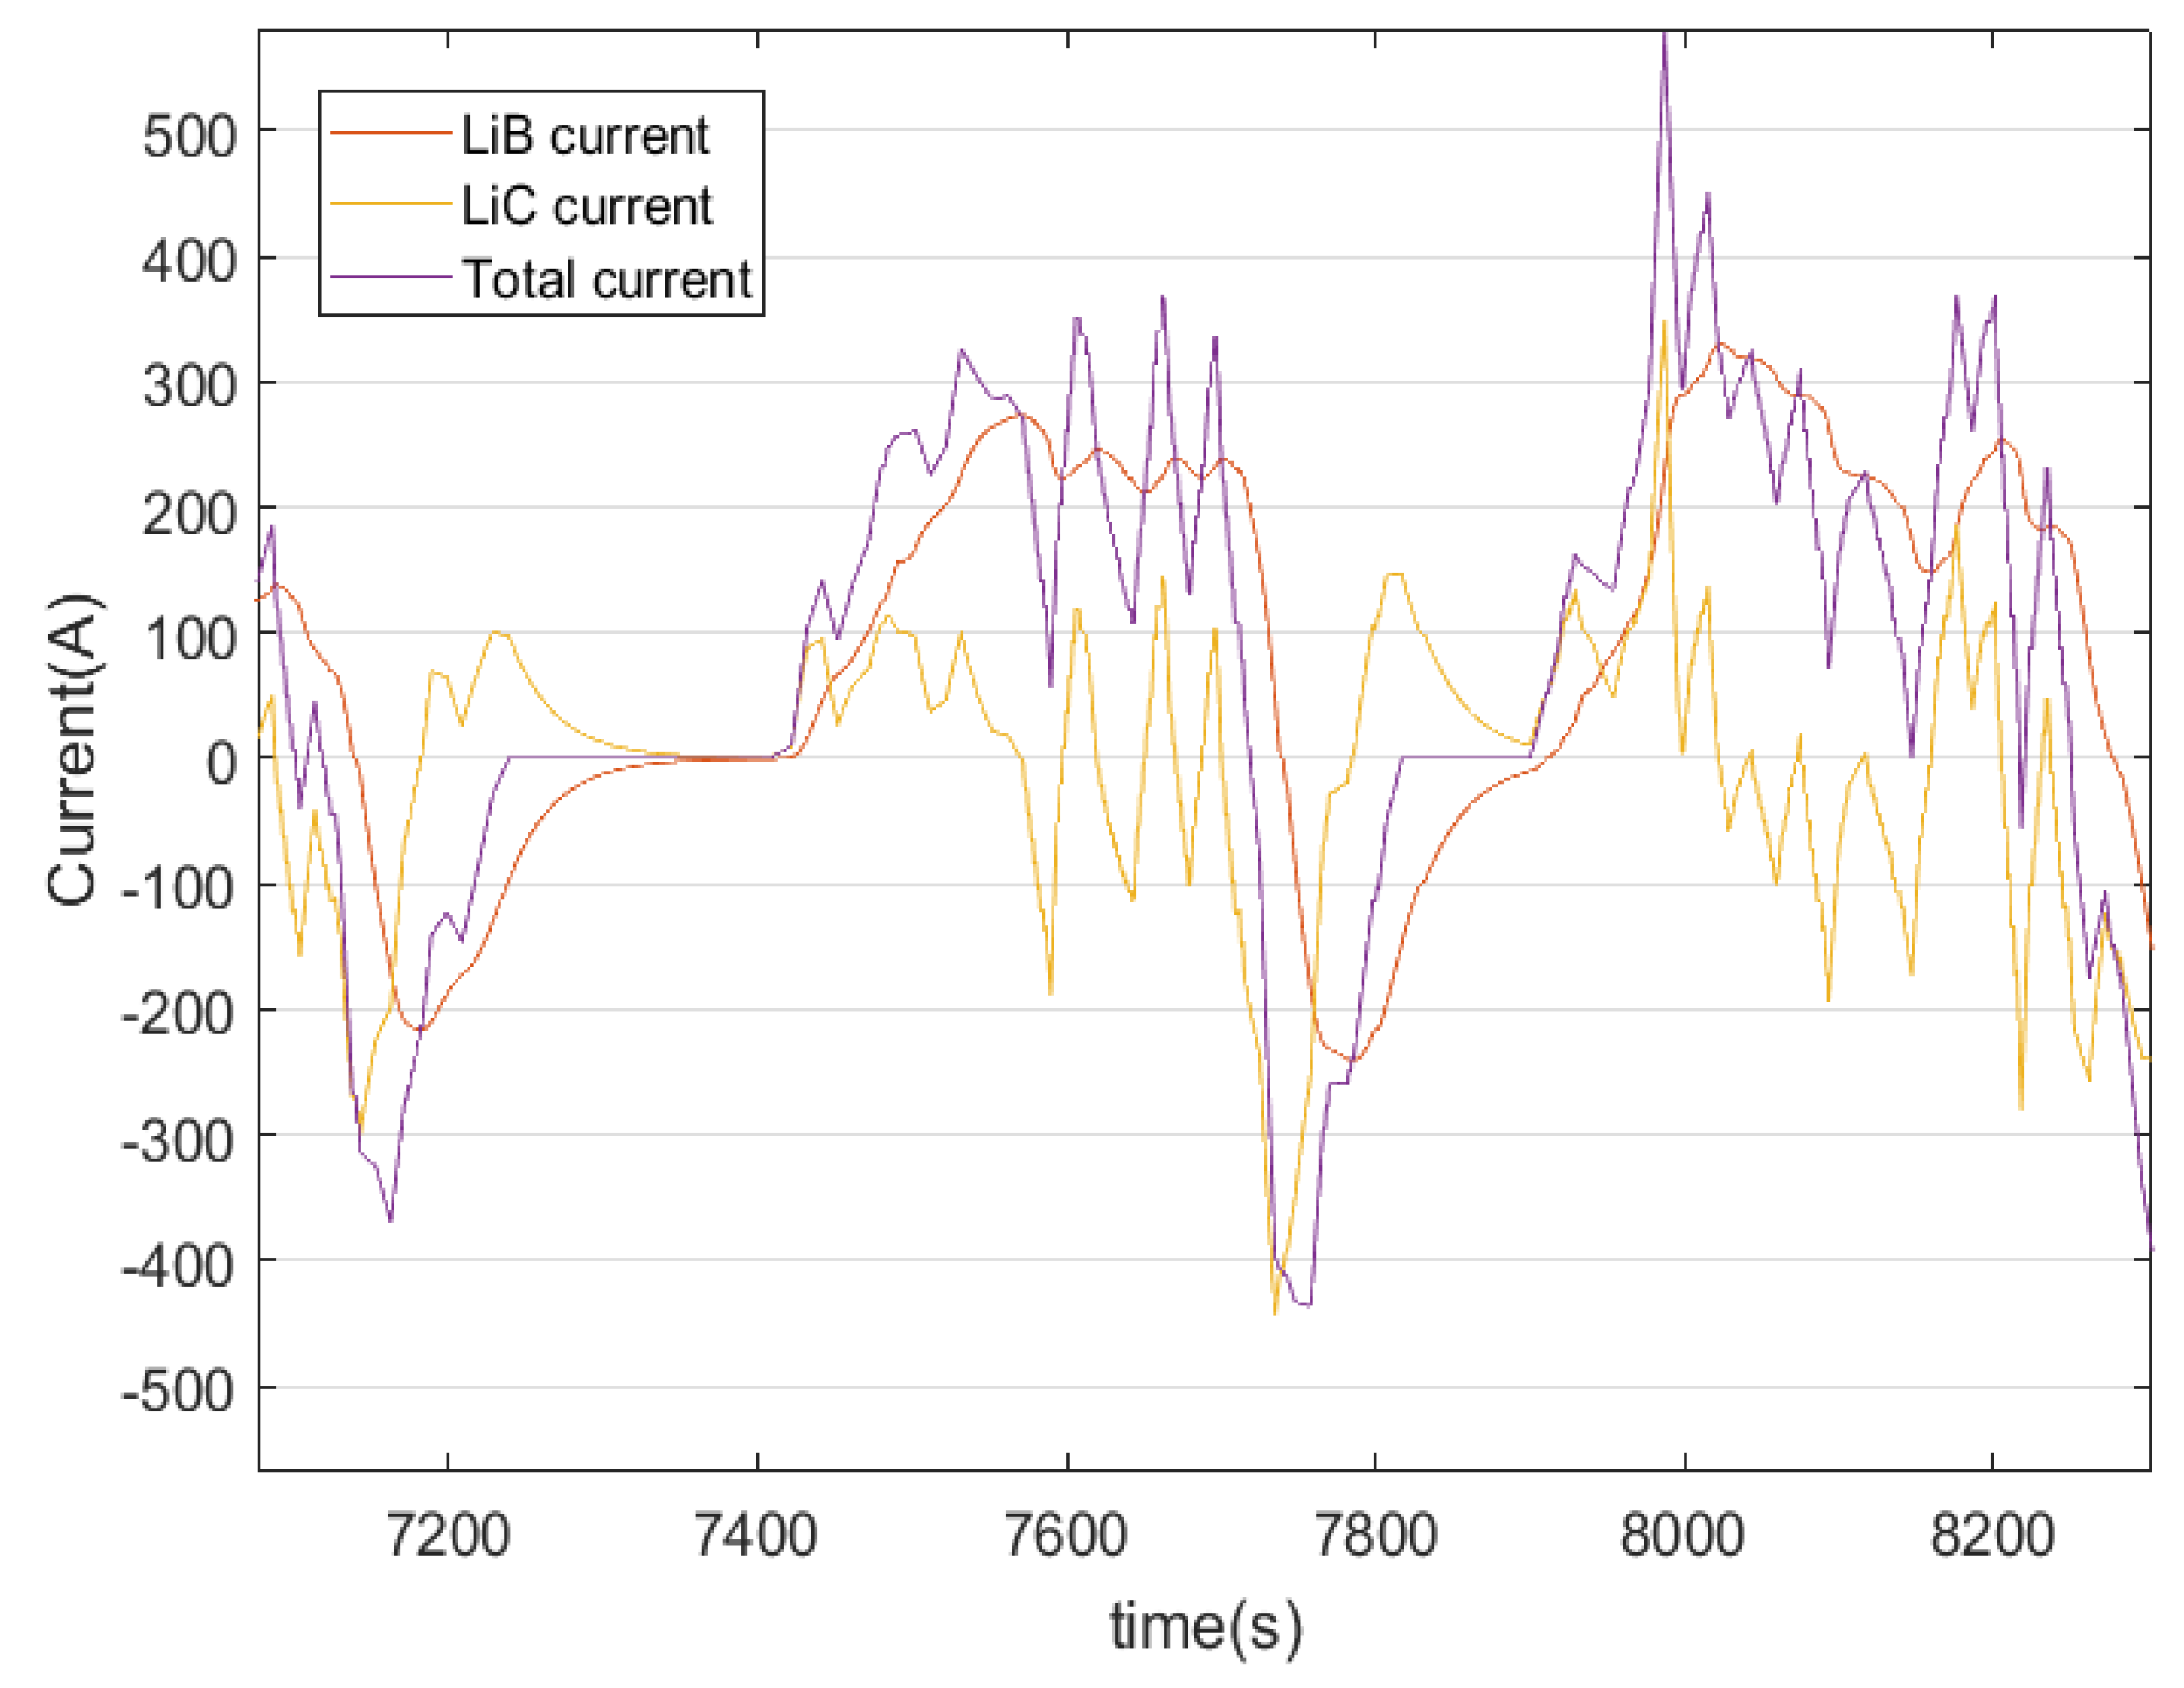
Figure 11 shows the LiC and LiB current component for the hybrid bus extracted from the London driving cycles.
To simplify the lifetime improvement calculation, a proportional equation for the DC/DC converter with the efficiency of 85% [25], as shown in Equation (9), is used:
P c o n v o u t = η P c o n v i n  
where the P c o n v o u t is a portion of power demand requested by the driver and the driving path which needs to be delivered by LiC module. However, this power demand must obey the reference values given by control unit, (reference current ( I r e f ) which is separated by filter from the total current and the reference voltage ( V r e f ) which comes from the DC-link). The P c o n v i n on the other hand, is the real value of the LiC module and is calculated as shown in Equation (10):
( V r e f I r e f = V b a t t I L i C r e q ) =   η V L i C r e a l I L i C r e a l

5. Electric Bus Specification and Energy Storage Unit Sizing

In this research, the authors intend to design a HESS for a pure electric bus for an urban public transportation application. The very first step for this design is to specify the bus requirements, including the electric motor power, energy storage capacity, passenger capacity, and requested range. The bus specifications are presented in Table 2, which is based on a commercial electric bus (Solaris Urbino 12 Electric) produced in Poland.
In order to calculate the peak current demand and the requested energy to travel for 240 km with one charge, the Millbrook London Transport Bus (MLTB) driving cycle is selected. As shown in Figure 12, the driving cycle is composed of Inner and Outer London to have a more realistic load profile.
Table 3 gives a summary of this driving cycle.
The speed load profile should be converted to the power and current profile for further calculation. Based on the simple physics equations we have:
a   =   V 2 V 1   t 2 t 1  
where V 2   ( m s ) and V 1   ( m s ) are the speed at t 2   ( s ) and t 1   ( s ) time sequences, respectively, and a ( m s 2 ) is the acceleration. The required force F   ( N )   to reach this acceleration is calculated based on the total mass m   ( kg ) of the vehicle as given in the Equation (12):
F   = m   × a
Having the average speed in each time interval, the average power can be calculated based on the Equation (13):
P a v e   = V a v e × F
where V a v e is the average speed in one sampling period. Then the power transformation efficiency from mechanical form to the electrical form and from AC mode to the DC mode, and vice versa, is considered to calculate the required power profile. In this study, the transformation efficiency is calculated as 80%. Figure 13 shows the power profile of the MLTB driving cycle.
As it can be seen in Figure 13, there are positive and negative power peaks. Negative power peaks mean that the power returns to the HESS. To have a more efficient electric bus and to improve the energy density of the vehicle, the negative power should be restored in the ESS.
As mentioned before, in this study the NMC 20 Ah cell is used as a HE storage unit. The specifications are given in [13]. The discharge and charge current for this cell are limited to the 5 C and 0.5 C, respectively. Specific measures should be taken in these cases to avoid extra current extraction and insertion which can negatively affect the lifetime of the cell.

5.1. Battery Bank Configuration for the MLTB Load Profile

The battery bank configuration is given in Table 4.
To meet the requirement, the maximum voltage is used to calculate the number of cells in series connection. Other calculation is given in Table 5.
The battery module is based on the electrothermal model of the NMC 20 Ah cell introduced in Section 3. By applying the power profile to the model as shown in Figure 14, at low SoC, the charge current will increase up to 15 A, which is higher than the maximum charge current limit (10 A) for this battery. To avoid this extra current, there are two possibilities: either to increase the number of parallel branches by 50% or to use the HESS.

5.2. Lithium Ion Capacitor (LiC) Pack Configuration

Table 6 shows the LiC pack requirement. The number of cells and branches are given in Table 7.

6. Simulation Results and Discussion

As explained in the previous section, to limit the charge current of the LiB cell, there are two possibilities:
  • To use the HESS.
  • To increase the number of stacks by 50%.
Here, in the simulation result, the two possibilities are compared from the cost, volume, weight, lifetime, and range points of view. Figure 15 shows the simulation environment for both the LiB-based ESS and HESS.

6.1. Hybrid Configuration

As mentioned before, the novelty of this research is using LiC instead of SC in the HESS. Using the LiC bank instead of SC with the same capacity and voltage level is lighter and less voluminous. These advantages increase the efficiency of the bus and free up more space for other applications.
As explained in Section 5, the hybrid configuration is composed of LiB pack (37 parallel stacks of LiB cells where each stack has 96 cells in series) in parallel with a LiC pack (one stack of LiC which has 184 cells in series). In this configuration, the total distance which the bus can travel with and without LiC is calculated. As shown in the Table 8, with the HESS, the bus can traverse about 16% more than LiB-EES. As it is seen in Table 8, the maximum charge current for the LiB-ESS is 50% more than the nominal value of the current although these charging pulses are applied in a very short duration, they are repeated thousands of times over the life period of the LiB EES. As these charge pulses are beyond the nominal charge C-rate value based on the datasheet, they may have a negative impact on the lifetime and efficiency of the NMC cell and should be avoided.
In Figure 16 the capacity degradation trend for LiB-ESS is compared with the HESS. In the LiB system, the charge over-current and high-frequency current pulses are applied to the cells while, with the application of HESS, the high-frequency stress, as well as the charge over-current are lifted from the cell resulting a longer life time and lower temperature raise in the cells. As explained in Section 2.3, the capacity degradation for LiBs is highly dependent to the temperature, DoD, and number of cycles. With the application of the HESS, as shown in Table 8, the cell temperature decreases slightly, but the discharge energy from the cell, which is represented by the number of cycles, decreases by 14%. Moreover, by lifting the peak current pulses over the LiB cells, the effect of high DoD is eliminated. Due to the above-mentioned reasons, the mileage is extended by 70,000 km.

6.2. LiB Configuration with 50% Over-Design

As explained in Section 6, another possibility to limit the charge over-current of the LiB module, is to increase the initial number of parallel stacks by 50%. With this change, as shown in Table 9, the charge current stays within the limit, but the stored energy, volume, weight, and cost increase significantly.
As it is shown in Figure 17, with this configuration, the range is improved noticeably, which is due to the greater amount of energy stored in the batteries. Having a lower current passing through the LiB-ESS in comparison to the HEES, the cells are degraded slower and the cell temperature is also much lower. As a result, the degradation process will be much lower than the HESS.
To compare both configurations from the volume, weight, range, and lifetime points of view, in the Table 10 and Table 11 the result for the HESS and LiB-ESS are given, respectively.
To summarize the obtained results for both the LiB-ESS and HESS, the results are summarized in Table 12.
It is clear from the obtained results that using a HESS downsizes the energy storage system, yet is capable of providing enough energy and power to the vehicle to meet its demand. It is also seen that with the hybrid configuration, the lifetime is improved by more than 16%. The volume and weight decrease by 30% in comparison to the over-designed LiB-ESS.

7. Conclusions

In this paper, a HESS, which is a combination of a lithium-ion battery and lithium-ion capacitor, was presented. The aim of this study is to show the effectiveness of hybrid systems to downsize the ESS and to decrease the volume and weight, as well as life-time improvement. At the first step, the electrothermal model and lifetime model for both the LiB and LiC units are explained. Then the hybridization method, which is a semi-active hybrid topology is briefly explained. The advantage of this topology, which has been presented in some of the previous studies, led us to this selection. The low complexity control strategy for load sharing between the LiB and LiC was explained briefly and the advantages were shortly explained. In addition to a lower computational cost, which it requires, the simplicity in load sharing based on a low-pass filter was considered for this selection. In the end, the unit sizing for both the energy storage units was thoroughly explained and was validated with the simulation results. Lastly, based on the calculation and simulation results, a comparison between the LiB-ESS and HESS was presented. This study shows that with the HESS, the lifetime is improved by 16% and the size is lowered by 30%. As a future work, the authors intend to optimize the LiC and LiB unit for a lower cost and size and with a higher energy and power density.

Author Contributions

M.S. has written the original draft and presented the hybridization methodology and the simulation environment; J.R. and S.K. provided technical data and practical information to make this study applicable for the industry and they also investigated the result from the technical point of view; and J.J., N.O., P.V.d.B. and J.v.M. reviewed and edited the manuscript and they also provided supervision guidance to this research.

Funding

This research received no external funding.

Acknowledgments

We acknowledge Flanders Make for the support to our research group. We also acknowledge JSR Micro NV for their support for this research.

Conflicts of Interest

The authors declare no conflict of interest.

References

  1. Schupbach, R.M.; Balda, J.C.; Zolot, M.; Kramer, B. Design methodology of a combined battery-ultracapacitor energy storage unit for vehicle power management. In Proceedings of the IEEE 34th Annual Conference on Power Electronics Specialist, Acapulco, Mexico, 15–19 June 2003; pp. 88–93. [Google Scholar] [CrossRef]
  2. Masih-Tehrani, M.; Ha’iri-Yazdi, M.R.; Esfahanian, V.; Safaei, A. Optimum sizing and optimum energy management of a hybrid energy storage system for lithium battery life improvement. J. Power Sources 2013, 244, 2–10. [Google Scholar] [CrossRef]
  3. Veneri, O.; Capasso, C.; Patalano, S. Experimental investigation into the effectiveness of a super-capacitor based hybrid energy storage system for urban commercial vehicles. Appl. Energy 2017. [Google Scholar] [CrossRef]
  4. Repp, S.; Harputlu, E.; Gurgen, S.; Castellano, M.; Kremer, N.; Pompe, N.; Wörner, J.; Hoffmann, A.; Thomann, R.; Emen, F.M.; et al. Synergetic effects of Fe3+ doped spinel Li4 Ti5 O12 nanoparticles on reduced graphene oxide for high surface electrode hybrid supercapacitors. Nanoscale 2018. [Google Scholar] [CrossRef] [PubMed]
  5. Genc, R.; Alas, M.O.; Harputlu, E.; Repp, S.; Kremer, N.; Castellano, M.; Colak, S.G.; Ocakoglu, K.; Erdem, E. High-Capacitance hybrid supercapacitor based on multi-colored fluorescent carbon-dots. Sci. Rep. 2017, 7, 1–13. [Google Scholar] [CrossRef] [PubMed]
  6. Soltani, M.; Jaguemont, J.; Omar, N.; Ronsmans, J.; van den Bossche, P.; Van Mierlo, J. Cycle Life Evaluation for Lithium-Ion Capacitors. In Proceedings of the Evs30 the 30th International Electric Vehicle Symposium and Exhibition, Stuttgart, Germany, 9–11 October 2017; pp. 1–7.
  7. Ultimo Lithium Ion Capacitor Prismatic Cells. Available online: www.jsrmicro.be (accessed on 18 July 2018).
  8. Zimmermann, T.; Keil, P.; Hofmann, M.; Horsche, M.F.; Pichlmaier, S.; Jossen, A. Review of system topologies for hybrid electrical energy storage systems. J. Energy Storage 2016, 8, 78–90. [Google Scholar] [CrossRef]
  9. Wang, X.; Yu, D.; Le Blond, S.; Zhao, Z.; Wilson, P. A novel controller of a battery-supercapacitor hybrid energy storage system for domestic applications. Energy Build. 2017, 141, 167–174. [Google Scholar] [CrossRef] [Green Version]
  10. Ruan, J.; Walker, P.D.; Zhang, N.; Wu, J. An investigation of hybrid energy storage system in multi-speed electric vehicle. Energy 2017, 140, 291–306. [Google Scholar] [CrossRef]
  11. Zhang, S.; Xiong, R.; Cao, J. Battery durability and longevity based power management for plug-in hybrid electric vehicle with hybrid energy storage system. Appl. Energy 2016, 179, 316–328. [Google Scholar] [CrossRef]
  12. Song, Z.; Hou, J.; Xu, S.; Ouyang, M.; Li, J. The influence of driving cycle characteristics on the integrated optimization of hybrid energy storage system for electric city buses. Energy 2017, 135, 91–100. [Google Scholar] [CrossRef]
  13. De Hoog, J.; Timmermans, J.M.; Ioan-Stroe, D.; Swierczynski, M.; Jaguemont, J.; Goutam, S.; Omar, N.; Van Mierlo, J.; Van Den Bossche, P. Combined cycling and calendar capacity fade modeling of a Nickel-Manganese-Cobalt Oxide Cell with real-life profile validation. Appl. Energy 2017, 200, 47–61. [Google Scholar] [CrossRef]
  14. Nikolian, A.; Firouz, Y.; Gopalakrishnan, R.; Timmermans, J.M.; Omar, N.; van den Bossche, P.; van Mierlo, J. Lithium ion batteries—Development of advanced electrical equivalent circuit models for nickel manganese cobalt lithium-ion. Energies 2016, 9, 360. [Google Scholar] [CrossRef]
  15. Nikolian, A.; De Hoog, J.; Fleurbay, K.; Timmermans, J.; Van De Bossche, P.; Van Mierlo, J. Classification of Electric modelling and Characterization methods of Lithium-ion Batteries for Vehicle Applications. In Proceedings of the European Electric Vehicle Congress, Brussels, Belgium, 13–16 May 2014; pp. 1–15. [Google Scholar]
  16. Berckmans, G.; Ronsmans, J.; Jaguemont, J.; Samba, A.; Omar, N.; Hegazy, O.; Soltani, M.; Firouz, Y.; van den Bossche, P.; Van Mierlo, J. Lithium-Ion Capacitor: Analysis of Thermal Behavior and Development of Three-Dimensional Thermal Model. J. Electrochem. Energy Convers. Storage 2017, 14, 041005. [Google Scholar] [CrossRef]
  17. Liu, Z.; Li, H.X. Thermal modeling for vehicle battery system: A brief review. In Proceedings of the 2012 International Conference on System Science and Engineering, Dalian, Liaoning, China, 30 June–2 July 2012; pp. 74–78. [Google Scholar]
  18. Jaguemont, J.; Nikolian, A.; Omar, N.; Goutam, S.; Van Mierlo, J.; Van den Bossche, P. Development of a 2D-thermal model of three battery chemistries considering entropy. IEEE Trans. Energy Convers. 2017, 32, 1. [Google Scholar] [CrossRef]
  19. De Hoog, J.; Jaguemont, J.; Abdel-Monem, M.; Van Den Bossche, P.; Van Mierlo, J.; Omar, N. Combining an electrothermal and impedance aging model to investigate thermal degradation caused by fast charging. Energies 2018, 11. [Google Scholar] [CrossRef]
  20. Firouz, Y.; Omar, N.; Van Den Bossche, P.; Van Mierlo, J. Electro-thermal modeling of new prismatic lithium-ion capacitors. In Proceedings of the 2014 IEEE Vehicle Power and Propulsion Conference, Coimbra, Portugal, 27–30 October 2014; Volume 2, pp. 1–6.
  21. Sivakkumar, S.R.; Pandolfo, A.G. Evaluation of lithium-ion capacitors assembled with pre-lithiated graphite anode and activated carbon cathode. Electrochim. Acta 2012, 65, 280–287. [Google Scholar] [CrossRef]
  22. Cao, J.; Emadi, A. A new battery/ultracapacitor hybrid energy storage system for electric, hybrid, and plug-in hybrid electric vehicles. IEEE Trans. Power Electron. 2012, 27, 122–132. [Google Scholar] [CrossRef]
  23. Song, Z.; Hofmann, H.; Li, J.; Hou, J.; Han, X.; Ouyang, M. Energy management strategies comparison for electric vehicles with hybrid energy storage system. Appl. Energy 2014, 134, 321–331. [Google Scholar] [CrossRef]
  24. LiC Cell 2300F, Prismatic (JSR CPQ2300S). Available online: https://www.electrostandards.com/Product Detail/?productid=2446 (accessed on 18 July 2018).
  25. Shrivastava, A.; Calhoun, B. A DC-DC converter efficiency model for system level analysis in ultra low power applications. J. Low Power Electron. Appl. 2013, 3, 215–232. [Google Scholar] [CrossRef]
Figure 1. Schematic of the second-order Thevenin model [13].
Applsci 08 01176 g001
Figure 2. The internal resistance incremental trend based on the equivalent number of cycles [19].
Applsci 08 01176 g002
Figure 3. The capacity degradation trend based on the equivalent number of cycles [19].
Applsci 08 01176 g003
Figure 4. The block diagram of an electrothermal model [20].
Applsci 08 01176 g004
Figure 5. First-order electrical model.
Applsci 08 01176 g005
Figure 6. First-order electric circuit for the thermal part of the electrothermal model [20].
Applsci 08 01176 g006
Figure 7. Capacity evolution of LiC 2300F with a heavy-duty load profile.
Applsci 08 01176 g007
Figure 8. Internal resistance evolution of LiC 2300 F with a heavy-duty load profile.
Applsci 08 01176 g008
Figure 9. Semi-active hybrid topologies: (a) battery semi-active hybrid energy storage topology, (b) extended battery semi-active hybrid energy storage topology, (c) LiC semi-active hybrid energy storage topology, and (d) advanced LiC semi-active hybrid energy storage topology [8].
Applsci 08 01176 g009
Figure 10. Simplified diagram of the hybrid battery-LiC power source and the proposed control system [22].
Applsci 08 01176 g010
Figure 11. The LiB and LiC current component for the proposed electric bus based on the London driving cycle.
Applsci 08 01176 g011
Figure 12. Speed profile of the MLTB driving cycle.
Applsci 08 01176 g012
Figure 13. Power profile of the MLTB driving cycle.
Applsci 08 01176 g013
Figure 14. The simulation result for the HE storage system.
Applsci 08 01176 g014
Figure 15. The simulation environment for both ESS and HESS.
Applsci 08 01176 g015
Figure 16. Capacity degradation trend versus the passable distance for LiB-ESS and HESS.
Applsci 08 01176 g016
Figure 17. Capacity degradation trend versus the passable distance for the over-designed LiB-ESS and HESS.
Applsci 08 01176 g017
Table 1. Estimated parameters for Equation (8) at 10 °C.
ParameterCurrent (A)
1050100150200240300450600
α −4−1.008−0.356−0.134−0.04260.0010.020.0540.059
β 42.271.270.86090.630.540.470.45
Table 2. Electric bus specification.
ParameterValue
Length12 m
Net Weight plus passengers 13.6 t + 6.4 t
Electric motor power120 kW (two motors of 60 kW)
Range 240 km
Battery capacity240 kWh
Table 3. Summary of the MLTB driving cycle.
ParameterUnitPh1 Outer LondonPh2 Inner LondonOverall
Total times13819012282
Time at idles13819012282
Distancekm6.462.508.96
Average speed km / h 2215.920.5
Max speed km / h 4734.448.7
Max acceleration m / s 2 51.51.5
Max deceleration m / s 2 −2.1−2.2−2.2
No of stops ≥15 s 11819
Table 4. The configuration of the LiB battery bank.
Battery TypeVoltage RangeEnergy
NMC 20 Ah250–400 V240 kWh
Table 5. The specifications of the LiB battery bank.
ParameterValue
capacity of each cell @ 100% DoD20 Ah
Voltage @ 0% SoC3 V
Nominal voltage3.65 V
Voltage @ 100 SoC4.15 V
number of cells in series 400 / 4.15 = 96
Nominal voltage of battery bank 96   ×   3.65 = 350.4   V
Required capacity in Ah 240   kWh / 350.4   V = 685   Ah  
Number of stacks in parallel N =   685 / 20 = 35 1
Stored energy in one stack 350.4   ×   20 = 7   kWh
Maximum continuous current (nominal power of electric motor divided by nominal voltage) 120 , 000   W / 350.4   V = 342.46   A   yields   current   of   each   stack =   342.46 / 35 = 9.78   A
1 In the simulation environment, 35 stacks in parallel do not provide 240 kWh energy (due to the internal losses in each cell) which results in a shorter mileage, as a result, we increased the number of stacks to 37.
Table 6. The LiC bank configuration.
Battery TypeVoltage RangeEnergy
LiC 2300 F (1 Ah)400–700 V572.9 Wh
Table 7. The specification of LiC bank.
ParameterValue
Capacity of each cell @ 100% DoD 1 Ah
Voltage @ 0% SoC2.2 V
Voltage @ 100 SoC3.8 V
number of cells in series700/3.8 = 184
Stored energy in one string 0.5729 kWh
Table 8. Obtained results for both the LiB-ESS and HESS.
ParameterLiB-ESSHESS
Time for one discharge (s)66,25966,794
Range for one discharge (km)260.37262.48
Cell temperature (°C)25.65LiB: 25.4Lic: 35
Number of Eq cycles for one discharge1.91.64625.4
Maximum discharge current20.1512.26451
Maximum charge current15.16 > 109.7572
Range until end of life (km)410,476.15480,148.35
Driving time until end of life (h)29,015.1533,940.04
Table 9. Obtained results for the LiB-ESS with 50% over-design.
Parameter
Time for One Discharge (s)Range for One Discharge (km)Cell Temperature (°C)Number of Eq Cycle for One DischargeMaximum Discharge Current (A)Maximum Charge Current (A)Range until End of Life (km)Driving Time until End of Life (h)
LiB-ESS100,549395.1225.2521310592,692.7341,895.41
Table 10. Size and cost of the HESS.
ParameterLiCLiBTotal
Single CellModuleSingle CellModule
Weight (kg)0.36567.160.4281520.251587.41
Volume (l)0.21639.740.196696.19735.93
Cost (%) 5 95100
Table 11. Size and cost of the energy storage system based on LiB with 50% oversizing.
ParameterSingle CellOversized LiB Module
Weight (kg)0.428 0.428 × 96 × 37 × 1.5 = 2280.38
Volume (l)0.196 0.196 × 96 × 37 × 1.5 = 1044.28
Cost (%) 144%
Table 12. A summary of Table 10 and Table 11.
Parameter96S56P96S37P + 184S1P
weight (kg)2300.921587.41
volume (l)1053.69735.93
Cost (%)144100
energy (kWh)392 1259.57 2
range (km)592,692.73480,148.35
continuous driving time (h)41,895.4133,940.04
1 7 kWh × 56 = 392 kWh, 2 7 kWh × 37 + 0.5729 kWh = 259.57 kWh.

