Robust Design of 3D-Printed 6–18 GHz Double-Ridged TEM Horn Antenna


1
Department of Electrical and Computer Engineering, Sungkyunkwan University, Suwon 440-746, Korea
2
Department of Electronics and Computer Engineering, Hanyang University, Seoul 133-971, Korea
*
Author to whom correspondence should be addressed.
Appl. Sci. 2018, 8(9), 1582; https://0-doi-org.brum.beds.ac.uk/10.3390/app8091582
Submission received: 28 July 2018
/
Revised: 23 August 2018
/
Accepted: 3 September 2018
/
Published: 7 September 2018
(This article belongs to the Special Issue 3D Printed Antennas)
Abstract
:A robust design of a 3D-printed 6–18 GHz double-ridged TEM horn antenna is proposed in this paper. The designed TEM horn antenna has two parts: an adaptor and a horn aperture. The adaptor is realized using a double-ridged waveguide to extend the operating bandwidth of the dominant mode (TE10 mode). Meanwhile, the horn aperture section is implemented in an exponentially tapered configuration to match the impedance of the double-ridged waveguide with the intrinsic impedance. The performance of the initially designed antenna shows that the reflection coefficient and gain levels are less than −13 dB and greater than 5.5 dBi within the 6–18 GHz band, respectively. The initial design was well done, but the noise factors that may occur during the manufacturing process were not taken into account. To design an antenna considering these noise factors, the parameters of the initial design are optimized by a novel robust design method also proposed in this paper. The robustness of the antenna optimized by the proposed method is approximately 12.4% higher than that of the initial antenna. The validity of the proposed method was tested by fabricating the antenna. A prototype of the optimized antenna with the proposed robust design method is fabricated using a 3D printer with a stereolithographic apparatus attached, and the surface of the frame is covered by a nano-silver plating. The measured results of the fabricated antenna are in good agreement with the simulation results over the operating band. The measured −10 dB reflection coefficient bandwidth of the antenna can cover 6–18 GHz. In addition, the measured gain ranges from 4.42 to 10.75 dBi within the 6–18 GHz band.
1. Introduction
Horn antennas are easy to fabricate and have good directional radiation performance. For these reasons, they are widely used in applications such as standard measurement equipment, radar, and communication systems [1]. The antennas are generally manufactured by milling or electro-forming processes with metallic materials. They are relatively heavy, incur high production costs, and take a long time to be fabricated [2].
3D printing technology has attracted much attention as a means by which to realize various shapes [3,4,5]. The technology has advantages such as lightweight processes, a low cost, and a short production time [6,7]. Three-dimensional printing technologies are mainly classified into four types: the selective deposition of an extruded material (fused deposition modelling, FDM), the curing of resin with ultraviolet rays (stereolithography apparatus, SLA), powder binding (selective laser sintering, SLS), and a mixture of stereolithography and inkjet printing (photopolymer jetting, PolyJet) [8,9]. The FDM method has low resolutions, while the SLA, SLS, and PolyJet methods offer high resolutions. Therefore, the SLA, SLS, and PolyJet methods are typically utilized for centimetre- and millimetre-wave applications. Nevertheless, they remain associated with a serious fabrication tolerance problem.
In order to overcome the tolerance problem, a robust design method is required. This can be accomplished with an optimization algorithm which selects the combination of design parameters which minimizes the influence of noise factors, such as manufacturing tolerances. Taguchi’s method (TM) is a well-known technique offering robust designs. This method was developed on the basis of the orthogonal array (OA) concept, which can effectively reduce the number of tests required in the design process [10]. TM has been widely applied to many areas, such as metallurgical engineering, material engineering, and mechanical engineering, among others [11,12,13]. In recent years, it has also been used to design antennas. However, the solutions obtained by TM are highly likely to fall into the local minima, as the search boundary condition in TM is very limited [14,15].
In this paper, robust design of 3D-printed double-ridged TEM horn antenna is proposed. The purpose of the robust design is to minimize the distortion of the antenna performance as caused by physical factors such as manufacturing errors which arise during the 3D printing process. The proposed method is realized by combining a genetical swarm optimization (GSO) algorithm [16] and an OA matrix. Unlike TM, a solution obtained by the proposed method is less likely to encounter the local minima due to the random factor of the GSO. The design of the TEM horn antenna is illustrated in Section 2. The procedure used to ensure a robust design method is described in detail in Section 3. Simulated results of the robust design are presented in Section 4 and the measurement results of the antenna with the robust design are discussed in Section 5.
2. TEM Horn Antenna Design
2.1. Adaptor Design
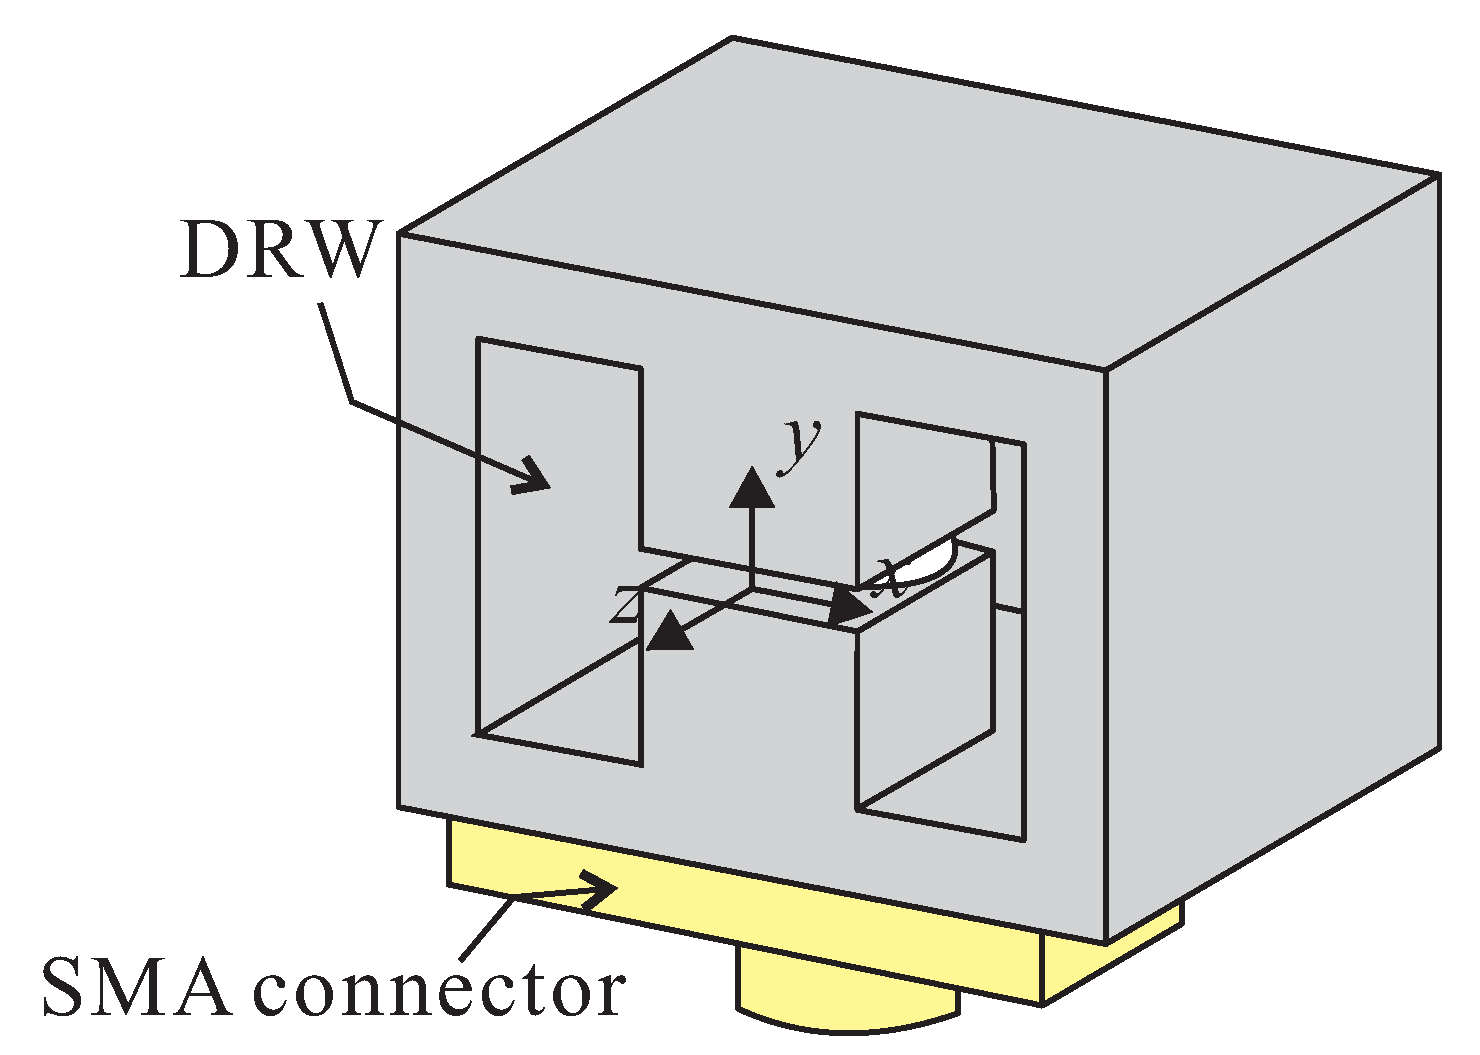
Figure 1 shows a 3D view of an adaptor which consists of a double-ridged waveguide (DRW), a SMA connector (Gigalane, PAF-S06-000), and a cavity. The DRW has a longer cut-off wavelength and lower characteristic impedance of the dominant mode (TE10 mode) relative to those of conventional waveguides [17]. The SMA connector operated in the TEM mode is used to excite the DRW. Therefore, a cavity model is required for the mode transition from the TEM to the TE10 mode.
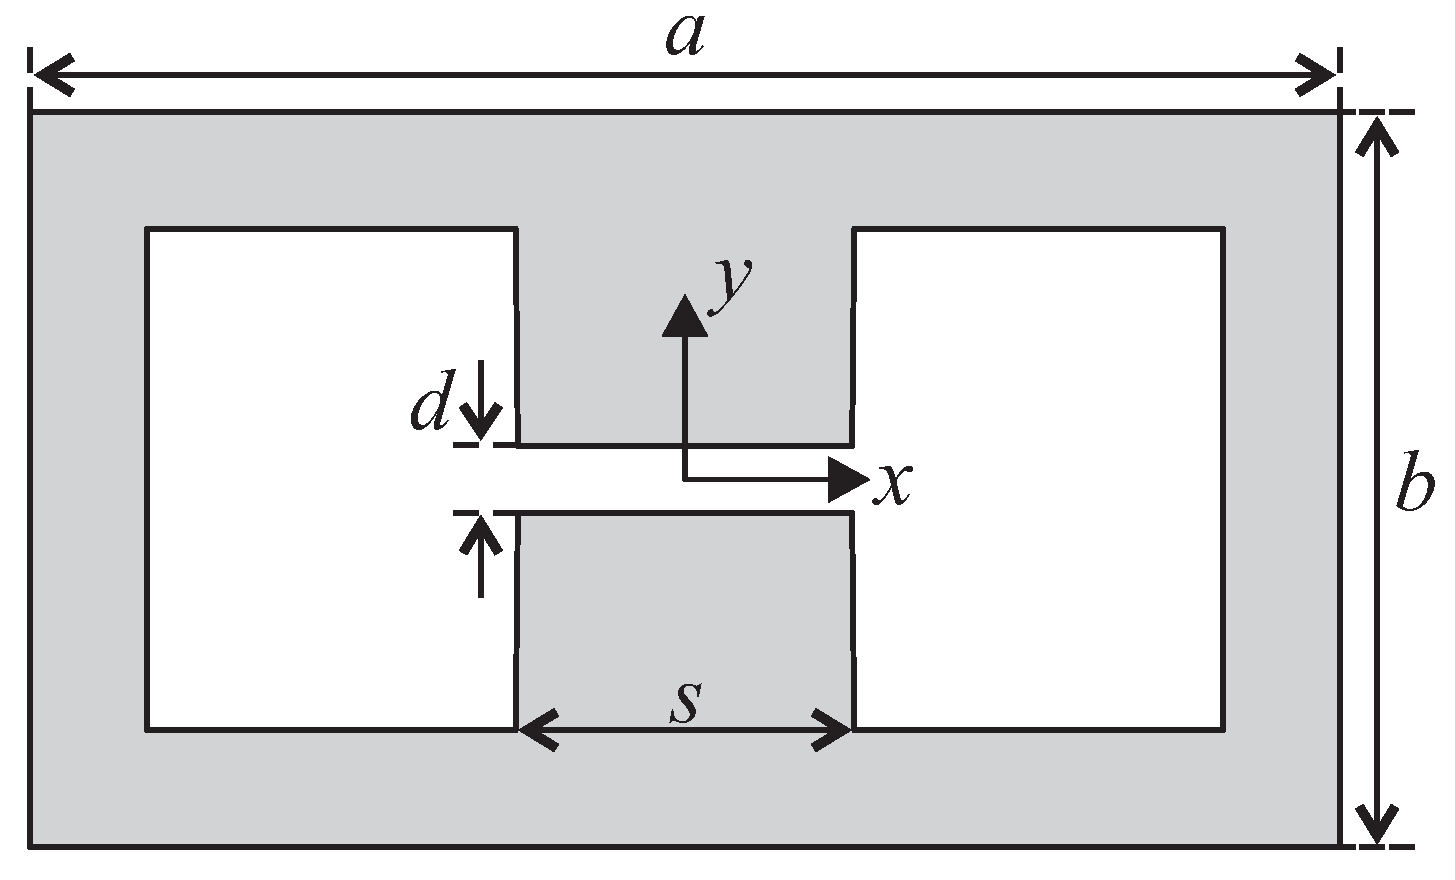
Figure 2 depicts a cross-sectional view of the DRW, which is designed by the transverse resonance method (TRM) considering the operating band of the TE10 mode and the characteristic impedance of the SMA connector [18]. The dimensions of the DRW obtained from the TRM are as follows: a = 11.6 mm, b = 7.78 mm, d = 0.78 mm, and s = 4.64 mm.
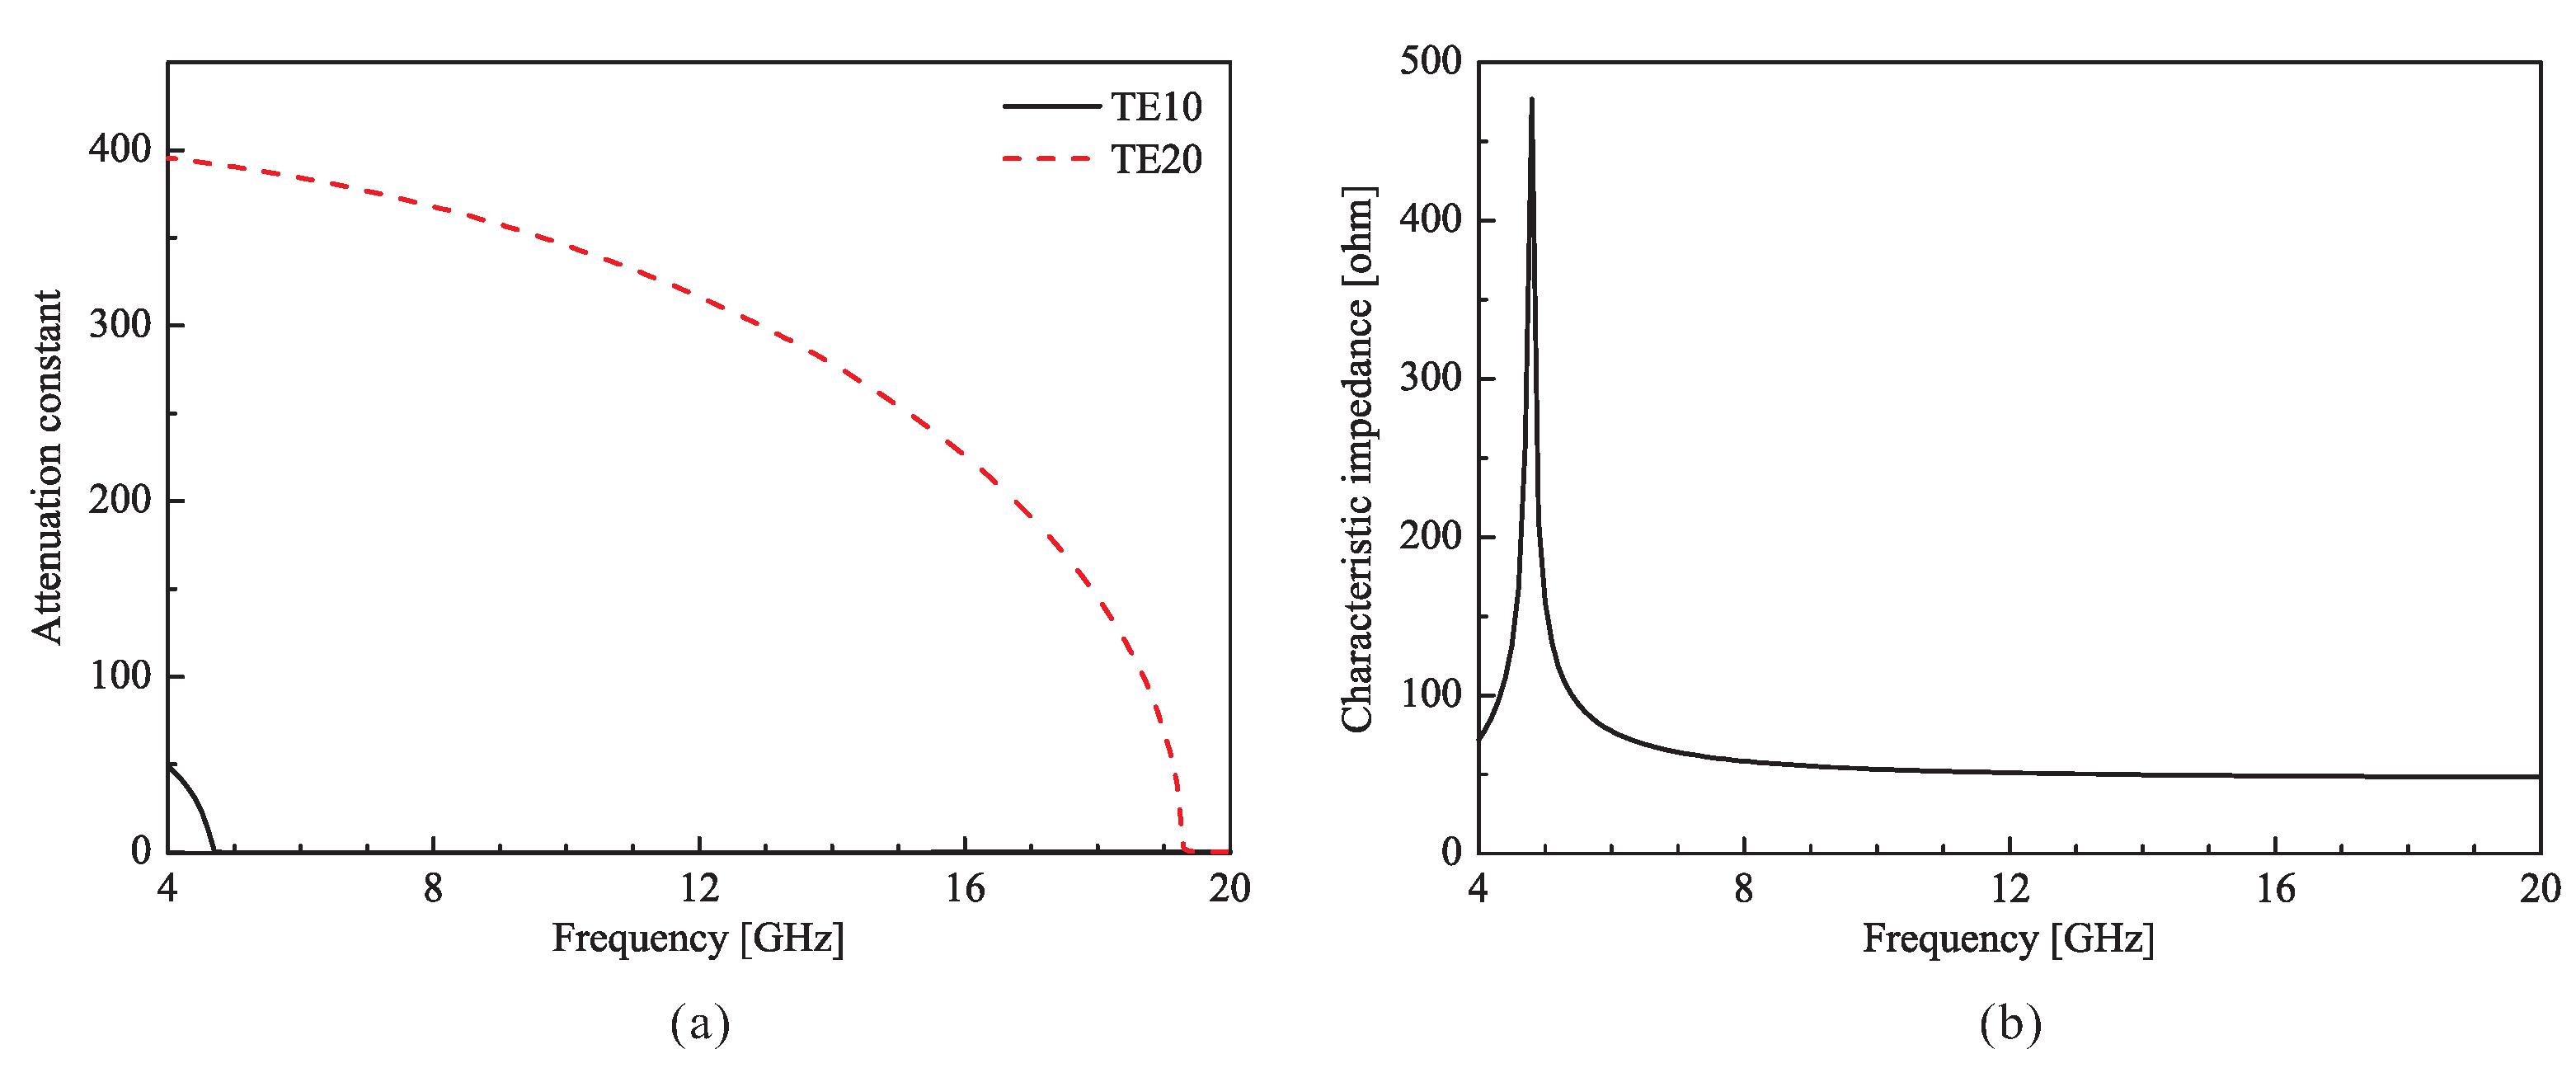
Figure 3 shows the simulated attenuation constant and characteristic impedance of the designed DRW. All of the simulation results in this paper are obtained using ANSYS high-frequency structure simulation (HFSS) software. As shown in Figure 3a, the attenuation constants of the TE10 and TE20 modes begin to have zero values starting at 4.7 and 19.3 GHz, respectively. This result indicates that the operating band of the dominant mode is 4.7–19.3 GHz. In Figure 3b, the characteristic impedance of the dominant mode varies from 44.6 to 77.4- within the 6–18 GHz band.
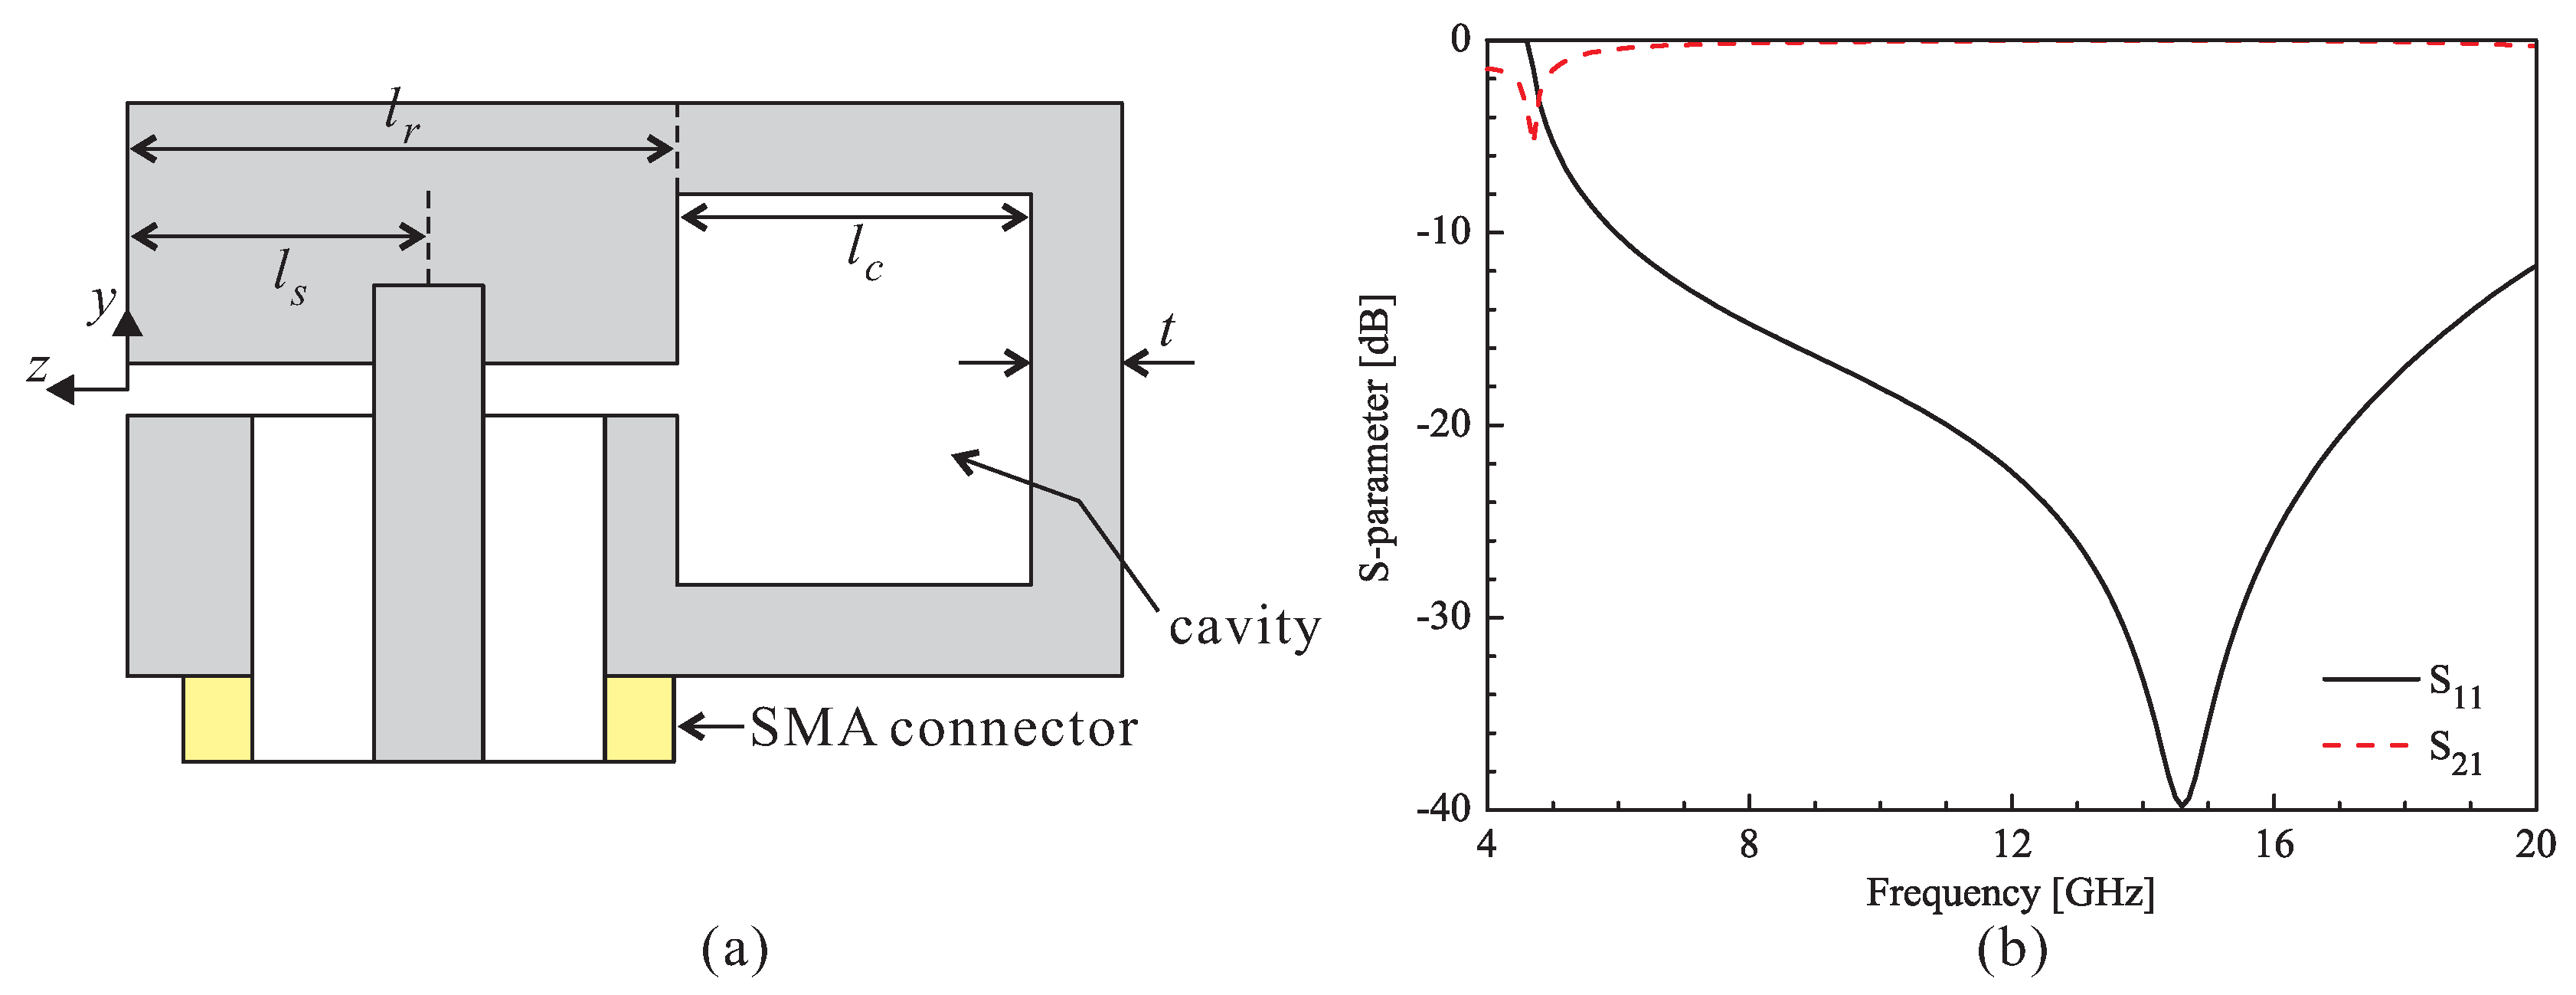
Figure 4 shows the -plane view and simulated S-parameters of the adaptor. In Figure 4a, a rectangular cavity is attached to the DRW to realize the mode transformation between the SMA connector and the DRW. The width and height of the cavity are equal to the dimensions a and b of the DRW. The thickness t is fixed at 1.75 mm to consider the dimensions of the SMA connector. The values of , , and are obtained through a parametric study. The simulated S-parameters of the adaptor with dimensions of a = 11.6 mm, b = 7.78 mm, d = 0.78 mm, s = 4.64 mm, = 3.57 mm, = 5.72 mm, and = 5 mm are described in Figure 4b. The simulation result shows that the reflection and transmission coefficients are less than −10 dB and higher than −0.45 dB, respectively, within the 6–18 GHz band.
2.2. Horn Aperture Design
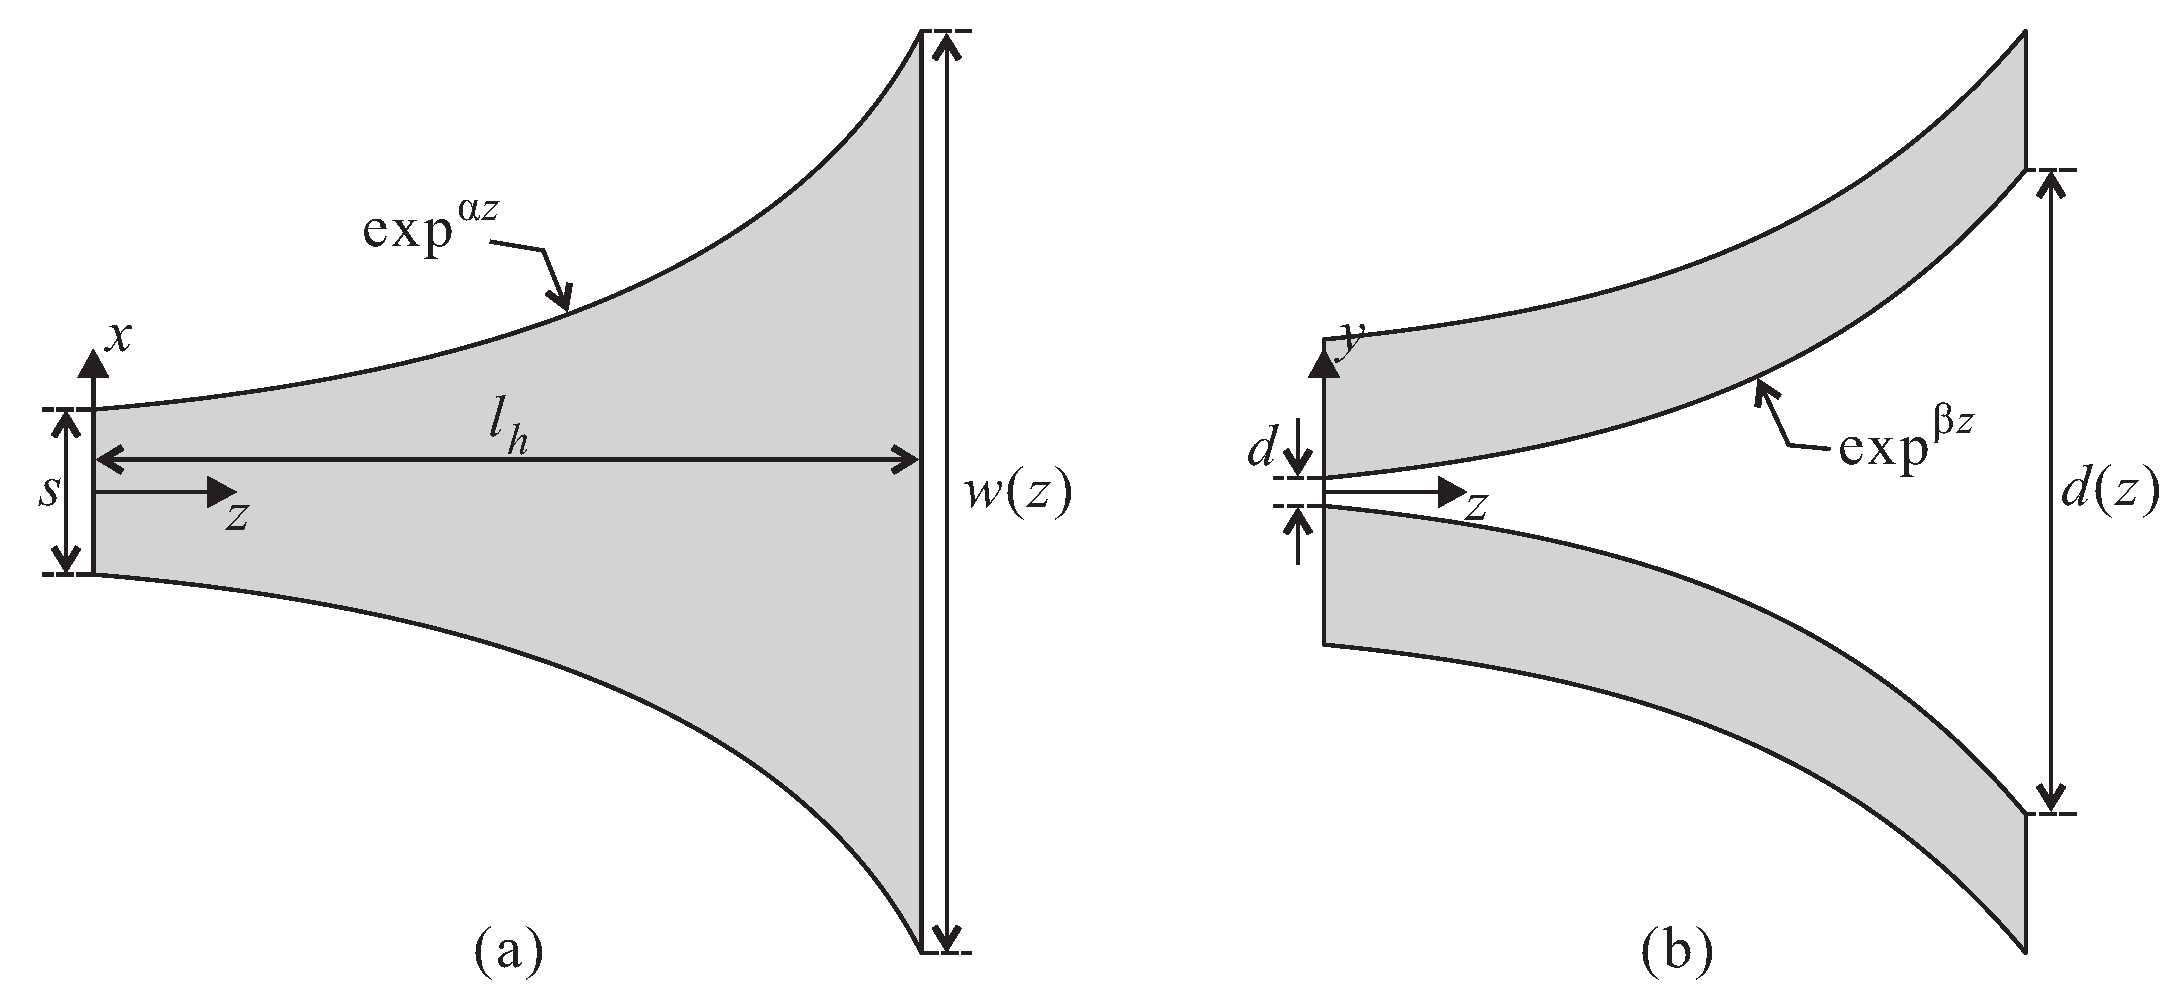
Figure 5 shows cross-sectional views of the horn aperture which is realized with an exponentially tapered structure along both the x- and y-axes. The tapered structure is advantageous for broadband matching because its characteristic impedance varies smoothly. The width of the horn aperture and the spacing between the upper and lower plates are correspondingly given by
where and are constants, and is the length of the horn aperture. The characteristic impedance of the aperture is obtained by means of parallel plate waveguide theory [19]. The characteristic impedance of the horn aperture can be expressed as follows:
In Equation (3), the fringing fields at the edges of the parallel plate waveguide are ignored for a simple and rapid design of the horn aperture. Based on Equations (1)–(3), the horn aperture is designed. The values of and are respectively set to 0.092 and 0.1 so that the characteristic impedance at the open end matches the intrinsic impedance (377-). is fixed at 25 mm, which is half of the wavelength at 6 GHz.
2.3. TEM Horn Antenna
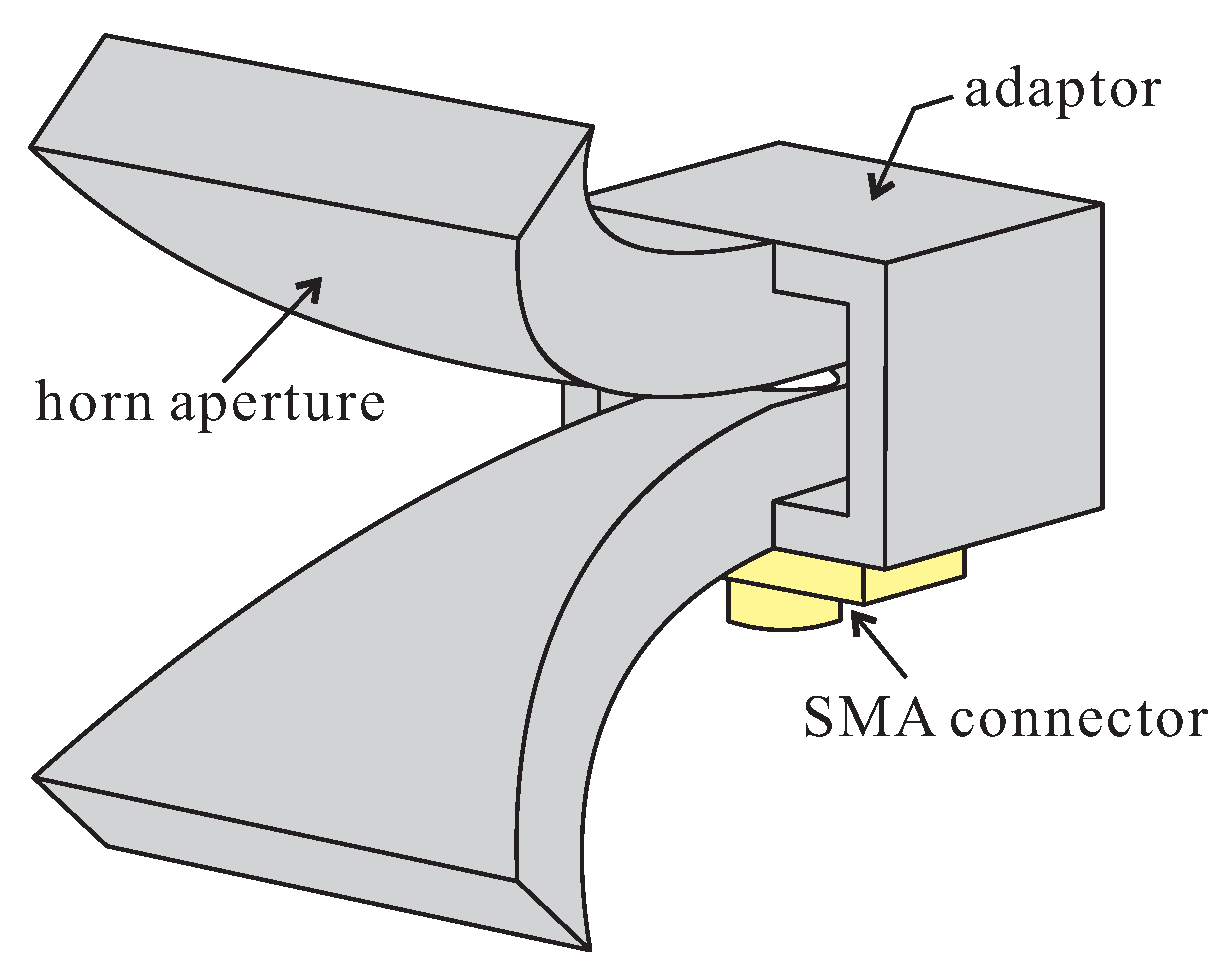
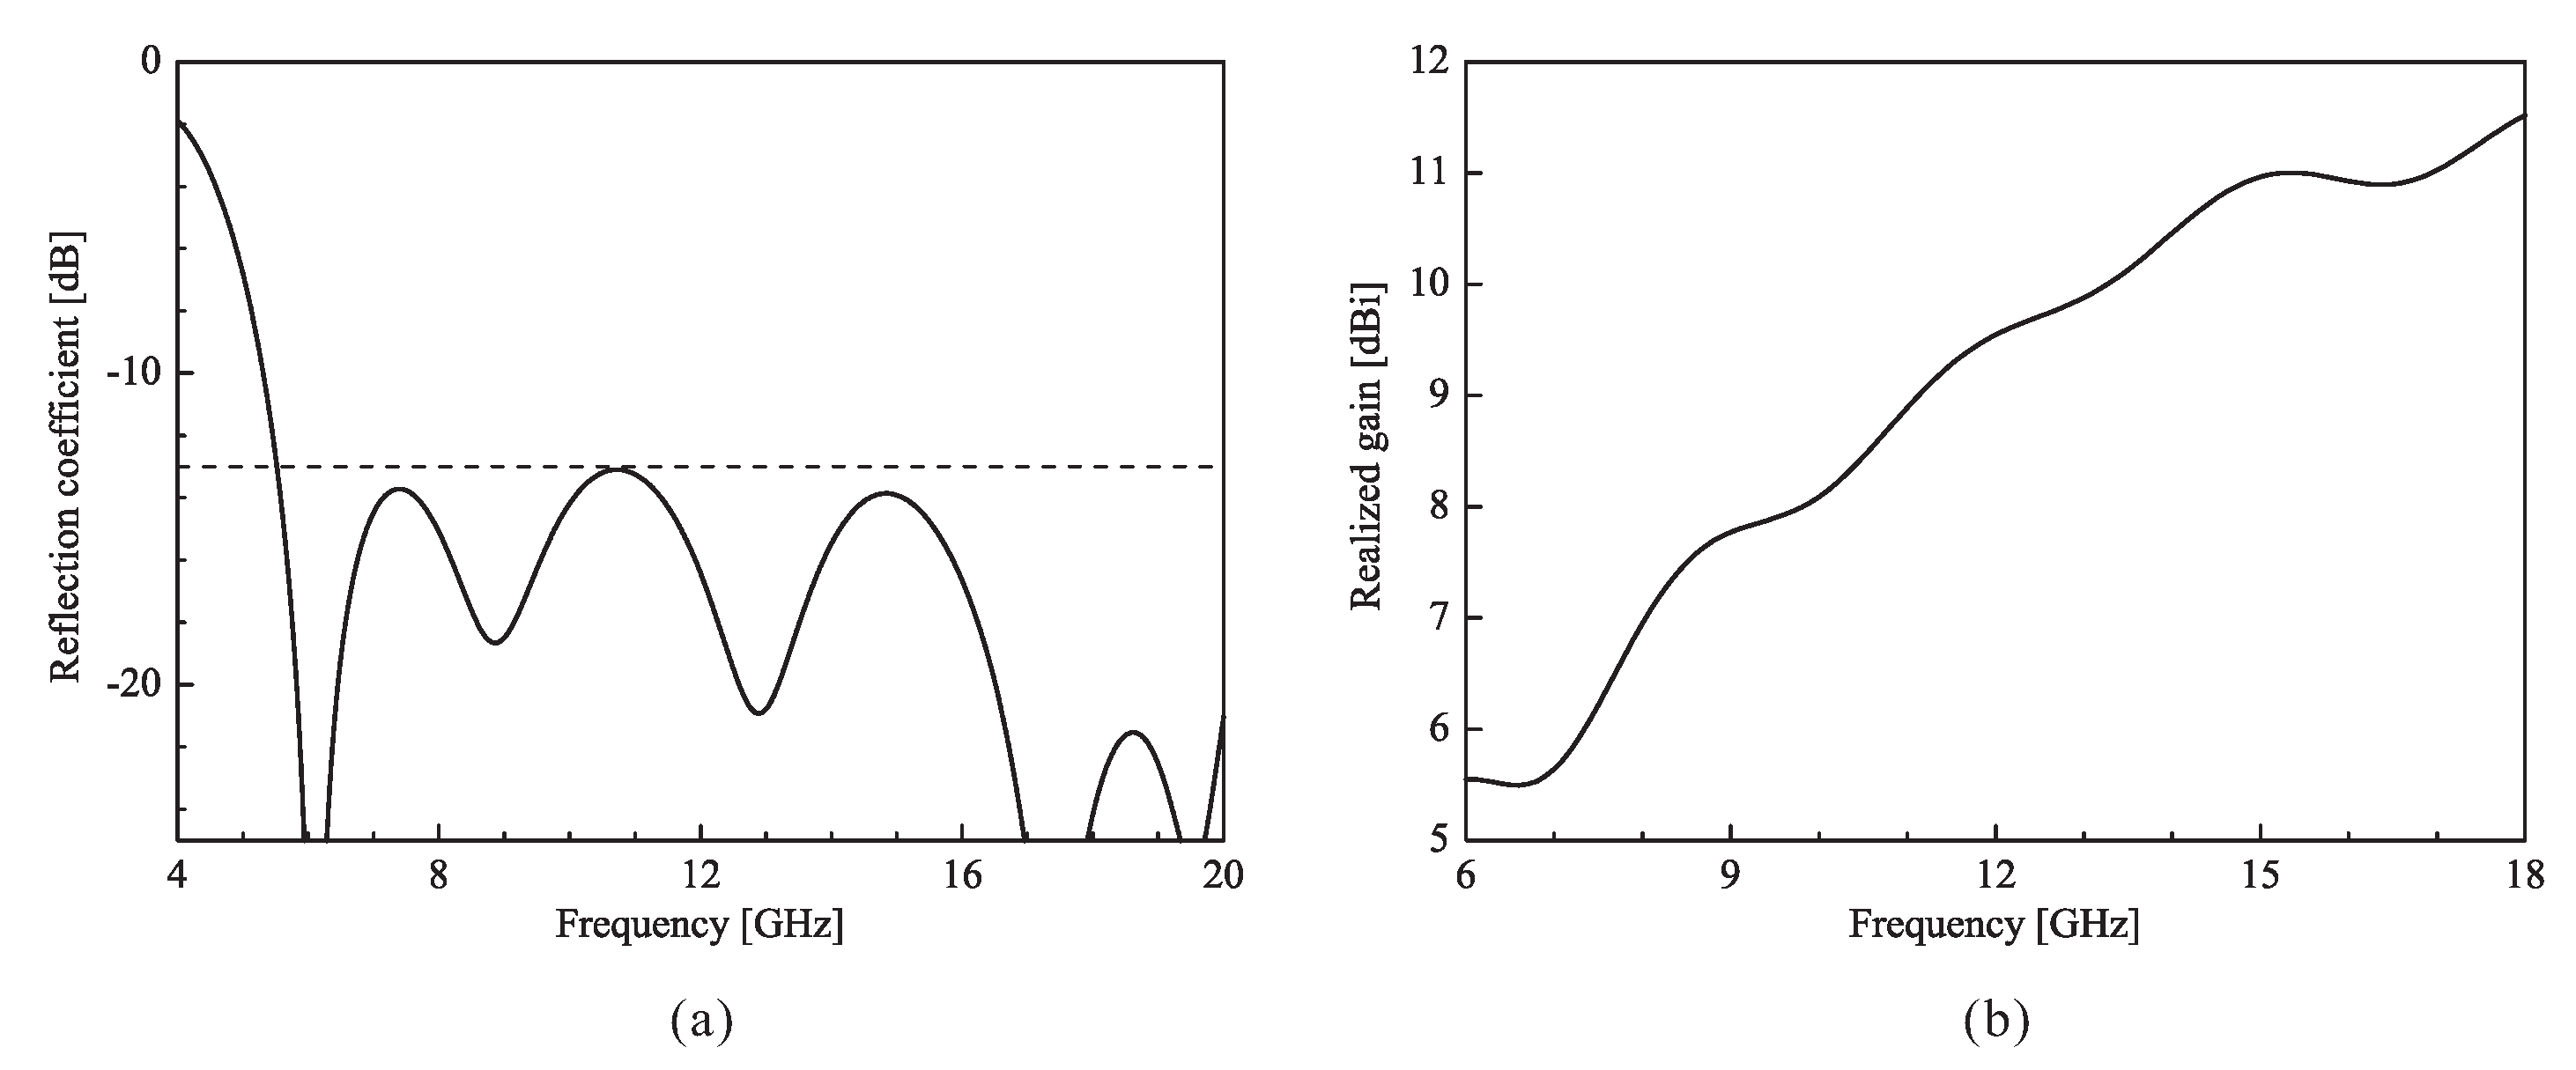
Figure 6 shows a 3D view of the TEM horn antenna. The TEM horn antenna is implemented by assembling the adaptor and the horn aperture. The simulated reflection coefficient and realized gain of the horn antenna are described in Figure 7. The gain is observed in the +z-direction. The reflection coefficient and gain levels of the antenna are less than −13 dB and greater than 5.47 dBi, respectively, within the range of 6–18 GHz.
3. Procedure of the Robust Design Method
In this paper, a novel robust design method is utilized to reduce the noise effects. The proposed method is realized by combining a genetical swarm optimization (GSO) algorithm and an orthogonal array (OA) matrix. The GSO algorithm, a hybrid optimization algorithm which combines a genetic algorithm (GA) and particle swarm optimization (PSO), is employed to find a new combination of robust parameters against the noise factors, while the OA is employed to evaluate the robustness of the parameters.
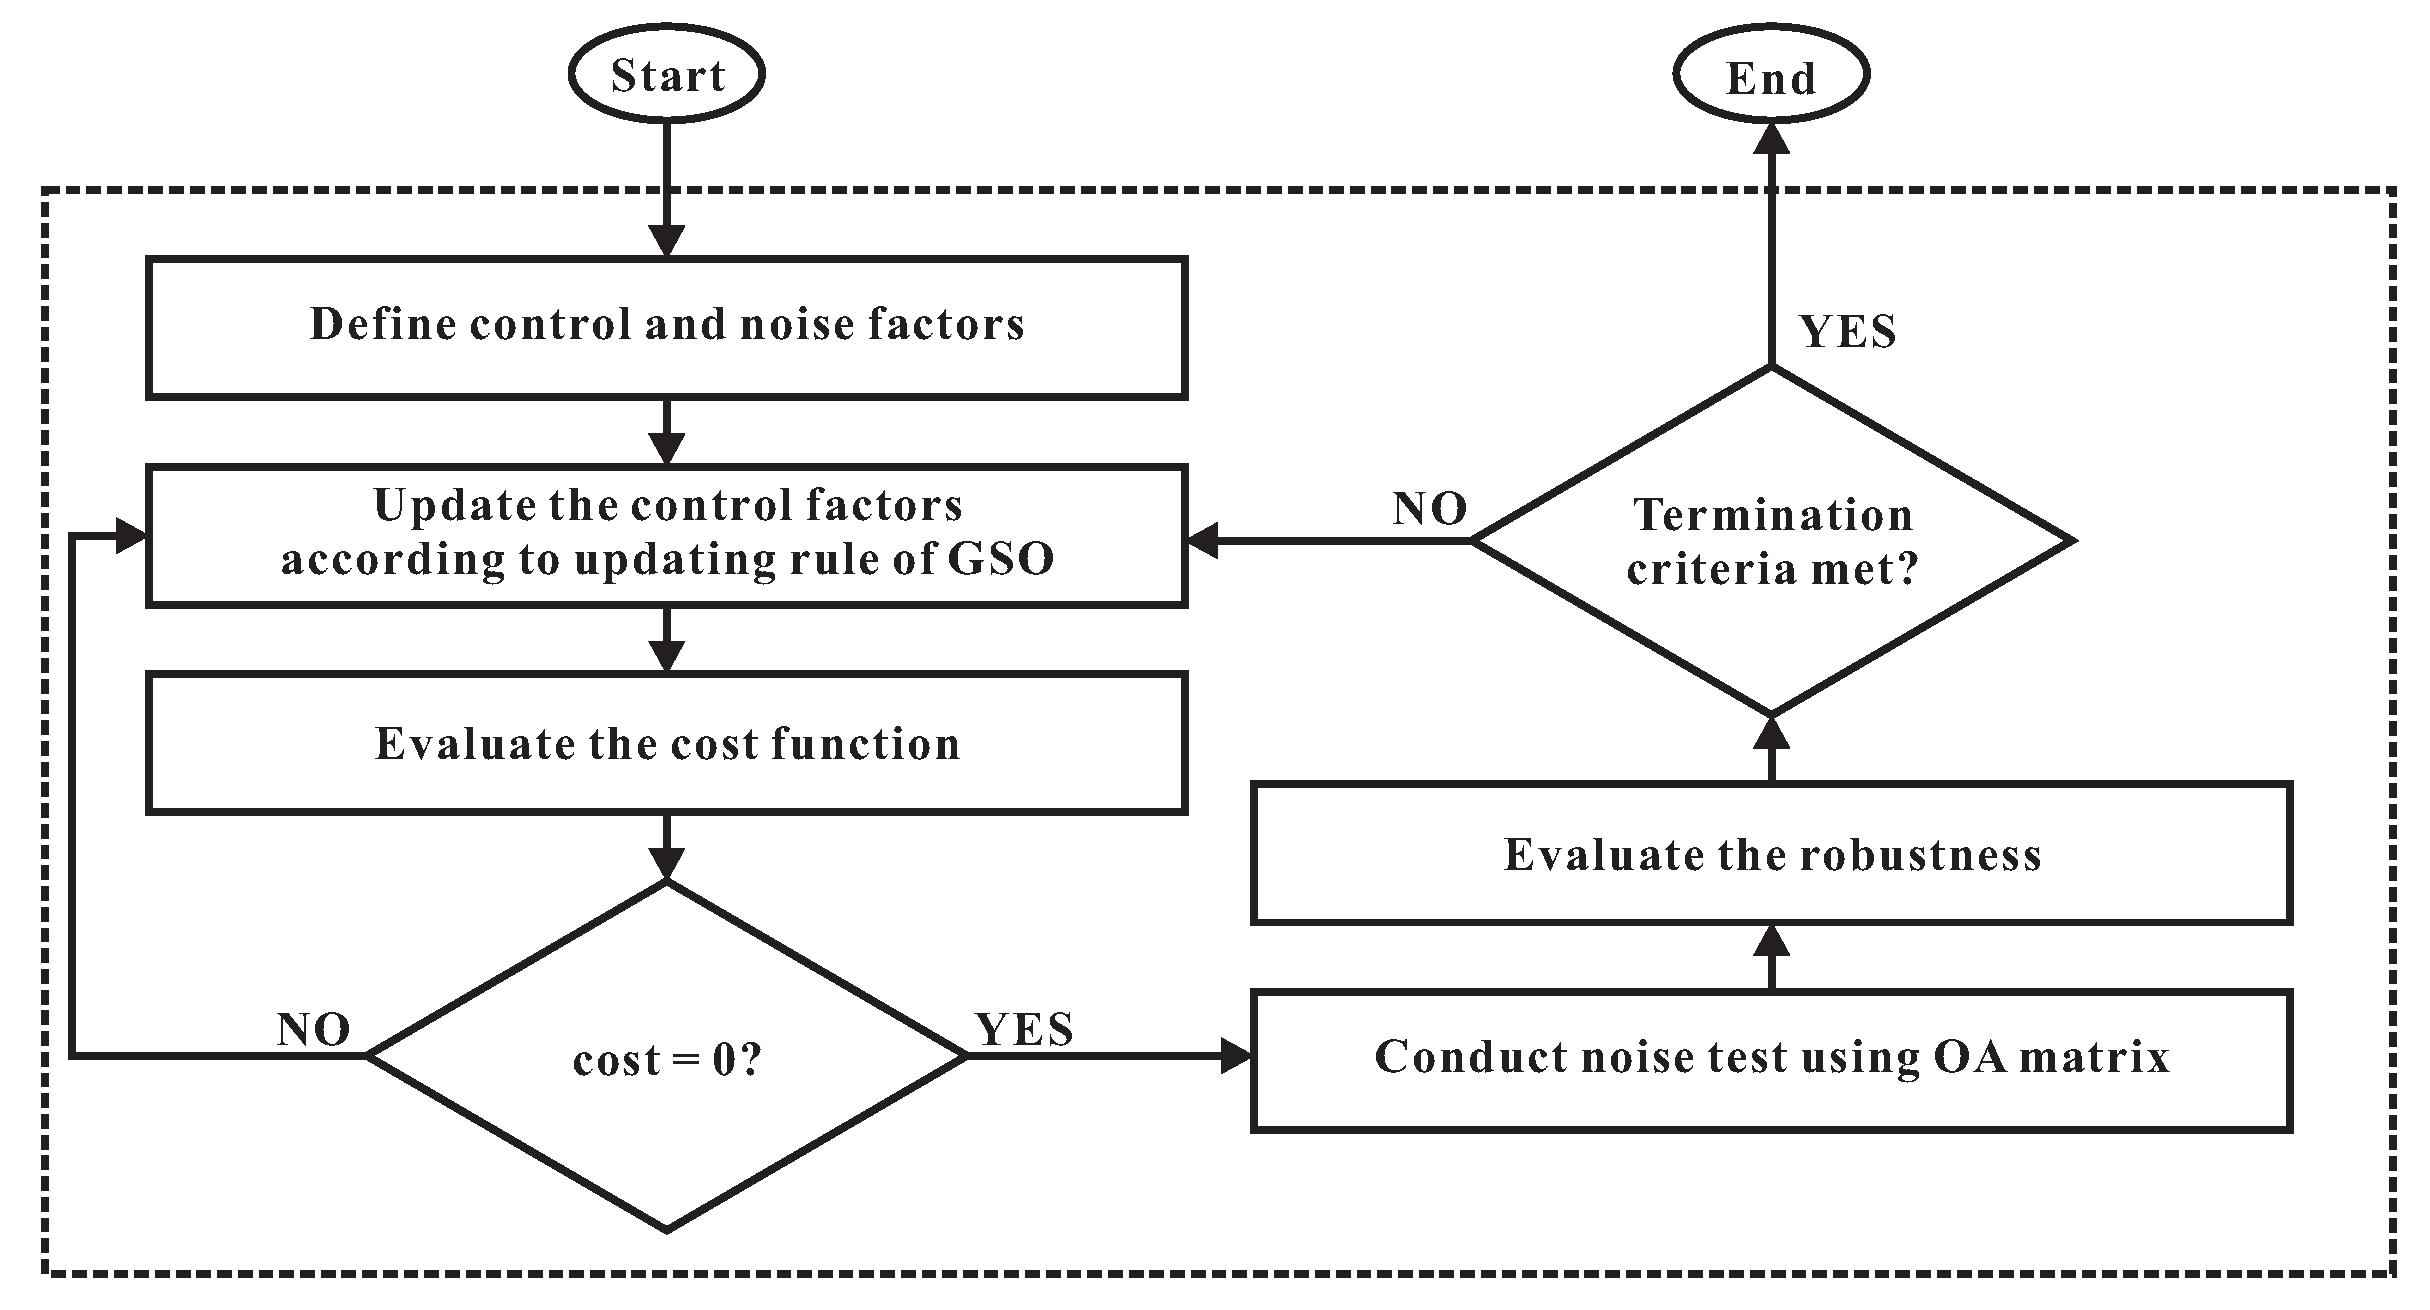
Figure 8 shows a flowchart of the proposed robust design method. The detailed robust design procedure is described below.
- Define the control and noise factors. The control factors are the design parameters for the TEM horn antenna and the noise factors are parameters that the designer cannot control. We assumed that the manufacturing process has tolerances along the x, y, and z axes and that the characteristic impedance of the SMA connector can vary. To realize the variation of the characteristic impedance in the simulation, the permittivity of the Teflon used in the SMA connector is changed. In the simulation, the tolerances are defined as , , and , and the permittivity is represented by .
- Renew the dimensions of the control factors using the updating rule of the GSO. In each iteration, the design parameters are randomly divided into two parts by the hybridization coefficient (HC), and these are correspondingly updated by the GA and PSO [16]. For example, HC = 0 means that the parameters are evolved by only PSO. On the other hand, for HC = 1, the parameters are updated by only the GA. In this paper, HC is set to 0.8.
- Evaluate the performance of the antenna with the dimensions of the parameters updated in step 2. The cost function for GSO must be defined to ensure that the performance of the optimized antenna is better than that of the initial antenna. To achieve this, the reflection coefficient and realized gain levels of the optimized antenna should be less than −13 dB and higher than the realized gain of the initial antenna, respectively, as follows,where n is the number of sampling frequencies and is the i-th sampling frequency within the 6–18 GHz band. Additionally, denotes the reflection coefficient level obtained at each sampling frequency. and are the gain levels obtained from step 2 and the initial antenna, respectively.
- Steps 2 and 3 are repeated until the cost function is 0.
- Build an OA matrix for noise factors and conduct the experiments in the OA matrix. In order to realize the orthogonality between the parameters in all possible combinations and to reduce the simulation time, an OA matrix with two strengths and three levels is employed. The OA matrix is described in Table 1.
- Evaluate the robustness of the antenna as optimized by GSO. The robustness for the k-th experiment can be defined as the variation of the reflection coefficient,where is the reflection coefficient level at the sampling frequency. Next, the robustness R of the optimized antenna is expressed by averaging the robustness value for each experiment, as follows,where m is the number of experiments in the OA matrix.
- Finally, steps 2 to 6 are repeated until the number of iteration reaches 100.
4. Simulated Results of the Robust Design
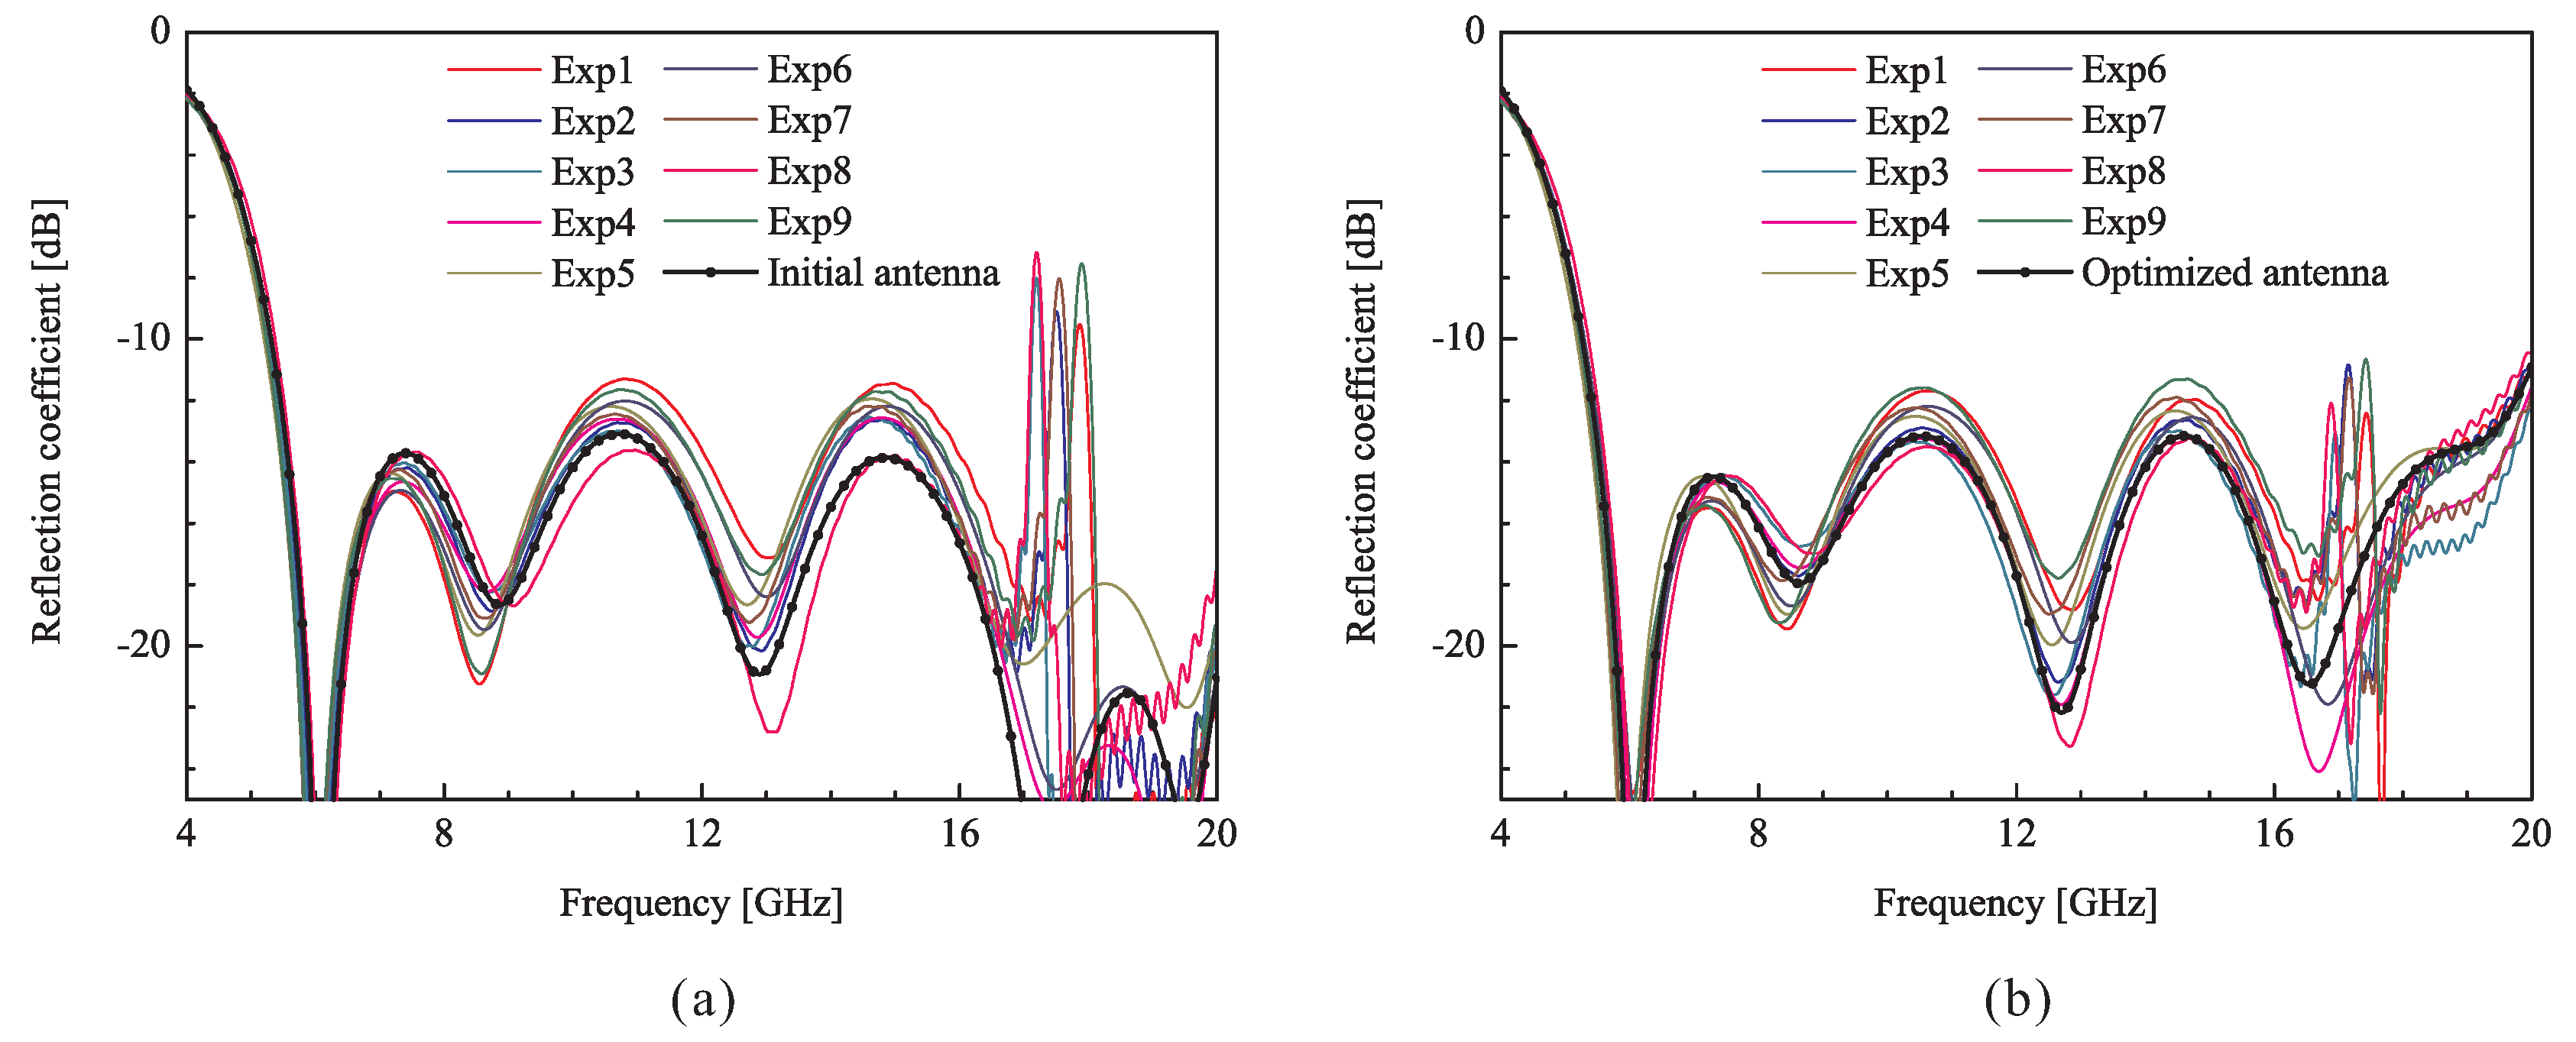
Figure 9 shows the noise test results of the initial and optimized TEM horn antennas. As shown in Figure 9a, the reflection coefficient of the antenna varies according to the noise factors in the OA matrix experiments. In particular, the fluctuation of the reflection coefficient level around 17.5 GHz exceeds the −10 dB criterion. The robustness of the initial antenna calculated according to Equation (8) is 1.45. The noise test result of the robustly optimized antenna with robustness of 1.27 is presented in Figure 9b. Unlike the noise test result of the initial antenna, all of the reflection coefficient levels in the noise test result fall under the −10 dB criteria in the 6–18 GHz band. The robustness of each experiment in the noise test ranges from 0.57 to 2.29. The minimum and maximum values are observed in experiments 4 and 9, respectively. The parameters of the optimized antenna are as follows: a = 12.54 mm, b = 7.22 mm, d = 0.83 mm, s = 5.03 mm, = 3.48 mm, = 6.08 mm, = 5.02 mm, = 25 mm, = 0.092, and = 0.1.
5. Prototype and Measured Results
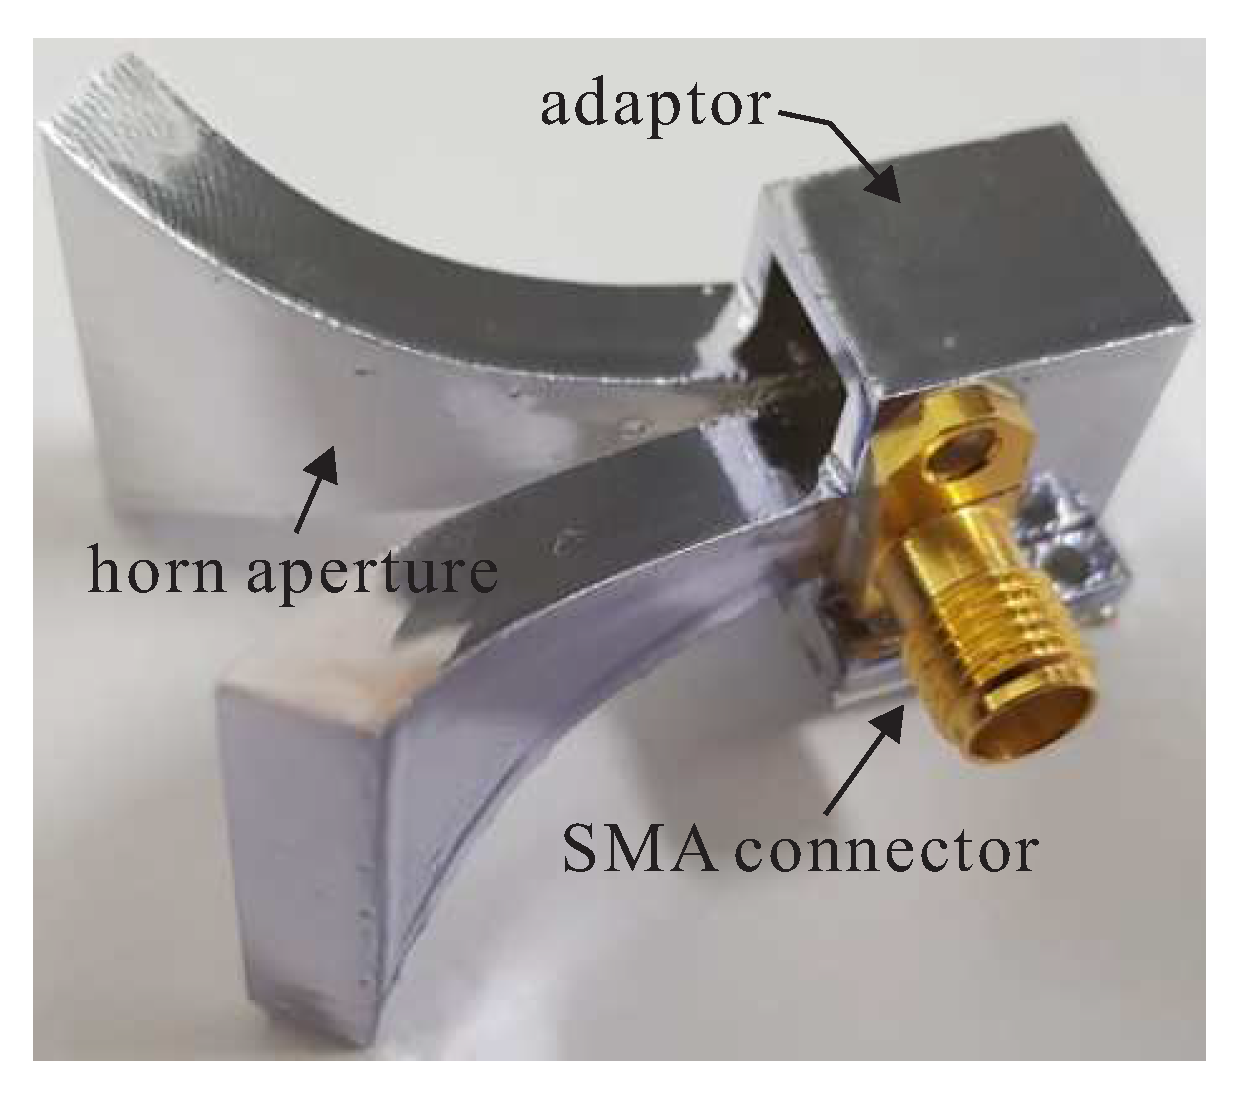
Figure 10 shows a photograph of the antenna fabricated with dimensions obtained by the robust design procedure. The frame of the horn antenna is built by the Form2 (a 3D printer with SLA), and its surface is plated by EM-271S silver paste with conductivity of 2.22 × S/m. As this silver paste uses a phenoxy resin as its binder, it has favourable adhesion to hard materials. The thickness of the metal deposition is typically less than 10 m. Finally, the plated frame is attached to a SMA connector.
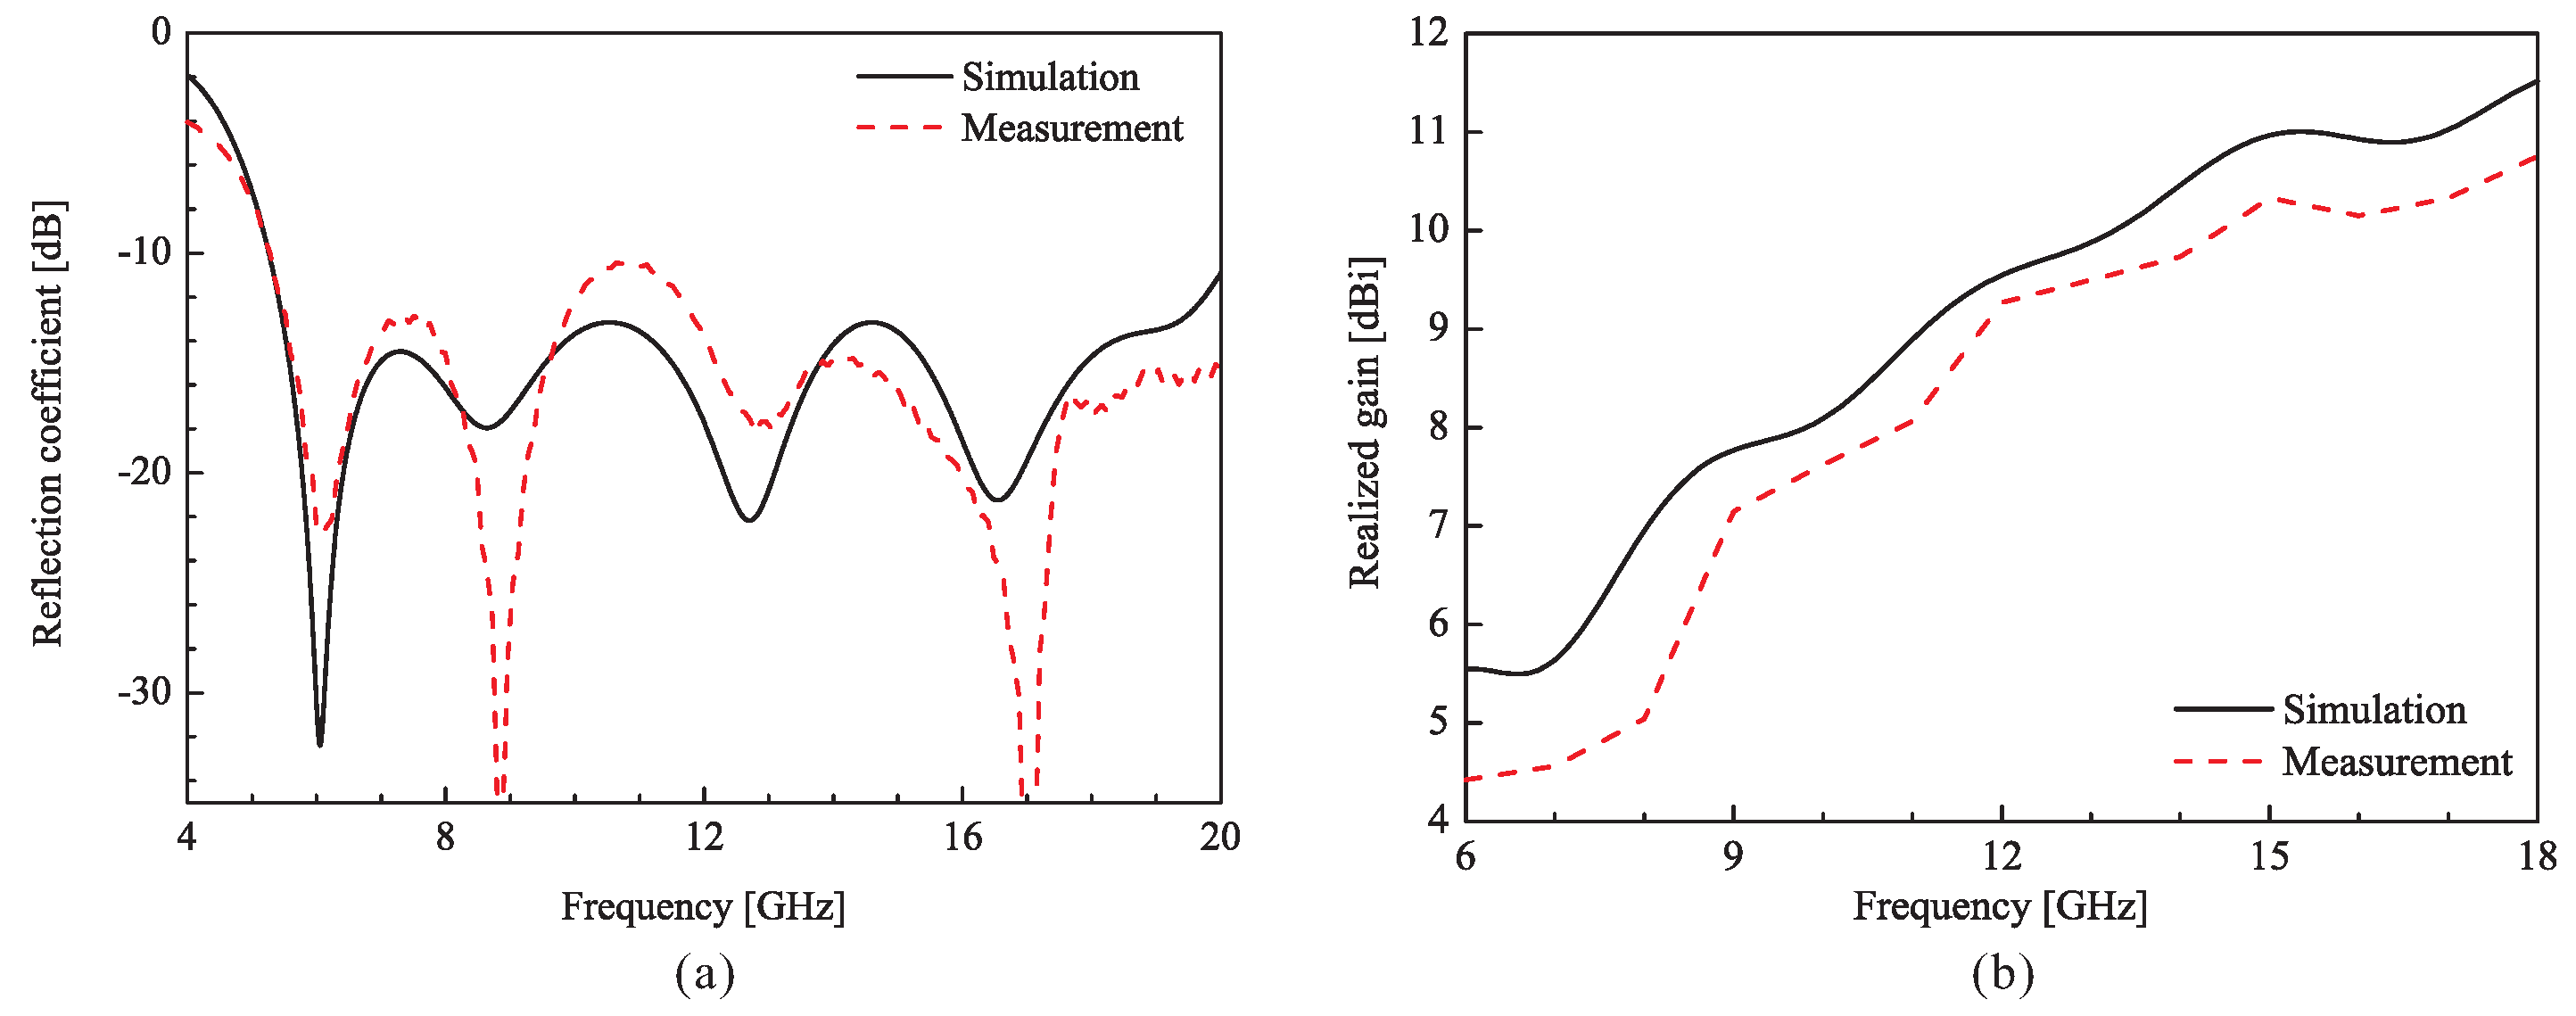
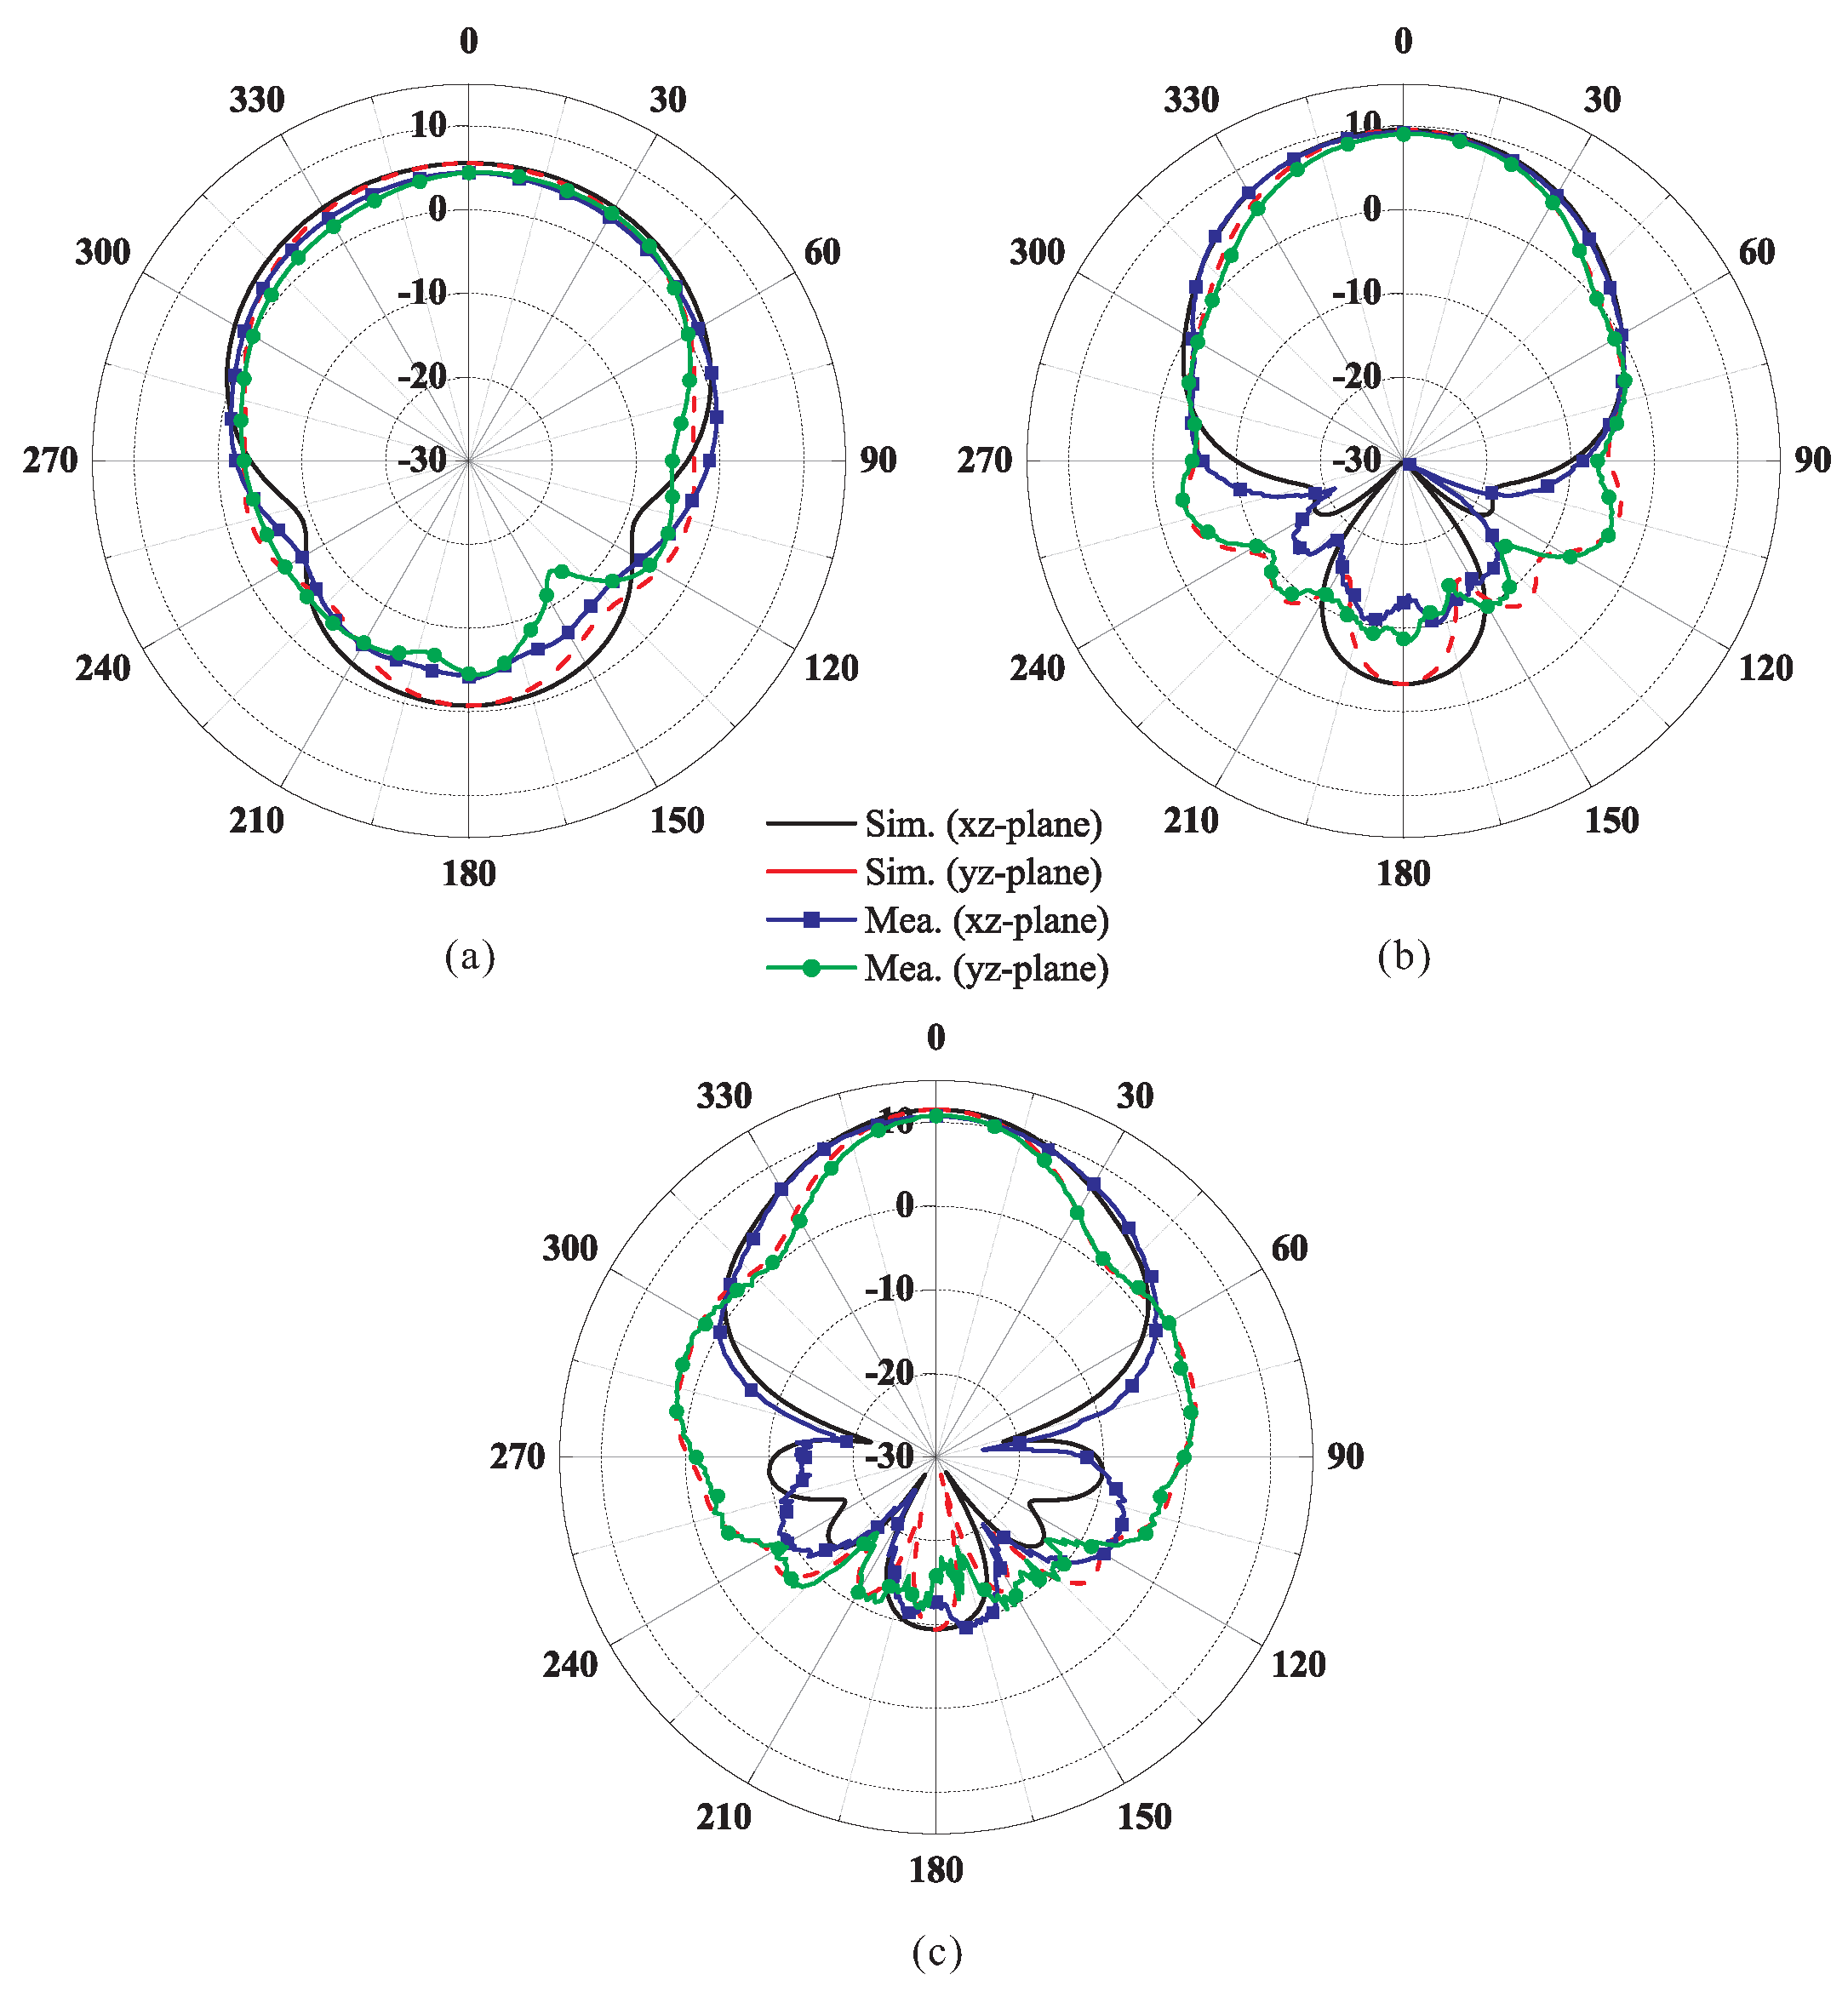
The simulated and measured results of the prototype antenna are depicted in Figure 11 and Figure 12. The reflection coefficient is measured using an Agilent 8510C network analyser and the realized gain and radiation patterns are measured in an anechoic chamber. Good agreement between the simulation and measurement results is observed. As shown in Figure 11a, the measured −10 dB reflection coefficient bandwidth of the antenna can cover 6–18 GHz. In Figure 11b, the simulated and measured gains are obtained in the +z-direction. The measured gain varies from 4.42 to 10.75 dBi. The measured gain is lower than the simulated gain owing to the rough surface of the frame and the low conductivity of the nano silver plating [20]. The radiation patterns at 6, 12, and 18 GHz are observed on the - and -planes and recorded with an angular resolution of in the spatial range, as shown in Figure 12. The difference between the measurement and the simulation at the edge angle is due to the different boundary conditions during the simulation and measurement processes. The boundary condition in the simulation scenario is a numerically infinitely extended space, whereas it is given a finite volume with weak scattering in the measurement setup.
6. Conclusions
A 3D-printed double-ridged TEM horn antenna with an operating bandwidth of 6–18 GHz is designed using a new robust design method in this paper. The method is realized using a GSO algorithm and an OA matrix. The convergence speed of the GSO is faster than that of the GA or PSO, and is less likely to fall to the local optimum. OA matrix with two strengths and three levels is used to effectively reduce the simulation time. The GSO algorithm and OA matrix are employed to renew the antenna parameters and to evaluate the robustness of the parameters, respectively. The cost function and robustness are defined considering the reflection coefficient and gain of the horn antenna used in this design. As a result of the robust design process, the robustness of the optimized antenna is approximately 12.4% higher than that of the initial antenna. The frame of the robustly designed TEM horn antenna is built using a 3D printer of the SLA type, and its surface is plated with nano silver. Good agreement between the simulated and measured results with regard to the reflection coefficient and radiation characteristic is achieved, proving the feasibility of the proposed robust design method. Therefore, the proposed method with 3D printing technology is very useful and suitable for the robust design of a lightweight horn antenna via a rapid fabrication process available at a low cost. In addition, the proposed TEM horn antenna can be feasibly employed for radar and communication systems which require wideband capabilities.
Author Contributions
The presented work was carried out in collaboration of all authors. S.L. performed the simulations. S.L., Y.Y., K.-Y.L., K.-Y.J. and K.C.H. participated to the conception, fabrication and experiment. S.L. wrote the paper which was edited by all co-authors.
Funding
This research was funded by the National Research Foundation of Korea (NRF) grant funded by the Korea government (MSIP) (2014R1A5A1011478).
Conflicts of Interest
The authors declare no conflict of interest.
References
- Bruns, C.; Leuchtmann, P.; Vahldieck, R. Analysis and simulation of a 1–18-GHz broadband double-ridged horn antenna. IEEE Trans. Electromagn. Compat. 2003, 45, 55–60. [Google Scholar]
- Tak, J.; Kang, D.-G.; Choi, J. A lightweight waveguide horn antenna made via 3D printing and conductive spray coating. Microw. Opt. Technol. Lett. 2017, 59, 727–729. [Google Scholar] [CrossRef]
- Duangtang, P.; Mesawad, P.; Wongsan, R. Creating a gain enhancement technique for a conical horn antenna by adding a wire medium structure at the aperture. J. Electromagn. Eng. Sci. 2016, 16, 134–412. [Google Scholar] [CrossRef]
- Kong, M.; Shi, G.; Lee, S.-H.; Yoon, I.-J. Investigation of 3D printed electrically small folded spherical meander wire antenna. J. Electromagn. Eng. Sci. 2017, 17, 228–232. [Google Scholar] [CrossRef]
- Lee, J.; Bang, J.; Choi, J. Realistic head phantom for evaluation of brain stroke localization methods using 3D printer. J. Electromagn. Eng. Sci. 2016, 16, 254–258. [Google Scholar] [CrossRef]
- Nayeri, P.; Liang, M.; Sabory-Garcia, R.A.; Tuo, M.; Yang, F.; Gehm, M.; Xin, H.; Elsherbeni, A.Z. 3D printed dielectric reflectarrays: Low-cost high-gain antennas at sub-millimeter waves. IEEE Trans. Antennas Propag. 2014, 62, 2000–2008. [Google Scholar] [CrossRef]
- Cicchetti, R.; Miozzi, E.; Testa, O. Wideband and UWB antennas for wireless applications: A comprehensive review. Int. J. Antennas Propag. 2017, 2017, 2390808. [Google Scholar] [CrossRef]
- Wu, Y.; Isakov, D.; Grant, P.S. Fabrication of composite filaments with high dielectric permittivity for fused deposition 3D printing. Materials 2017, 10, 1218. [Google Scholar] [CrossRef] [PubMed]
- D’Auria, M.; Otter, W.J.; Hazell, J.; Gillatt, B.T.W.; Long-Collins, C.; Ridler, N.M.; Lucyszyn, S. 3-D printed metal-pipe rectangular waveguides. IEEE Trans. Compon. Packag. Manuf. Technol. 2015, 5, 1339–1349. [Google Scholar] [CrossRef]
- Weng, W.-C.; Yang, F.; Elsherbeni, A.Z. Linear antenna array synthesis using Taguchi’s method: A novel optimization technique in electromagnetics. IEEE Trans. Antennas Propag. 2007, 55, 723–730. [Google Scholar] [CrossRef]
- Küçük, Ö.; Elfarah, T.T.K.; Islak, S.; Özorak, C. Optimization by using Taguchi method of the production of magnesium-matrix carbide reinforced composites by powder metallurgy method. Metals 2017, 7, 352. [Google Scholar] [CrossRef]
- Chen, H.-J.; Chang, S.-N.; Tang, C.-W. Application of the Taguchi method for optimizing the process parameters of producing lightweight aggregates by incorporating tile grinding sludge with reservoir sediments. Materials 2017, 10, 1294. [Google Scholar] [CrossRef] [PubMed]
- Schneider, C.F.; Lisboa, C.P.; Silva, R.A.; Lermen, R.T. Optimizing the parameters of TIG-MIG/MAG hybrid welding on the geometry of bead welding using the Taguchi method. J. Manuf. Mater. Process. 2017, 1, 14. [Google Scholar] [CrossRef]
- Ko, J.-H.; Byun, J.-K.; Park, J.-S.; Kim, H.-S. Robust design of dual band/polarization patch antenna using sensitivity analysis and Taguchi’s method. IEEE Trans. Magn. 2011, 47, 1258–1261. [Google Scholar] [CrossRef]
- Ko, J.-H.; Kim, K.-T.; Kim, D.-H.; Lee, H.-B.; Kim, H.-S. A practical approach to robust design of a RFID triple-band PIFA structure. IEEE Trans. Magn. 2010, 46, 3333–3336. [Google Scholar] [CrossRef]
- Gandelli, A.; Grimaccia, F.; Mussetta, M.; Pirinoli, P.; Zich, R.E. Genetical swarm optimization: An evolutionary algorithm for antenna design. Automatika 2006, 47, 105–112. [Google Scholar]
- Chen, T.-S. Calculation of the parameters of ridge waveguides. IRE Trans. Microw. Theory Tech. 1957, 5, 12–17. [Google Scholar] [CrossRef]
- Hopfer, S. The design of ridged waveguides. IRE Trans. Microw. Theory Tech. 1995, 3, 20–29. [Google Scholar] [CrossRef]
- Pozar, D.M. Microwave Engineering, 2nd ed.; Wiley: New York, NY, USA, 1998; pp. 112–120. [Google Scholar]
- Garcia, C.R.; Rumpf, R.C.; Tsang, H.H.; Barton, J.H. Effects of extreme surface roughness on 3D printed horn antenna. Electron. Lett. 2013, 49, 734–736. [Google Scholar] [CrossRef]
Figure 1.
3D view of an adaptor with a double-ridged waveguide (DRW).

Figure 2.
Cross-sectional view of the DRW.

Figure 3.
Simulated results of the DRW: (a) attenuation constant and (b) characteristic impedance.

Figure 4.
(a) -plane view and (b) simulated S-parameters of the adaptor.

Figure 5.
Cross-sectional views of the horn aperture: (a) -plane and (b) -plane.

Figure 6.
3D view of the TEM horn antenna.

Figure 7.
Simulated results of the TEM horn antenna: (a) reflection coefficient and (b) realized gain.
Figure 7.
Simulated results of the TEM horn antenna: (a) reflection coefficient and (b) realized gain.

Figure 8.
Flowchart of the robust design method.

Figure 9.
Noise test results of the (a) initial and (b) optimized TEM horn antennas.

Figure 10.
Photograph of the fabricated antenna with dimensions obtained by the robust design procedure.
Figure 10.
Photograph of the fabricated antenna with dimensions obtained by the robust design procedure.

Figure 11.
Simulated and measured results of the robustly optimized TEM horn antenna: (a) reflection coefficient and (b) realized gain.
Figure 11.
Simulated and measured results of the robustly optimized TEM horn antenna: (a) reflection coefficient and (b) realized gain.

Figure 12.
Simulated and measured radiation patterns of the robustly optimized TEM horn antenna: (a) at 6 GHz; (b) at 12 GHz; and (c) at 18 GHz.
Figure 12.
Simulated and measured radiation patterns of the robustly optimized TEM horn antenna: (a) at 6 GHz; (b) at 12 GHz; and (c) at 18 GHz.


Table 1.
OA Matrix for noise factors.
| Experiment | Noise Factors | |||
|---|---|---|---|---|
| 1 | −0.2 | −0.2 | −0.2 | 1.9 |
| 2 | −0.2 | 0 | 0 | 2.1 |
| 3 | −0.2 | 0.2 | 0.2 | 2.3 |
| 4 | 0 | −0.2 | 0 | 2.3 |
| 5 | 0 | 0 | 0.2 | 1.9 |
| 6 | 0 | 0.2 | −0.2 | 2.1 |
| 7 | 0.2 | −0.2 | 0.2 | 2.1 |
| 8 | 0.2 | 0 | −0.2 | 2.3 |
| 9 | 0.2 | 0.2 | 0 | 1.9 |
© 2018 by the authors. Licensee MDPI, Basel, Switzerland. This article is an open access article distributed under the terms and conditions of the Creative Commons Attribution (CC BY) license (http://creativecommons.org/licenses/by/4.0/).
Share and Cite
MDPI and ACS Style
Lee, S.; Yang, Y.; Lee, K.-Y.; Jung, K.-Y.; Hwang, K.C. Robust Design of 3D-Printed 6–18 GHz Double-Ridged TEM Horn Antenna. Appl. Sci. 2018, 8, 1582. https://0-doi-org.brum.beds.ac.uk/10.3390/app8091582
AMA Style
Lee S, Yang Y, Lee K-Y, Jung K-Y, Hwang KC. Robust Design of 3D-Printed 6–18 GHz Double-Ridged TEM Horn Antenna. Applied Sciences. 2018; 8(9):1582. https://0-doi-org.brum.beds.ac.uk/10.3390/app8091582
Chicago/Turabian StyleLee, Sungwoo, Youngoo Yang, Kang-Yoon Lee, Kyung-Young Jung, and Keum Cheol Hwang. 2018. "Robust Design of 3D-Printed 6–18 GHz Double-Ridged TEM Horn Antenna" Applied Sciences 8, no. 9: 1582. https://0-doi-org.brum.beds.ac.uk/10.3390/app8091582
Note that from the first issue of 2016, this journal uses article numbers instead of page numbers. See further details here.