Article

Detection and Classification of Overlapping Cell Nuclei in Cytology Effusion Images Using a Double-Strategy Random Forest

by
Khin Yadanar Win
1,*,
Somsak Choomchuay
1,
Kazuhiko Hamamoto
2 and
Manasanan Raveesunthornkiat
3
1
Faculty of Engineering, King Mongkut’s Institute of Technology Ladkrabang, Bangkok 10520, Thailand
2
School of Information and Telecommunication Engineering, Tokai University, Tokyo 108-8619, Japan
3
Department of Pathology, Faculty of Medicine, Srinakharinwirot University, Nakhon Nayok 26000, Thailand
*
Author to whom correspondence should be addressed.
Submission received: 2 August 2018 / Revised: 3 September 2018 / Accepted: 3 September 2018 / Published: 11 September 2018
(This article belongs to the Special Issue Advanced Intelligent Imaging Technology)

Abstract

:
Due to the close resemblance between overlapping and cancerous nuclei, the misinterpretation of overlapping nuclei can affect the final decision of cancer cell detection. Thus, it is essential to detect overlapping nuclei and distinguish them from single ones for subsequent quantitative analyses. This paper presents a method for the automated detection and classification of overlapping nuclei from single nuclei appearing in cytology pleural effusion (CPE) images. The proposed system is comprised of three steps: nuclei candidate extraction, dominant feature extraction, and classification of single and overlapping nuclei. A maximum entropy thresholding method complemented by image enhancement and post-processing was employed for nuclei candidate extraction. For feature extraction, a new combination of 16 geometrical and 10 textural features was extracted from each nucleus region. A double-strategy random forest was performed as an ensemble feature selector to select the most relevant features, and an ensemble classifier to differentiate between overlapping nuclei and single ones using selected features. The proposed method was evaluated on 4000 nuclei from CPE images using various performance metrics. The results were 96.6% sensitivity, 98.7% specificity, 92.7% precision, 94.6% F1 score, 98.4% accuracy, 97.6% G-mean, and 99% area under curve. The computation time required to run the entire algorithm was just 5.17 s. The experiment results demonstrate that the proposed algorithm yields a superior performance to previous studies and other classifiers. The proposed algorithm can serve as a new supportive tool in the automated diagnosis of cancer cells from cytology images.

1. Introduction

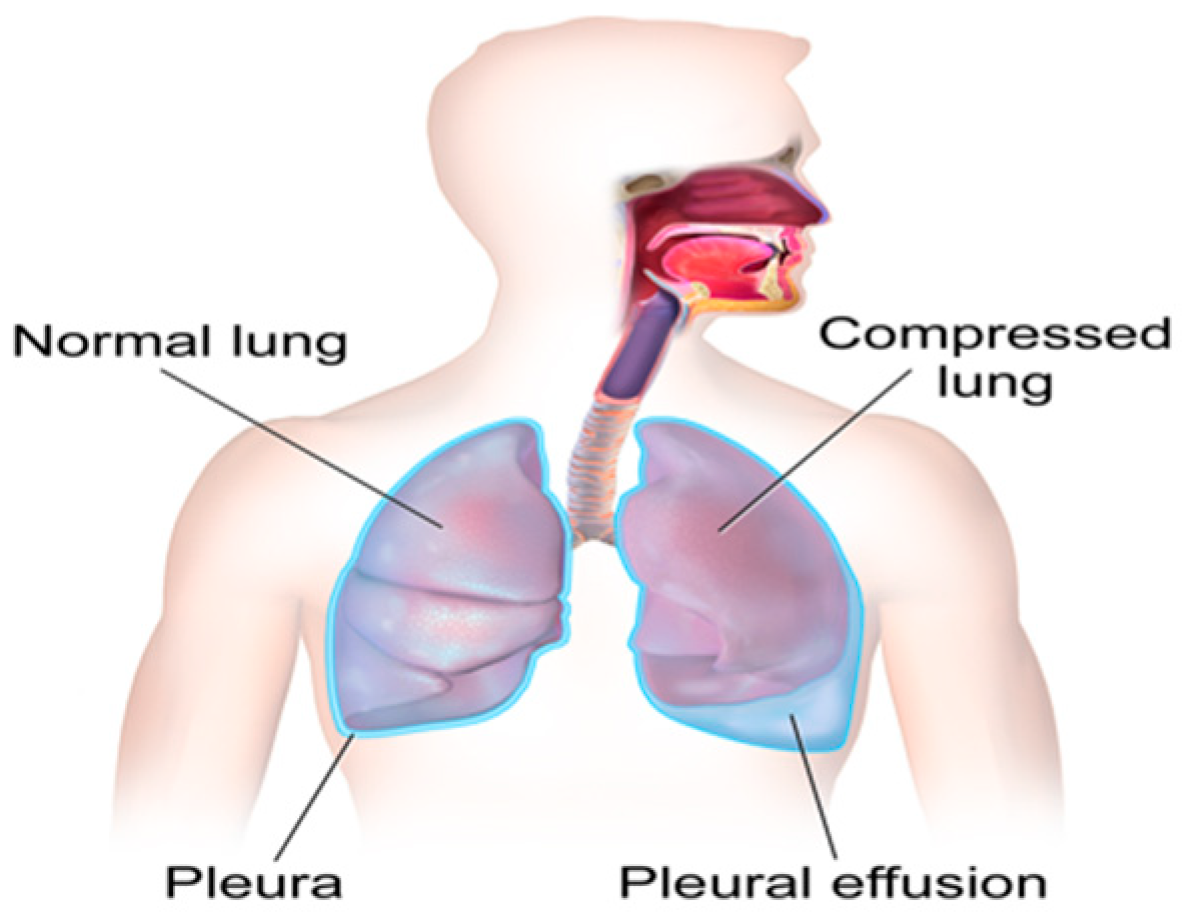
Cancer is a class of diseases characterized by malignant cells, and malignant pleural effusion (MPE) is the excessive accumulation of cancerous effusion in the pleura, as shown in Figure 1 [1]. MPE is one of the most aggressive cancerous effusions and a sign of an advanced stage of cancer. It is a common problem for cancer patients, and around half of cancer patients end up developing MPE. MPE can be caused by metastatic cancers or primary cancers (mesothelioma). MPE often implies an advanced stage of cancer and confers a poor prognosis [2,3]. Thus, fast and accurate diagnosis and prognosis of cancer cells in pleural effusion is a first priority task required so that cytologists can arrange effective treatment plans.
Cytology examination is currently considered the gold standard for diagnosing cancerous cells in pleural effusion. Cytologists take a small amount of effusion then fix and stain it on a glass slide using certain staining methods. They then visually examine the cytology slides under a microscope in order to diagnose for abnormality in every single cell [4,5]. However, classical cytological diagnosis is laborious, tedious, and unreasonably time-consuming. It is also prone to different diagnosis results depending on the observer. Recently, there has been growing interest in automated cell analysis systems which can serve as assistance tools to help cytologists during cytology examinations. They can provide fast, accurate and objective diagnostic results for cell analysis [6,7].
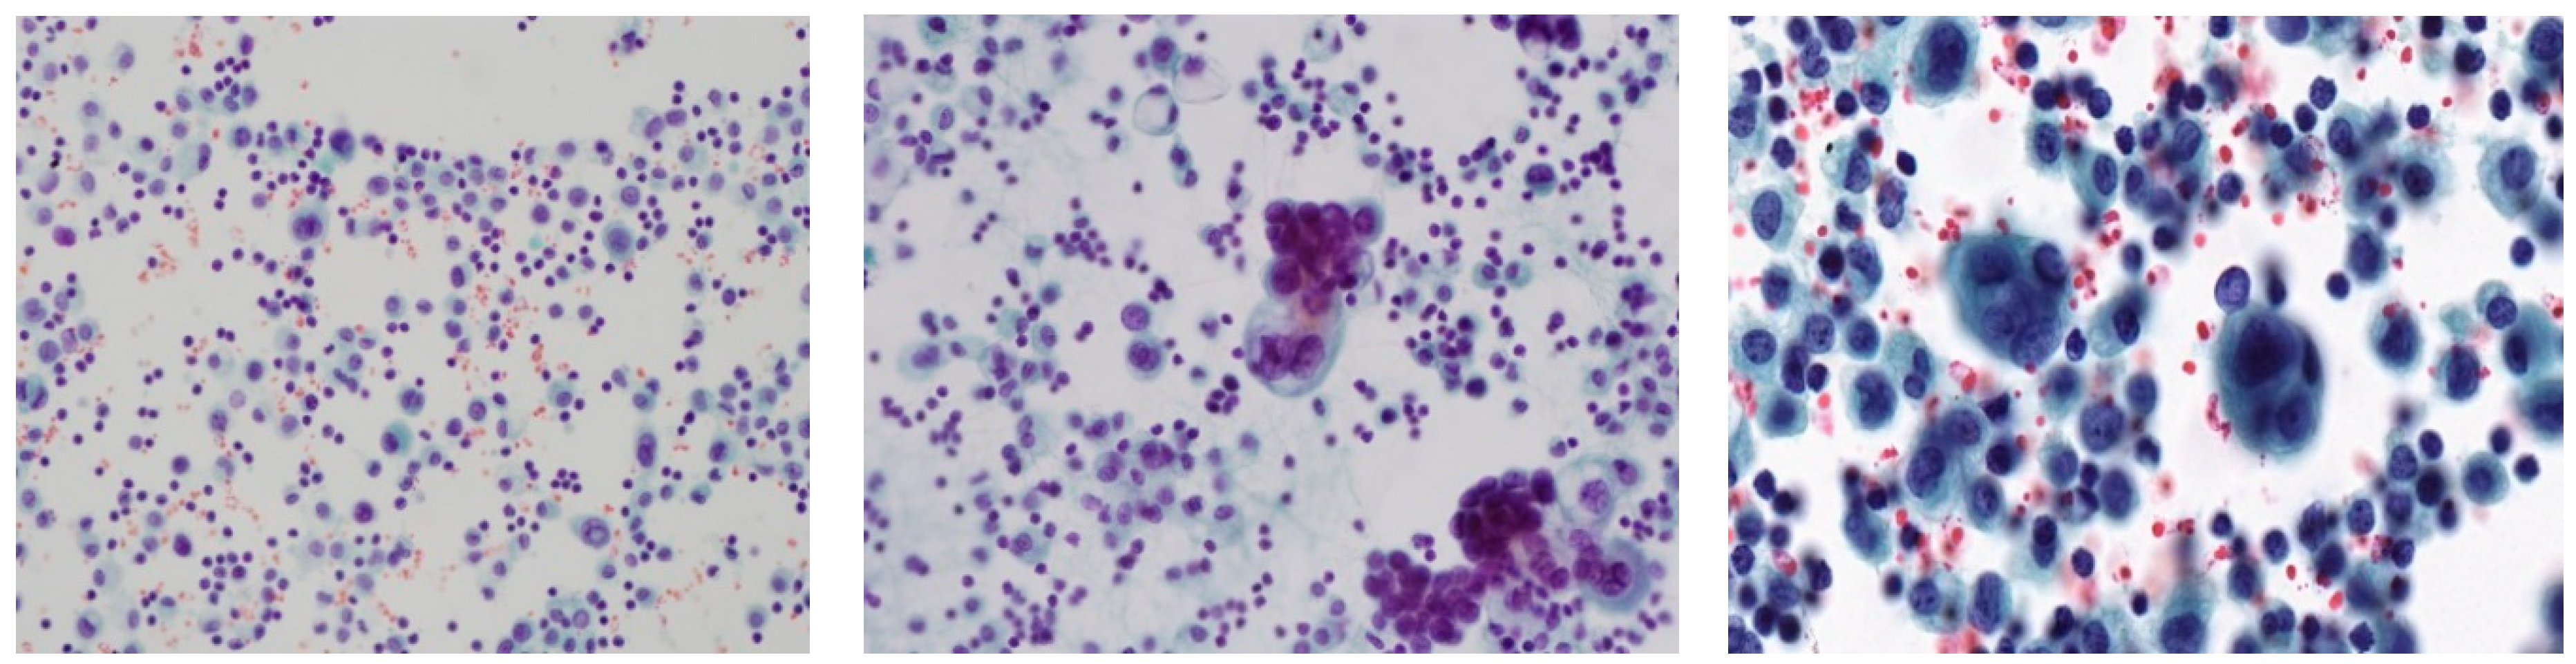
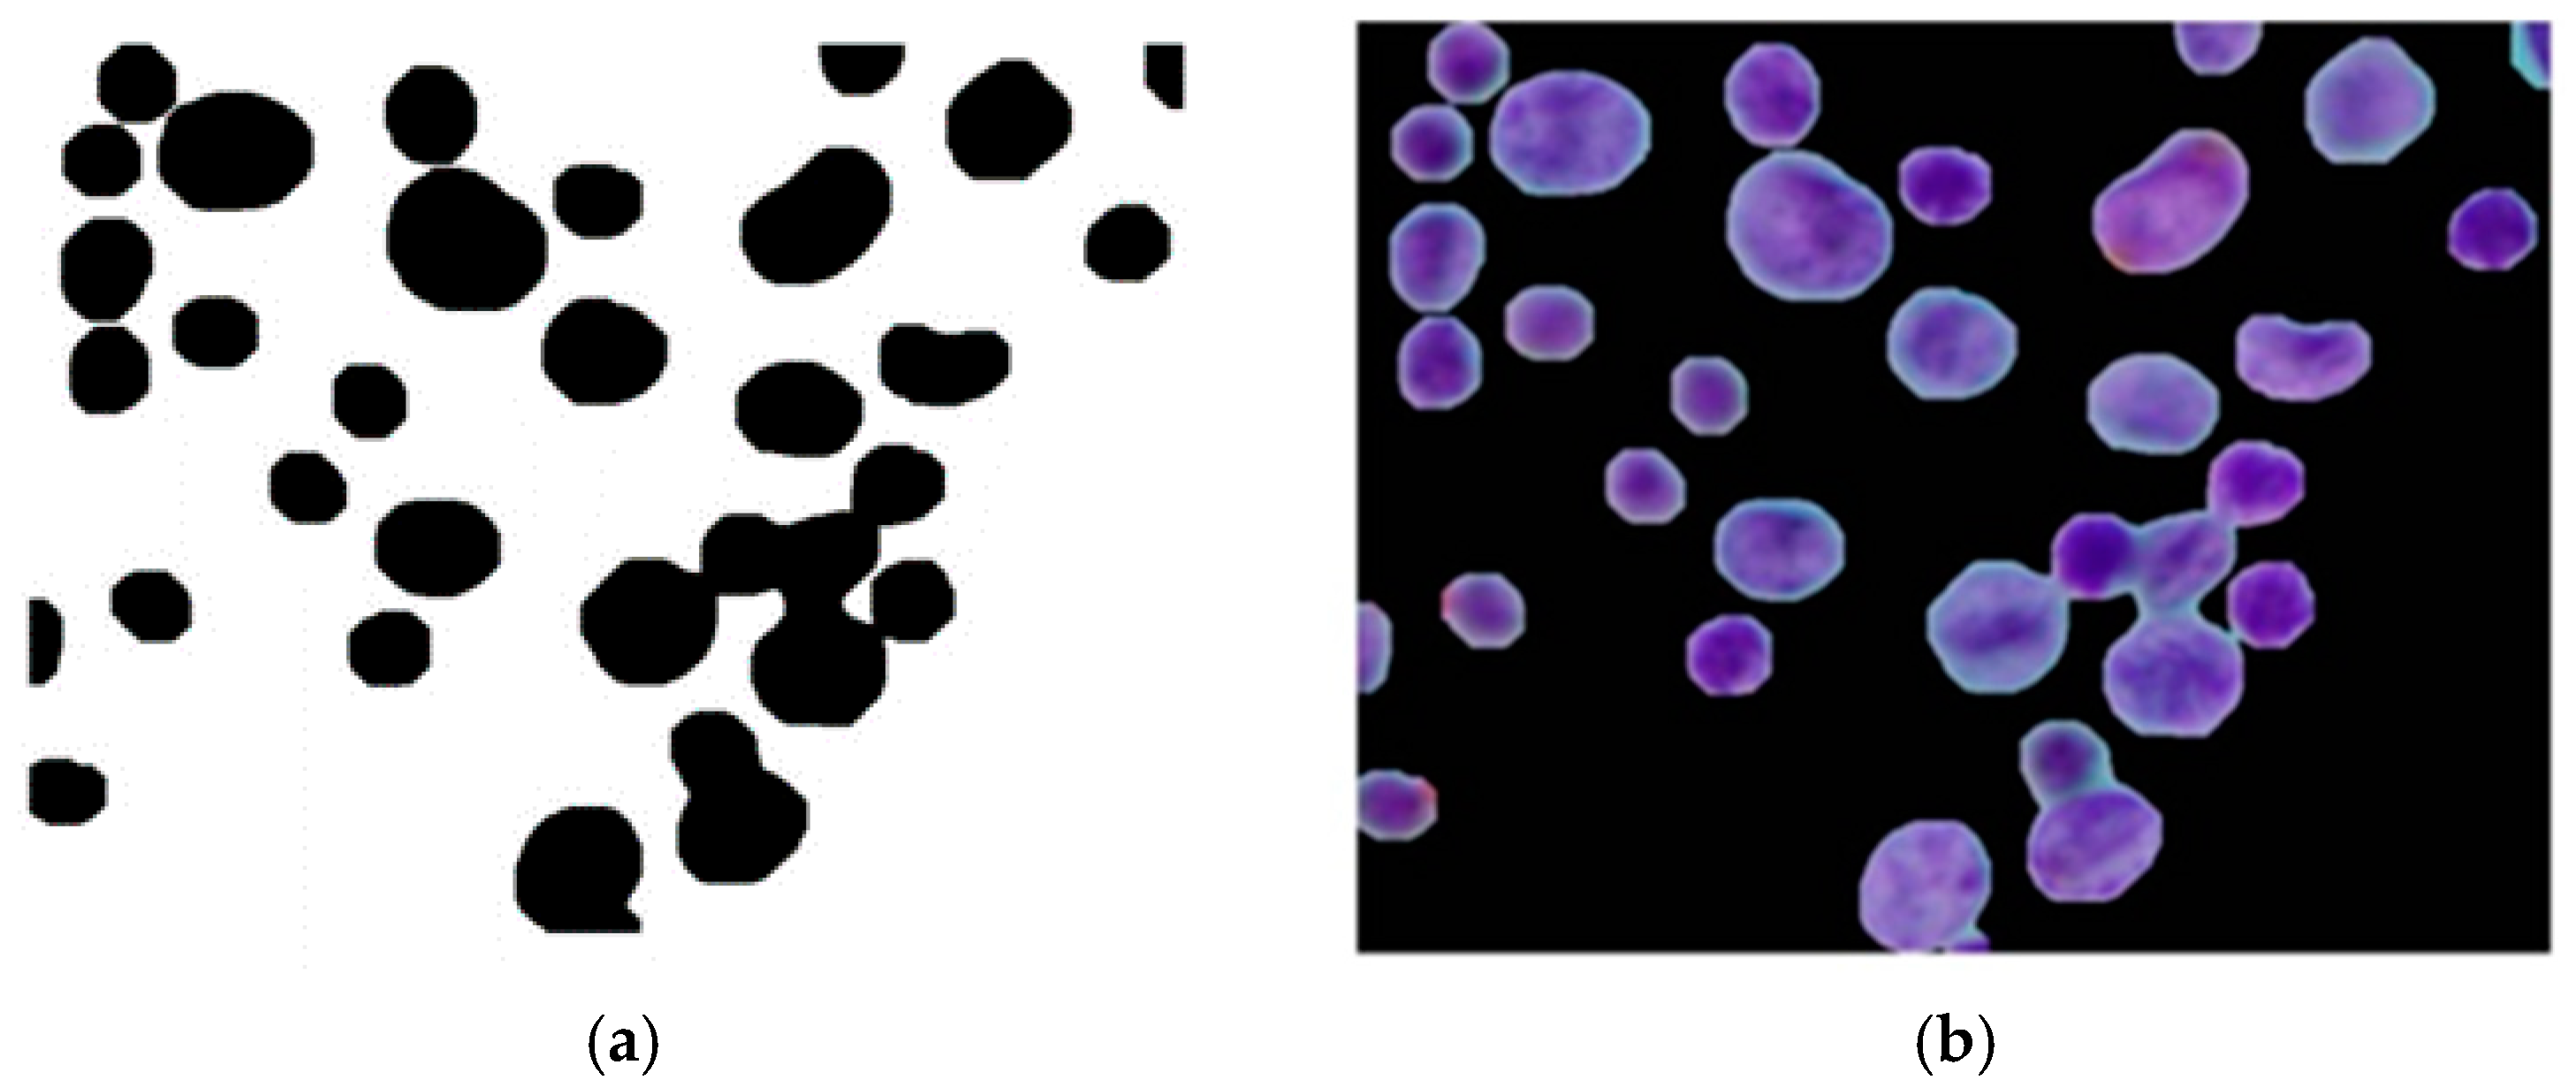
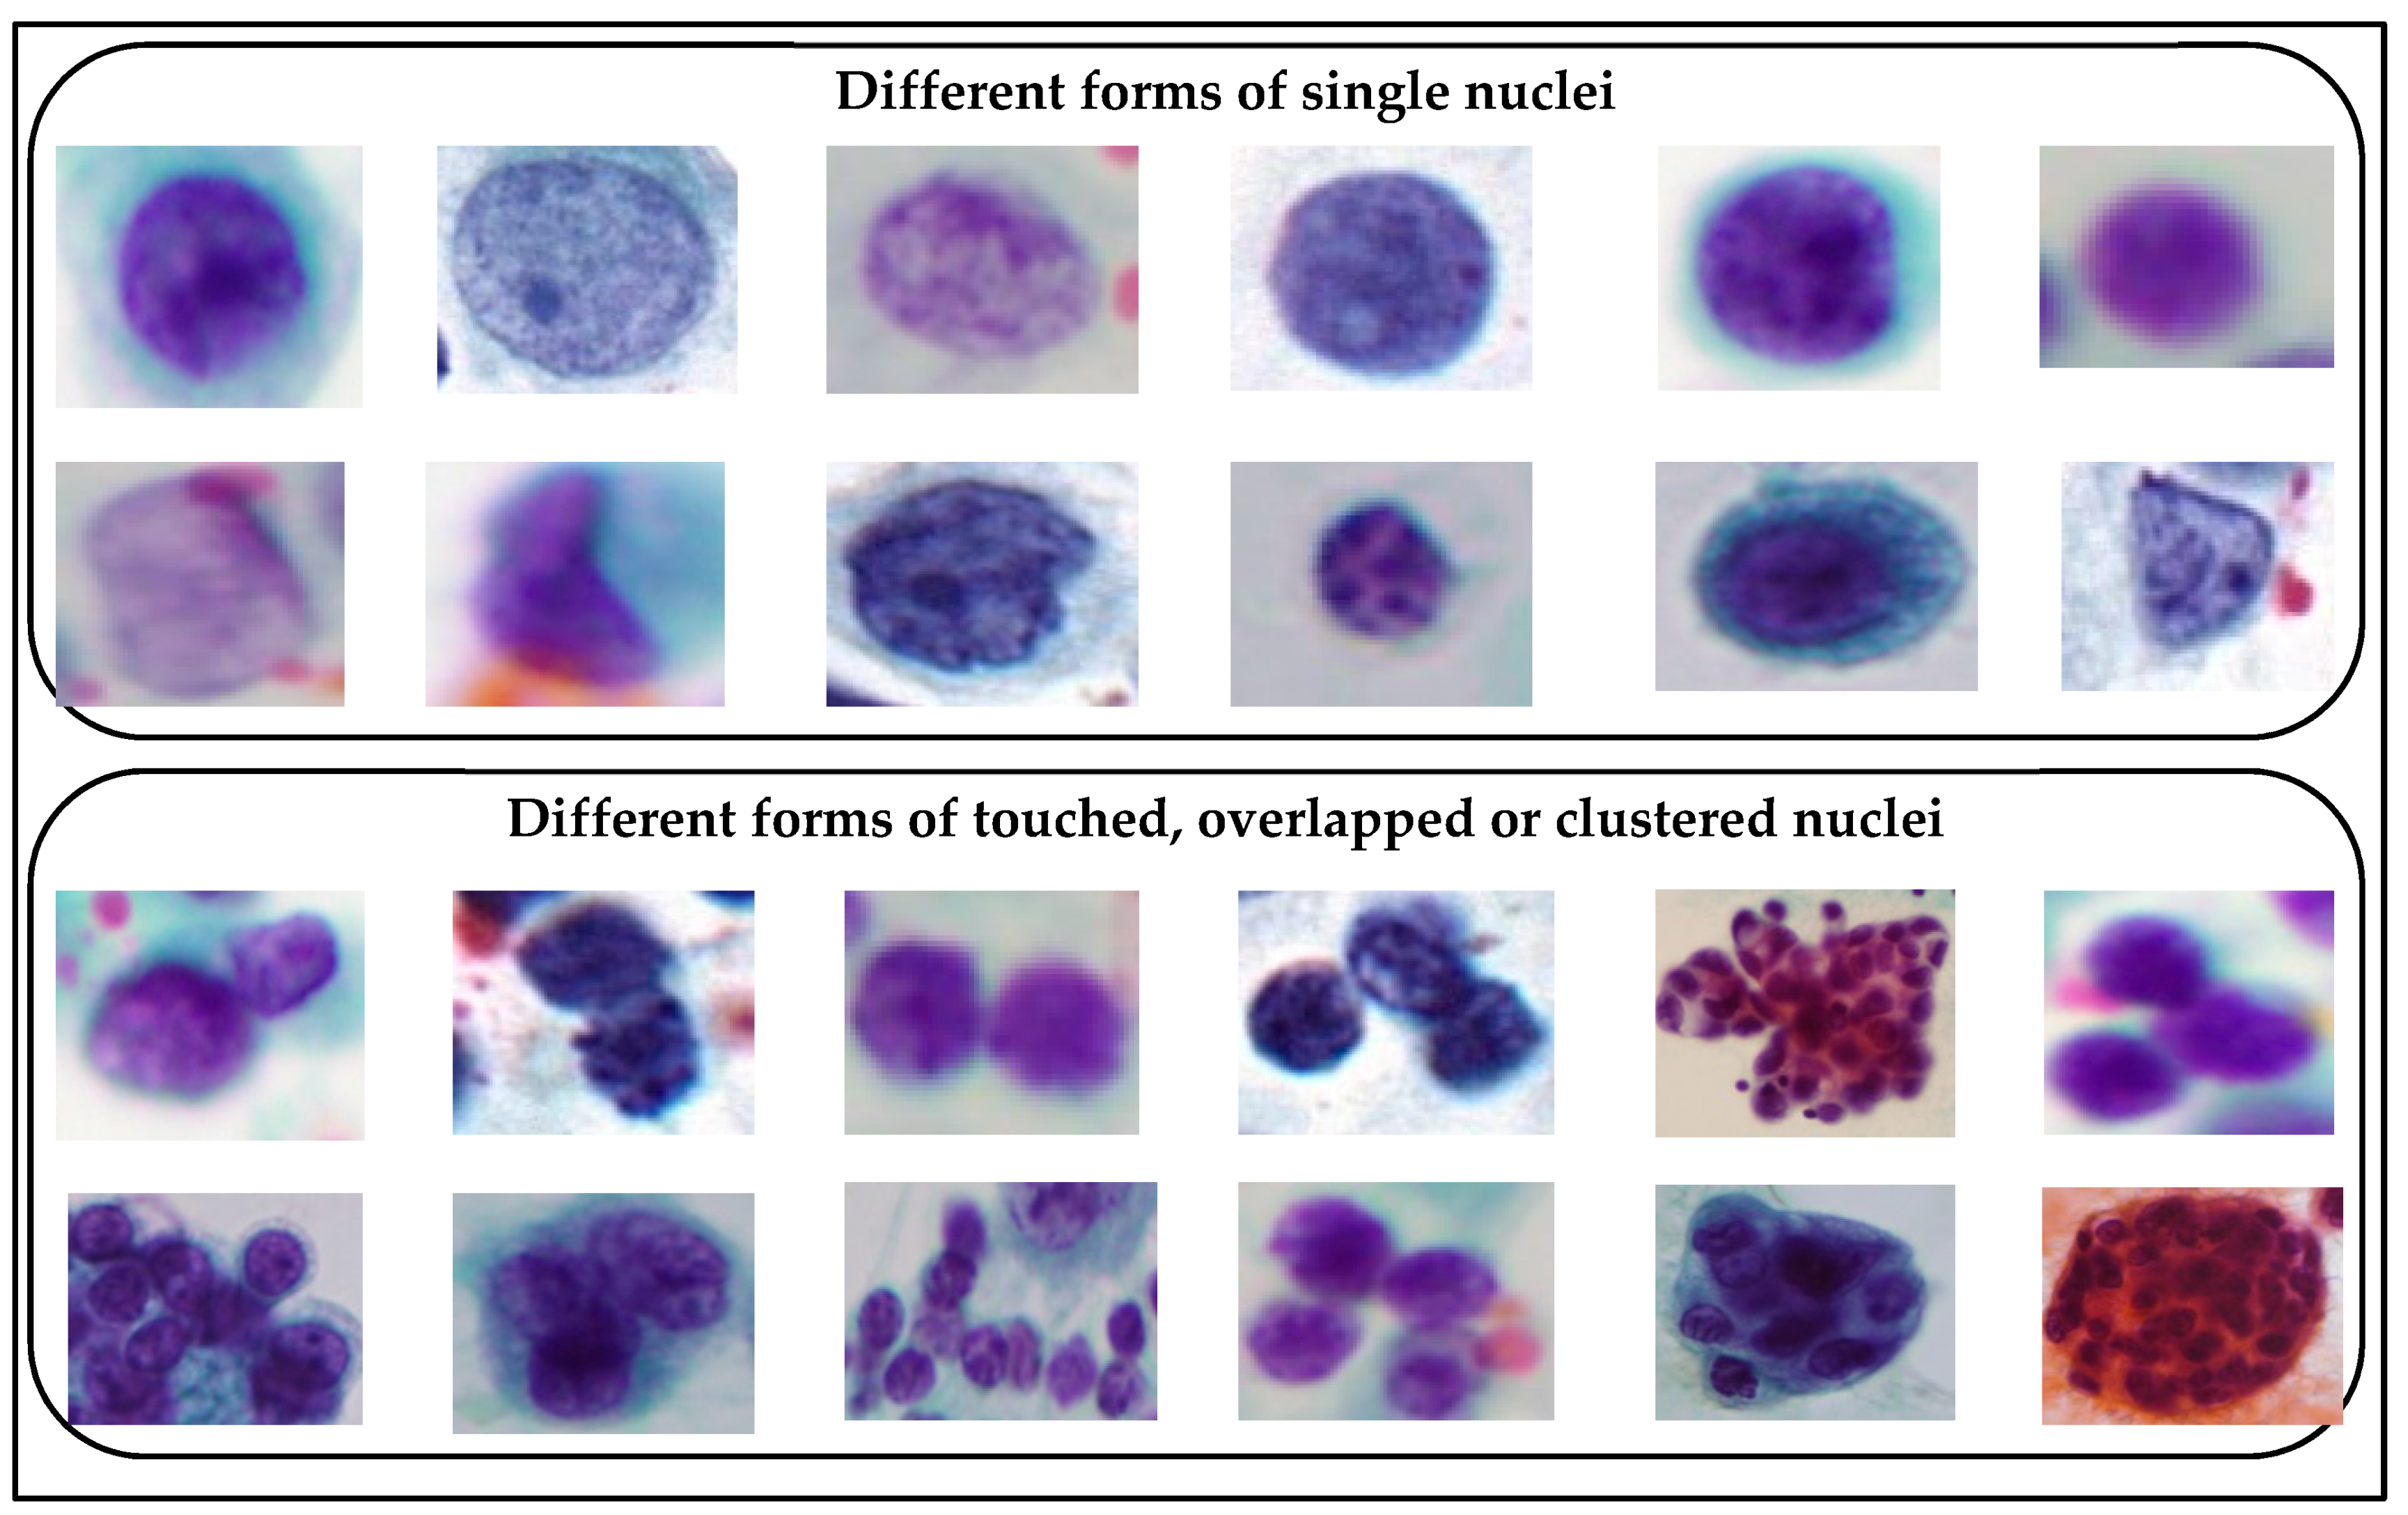
One of the difficulties found while developing such systems is the presence of overlapping nuclei. Nuclei morphology, e.g., size, shape, and density are the most important features used by cytologists in predicting cell malignancy. For instance, the excessive enlargement of nuclei and their irregular shapes are highly suggestive of malignancy. Accurate delineation of each cell contour is essential for the quantitative analysis of cell morphology. In practice, there is a great deal of overlapping nuclei occurrence in cytological pleural effusion (CPE) images. Although human experts find little difficulty in differentiating between single and overlapping nuclei, it is still a challenging task for automatic systems. Overlapping nuclei in CPE images often appear as dark purple regions, and there is a high degree of resemblance among the nuclei forming the overlapped or clustered regions. Thus, an automatic system may wrongly interpret overlapping nuclei as single nuclei. It is difficult to retrieve and quantitatively analyze features such as nucleus morphology and density if cells are touching, overlapping or clustered. Furthermore, the excessive enlargement of size and irregular shapes of overlapping nuclei regions may lead automatic systems to misclassify them as malignant cells. Thus, overlapping nuclei should be detected and distinguished from single ones prior to nuclei feature learning.
Many researchers have reported several methods for delineating the interregional contours of overlapping cell nuclei or for splitting the overlapping nuclei into individual ones. Watershed methods [8,9] and concavity analysis based methods [10,11] are the most widely used overlapping-nuclei splitting methods in microscopy image analysis. Recently, Kumar et al. reported a rule-based clump isolation method for separating overlapping nuclei [12]. In another study, Wang et al. presented a bottleneck rule method for isolating overlapping cells [13]. These previous studies indicate that there has been a tremendous interest in accurately delineating individual cell nuclei in cell image analysis.
Nevertheless, it is crucial to accurately determine the presence of overlapping nuclei prior to the occurrence of any splitting process. Some studies have been devoted to distinguishing overlapping nuclei from single ones. For instance, Tafavogh et al. [14,15] demonstrated a method for the identification of overlapping nuclei on microscopic images of neuroblastoma. Nuclei are segmented using a mean shift method, and three size-and shape-based features of cells namely (i) area, (ii) diameter equality, and (iii) concavity dominance are extracted to differentiate between single and overlapped cells using step-by-step conditional filtering. Abbas et al. [16] proposed a method for detecting overlapping nuclei in microscopic red blood cell images prior to performing a splitting process. First, an image is binarized using an automatic thresholding approach, then three features, namely (i) convex hull, (ii) area, and (iii) elongation, are extracted. The pre-labeled value of each feature through parameter-tuning is used to determine overlapping nuclei. Wang et al. [13] reported on a pre-determination scheme to identify overlapping nuclei using shape-based classification. Five shape features that is (i) solidity, (ii) convexity, (iii) eccentricity, (iv) area, and (v) variance are extracted for each nucleus and fed as input to an SVM classifier to classify single and overlapping cell nuclei. Four different types of image set: oil cells, yeast cells, blood cells and curvularia cells, are used to evaluate the method and obtain a classification accuracy of 86%, 90%, 88%, and 88% respectively. Guven et al. [17] proposed an unsupervised data-clustering method to determine the presence of overlapping cell nuclei from Pap smear cervical images. The nuclei borders are firstly outlined using a morphological operation. Three shape-based features and two minima based features are extracted and used as inputs to a fuzzy clustering method to discriminate between single and overlapping nuclei. The method is evaluated using 290 nuclei and obtains an F-score of 79.1%, a recall of 67.4%, and precision of 95.7%. The methods in [14,15,16] are parameter-dependent and limited to objects with a great variation of size and shape. The method proposed in [13] is based only on shape and size features. In the case of cytology pleural effusion images, the forms of overlapping nuclei vary greatly. Thus, it can be deduced that considering only size and shape features may not be sufficient for discriminating between overlapping and single nuclei. The method presented in [17] takes into account not only shape features but also local minima based features and judges for the presence of overlapping nuclei using an unsupervised clustering method, which yields acceptable performance. However, the method is designed specifically for cervical cells. It cannot be taken for granted that this method will provide good results with pleural effusion cells. The originators of the aforementioned method did not take into consideration the textural pattern difference between single and overlapping nuclei despite the fact that the texture pattern between single and overlapping nuclei varies greatly. Moreover, supervised learning techniques could greatly help to attain a more accurate detection rate [18]. For our method, we extract a new combination of 16 geometric (i.e., size and shape) and 10 textural features and select the most relevant features from a total of 26 that are then used in identifying overlapping nuclei in CPE images. Using the selected features, five supervised learning methods, namely naïve Bayes (NB), support vector machine (SVM), K nearest neighborhood (KNN), decision tree (DT), and random forest (RF), are examined for the classification of single and overlapping nuclei. It should also be noted that our study objective is focused on accurately detecting overlapping nuclei to improve the extraction of each nucleus. Our proposed method is not a separation algorithm for overlapping nuclei or an extraction algorithm for interregional contours of overlapping nuclei.
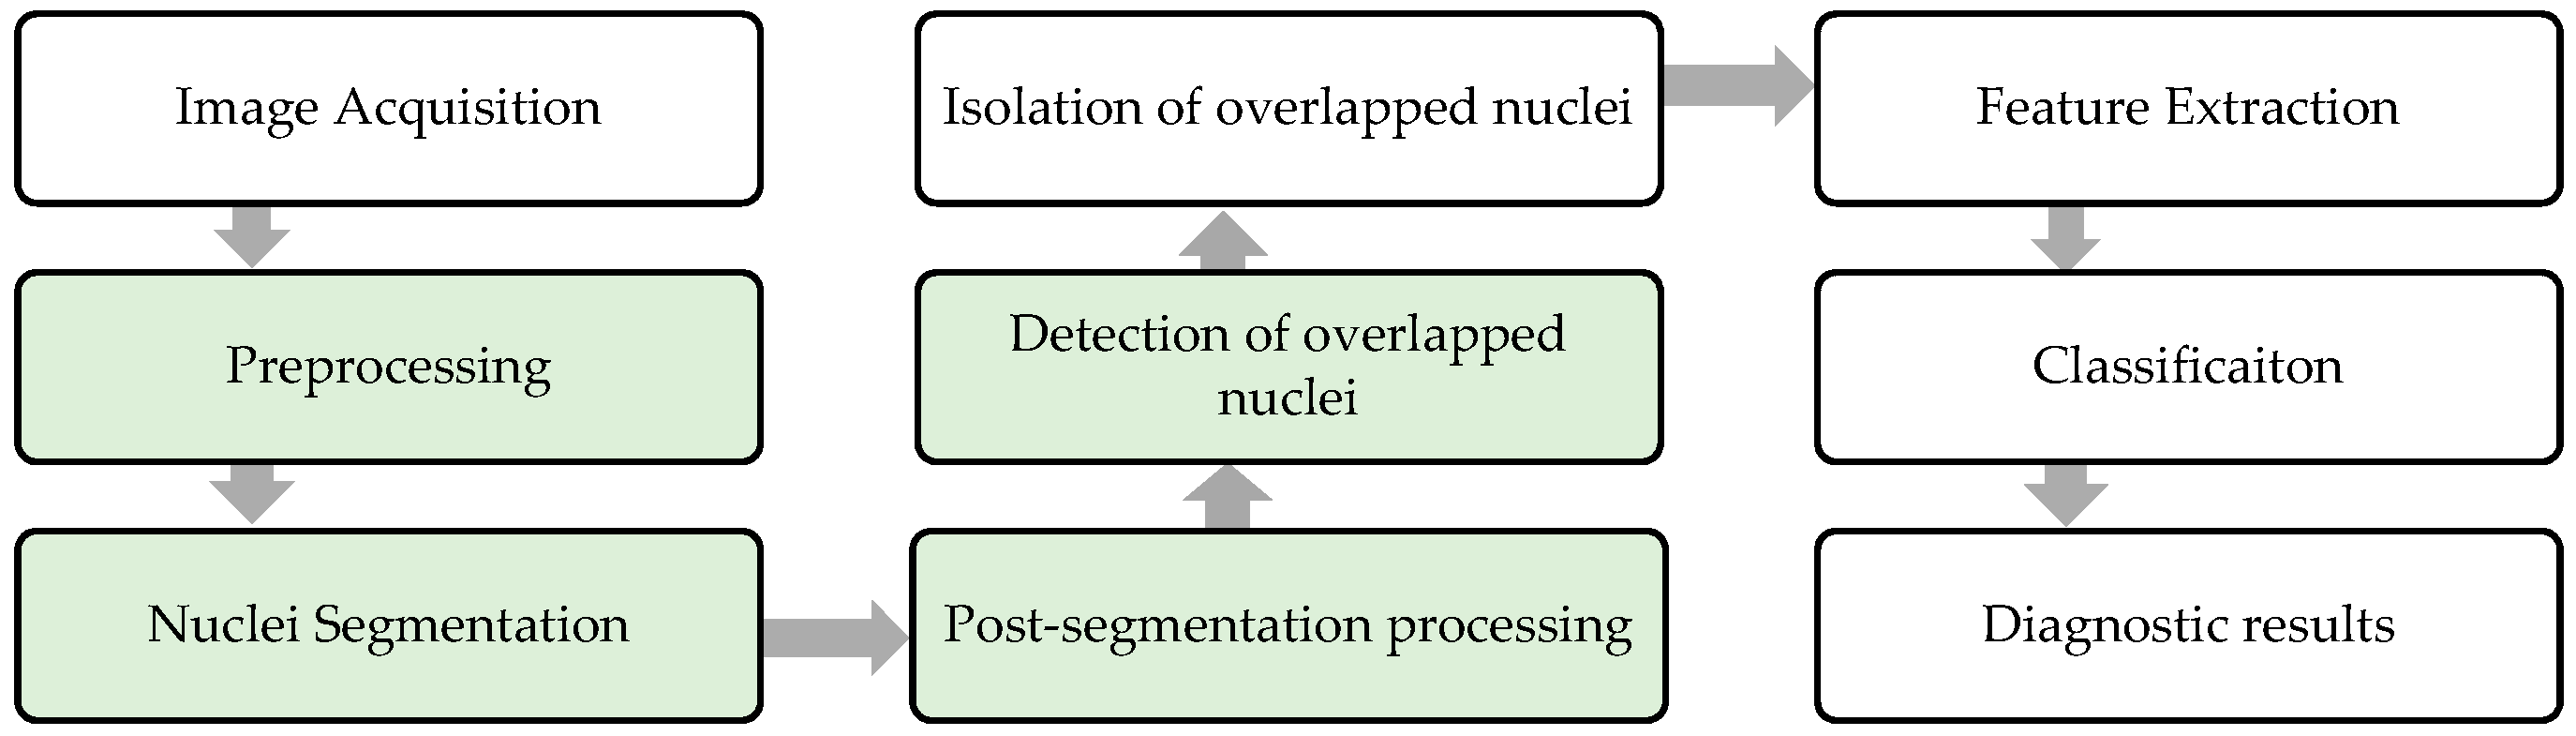
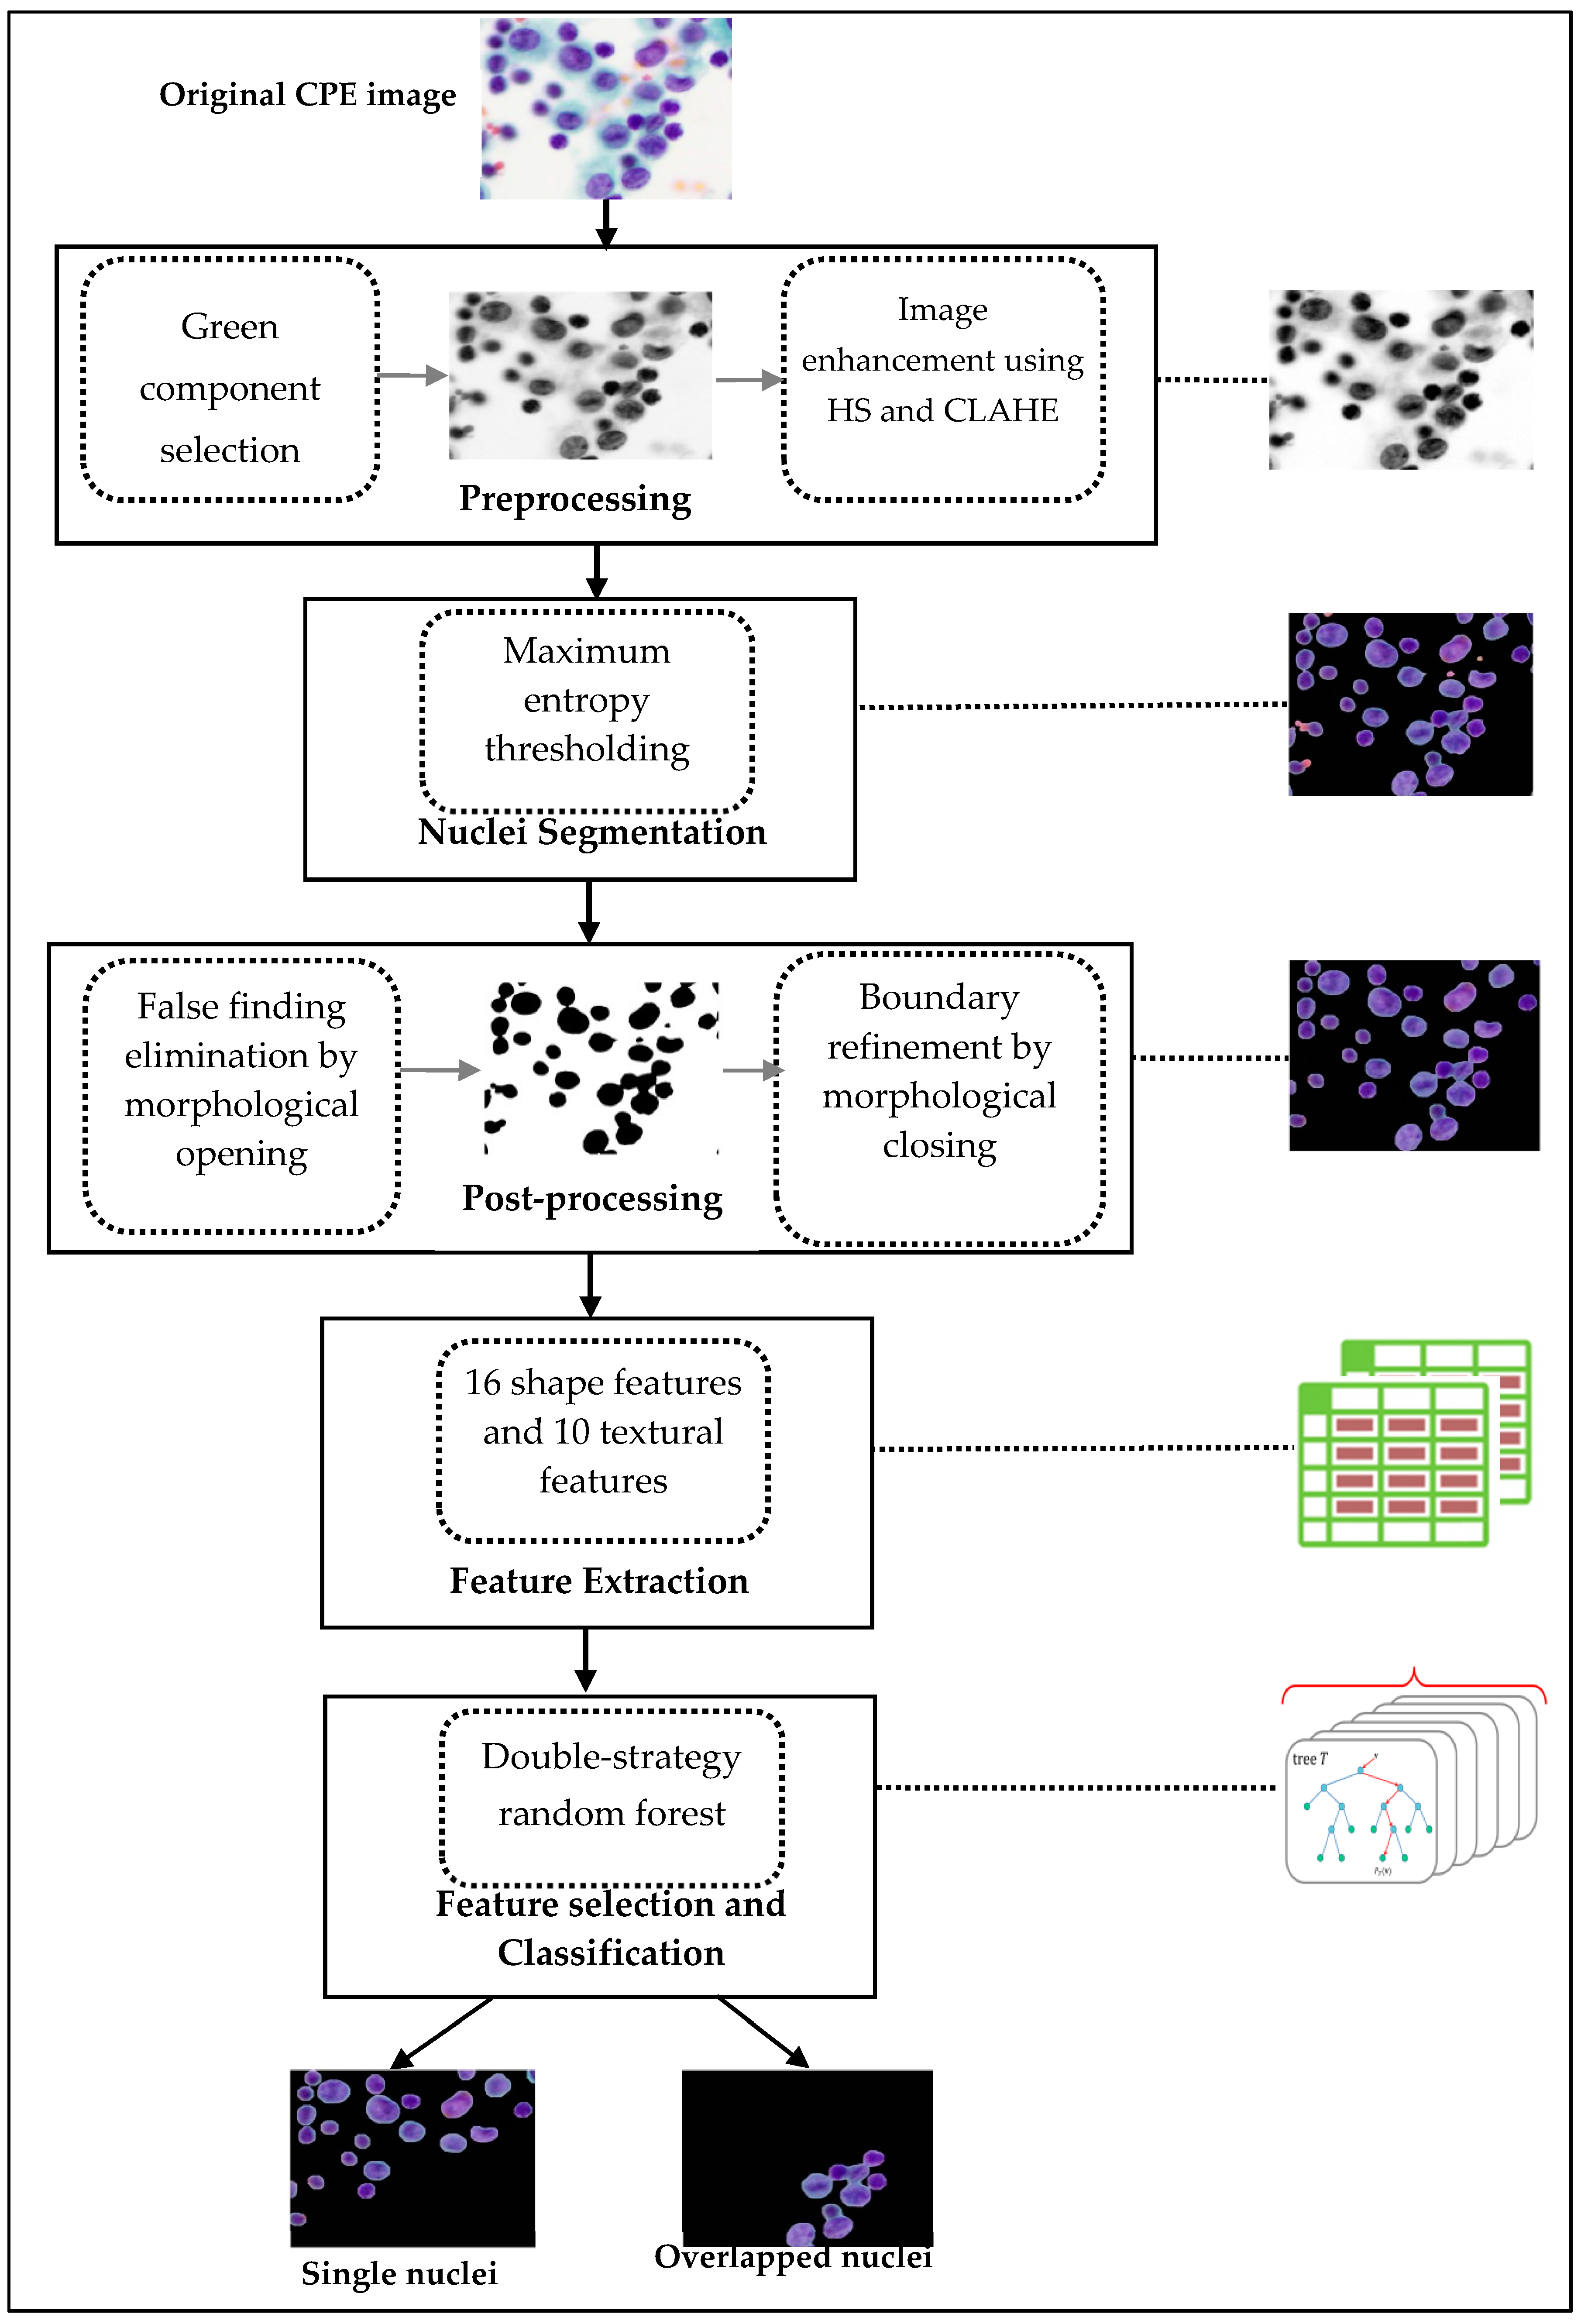
We hereby propose the following novel ideas to distinguish between single and overlapping nuclei in CPE images using three main steps: (i) nuclei segmentation: extracting candidate nuclei using maximum entropy thresholding supplemented by preprocessing and refinement; (ii) feature extraction: extracting a new combination of nuclei features, 16 geometric features and 10 textural features; and (iii) classification: selecting the most relevant features and determining whether the nucleus is single or overlapping using a double-strategy random forest algorithm. The performance of the proposed method was assessed using six evaluation metrics namely sensitivity, specificity, precision, F1 score, accuracy, and G-mean on a local dataset containing 4000 nuclei. The experiment results were acquired in various ways. Firstly, the classification accuracy of using all features and selecting them by random forest was investigated and compared. Then, the accuracy of four alternative classifiers, namely naïve NB, SVM, KNN, and DT, was further examined and compared with the results achieved by random forest. Third, the performance of previous studies was investigated and compared with the results achieved from the proposed method. In addition, the computation efficiency of nuclei segmentation, feature extraction, and classification was analyzed to prove the reliability and suitability of the proposed method for real-time use. This analysis demonstrates that the proposed method is relatively simple, computationally affordable, and yields promising results. Thus, it can serve as a feasible, reproducible and cost-effective tool in the development of an advanced system for diagnosing cancer cells in CPE images.
The rest of this paper is divided into five sections. Section 2 presents the image acquisition and dataset description processes. Section 3 presents the methodology proposed in this study containing preprocessing, nuclei candidate extraction, post-processing, feature extraction, and classification. The experiment results and discussion are presented in Section 4. The conclusion is given in the last section, Section 5.

2. Image Acquisition and Dataset Description

The studied dataset is based on digitized microscopy images from the cytology slides of pleural effusion materials at the Department of Pathology, Faculty of Medicine, Srinakharinwirot University, Thailand. The study is approved by institutional ethics committee. During preparation of the cytology slides, experts took a small amount of effusion material, and fixed and stained it on glass slides using a classical Papanicolaou (Pap) staining method. Then, cytologists captured the digital images from the cytological slides through a digital camera mounted to a light microscope with 40× magnification. The original images have resolutions of 4050 × 2050 pixels stored in 8-bit RGB space. Figure 2 presents sample cytology images of pleural effusion. Cytologists also provided a ground truth dataset containing the annotation of pathologic cells.

3. Methodology

The aim of our study was to develop a pre-determination mechanism of overlapping nuclei which could serve as a supportive process to enhance the diagnostic accuracy of the quantitative analysis. Figure 3 shows the typical architecture of automatic cell analysis systems utilized for the detection of cancer cells in microscope images. The green blocks indicate the focus range of this study. Since our study is centered on the accurate detection of overlapping nuclei, separation of the overlapping nuclei has been deferred for later study. The block diagram of the proposed algorithm for detecting and classifying overlapping nuclei is depicted in Figure 4. It can generally be divided into the three following steps: nuclei segmentation supplemented by preprocessing and post-processing, feature extraction, and classification. The details of each step will be described in the subsections below.

3.1. Preprocessing

As computation time is crucial in medical diagnosis applications, the original image is resized from 4050 × 2050 pixels to 640 × 640 pixels to achieve a low-cost process. After resizing the image, the input RGB image is converted to a 2D intensity image of its green component in order to reduce processing complexity and achieve effective nuclei extraction. As shown in Figure 5, we investigated the corresponding image’s individual R, G, and B components from the original RGB image. It is reasonable to infer that cell nuclei on the green channel are more distinguishable from other components due to higher contrast, thereby motivating us to use the green component of CPE images in further processes. The quality of the image is further improved using histogram stretching [19], and contrast limited adaptive histogram equalization (CLAHE) [20,21] on the green components. The visual before and after results and the preprocessing step are shown in Figure 6.

3.2. Nuclei Segmentation

Nuclei segmentation is an important task for most microscopic image analysis employed in disease diagnosis, and also in the determination of overlapping nuclei. Accurate extraction of nuclei regions can result in the good performance of subsequent processes. In most CPE images, cell nuclei appear as the darker regions, along with blood cells and artifacts, and are relatively low in gray-level intensity. On the other hand, background and cytoplasm regions are high in gray-level intensity. Image gray-level intensity variation is depicted as the surface plot in Figure 7, wherein the dark-bluish intensity valleys represent cell nuclei regions. By benefiting from this priori-knowledge of brightness and intensity variation inside an image, we consider gray level intensity-based image segmentation methods to extract the cell nuclei. Thresholding methods are the simplest and most used approaches to gray level intensity-based image segmentation. Currently, there are numerous thresholding based segmentation methods, e.g., Otsu’s thresholding method, the adaptive thresholding method, maximum entropy thresholding, and so on. Maximum entropy thresholding does not require specific prior knowledge and can deal with images which have non-ideal bimodal histogram. Therefore, we employed a maximum entropy thresholding method to extract cell nuclei from CPE images which have non-uniform gray level distribution. Another motivation for using the maximum entropy method to select the optimal threshold in our study was that it has been widely and successfully used in many real applications of medical image analysis [22,23,24] Maximum entropy thresholding is one of the global thresholding methods which is proposed by Shannon in 1948, [25,26]. Similar to the Otsu method, maximum entropy thresholding selects the optimal threshold by maximizing the information measure between objects and their backgrounds. In our study, maximum entropy thresholding based nuclei segmentation was performed using five steps. In the first step, we computed the entropy function on the 1D histogram of a gray level image. The second step was to compute the probability distribution of the object and the background. Suppose i is the gray level intensity of a pixel in an image so i = [ 0 , 1 ... T 1 , T , t + 1 ... 255 ] , and the probability of each gray level i can be calculated as:
P i = n i n
where the total number of pixels in an image is denoted as n, and the number of pixels that have a gray level i is denoted as n i . Let r o i and b respectively be the region of interest (ROI) and the background of an image; thus, the probabilities of r o i and b are defined in Equations (2) and (3):
P r o i = i = 0 T 1 P i
P b = i = T 255 P i
The third step was to compute the entropies of ROI and the background, which can be computed as follows:
E r o i ( T ) = i = 0 T 1 P i P r o i l o g 2 P i P r o i
E b ( T ) = i = T 255 P i P b l o g 2 P i P b ,
Therefore, the entropy of the gray level image segmented by threshold t is:
E ( t ) = E r o i ( t ) + E b ( t )
The principle of maximum entropy is applied to select t , which maximizes E . Thus, the fourth step was to select the optimal threshold t by maximizing the entropy of E ( t ) as calculated below:
t = A r g   M a x ( E ( T ) )
Finally, the region of interest (nuclei) is segmented into black pixel and background regions using an optimal threshold as follows:
( r e g i o n   o f   i n t e r e s t ) 0 t 255 ( b a c k g r o u n d )
The visual results of maximum entropy thresholding-based nuclei segmentation are demonstrated in Figure 8.

3.3. Post-Processing

Since the segmentation results from maximum entropy thresholding still contain spurious objects, such as blood cells and artifacts, it is essential to eliminate these objects for robust segmentation performance. Priori knowledge regarding nucleus size was incorporated to remove the spurious objects. We observed that the spurious objects were smaller than the actual nuclei. Thus, a morphology filtering method was adapted to remove the undesired objects based on their sizes. The thresholding size between actual nuclei and spurious objects is specified as 1500 pixels through empirical setting. Objects greater than 1500 pixels in size were retained as actual nuclei; others were removed. Subsequently, a morphological gradient operation, which is a combination of erosion and dilation, was applied to refine actual nuclei regions [27]. The morphological gradient G of a grayscale image (f) can be computed as follows:
G ( f ) = f ( ) f ( )
where and represent the dilation and erosion, respectively. The structuring element (SE) with disk-shape and radius (R) is used. R is set as 5 and 12 for erosion and dilation, respectively. The visual result of the post-processing stage using morphological filtering and gradient is depicted in Figure 9.

3.4. Feature Extraction

In this study, overlapping nuclei are distinguished from the single ones using certain features. Extracting rich and semantically discriminative features from nuclei is of paramount relevance to advancements in the differentiation of single and overlapping nuclei. The variations of single and overlapping nuclei are depicted in Figure 10. It can be seen that there are different forms of overlapping nuclei, such as light touching, multi-nuclei touching, multi-nuclei overlapping, and cohesive tight clusters. Thus, depending solely on size and shape features may not be sufficient for the robust identification of overlapping nuclei in CPE images. It is our observation that the textural pattern within single and overlapping nuclei varies greatly. Thus, we considered textural features, as well as geometric features (i.e., size and shape features), and propose a new combination of geometrical and textural features [28] to distinguish overlapping nuclei from single ones. A total of 26 features (i.e., 16 geometric and 10 textures) are extracted from each segmented region. They are described in Table 1 and Table 2.

3.5. Classification

Using all extracted features which may contain noisy and irrelevant features as input parameters may cause a classifier to have poor generalization capability and require intensive computation time. In bioinformatics applications, there are two ways to improve classification accuracy. They are: selecting the significant features and choosing the best-suited classifier. In this study, we handled these two issues using a double-strategy random forest algorithm. The reason for utilizing random forest is that it provides favorable results for unbalanced data classification, and is more robust in dealing with noisy data. Our dataset of nuclei was highly unbalanced, with the number of overlapping nuclei constituting only a very small minority of the dataset at 625 (16%) and single nuclei constituting an abundant majority of the dataset at 3275 (84%). Random forest (RF) is one of the most successful ensemble classification models which was proposed by Ho [29,30], and later by Breiman [31]. RF is an ensemble of decision trees which integrates the idea of Ho’s “bagging (bootstrap aggregation)” and Breiman’s “random variable selection”. The principle of RF is to build multiple decision trees using randomized bootstrapped samples from a learning dataset and randomly selecting a subset for training data. Each decision tree, also known as a Classification And Regression Tree (CART), is grown using randomized bootstrap samples of input data and generates its own classification results. RF finally aggregates the predictions of all decision trees by majority voting. The block diagram of RF is depicted in Figure 11. Observations that are not contained in training bootstrap samples are “out-of-bag” (OOB), and they are used for predicting errors. Data utilization in constructing RF is illustrated in Figure 12. RF is widely used as a feature selection algorithm [32,33] and classifier [34,35,36] in medical diagnosis analyses. In this study, we utilize RF in two stages: feature selection and classification. First, RF-based ensemble feature selection is performed to rank the importance of features based on OOB error permutation and select the most important features. Using the selected feature, an RF classifier is constructed as an ensemble classifier to distinguish overlapping nuclei from single ones. Once an RF ensemble classifier is trained, it can be used to predict new samples in the testing set. The processing steps applied in double-strategy RF are given as pseudo code in Table 3.

3.6. Performance Assessment

Performance of the proposed algorithm is evaluated on a testing dataset containing 800 nuclei. Six measures namely sensitivity, specificity, precision, F1 score, accuracy, and geometric mean (G-mean) are considered as performance metrics [37,38]. These measures are computed using Equations (10) through (15). It is worth noting that sensitivity is also referred as recall.
S e n s i t i v i t y = T r u e P o s i t i v e T r u e P o s i t i v e + F a l s e N e g a t i v e × 100 %
S p e c i f i c i t y = T r u e N e g a t i v e T r u e N e g a t i v e + F a l s e P o s i t i v e ×   100 %
P r e c i s i o n = T r u e P o s i t i v e T r u e P o s i t i v e + F a l s e P o s i t i v e ×   100 %
A c c u r a c y = T r u e P o s i t i v e + T r u e N e g a t i v e T r u e P o s i t i v e + F a l s e P o s i t i v e + T r u e N e g a t i v e + F a l s e N e g a t i v e ×   100 %
F 1   S c o r e = ( 2 × P r e c i s i o n × S e n s i t i v i t y P r e c i s i o n + S e n s i t i v i t y ) ×   100 %  
G   M e a n = ( S e n s i t i v i t y   × S p e c i f i c i t y ) ×   100 %
  • TruePositive denotes the number of overlapping nuclei correctly detected as overlapping nuclei.
  • TrueNegative represents the number of single nuclei correctly classified as a single nucleus.
  • FalsePositive is the number of single nuclei wrongly classified as overlapping nuclei
  • FalseNegative is the number of overlapping nuclei missed by our method.
Moreover, the proposed method is also evaluated graphically using a receiver operating characteristics (ROC) curve and area under ROC (AUROC) [39]. The ROC curve is plotted as sensitivity against (1-specificity).

4. Experiment Results and Discussions

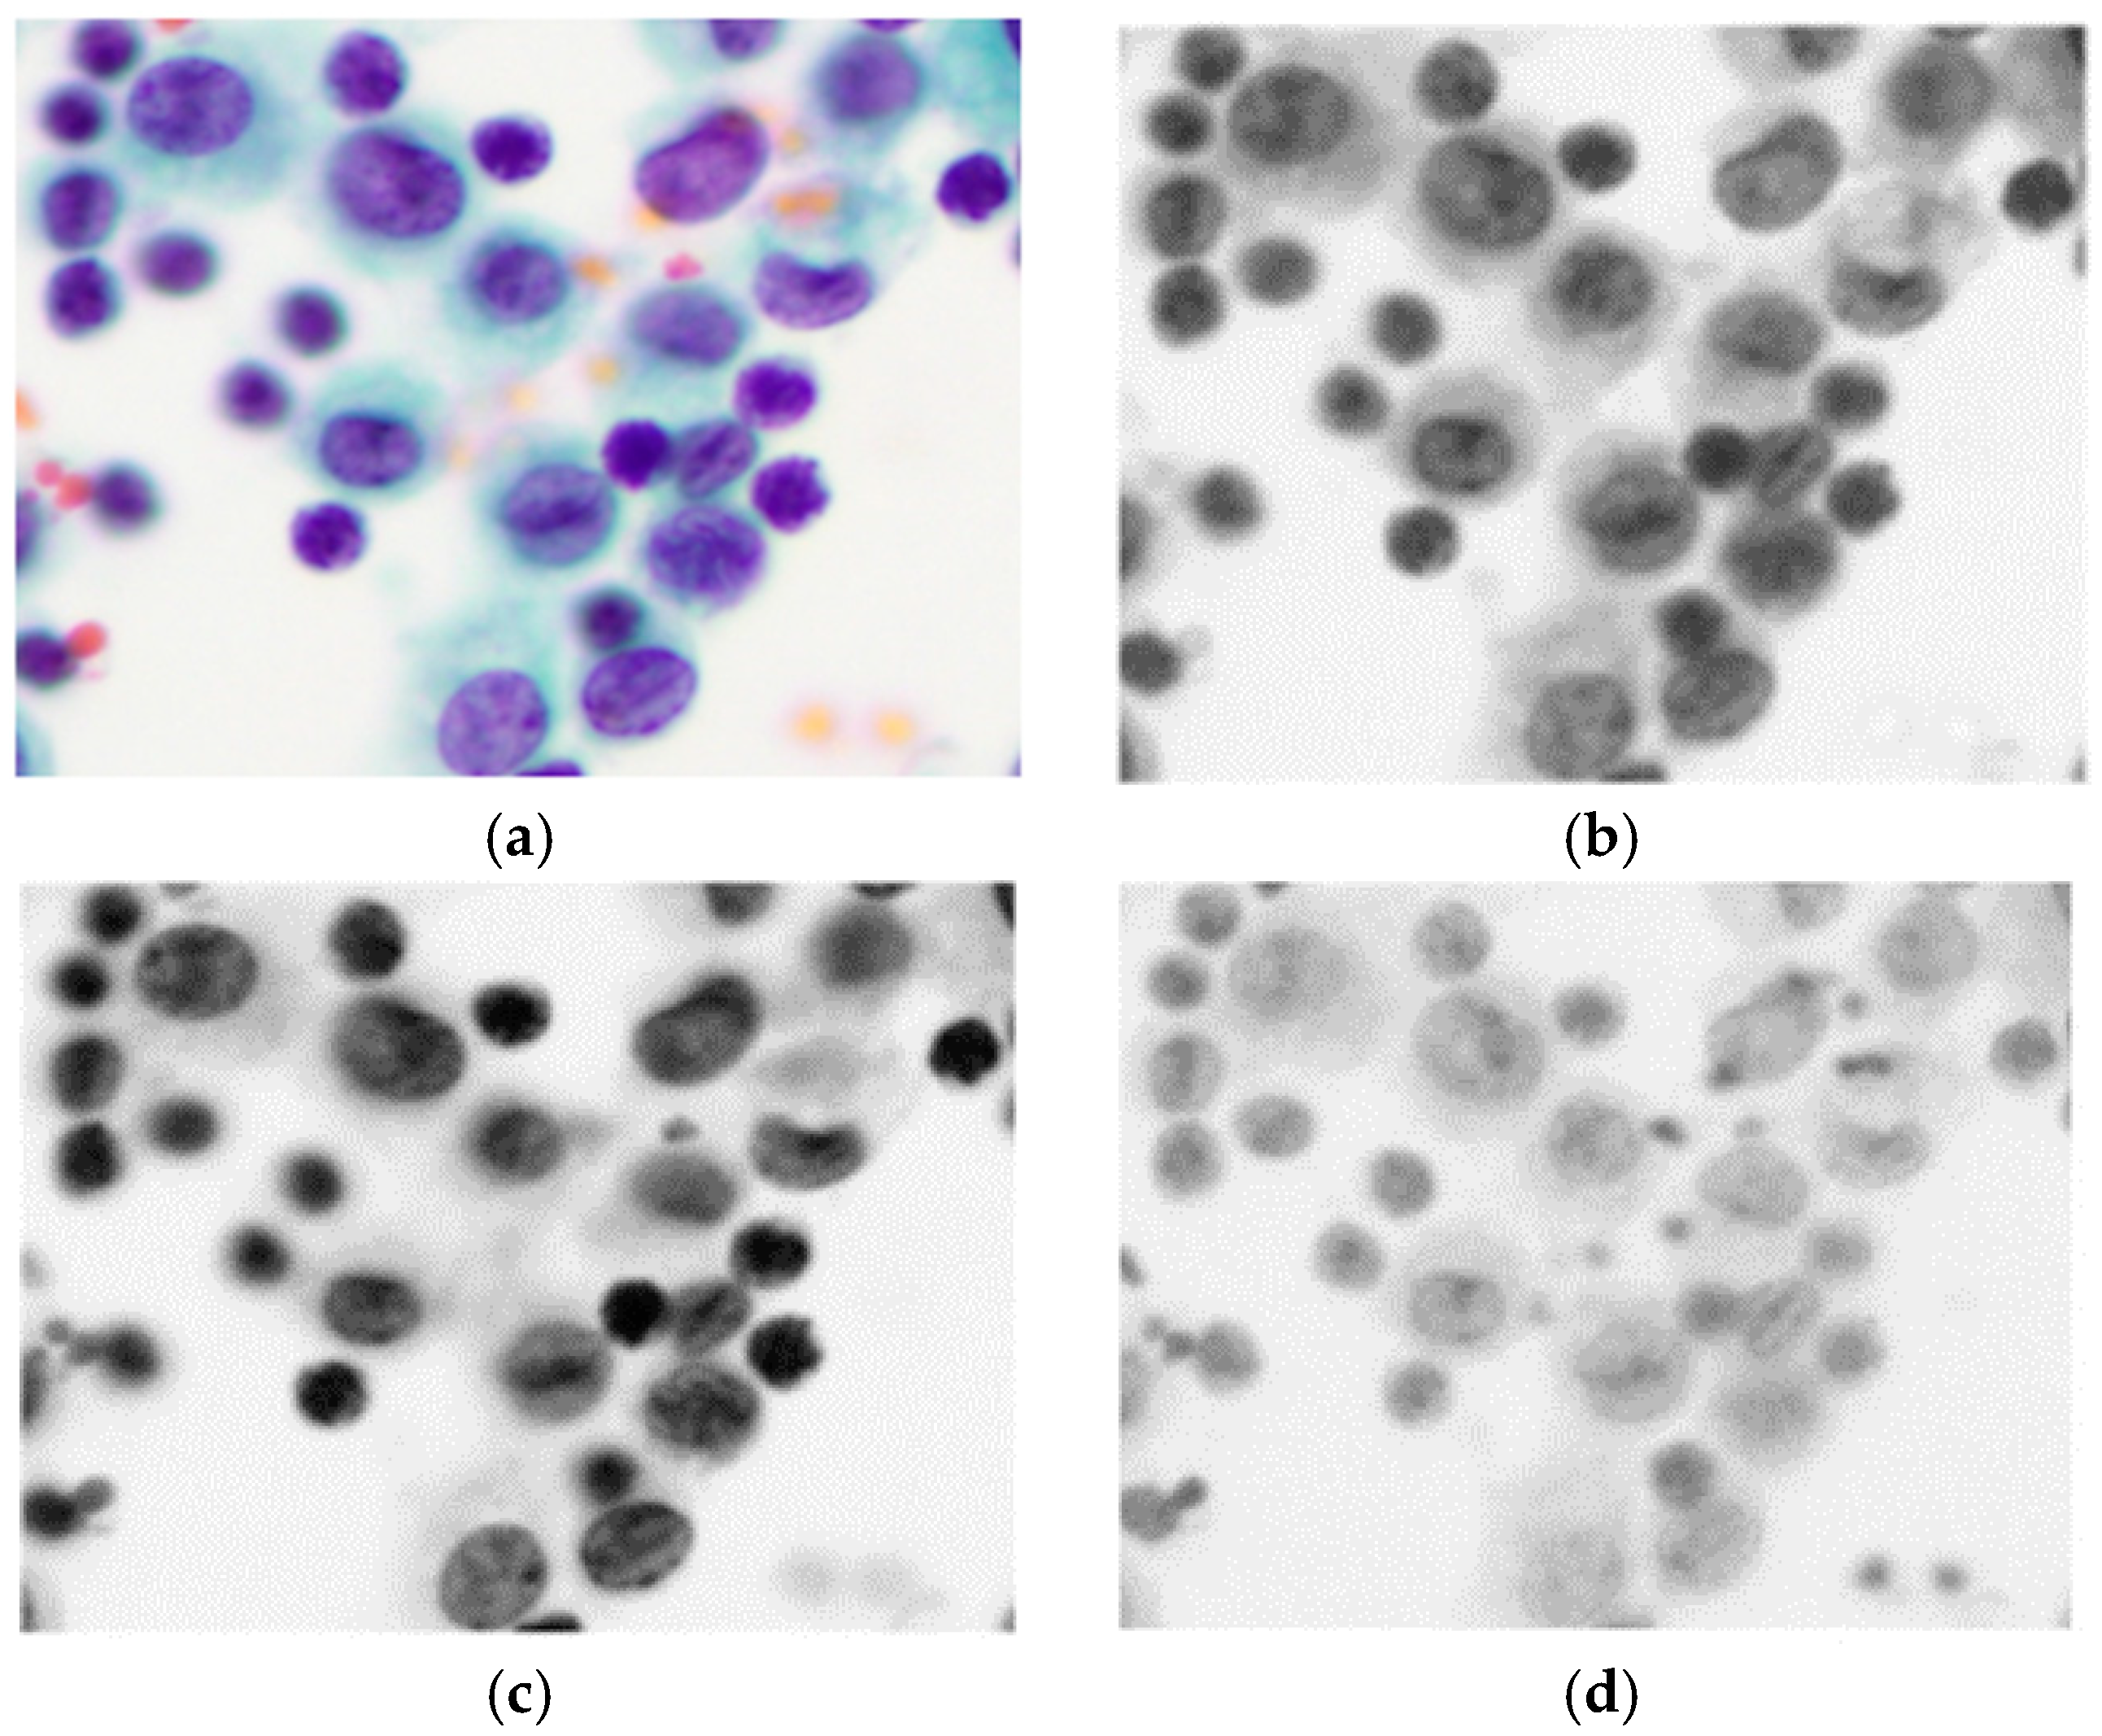
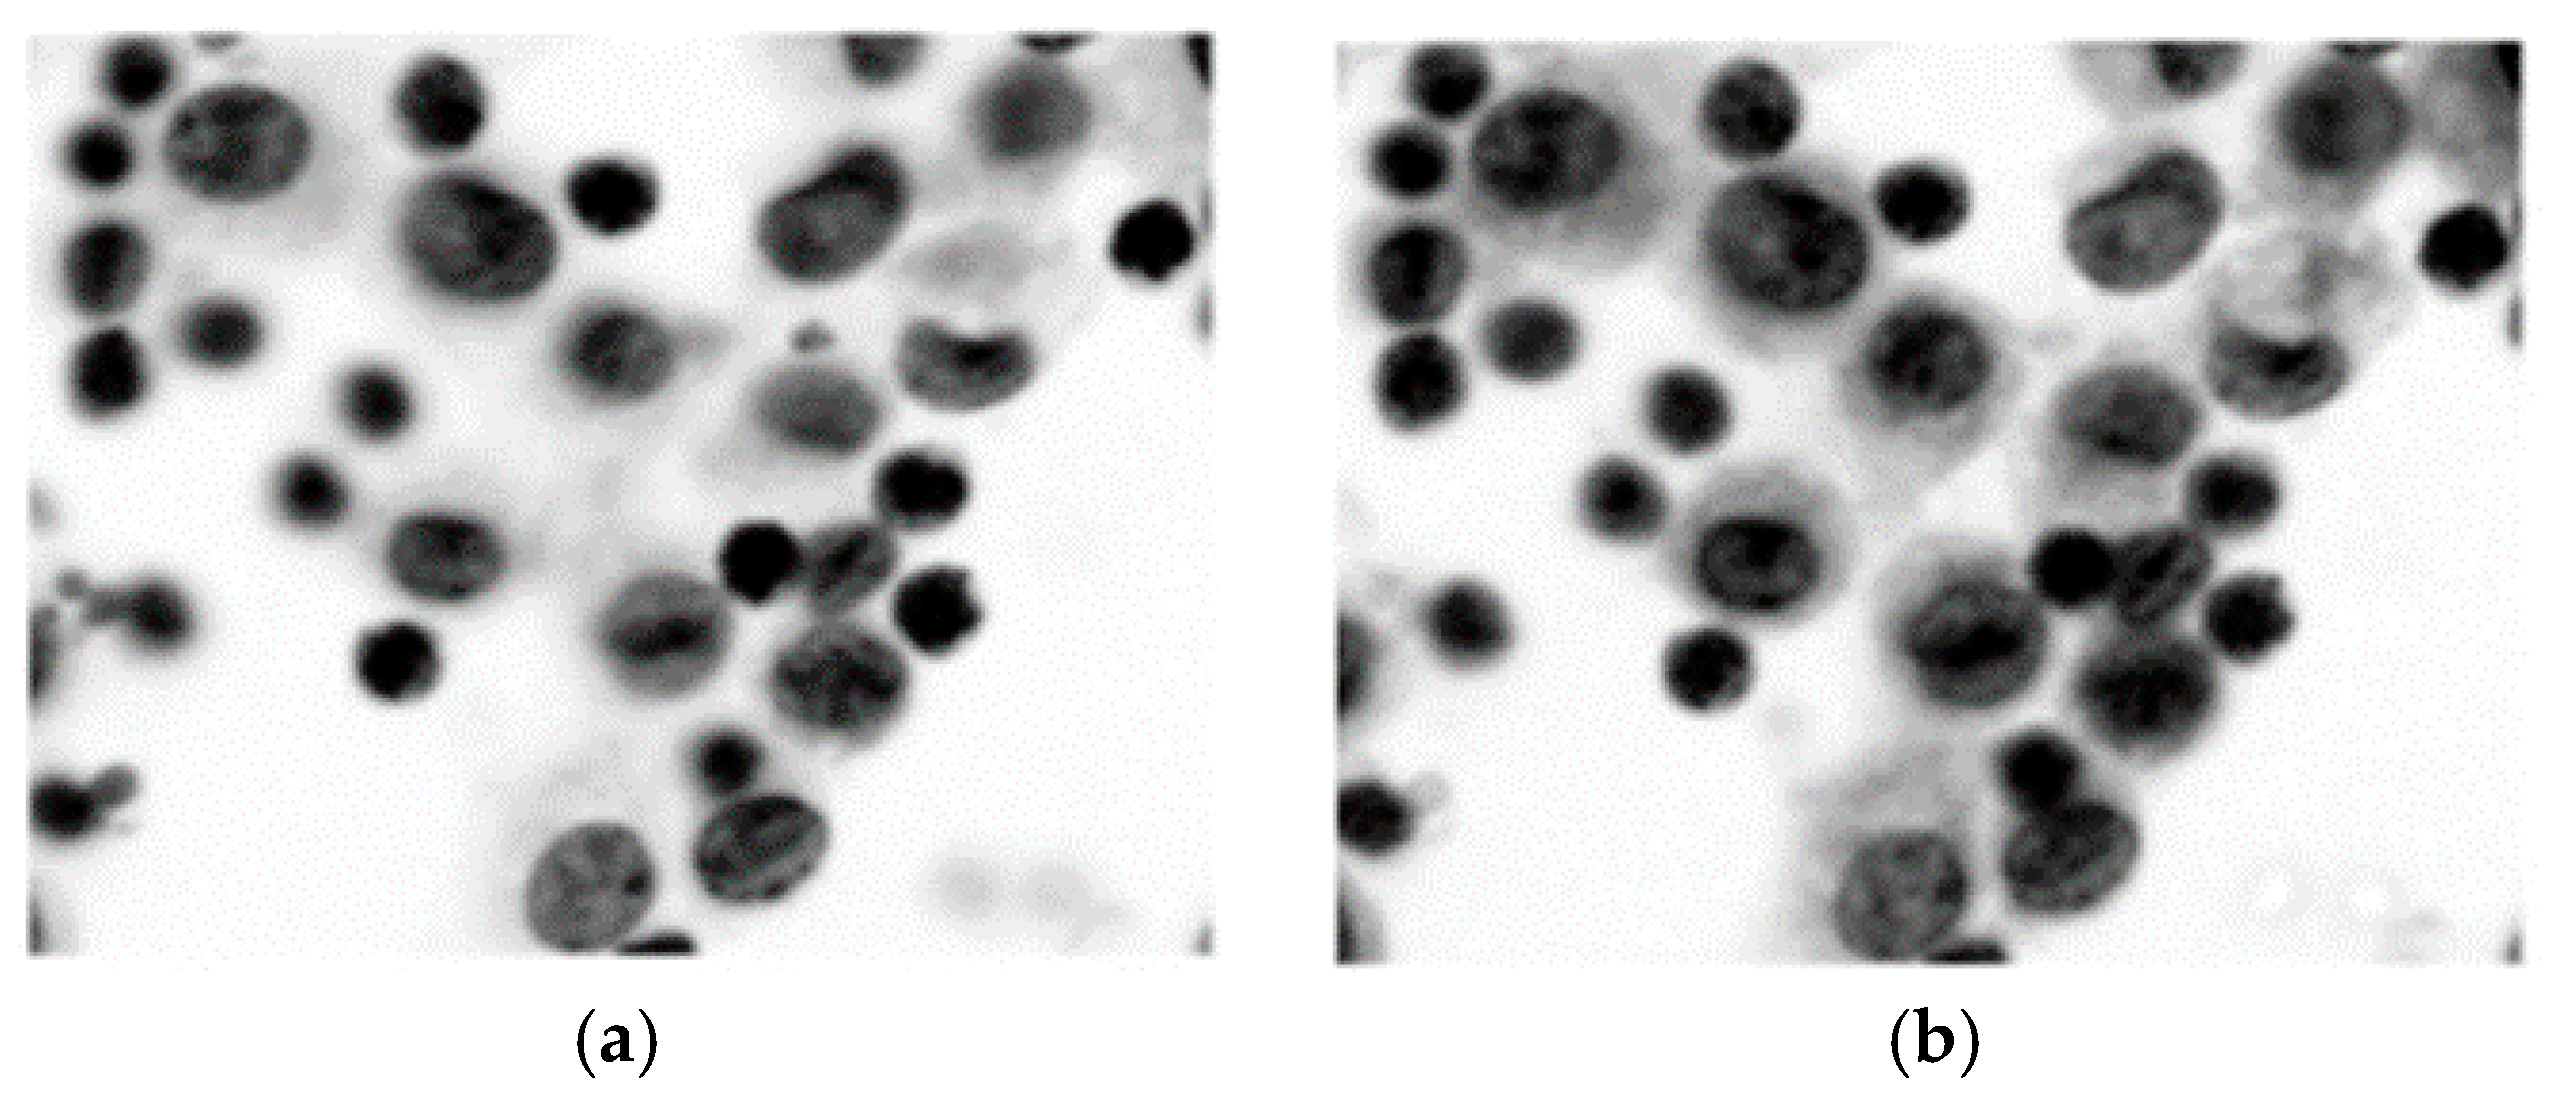
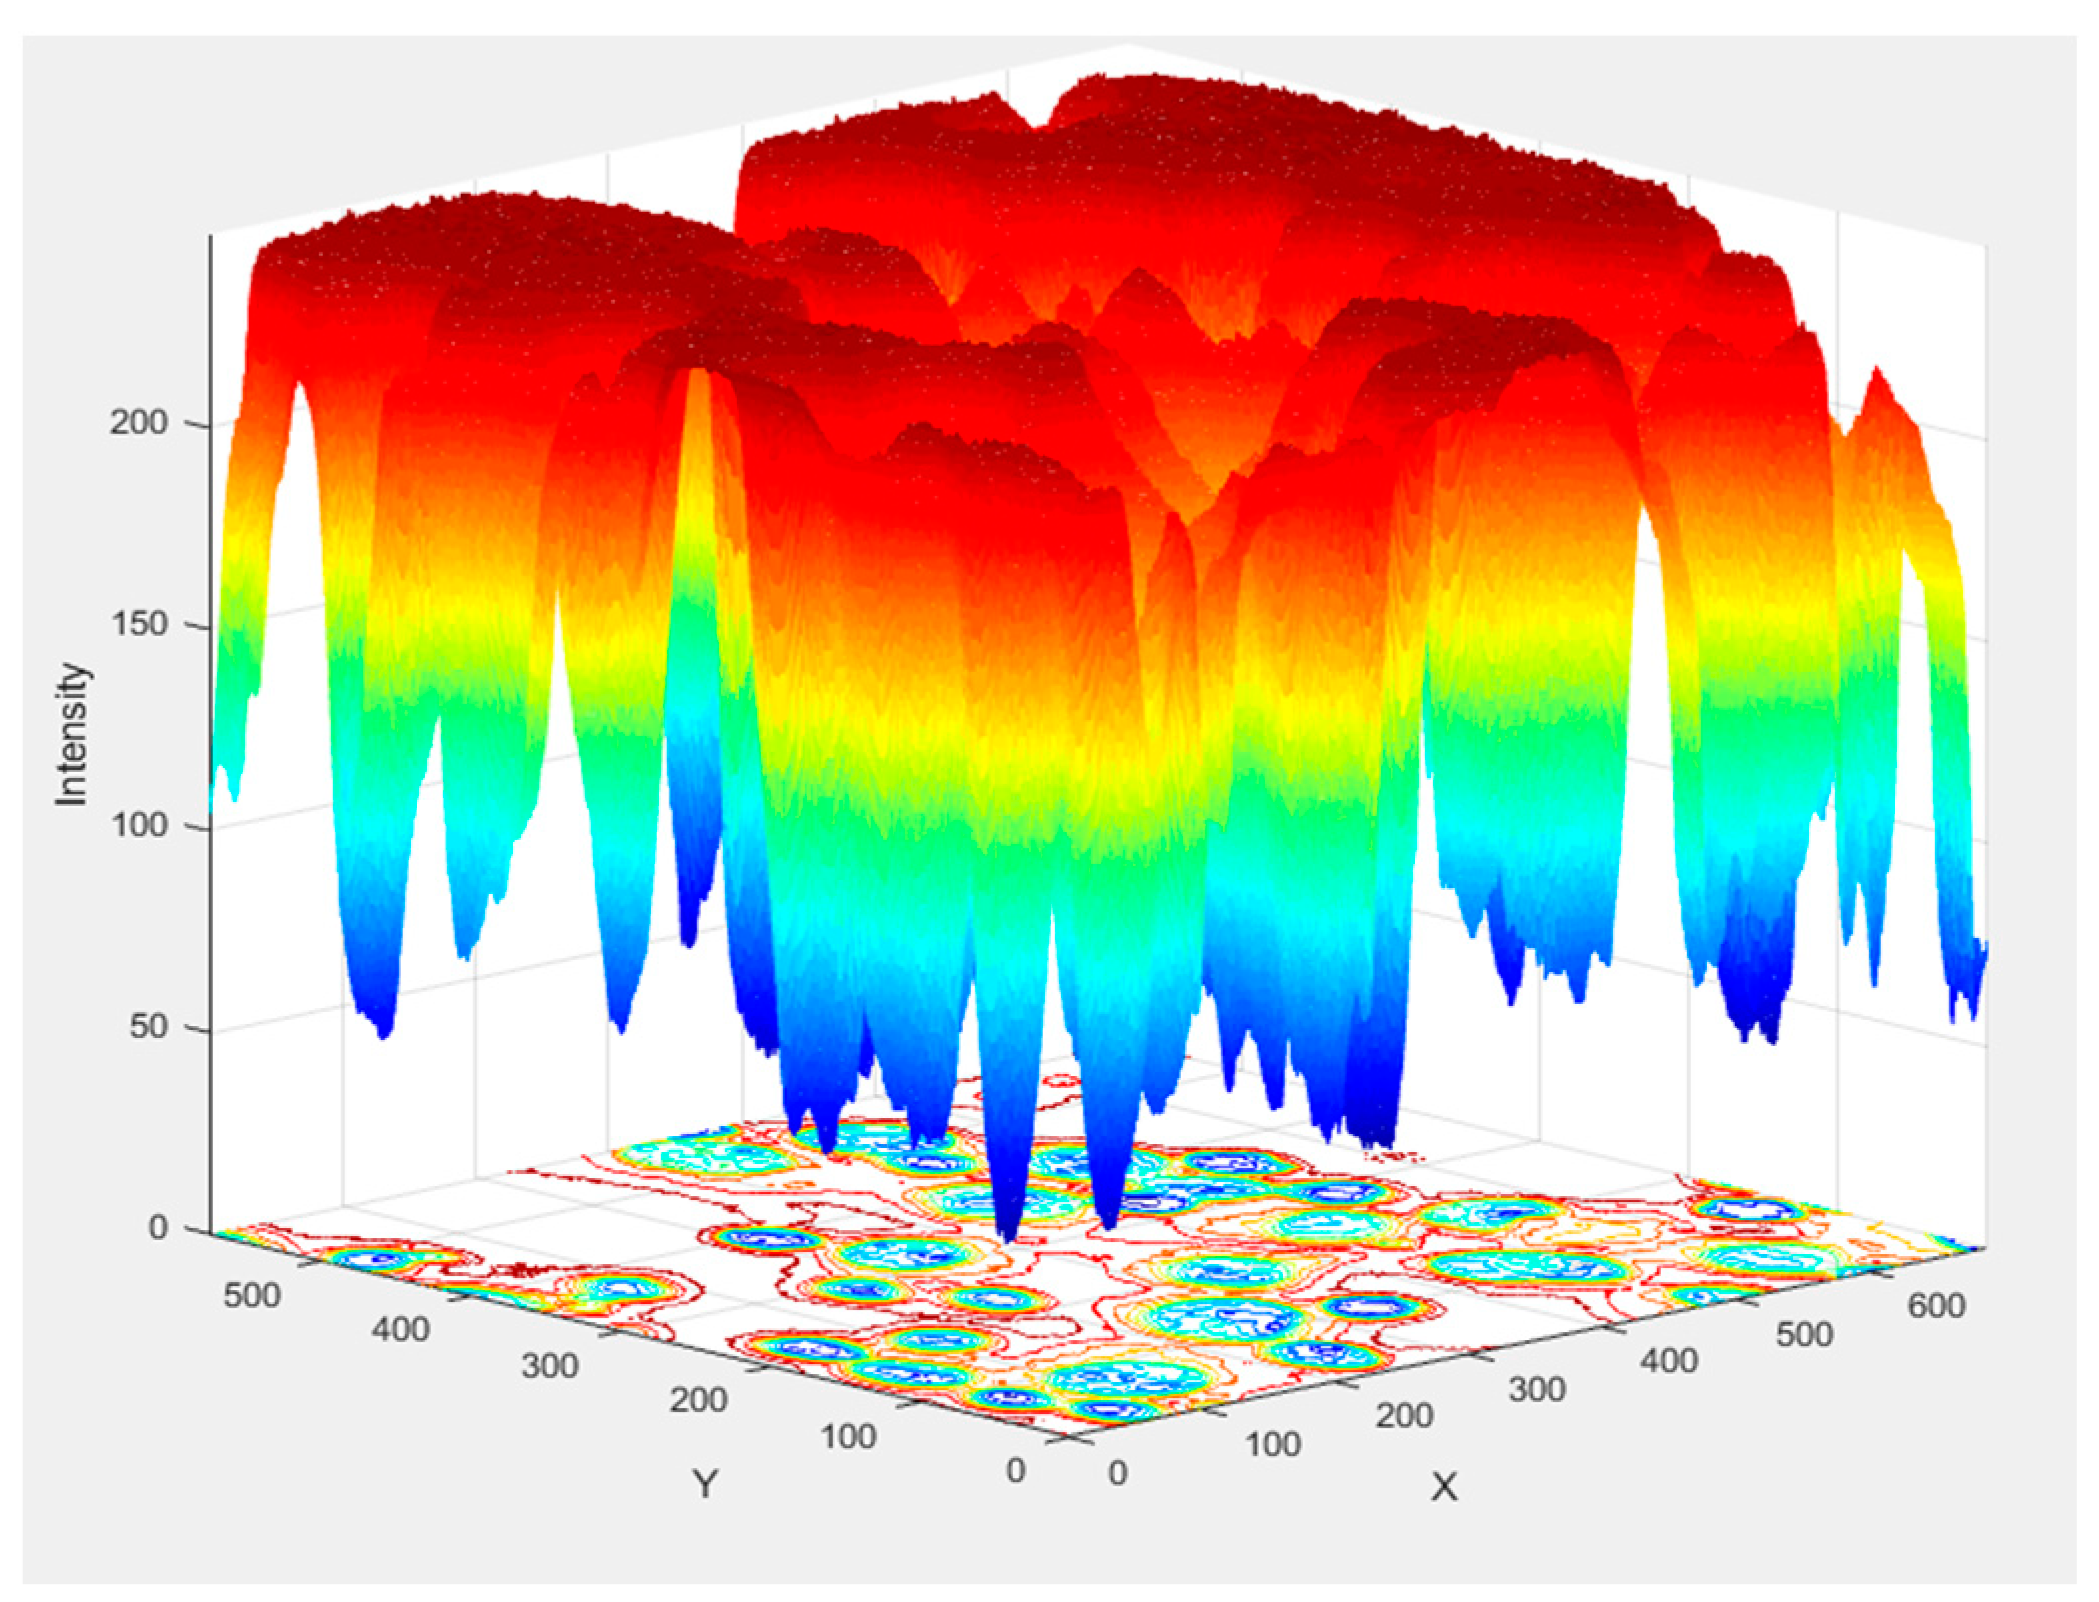
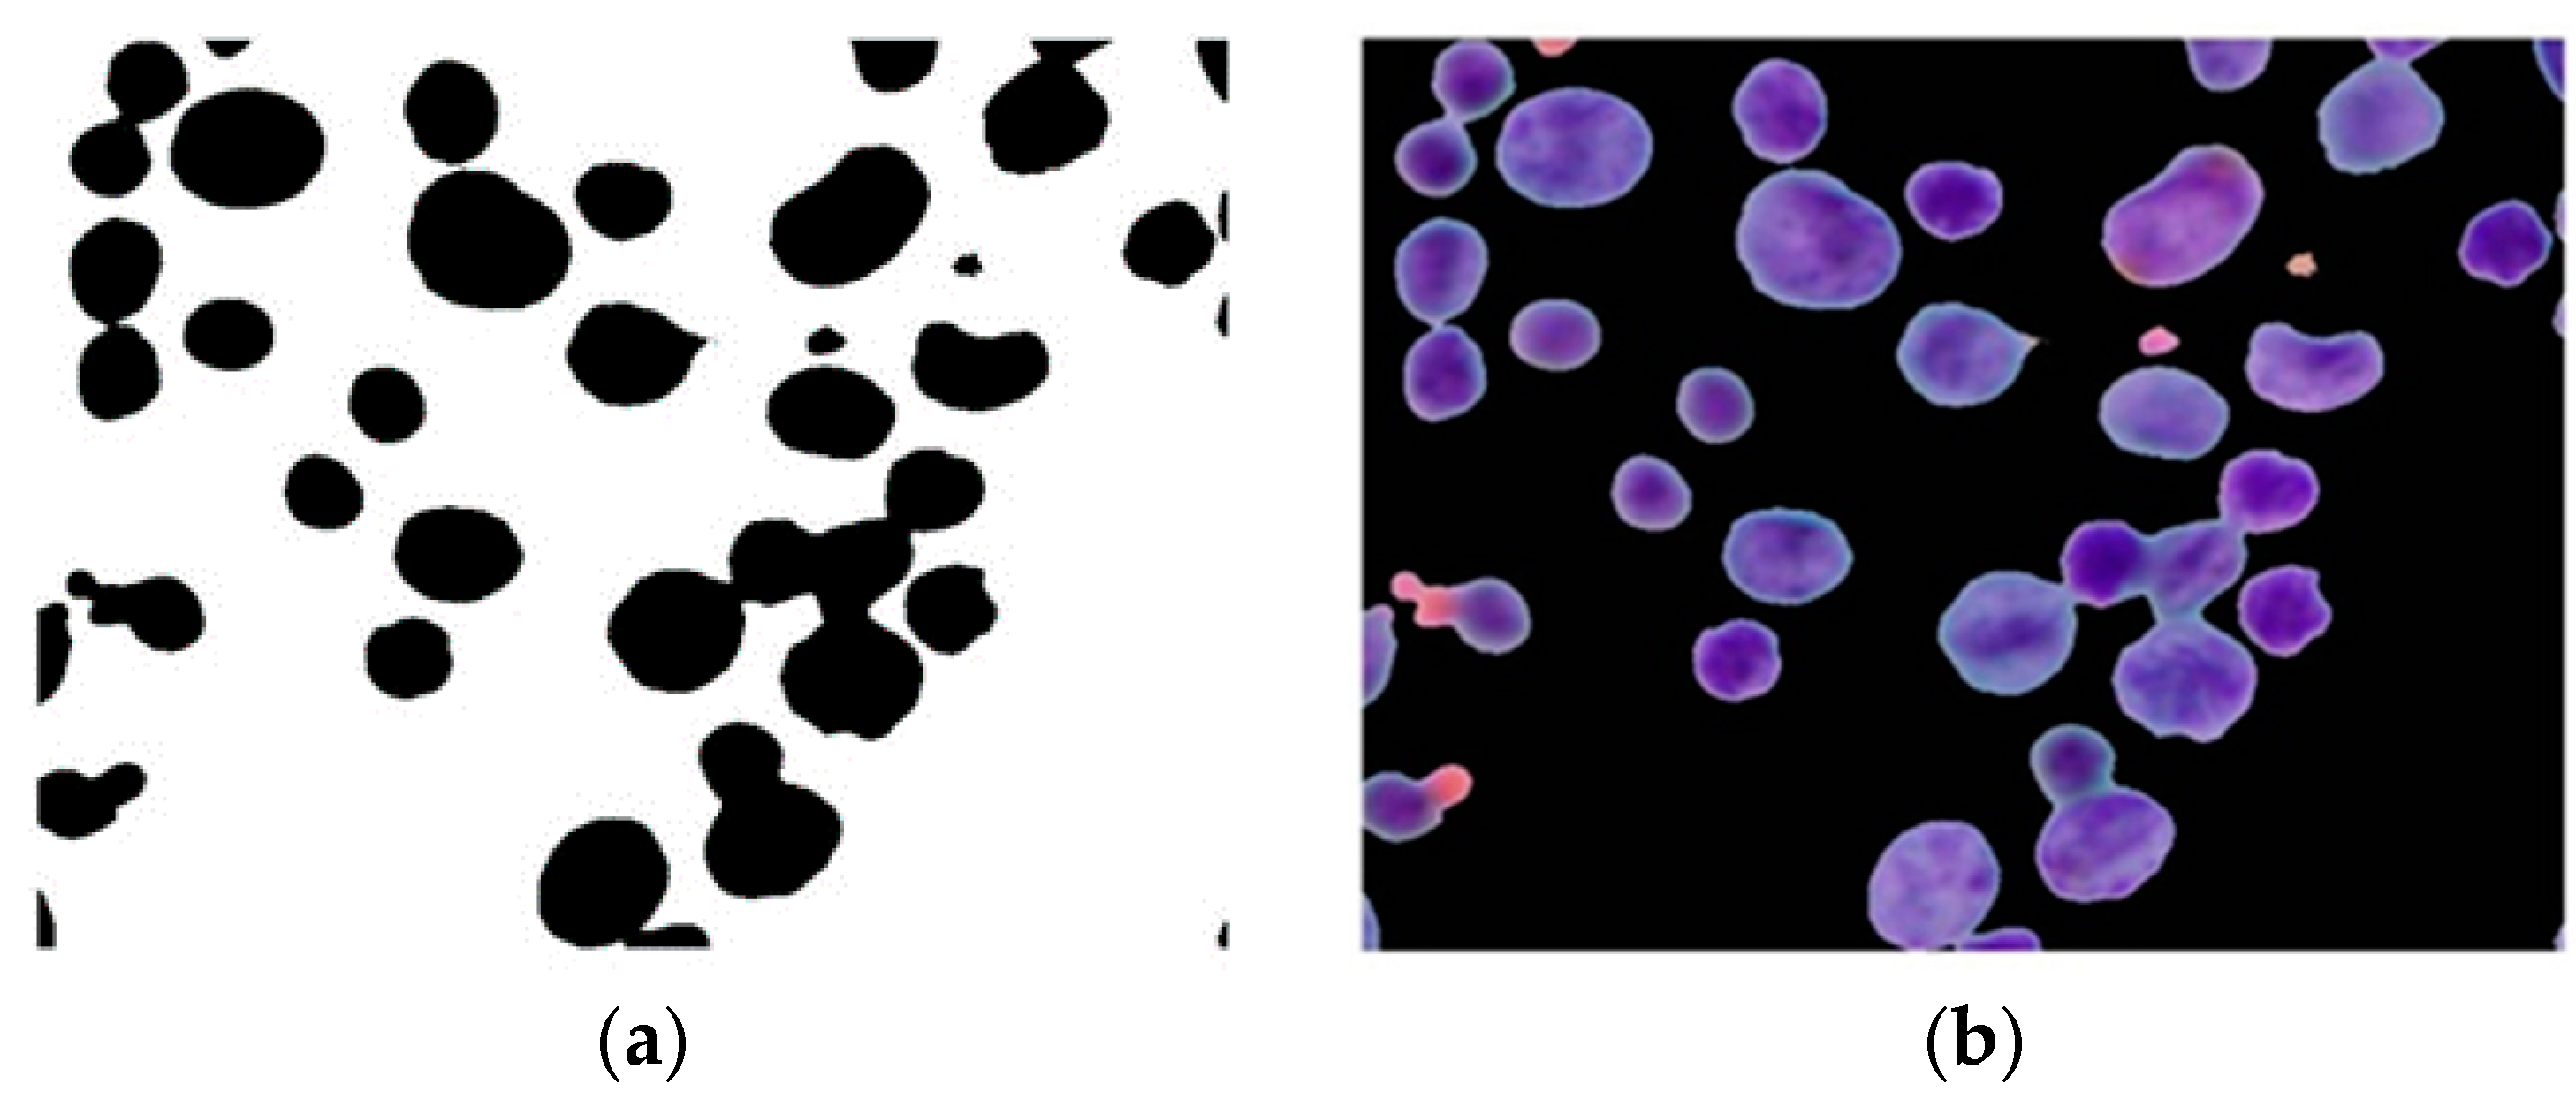
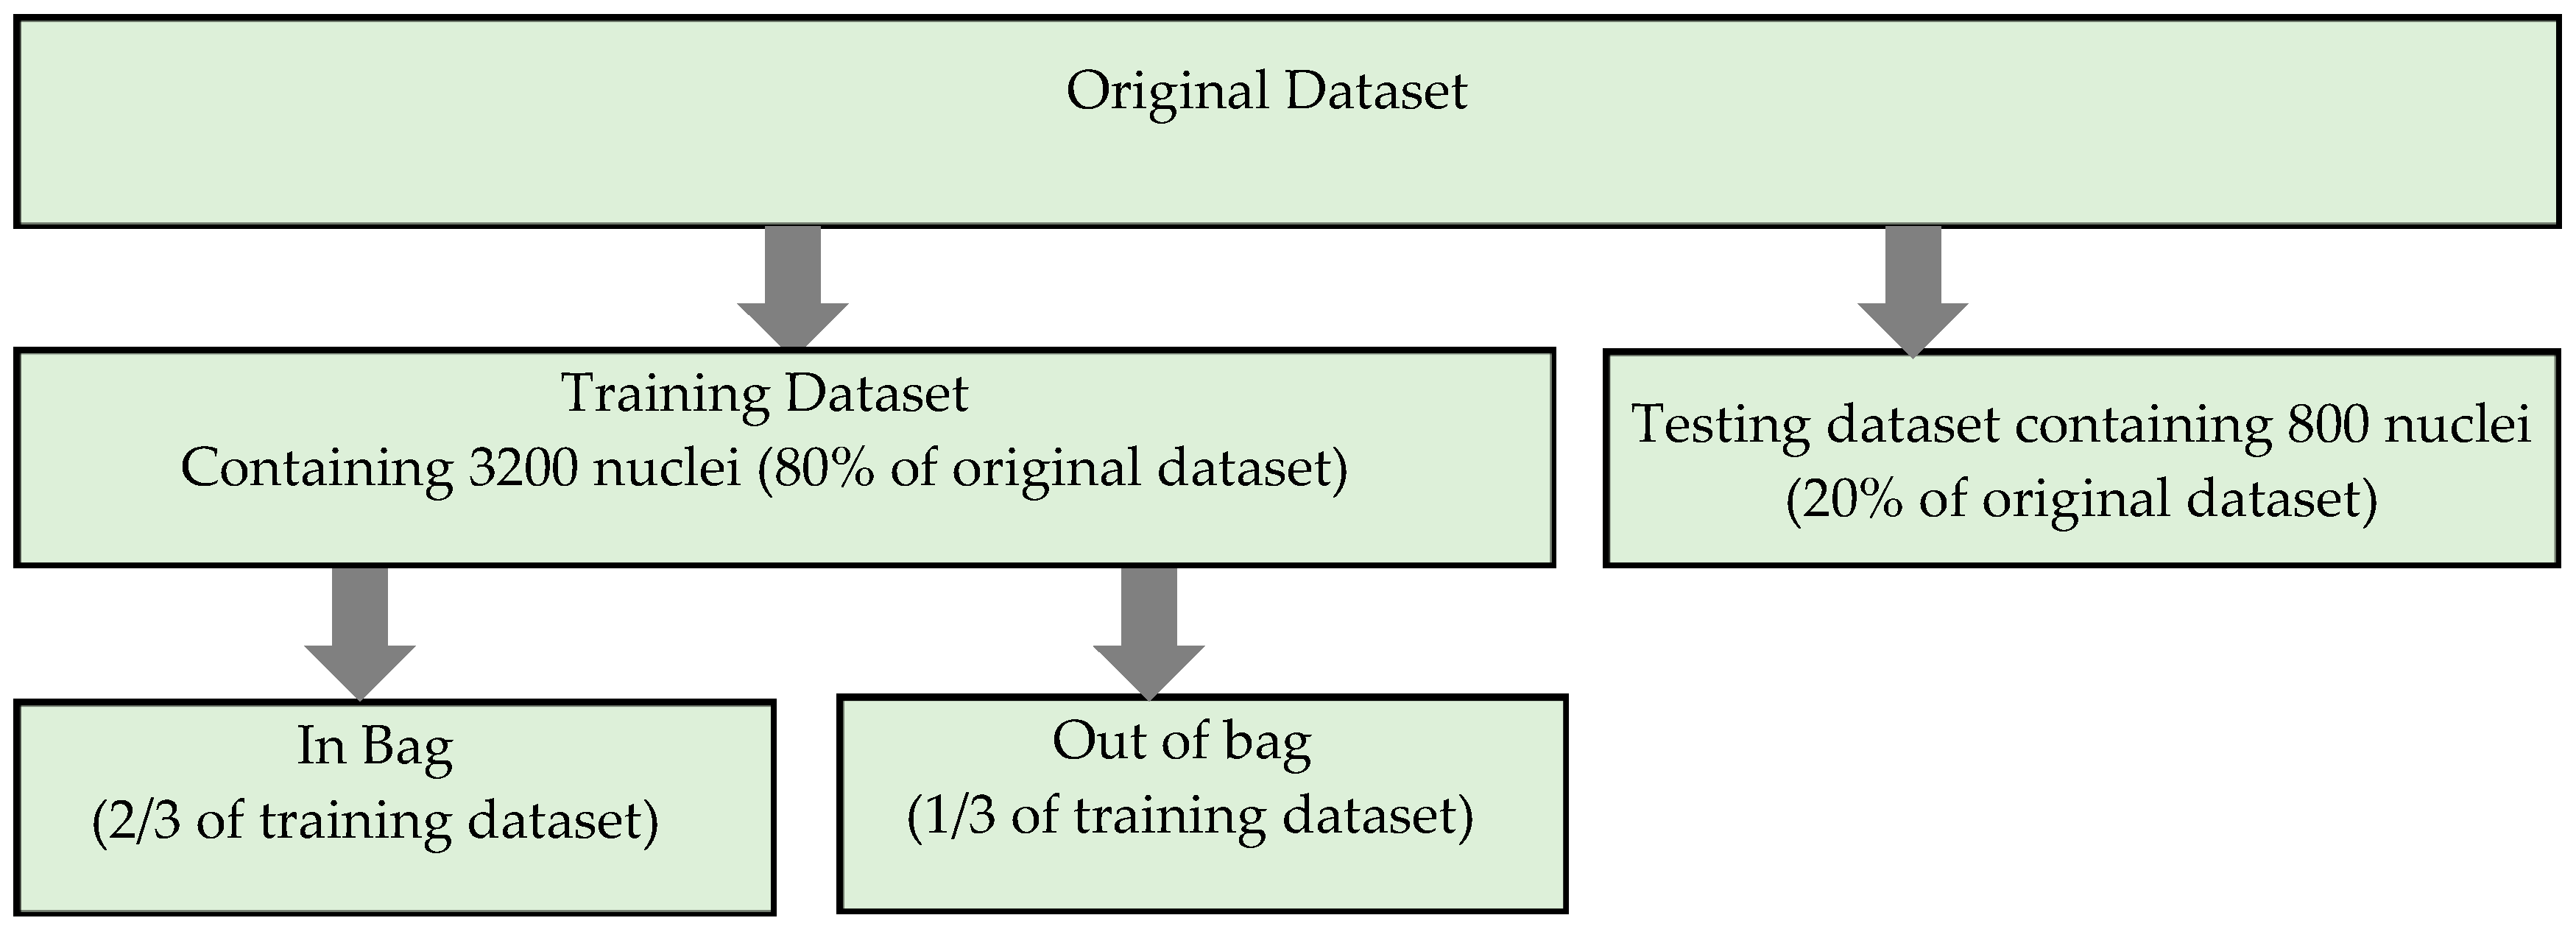
In our study, the experiments were carried out in a MATLAB_R2016b environment using an Intel(R) Core (TM) i7 CPU 3.40–3.70 GHz personal computer and Microsoft Windows 7, 64-bit operating system. The study is based on a local dataset containing 124 CPE images. The main contribution of the study is the development of an effective algorithm that can accurately determine the presence of overlapping nuclei in CPE images. The first step of the proposed algorithm was to deal with image quality. Histogram stretching and CLAHE image enhancement methods were utilized in order to enhance the contrast of cell nuclei. Then, maximum entropy thresholding based nuclei segmentation was employed to extract candidate nuclei regions from surrounding objects in the image. The segmentation performance of maximum entropy based nuclei segmentation was evaluated in the test images and yielded a 92% detection accuracy. After the nuclei were detected, an overlapping nuclei detection scheme was developed. A new combination of 16 geometrical and 10 textural features was extracted from 4000 nuclei containing single and overlapping nuclei. Thus, our dataset is made up of 4000 × 26-dimensional datasets. It is partitioned into training and testing sets in an 80/20 ratio, as given in Table 4.
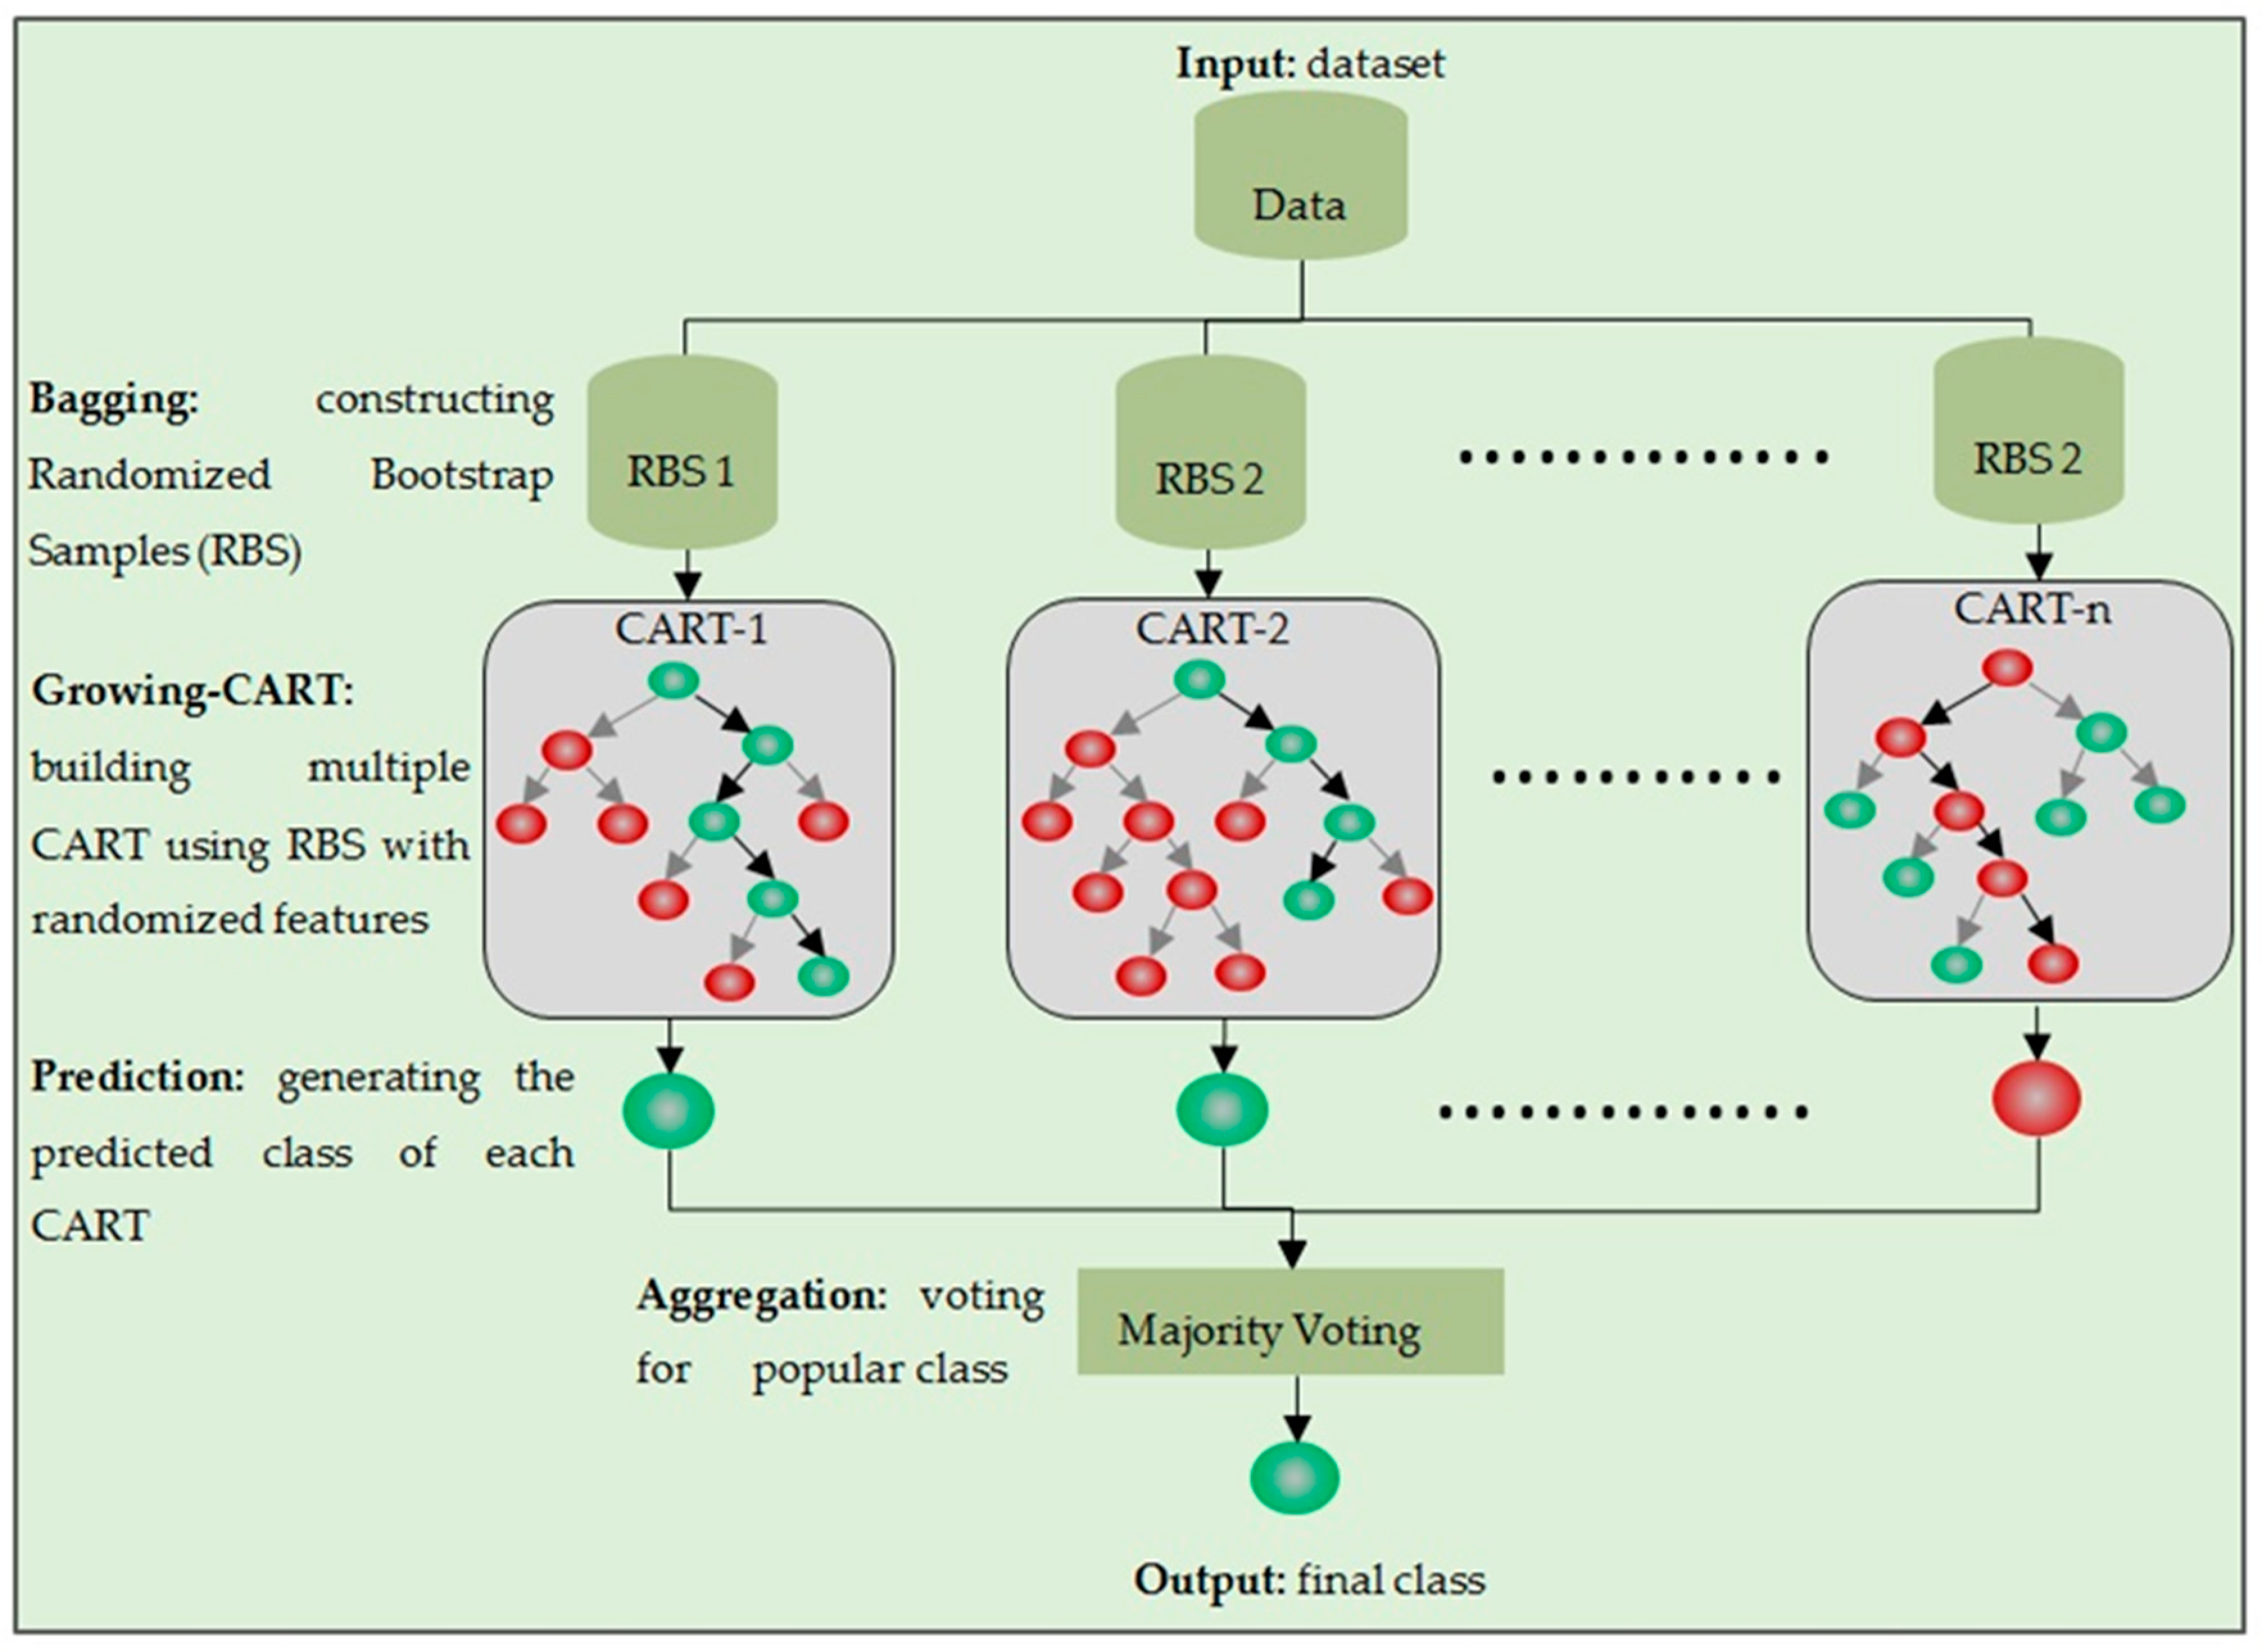
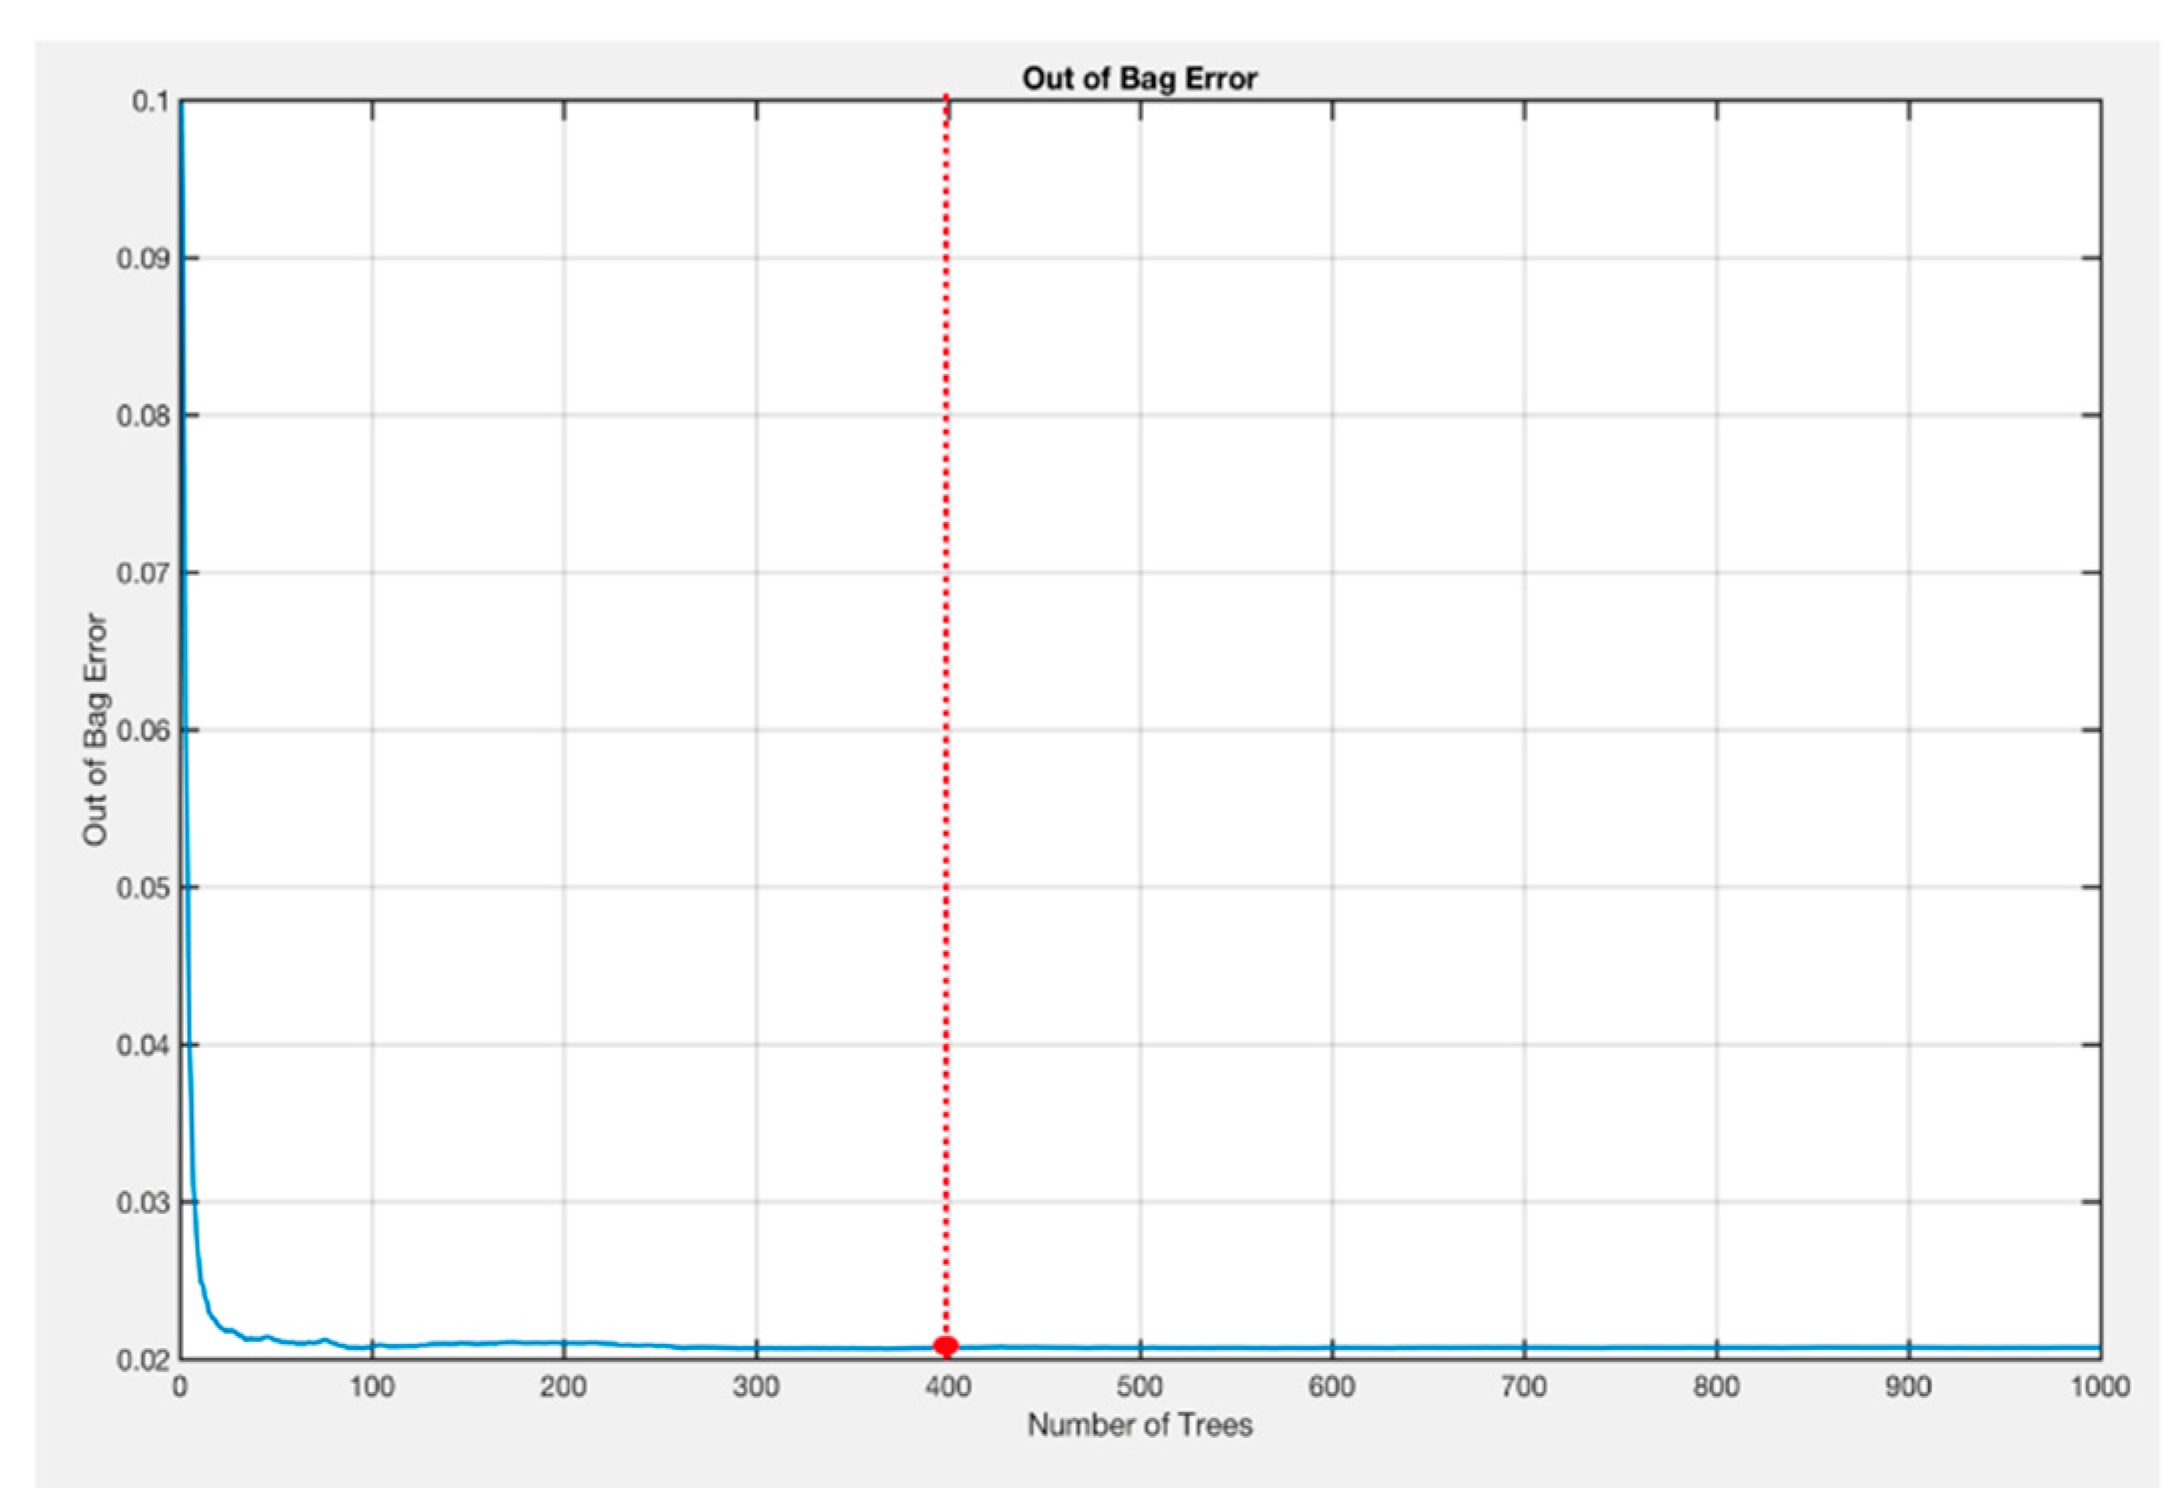
Then, double-strategy RF was utilized to select the most important features and classify single and overlapping nuclei using selected high-ranking features. One of the important parameters that we needed to adjust while constructing RF was the number of decision trees to be grown. The optimal number of decision trees was obtained through empirical tuning. OBB errors using a different number of decision trees are illustrated in Figure 13. From the graph, it can be seen that OOB errors decrease at above 250 decision trees, and start to stabilize from 300 trees. Thus, we grew 400 decision trees in order to maintain classification stability and keep the computation cost low.
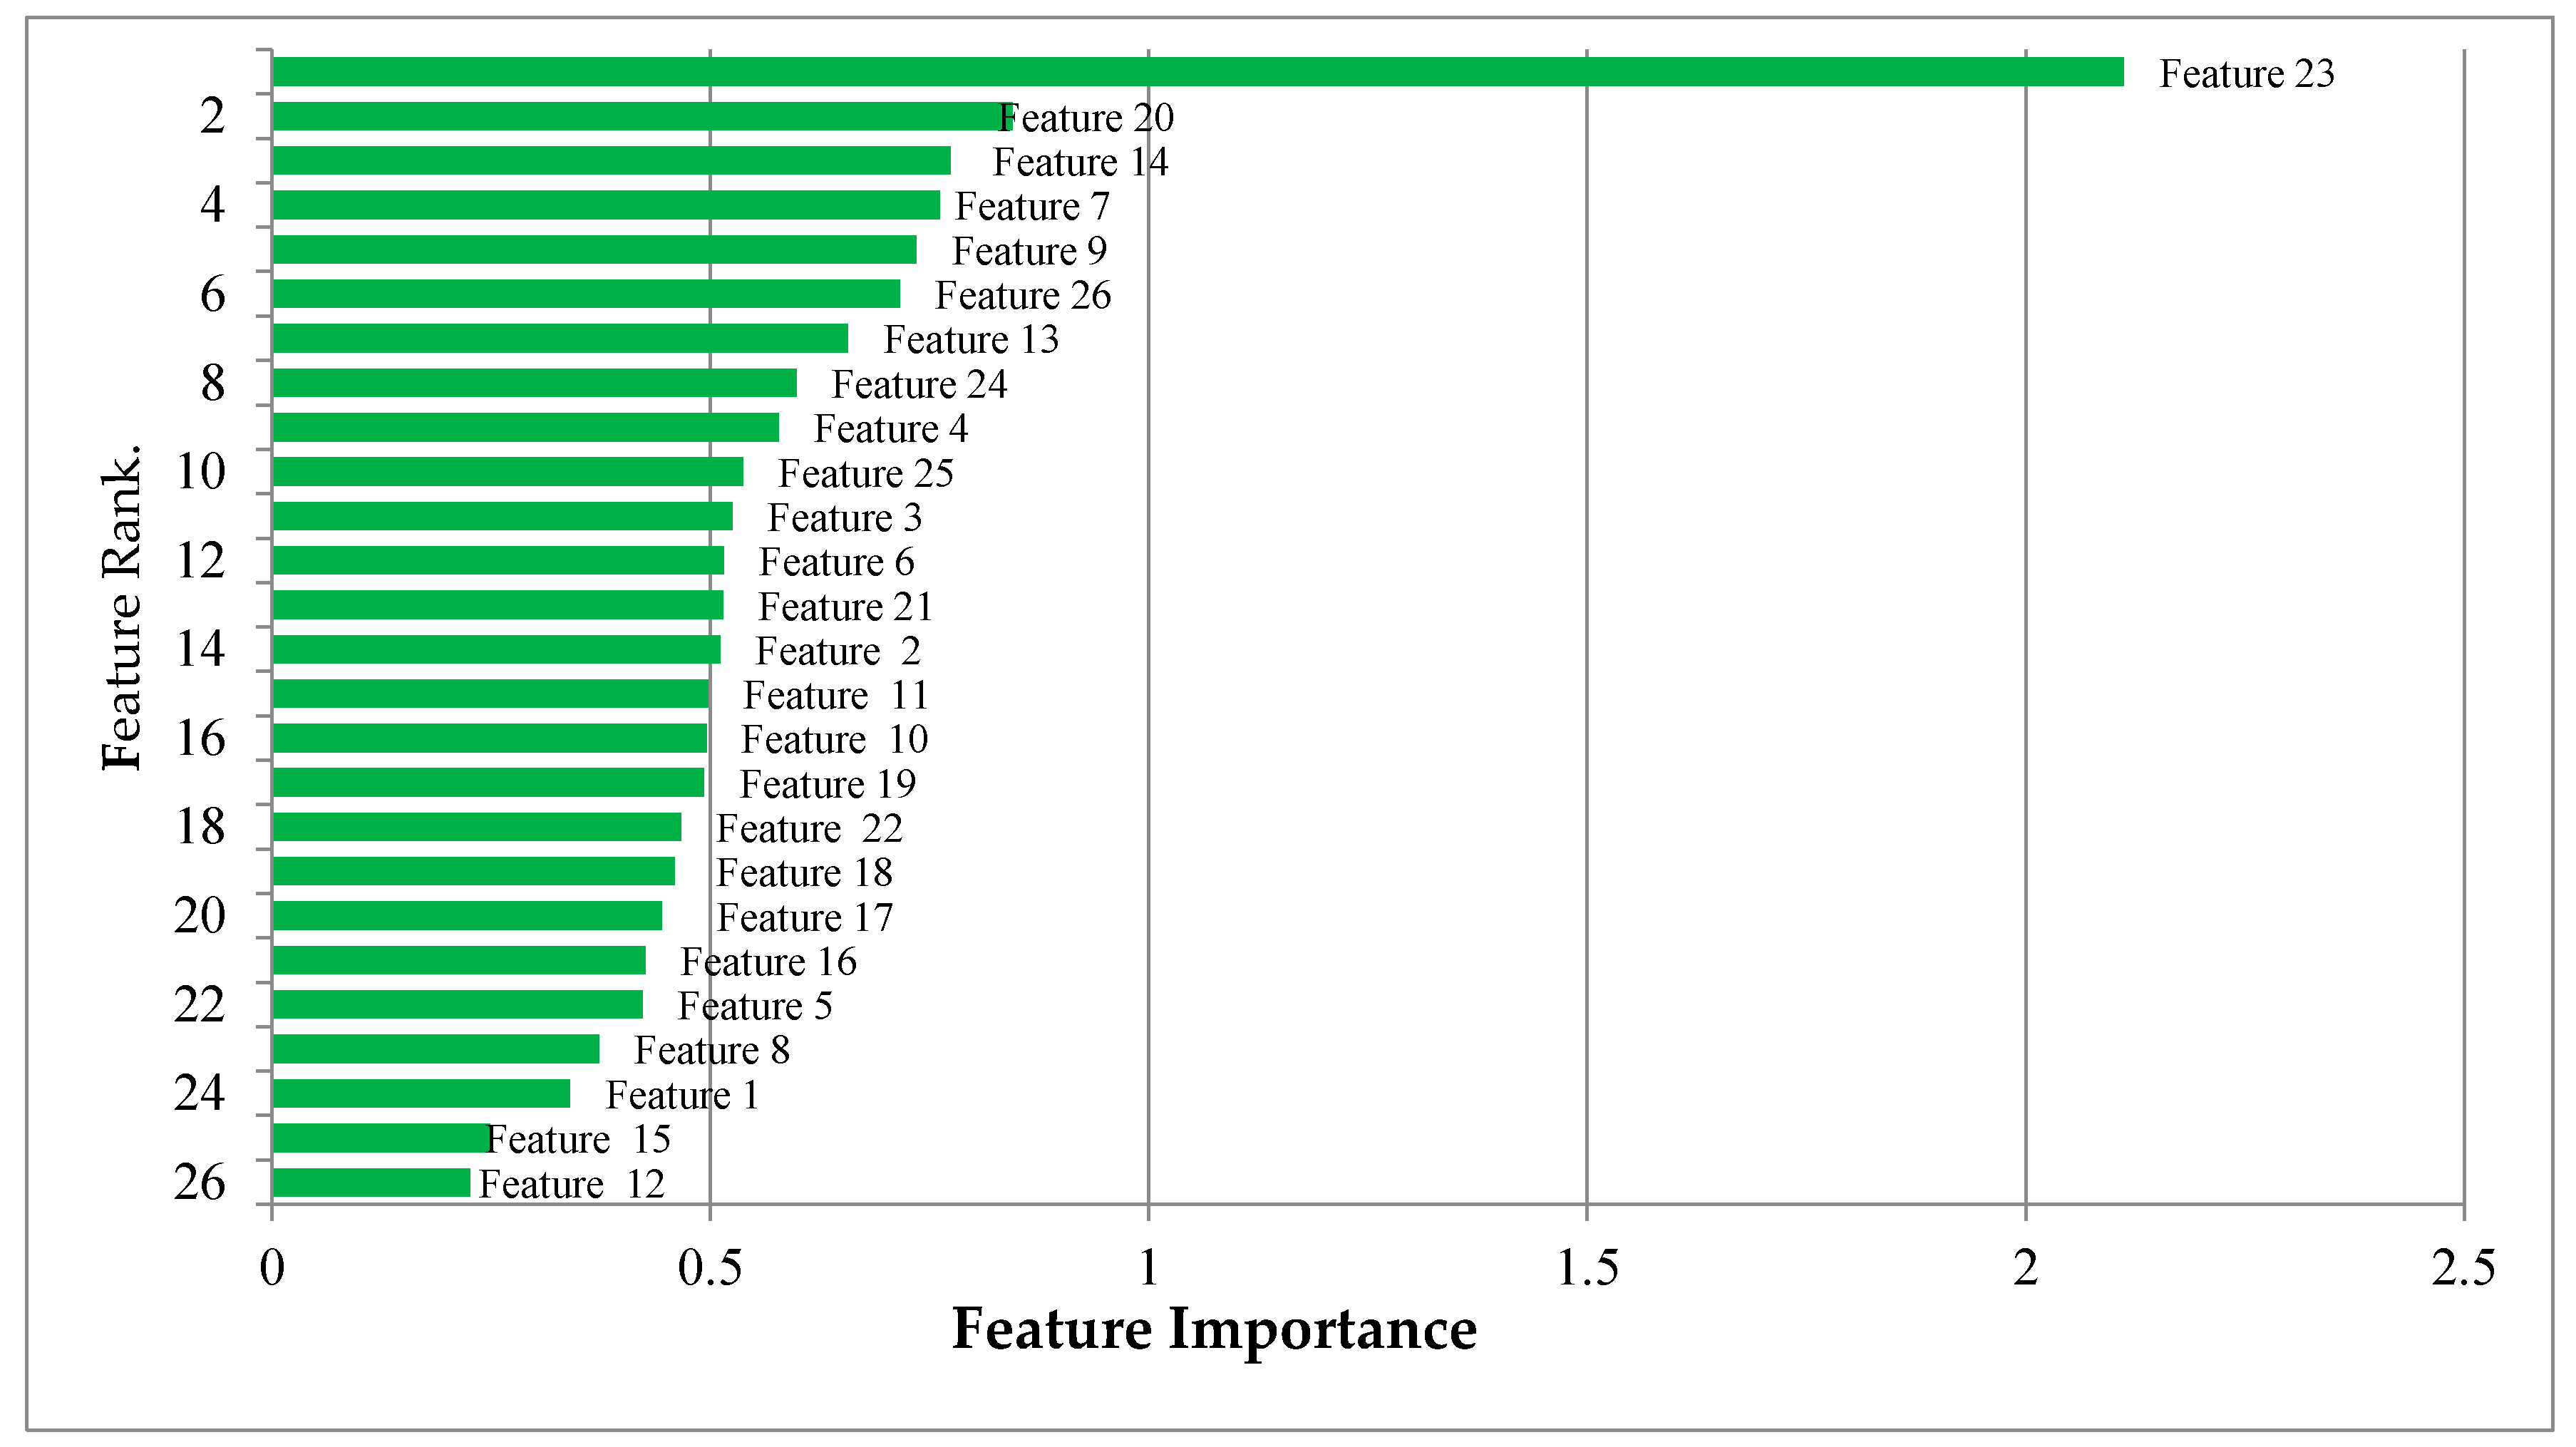
Once a random forest was constructed with 400 decision trees, feature selection was performed by scoring OOB permutation errors using each feature. The importance of features ranked by RF is given in 
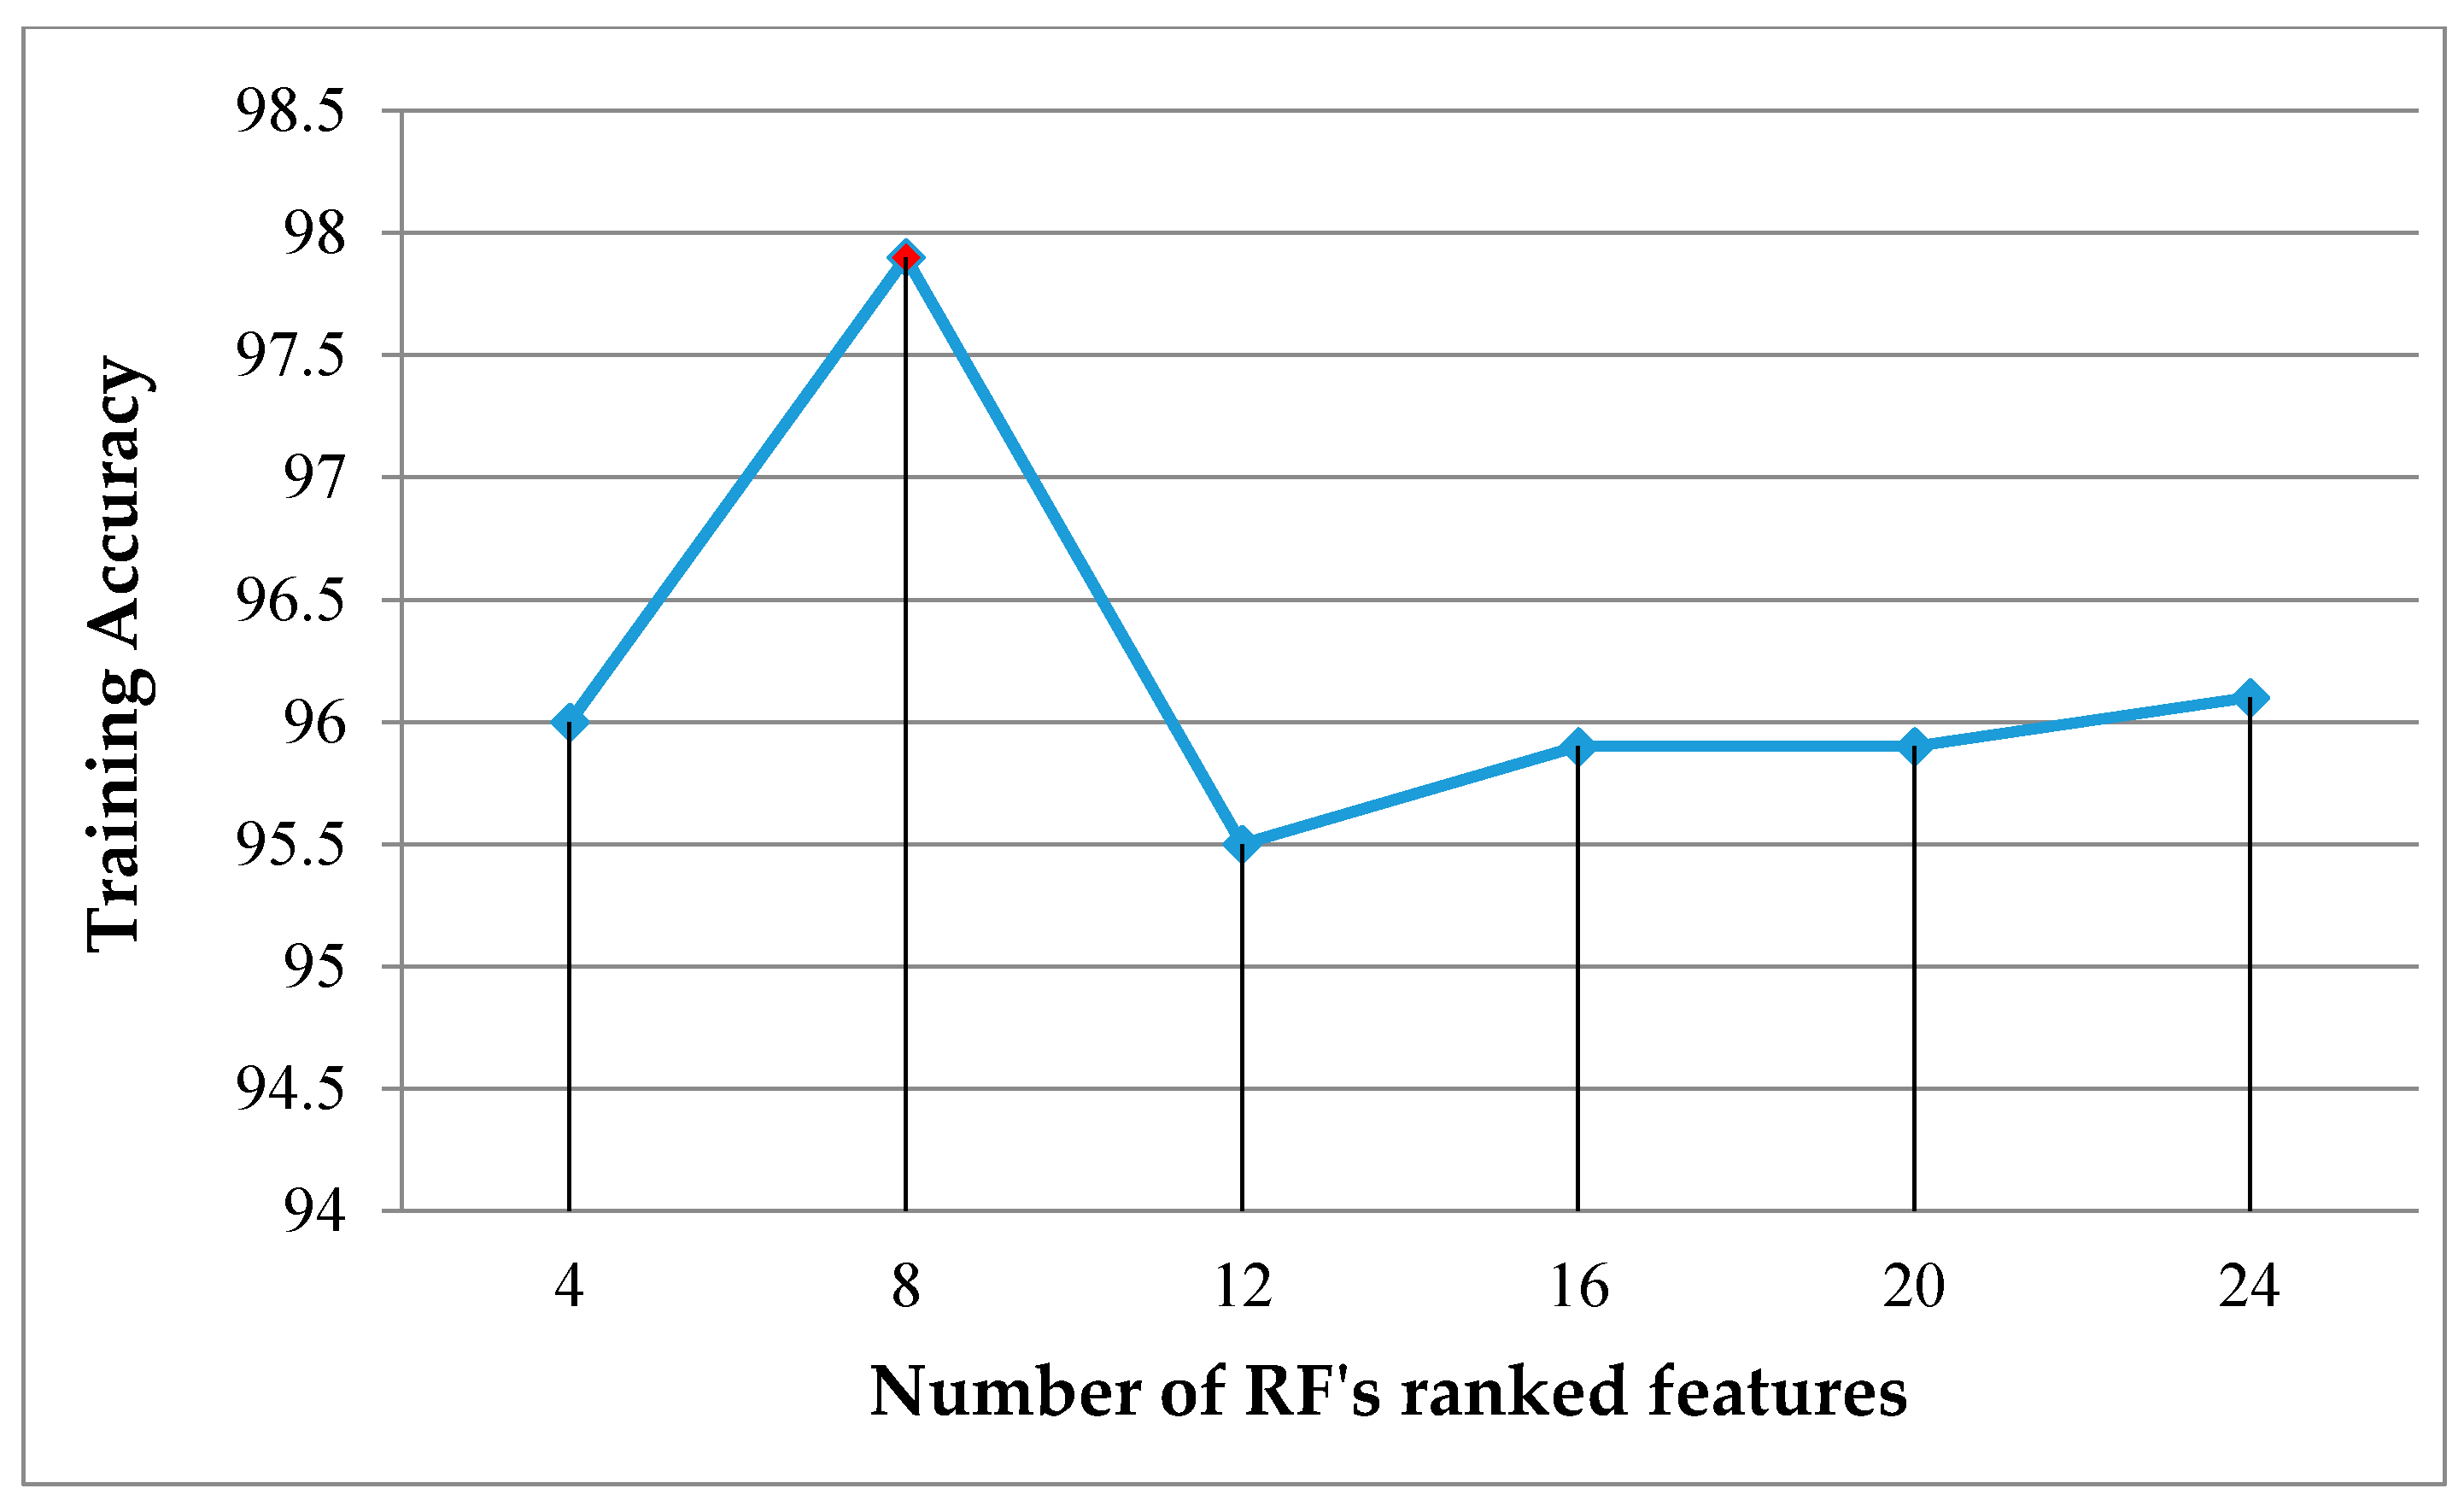
Figure 14. To select the most significant features, we experimentally tested the different feature numbers in ascending rank order and examined their training accuracy as given in Figure 15. The chart shows that the first eight ranked features achieved the highest training accuracy, and those features are described in Table 5. We fed those selected features as input to train the RF ensemble classifier. The trained RF classifier was used to validate the testing dataset. The classification accuracy of using RF’s selected features was compared to the accuracy of using all features. In addition, we also examined four alternative classifiers: NB [40], SVM [41], KNN [42], and DT [43] by coupling with all features and RF’s selected features. The classification accuracies of using all features and RF selected features blending with five classifiers are presented in Table 6 and 
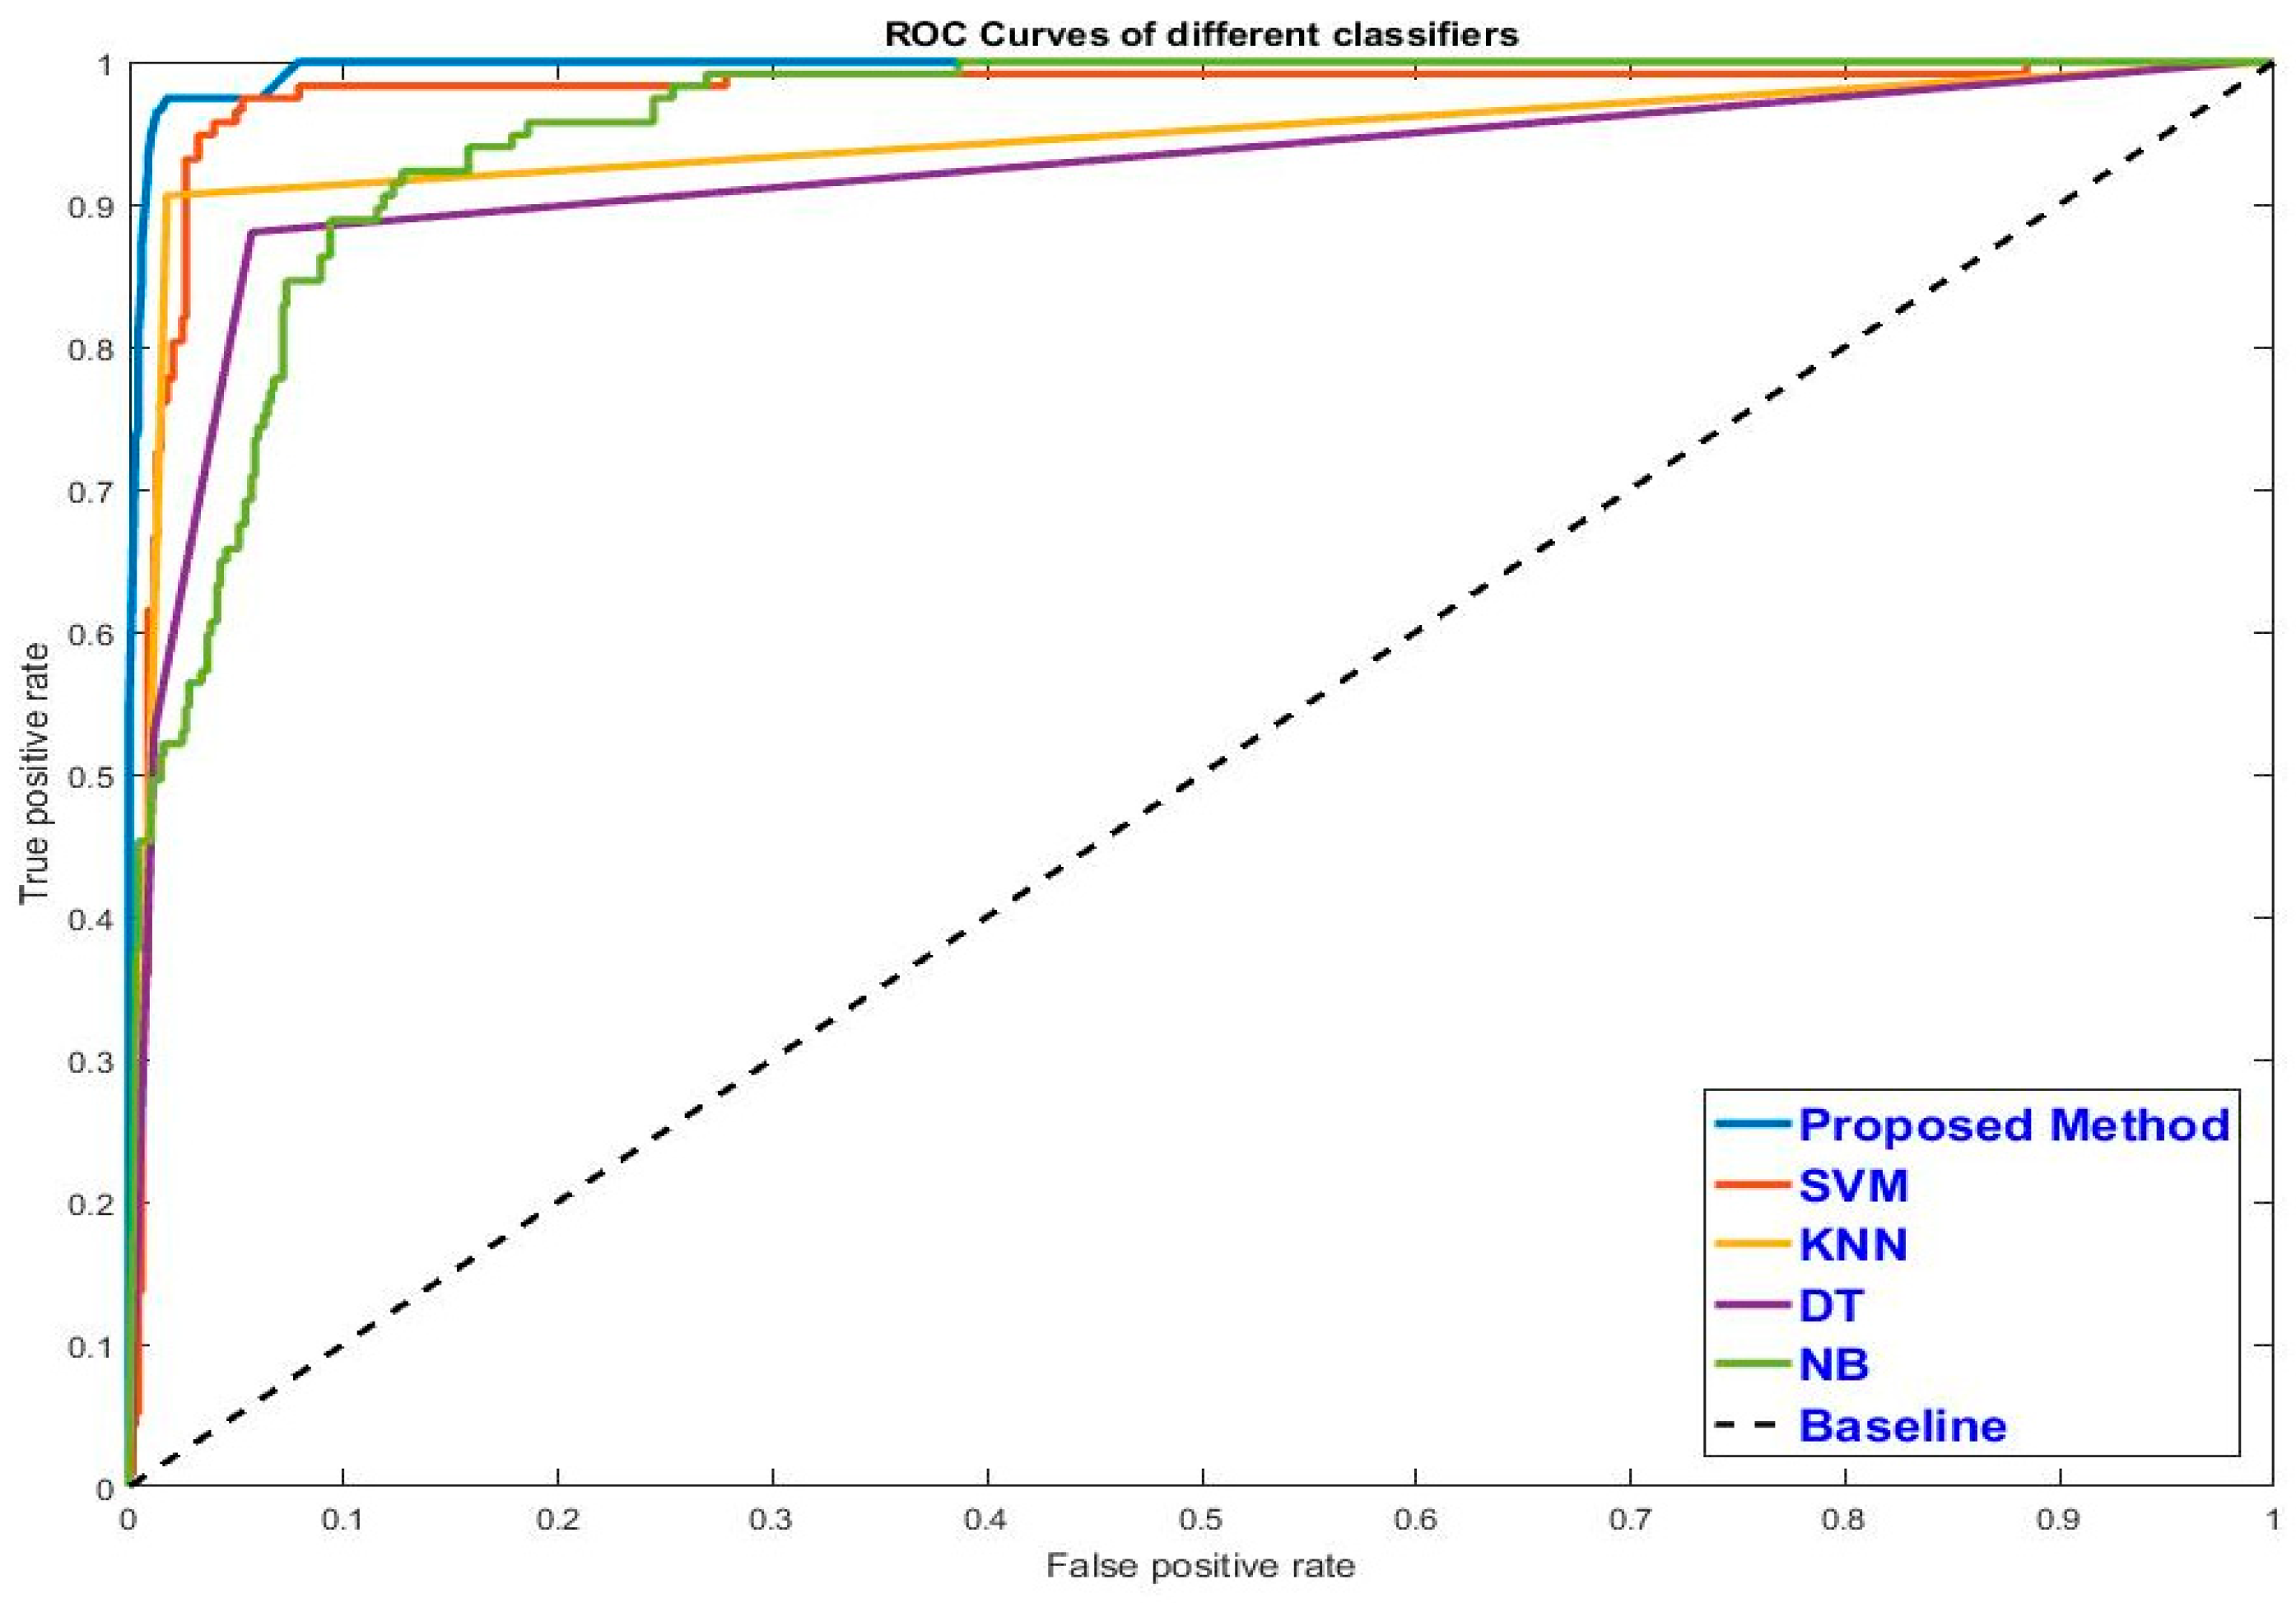
Table 7, respectively. From the experiment results, it is shown that using RF selected features provides better accuracy compared to using all features for most classifiers except NB. The results also reveal that the RF ensemble classifier yields preferable accuracy compared to NB, SVM, KNN, and DT classifiers. The synergy between RF’s selected features and the RF ensemble classifier reached the highest classification accuracy. In order to evaluate the classifiers graphically, we plotted an ROC curve for each classifier, as given in 
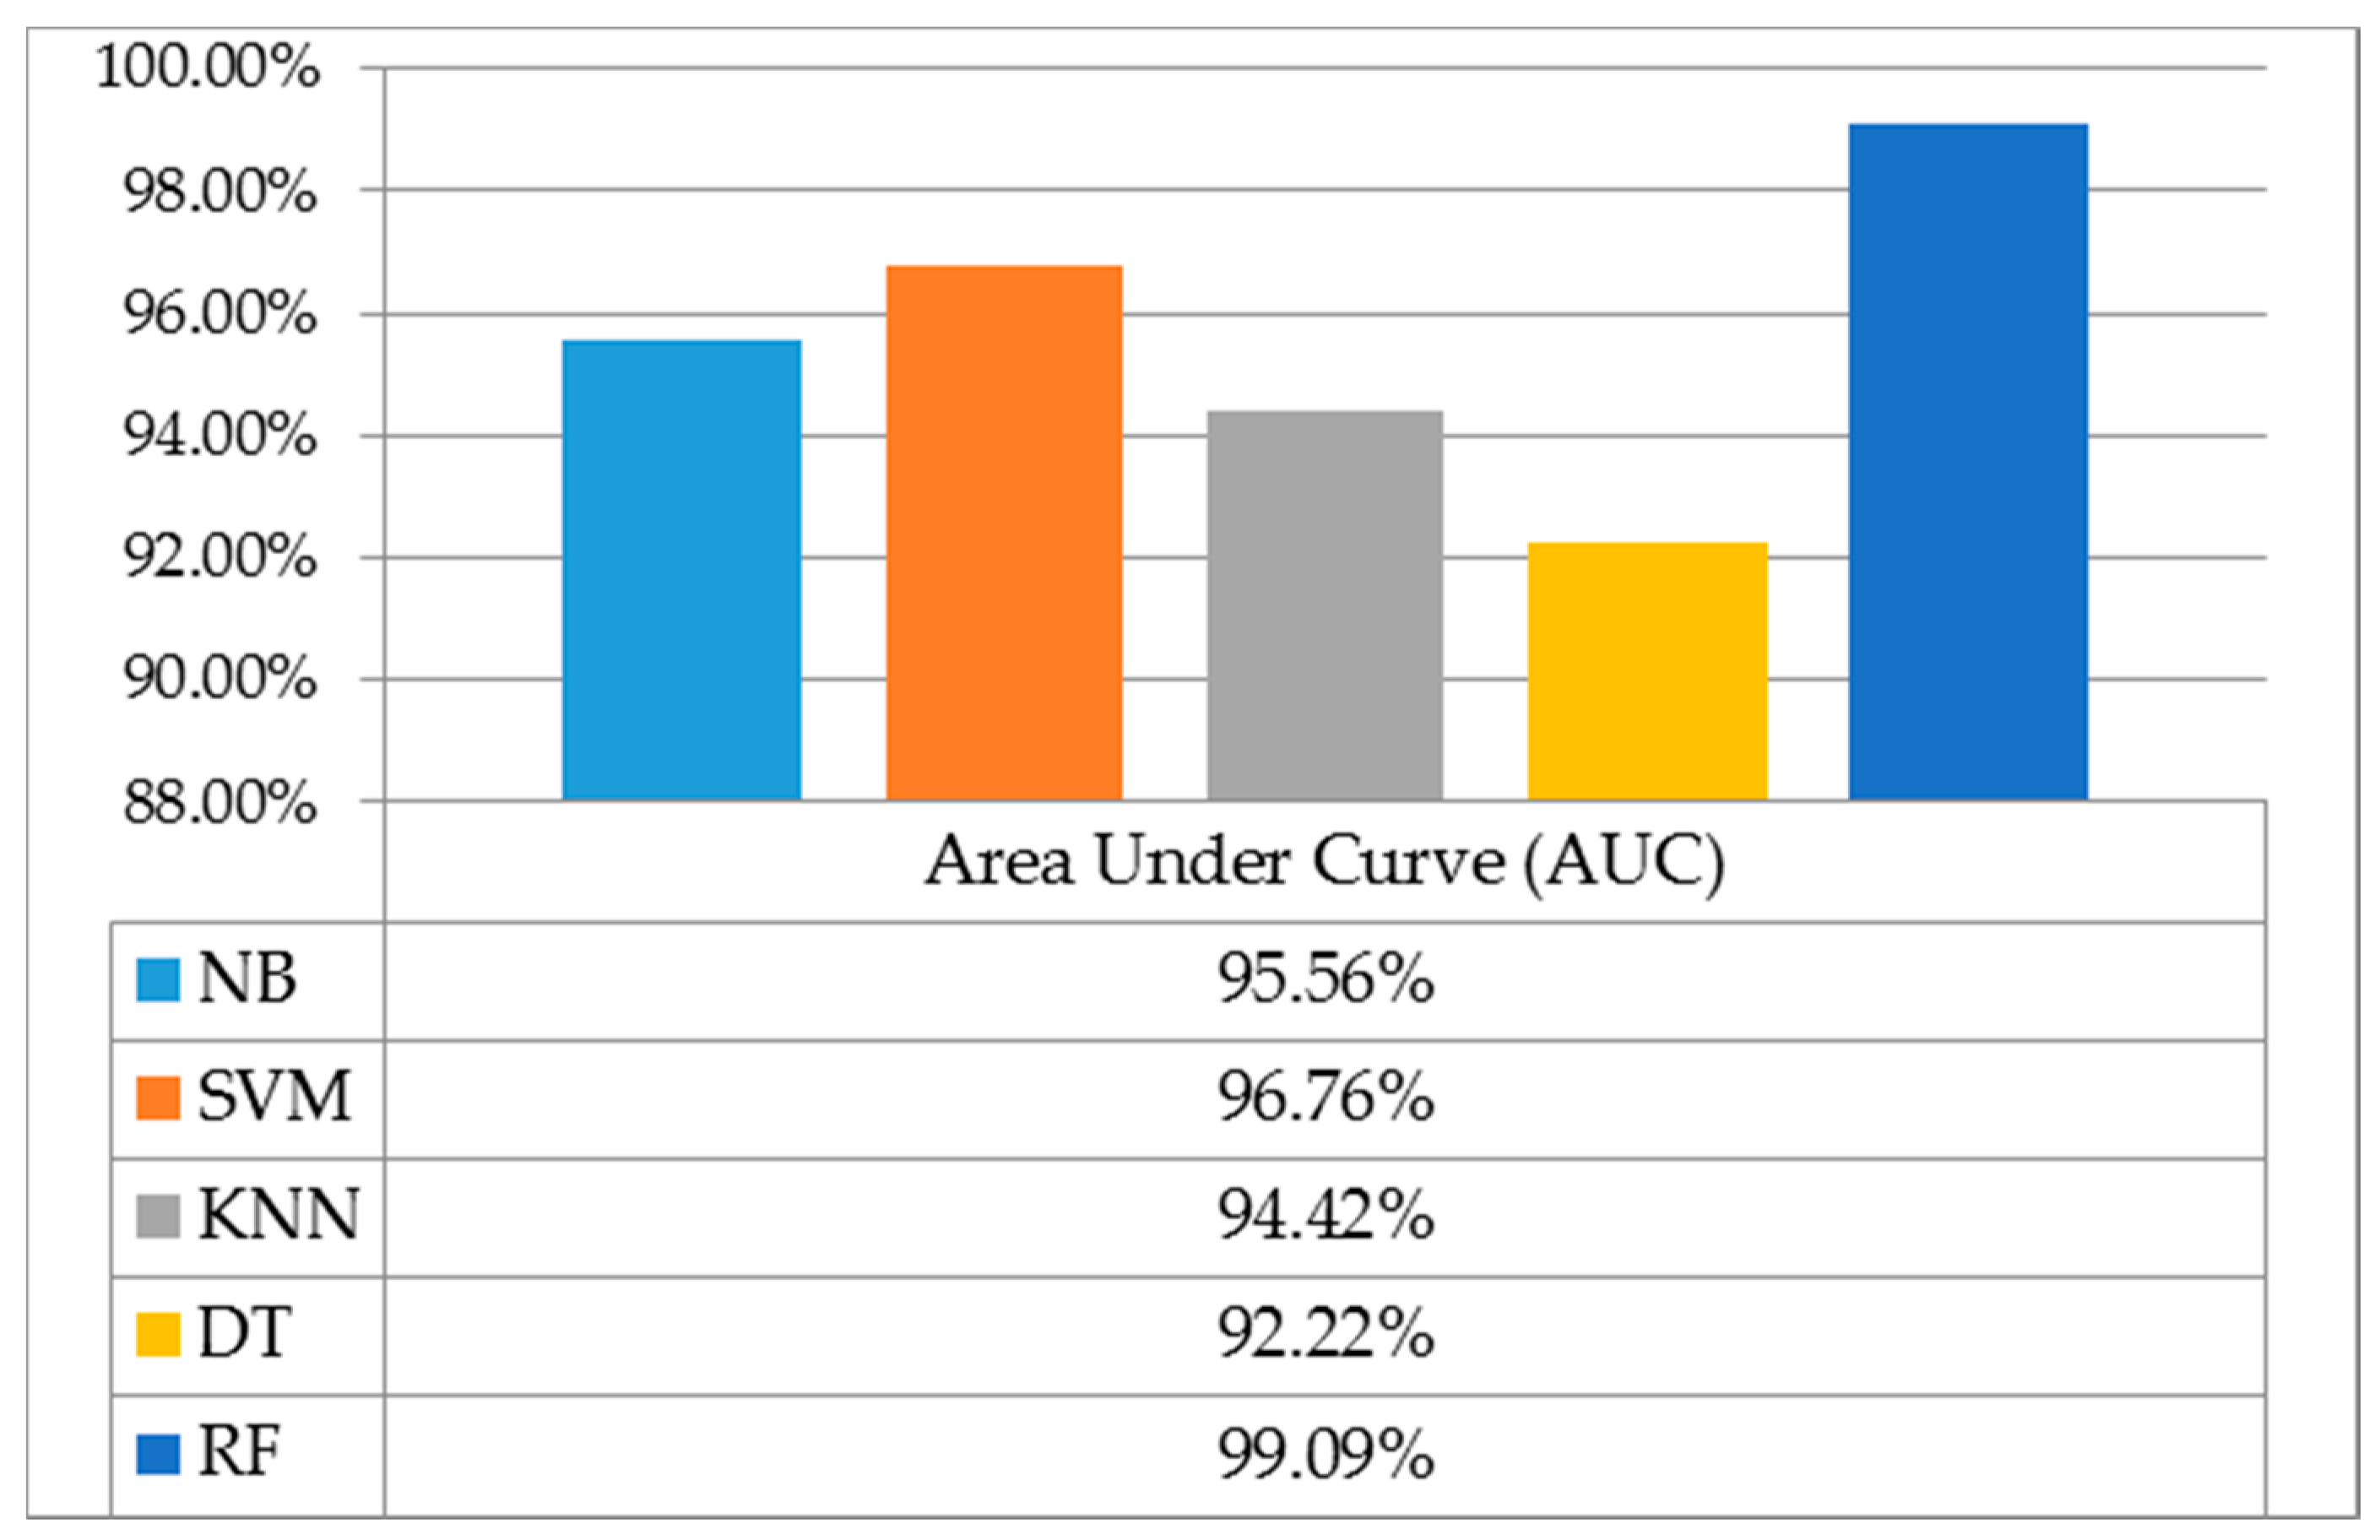
Figure 16. The curves show that the RF ensemble classifier gains higher accuracy and stability compared to others. From the ROC curves, we further computed the AUC of different classifiers as presented in Figure 17. An RF ensemble classifier using RF-selected features reached the highest AUC by a given 99.09%.
In order to compare with previous studies, there was no common dataset, and previous studies were evaluated based on different types of images. In order to make a fair, objective comparison, we adopted the methodologies of previous studies to our application. It should be noted that all the methods in the comparison were evaluated with the same experiment settings and the same dataset used to test the proposed method. Thus, the evaluation results were compared fairly without affecting any other factors. The comparison of classification accuracy obtained along with their corresponding methodologies is presented in Table 8. From the experiment results, it is inferred that our proposed method provides superior accuracy compared to previous works [13,17]. It is also reasonable to conclude that our combination of geometric and textural features is more discriminant than the features used in previous studies for classifying single and overlapping nuclei. To validate computational efficiency, we also analyzed the processing time of each processing step and the entire algorithm as given in 
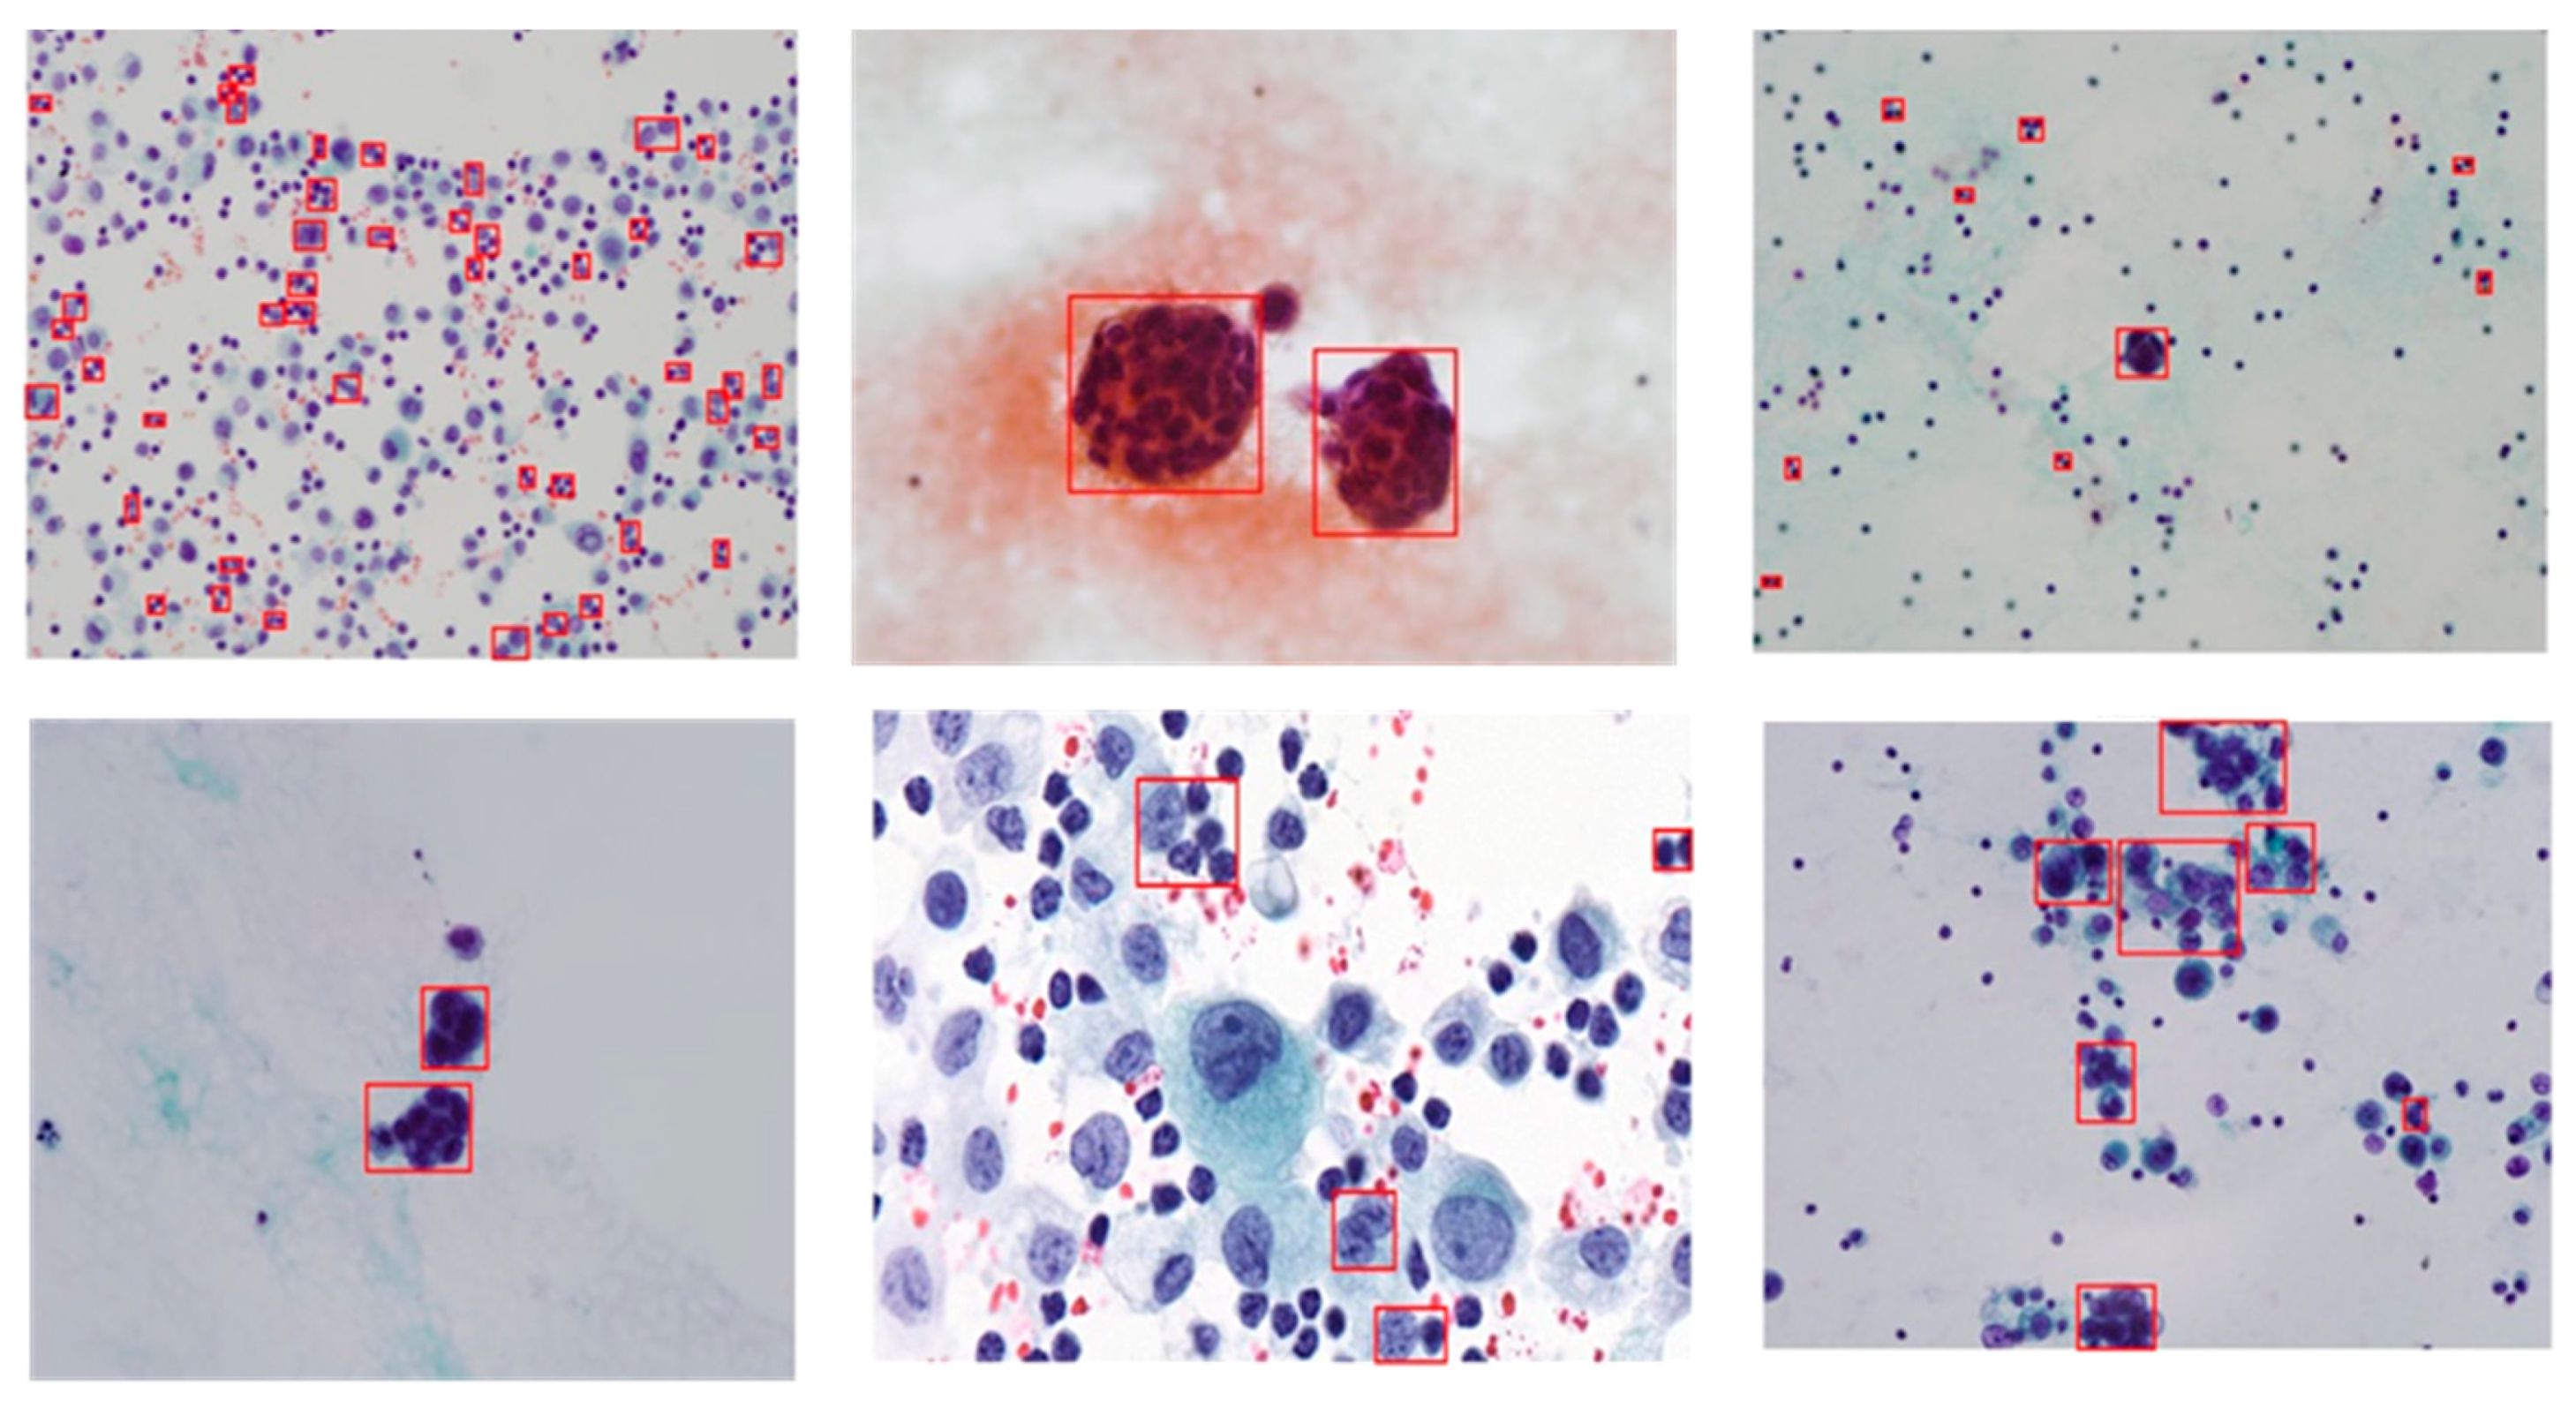
Table 9 and found that computational complexity is relatively simple. The visual results of detected overlapped nuclei using our proposed method are depicted in Figure 18.
The proposed algorithm can be utilized to accurately detect and classify touching, overlapping or clustering nuclei from single nuclei. Due to its high accuracy and computational simplicity, it can serve as a new supportive tool in developing new overlapping cell separation algorithms. Moreover, our method has the potential to integrate with existing overlapping-separation methods, such as watershed methods, contour concavity analysis, rule-based methods, etc., to separate overlapping nuclei. It can be deduced that accurately detecting overlapping nuclei before decomposing them into their constituent parts can help to reduce the workload of separation methods because these methods need to work only on detected overlapping nuclei instead of on all nuclei. It should also be noted that the proposed algorithm may determine the presence of overlapping nuclei even if there are no overlapping nuclei in the image. Since the aim of our study focuses on developing a determination algorithm for overlapping nuclei, isolating overlapping nuclei, or extracting the interregional contour of each nucleus has been deferred for future study.

5. Conclusions

This paper presents a method for the automated detection and classification of overlapping nuclei from CPE images using maximum entropy thresholding, new combinations of geometric and textural features, and double-strategy RF. First, the images were enhanced on their green color channel using histogram stretching and CLAHE. Then, maximum entropy thresholding was employed to segment the cell nuclei from their surrounding background (i.e., cytoplasm, blood cells, artifacts, and so on). The post-processing step was performed to eliminate any false findings and preserve the shape of the segmented nuclei using morphological operations. A new combination of 16 geometrical and 10 textural features was extracted for each extracted nucleus region. A double-strategy RF algorithm was applied to perform two tasks: ensemble feature selection to select the most relevant features, and an ensemble classifier to identify the presence of overlapped nuclei using selected features. RF ensemble feature selection selected eight features out of a total of 26 features that were used as input to the RF ensemble classifier. The proposed method was evaluated on 4000 nuclei from CPE images with respect to six performance measures and AUC. It yielded 96.6% sensitivity, 98.7% specificity, 92.62% precision, 94.6% F1 score, 98.4% accuracy, 97.6% G mean, and AUC 99.0%. Only 5.17 s of computation time was required to run the entire algorithm. The performance from using RF’s selected features was compared to the performance of all features by coupling with five different classifiers: NB, SVM, KNN, DT, and RF. The comparison revealed that RF’s selected features were better in terms of generalization capability and yielded significant improvements in accuracy for most classifiers, except NB. It is also worth noting that the RF ensemble classifier provided favorable accuracy compared to other classifiers. The synergy between the proposed features and a double-strategy RF achieved the promising results. Furthermore, the achieved results were compared with the results obtained from previous works. The results prove that the proposed algorithm yields superior results compared to previous works. It is our finding that the combination of geometric and textural features is more effective than the features used in previous studies. Due to its high accuracy and computational simplicity, the proposed algorithm can be used as a new basis in developing algorithms for separating overlapping nuclei, and can also serve as a new supportive tool in developing advanced automated cell analysis systems. Furthermore, the proposed method has the potential to integrate with the existing separation algorithms of overlapping nuclei to enhance separation accuracy by accurately locating the overlapping nuclei to be separated. Separation of overlapping nuclei or extraction of the interregional contour of each nucleus has been deferred for future study.

Author Contributions

K.Y.W., S.C., and K.H. conceived and designed the study; K.Y.W. organized the experiments, performed the simulation and data analysis, and wrote the manuscript; M.R. acquired the images, provided the medical reviews, annotated the pathologic cells, and verified the results; and S.C. and K.H. coordinated the whole effort as supervisors of this research.

Funding

This research received no external funding.

Acknowledgments

The authors gratefully acknowledge ASEAN University Network/Southeast Asia Engineering Education Development Network (AUN/SEED-Net) and Japan International Cooperation Agency (JICA) for financial support. We also immensely grateful to Department of Pathology, Faculty of Medicine, Srinakharinwirot University, Thailand, for providing the datasets and insight and expertise that greatly assisted the research.

Conflicts of Interest

The authors declare that there is no conflict of interest.

References

  1. Pleural Effusion. Available online: https://en.wikipedia.org/wiki/Pleural_effusion (accessed on 4 September 2018).
  2. Lee, Y.C.; Light, R.W. Management of malignant pleural effusions. Respirology 2004, 9, 148–156. [Google Scholar] [CrossRef] [PubMed] [Green Version]
  3. Heffner, J.E.; Klein, J.S. Recent advances in the diagnosis and management of malignant pleural effusions. Mayo Clin. Proc. 2008, 83, 235–250. [Google Scholar] [CrossRef]
  4. Kushwaha, R.; Shashikala, P.; Hiremath, S.; Basavaraj, H.G. Cells in pleural fluid and their value in differential diagnosis. J. Cytol. 2008, 25, 138–143. [Google Scholar] [CrossRef]
  5. Cytology Exam of Pleural Fluid. Available online: https://www.ucsfbenioffchildrens.org/tests/003866.html (accessed on 5 July 2018).
  6. Irshad, H.; Veillard, A.; Roux, L.; Racoceanu, D. Methods for nuclei detection, segmentation, and classification in digital histopathology: A review—Current status and future potential. IEEE Rev. Biomed. Eng. 2014, 7, 97–114. [Google Scholar] [CrossRef] [PubMed]
  7. Doi, K. Computer-aided diagnosis in medical imaging: Historical review, current status and future potential. Comput. Med. Imaging Graph. 2007, 31, 198–211. [Google Scholar] [CrossRef] [PubMed]
  8. Malpica, N.; de Solorzano, C.O.; Vaquero, J.J.; Santos, A.; Vallcorba, I.; García-Sagredo, J.M.; Del Pozo, F. Applying watershed algorithms to the segmentation of clustered nuclei. Cytometry 1997, 28, 289–297. [Google Scholar] [CrossRef]
  9. Yang, X.; Li, H.; Zhou, X. Nuclei segmentation using marker-controlled watershed, tracking using mean-shift, and Kalman filter in time-lapse microscopy. IEEE Trans. Circuits Syst. I Regul. Pap. 2006, 53, 2405–2414. [Google Scholar] [CrossRef]
  10. Yeo, T.T.E.; Jin, X.C.; Ong, S.H.; Sinniah, R. Clump splitting through concavity analysis. Pattern Recognit. Lett. 1994, 15, 1013–1018. [Google Scholar] [CrossRef]
  11. Bai, X.; Sun, C.; Zhou, F. Splitting touching cells based on concave points and ellipse fitting. Pattern Recognit. 2009, 42, 2434–2446. [Google Scholar] [CrossRef]
  12. Kumar, S.; Ong, S.H.; Ranganath, S.; Ong, T.C.; Chew, F.T. A rule-based approach for robust clump splitting. Pattern Recognit. 2006, 39, 1088–1098. [Google Scholar] [CrossRef]
  13. Wang, H.; Zhang, H.; Ray, N. Clump splitting via bottleneck detection and shape classification. Pattern Recognit. 2012, 45, 2780–2787. [Google Scholar] [CrossRef]
  14. Tafavogh, S.; Catchpoole, D.R.; Kennedy, P.J. Non-parametric and integrated framework for segmenting and counting neuroblastic cells within neuroblastoma tumor images. Med. Boil. Eng. Comput. 2013, 51, 645–655. [Google Scholar] [CrossRef] [PubMed]
  15. Tafavogh, S.; Catchpoole, D.R.; Kennedy, P.J. Cellular quantitative analysis of neuroblastoma tumor and splitting overlapping cells. BMC Bioinform. 2014, 15, 272. [Google Scholar] [CrossRef] [PubMed]
  16. Abbas, N.; Abdullah, A.H.; Mohamad, Z.; Altameem, A. Clustered red blood cell splitting via boundary analysis in microscopic thin blood smear digital images. Int. J. Technol. 2015, 3, 306–317. [Google Scholar] [CrossRef]
  17. Guven, M.; Cengizler, C. Data cluster analysis-based classification of overlapping nuclei in Pap smear samples. Biomed. Eng. Online 2014, 13, 159. [Google Scholar] [CrossRef] [PubMed] [Green Version]
  18. Guerra, L.; McGarry, L.M.; Robles, V.; Bielza, C.; Larranaga, P.; Yuste, R. Comparison between supervised and unsupervised classifications of neuronal cell types: A case study. Dev. Neurobiol. 2011, 71, 71–82. [Google Scholar] [CrossRef] [PubMed] [Green Version]
  19. Alparslan, E.; Fuatince, M. Image enhancement by local histogram stretching. IEEE Trans. Syst. Man Cybern. 1981, 11, 376–385. [Google Scholar]
  20. Pizer, S.M.; Amburn, E.P.; Austin, J.D.; Cromartie, R.; Geselowitz, A.; Greer, T.; Haar Romeny, B.; Zimmerman, J.B.; Zuiderveld, K. Adaptive histogram equalization and its variations. Comput. Vis. Graph. Image Process. 1987, 39, 355–368. [Google Scholar] [CrossRef]
  21. Zuiderveld, K. Contrast limited adaptive histogram equalization. In Graphics Gems IV; Academic Press Professional, Inc.: San Diego, CA, USA, 1994; pp. 474–485. [Google Scholar]
  22. Sreng, S.; Maneerat, N.; Isarakorn, D.; Pasaya, B.; Takada, J.I.; Panjaphongse, R.; Varakulsiripunth, R. Automatic exudate extraction for early detection of Diabetic Retinopathy. In Proceedings of the 2013 International Conference on Information Technology and Electrical Engineering (ICITEE), Yogyakarta, Indonesia, 7–8 October 2013; pp. 31–35. [Google Scholar]
  23. Choi, W.J.; Choi, T.S. Automated pulmonary nodule detection system in computed tomography images: A hierarchical block classification approach. Entropy 2013, 15, 507–523. [Google Scholar] [CrossRef]
  24. Oswal, V.; Belle, A.; Diegelmann, R.; Najarian, K. An entropy-based automated cell nuclei segmentation and quantification: Application in analysis of wound healing process. Comput. Math. Methods Med. 2013, 2013, 592790. [Google Scholar] [CrossRef] [PubMed]
  25. Shannon, C.E.; Weaver, W. The Mathematical Theory of Communication; University of Illinois Press: Urbana, IL, USA, 1949. [Google Scholar]
  26. Wong, A.K.; Sahoo, P.K. A gray-level threshold selection method based on maximum entropy principle. IEEE Trans. Syst. Man Cybern. 1989, 19, 866–871. [Google Scholar] [CrossRef]
  27. Soille, P. Morphological Image Analysis: Principles and Applications; Springer Science & Business Media: Berlin, Germany, 2013. [Google Scholar]
  28. Srinivasan, G.N.; Shobha, G. Statistical texture analysis. World Acad. Sci. Eng. Technol. 2008, 36, 1264–1269. [Google Scholar]
  29. Kam, H.T. Random decision forest. In Proceedings of the Third International Conference on Document Analysis and Recognition, Montreal, QC, Canada, 14–16 August 1995; pp. 14–18. [Google Scholar]
  30. Ho, T.K. The random subspace method for constructing decision forests. IEEE Trans. Pattern Anal. Mach. Intell. 1998, 20, 832–844. [Google Scholar]
  31. Breiman, L. Random forests. Mach. Learn. 2001, 45, 5–32. [Google Scholar] [CrossRef]
  32. Kursa, M.B. Robustness of Random Forest-based gene selection methods. BMC Bioinform. 2014, 15, 8. [Google Scholar] [CrossRef] [PubMed]
  33. Genuer, R.; Poggi, J.M.; Tuleau-Malot, C. Variable selection using random forests. Pattern Recognit. Lett. 2010, 31, 2225–2236. [Google Scholar] [CrossRef] [Green Version]
  34. Díaz-Uriarte, R.; De Andres, S.A. Gene selection and classification of microarray data using random forest. BMC Bioinform. 2006, 7, 3. [Google Scholar] [CrossRef] [PubMed] [Green Version]
  35. Suna, G.; Lia, S.; Caoa, Y.; Lang, F. Cervical cancer diagnosis based on random forest. Int. J. Performabil. Eng. 2017, 13, 446–457. [Google Scholar] [CrossRef]
  36. Krishnaiah, V.; Narsimha, D.G.; Chandra, D.N.S. Diagnosis of lung cancer prediction system using data mining classification techniques. Int. J. Comput. Sci. Inf. Technol. 2013, 4, 39–45. [Google Scholar]
  37. Zhu, W.; Zeng, N.; Wang, N. Sensitivity, specificity, accuracy, associated confidence interval and ROC analysis with practical SAS implementations. In Proceedings of the NESUG Proceedings: Health Care and Life Sciences, Baltimore, MD, USA, 14–17 November 2010; p. 67. [Google Scholar]
  38. Loong, T.W. Understanding sensitivity and specificity with the right side of the brain. BMJ 2003, 327, 716–719. [Google Scholar] [CrossRef] [PubMed]
  39. Fawcett, T. An introduction to ROC analysis. Pattern Recognit. Lett. 2006, 27, 861–874. [Google Scholar] [CrossRef]
  40. Zhang, H. The optimality of naive Bayes. In Proceedings of the Seventeenth International Florida Artificial Intelligence Research Society Conference, Miami Beach, FL, USA, 12–14 May 2004. [Google Scholar]
  41. Shmilovici, A. Support vector machines. In Data Mining and Knowledge Discovery Handbook; Springer: Boston, MA, USA, 2009; pp. 231–247. [Google Scholar]
  42. Sutton, O. Introduction to k Nearest Neighbor Classification and Condensed Nearest Neighbour Data Reduction; University Lectures; University of Leicester: Leicester, UK, 2012. [Google Scholar]
  43. Rokach, L.; Maimon, O.Z. Data Mining with Decision Trees: Theory and Applications; World Scientific: Singapore, 2008; Volume 69. [Google Scholar]
Figure 1. The existence of pleural effusion in the pleura cavity [1].
Applsci 08 01608 g001
Figure 2. The samples of CPE images.
Applsci 08 01608 g002
Figure 3. The typical architecture of CAD systems of cancer cells (focus range of our study is shaded in green).
Applsci 08 01608 g003
Figure 4. Block diagram of the proposed algorithm for detecting and classifying overlapping nuclei.
Applsci 08 01608 g004
Figure 5. Individual components of RGB of CPE image: (a) Original CPE image, (b) red component, (c) green component, and (d) blue component.
Applsci 08 01608 g005
Figure 6. The visual results of the preprocessing step: (a) after applying histogram stretching on green channel, and (b) after applying CLAHE on resulting image from histogram stretching.
Applsci 08 01608 g006
Figure 7. Surface plot of intensity valleys in CPE image.
Applsci 08 01608 g007
Figure 8. Maximum entropy thresholding based nuclei segmentation: (a) segmented image in binary form, and (b) masked image in an RGB model.
Applsci 08 01608 g008
Figure 9. Post-processing using morphological operations: (a) refined image in binary form, and (b) reconstruction of the refined image in an RGB model.
Applsci 08 01608 g009
Figure 10. Different forms of single and overlapping nuclei in CPE images.
Applsci 08 01608 g010
Figure 11. The block diagram of the RF algorithm.
Applsci 08 01608 g011
Figure 12. Data utilization in constructing a RF classifier.
Applsci 08 01608 g012
Figure 13. Out-of-bag (OOB) error of RF using different number of decision trees.
Applsci 08 01608 g013
Figure 14. Ranking the relative importance of features using RF ensemble feature selection.
Applsci 08 01608 g014
Figure 15. Training accuracies obtained through different feature numbers selected by RF.
Applsci 08 01608 g015
Figure 16. Receiver operating characteristics (ROC) curves: graphical performance evaluation of different classifiers using selected features by RF.
Applsci 08 01608 g016
Figure 17. Comparison of AUC obtained through different classifiers using selected features by RF.
Applsci 08 01608 g017
Figure 18. The visual results of detected touching, overlapping and clustering nuclei through the proposed method (the red bounding boxes indicate the different forms of detected overlapping nuclei).
Applsci 08 01608 g018
Table 1. Extracted geometric features.
No.Feature NameDescription
1.Area (A)It is represented as the actual number of pixels inside the nucleus region.
2.Perimeter (P)This is measured by computing the total number of pixels on the nucleus edge.
3.RoundnessThis is defined by 4 π   ×   a r e a p e r i m e t e r 2 , which represents the similarity between the nucleus region and a circle. It varies between 0 and 1 and a circle’s roundness circularity is equal to 1.
4.SolidityThis specifies the proportion of the pixels in the convex hull that is also in the nucleus region. It is formulated as; A r e a C o n v e x A r e a .
5.Equivalent Circular Diameter (EDC)This is defined as the diameter of a circle with the same area as the nucleus region. It is represented using; 4   ×   A r e a p i .
6.CompactnessThis specifies the ratio of area and square of the perimeter. It is computed as A r e a p e r i m e t e r 2 .
7.EccentricityThis represents the eccentricity of the ellipse that has the same second-moments as the nucleus region. Its value is between 0 and 1. A cell whose eccentricity is 0 is a circle, while 1 is a line segment.
8.Local minimaThis represents the number of local minimum points in the nucleus region.
9.Aspect ratio of the nucleus:This is represented by the ratio of nucleus width to nucleus height using;   W i d t h n u c l e u s H e i g h t n u c l e u s .
10.Major AxisThis represents the length (in pixels) of the major axis of the ellipse that has the same normalized second central moments as the nucleus region.
11.Minor AxisThis specifies the length (in pixels) of the minor axis of the ellipse that has the same normalized second central moments as the nucleus region.
12.ElongationThis is represented by the ratio between the major and minor axis using; m a j o r a x i s m i n o r a x i s .
13.Actual Diameter (AD)This is represented by the circle’s diameter circumscribing the nucleus region. It is formulated as; p e r i m e t e r 2     ×     p i .
14.ECD to ADIt is defined as; E C D A D .
15.Convex AreaThis represents the number of pixels in the convex nucleus.
16.Number of local minimaThis is measured by counting the number of local minima in the nucleus region.
Table 2. Extracted textural features.
No.Feature NameDescription
1.MeanThis represents the mean gray values of the nucleus region.
2.Standard deviationThis specifies the deviation of gray values of the nucleus region.
3.SmoothnessThis specifies the local variation in radius lengths of the nucleus region.
4.VarianceThis is represented using the variance value of the gray values inside the nucleus region.
5.SkewnessThis defines the skewness of gray values of the nucleus region.
6.KurtosisThis specifies the kurtosis of gray values of the nucleus region.
7.EnergyThis is represented by the energy of gray values of the nucleus region.
8.EntropyThis specifies the entropy of gray values of the nucleus region.
9.EntropyEntropy of entropy filtered image.
10.EntropyEntropy of standard deviation filtered image.
Table 3. Processing steps of double-strategy RF algorithm used in the study.
Double-Strategy RF Algorithm Steps
1. Prepare training and testing datasets (80–20% ratio)
2. Train an RF classifier using all features on the training dataset.
3. Select the most important features.
4. Create a new ‘selected featured’ dataset containing only those features.
5. Train a second classifier on this new dataset.
6. Test the new data using the trained RF classifier.
7. Compare the accuracy of the ‘full featured’ classifier to the accuracy of the ‘selected featured’ classifier.
Table 4. The number of observations used in the training and testing stage.
Observational DataTrainingTestingTotal
Single Nuclei26926833375
Overlapped Nuclei508117625
Total32008004000
Table 5. Features selected using random forest ensemble feature selection.
No.Feature NameCategory
1.EnergyTextural Feature
2.VarianceTextural Feature
3.Equivalent Circular Diameter to actual diameterGeometric Feature
4.EccentricityGeometric Feature
5.Ratio between area and perimeterGeometric Feature
6.Entropy of Local standard deviation filtered ImageTextural Feature
7.Actual DiameterGeometric Feature
8.EntropyTextural Feature
Table 6. Comparison of classification accuracy obtained through different classifiers using all features.
ClassifiersPerformance Measures
SensitivitySpecificityPrecisionF ScoreAccuracyG Mean
NB62.07%98.68%88.89%73.10%93.38%78.26%
SVM78.45%97.51%84.26%81.25%94.75%87.46%
KNN79.31%97.66%85.19%82.14%95.00%88.01%
DT66.67%97.07%79.59%72.56%92.63%80.45%
RF84.48%97.51%85.22%84.85%95.63%90.77%
Table 7. Comparison of classification accuracy obtained through different classifiers using RF’s selected features.
ClassifiersPerformance Measures
SensitivitySpecificityPrecisionF ScoreAccuracyG Mean
NB52.14%97.51%78.21%62.56%90.88%71.30%
SVM93.16%97.22%85.16%88.98%96.63%95.17%
KNN90.60%98.24%89.83%90.21%97.13%94.34%
DT65.52%98.68%89.41%75.62%93.88%80.41%
RF96.58%98.68%92.62%94.56%98.38%97.63%
Table 8. Quantitative comparison results of the proposed algorithm and previous studies using the same dataset.
MethodologyObservational DataFeatures/ClassifiersQuantitative Results
Shape classifier using SVM [13]4000 nuclei from CPE imagesFive size and shape features
Support vector machine
F1 score 84.12%
Accuracy 95.38%
G mean 90.31%
Data clustering-based identification [17]4000 nuclei from CPE imagesThree shapes and two local minima based features
Fuzzy C Mean Clustering
F1 score 62.15%
Accuracy 88.13%
G mean 78.23%
Proposed Method4000 nuclei from CPE imagesFour shapes and four textural features
Double-strategy random forest
F1 score 94.56%
Accuracy 98.38%
G mean 97.63%
Table 9. Computational time of each processing step and the entire algorithm.
Algorithm StepsCompuatation Time (Seconds)
Nuclei segmentation using maximum entropy thresholding 2.07 s
Geometric and textural features extraction2.02 s
Classification using double-strategy RF1.07 s
Entire Algorithm5.17 s

