Article

Synthesis, Characterization and Photocatalytic Activity of Nanocrystalline First Transition-Metal (Ti, Mn, Co, Ni and Zn) Oxisde Nanofibers by Electrospinning

1
Key Laboratory of Photochemical Conversion and Optoelectronic Material, Technical Institute of Physics and Chemistry, Chinese Academy of Sciences, Beijing 100190, China
2
University of Chinese Academy of Sciences, Beijing 100049, China
3
Hangzhou Research Institute of Technical Institute of Physics and Chemistry, Chinese Academy of Sciences, Hangzhou 310018, China
*
Authors to whom correspondence should be addressed.
Submission received: 13 November 2018 / Revised: 14 December 2018 / Accepted: 17 December 2018 / Published: 20 December 2018
(This article belongs to the Special Issue Electrospinning Technology: Control of Morphology for Nanostructure)

Abstract

:
In this work, five nanocrystalline first transition-metal (Ti, Mn, Co, Ni and Zn) oxide nanofibers were prepared by electrospinning and controlled calcination. The morphology, crystal structure, pore size distribution and specific surface area were systematically studied by scanning electron microscope (SEM), transmission electron microscope (TEM), surface and pore analysis, and thermo gravimetric analyzer (TGA). The results reveal that the obtained nanofibers have a continuously twisted three-dimensional scaffold structure and are composed of neat nanocrystals with a necklace-like arrangement. All the samples possess high specific surface areas, which follow the order of NiO nanofiber (393.645 m2/g) > TiO2 nanofiber (121.445 m2/g) > ZnO nanofiber (57.219 m2/g) > Co3O4 nanofiber (52.717 m2/g) > Mn2O3 nanofiber (18.600 m2/g). Moreover, the photocatalytic degradation of methylene blue (MB) in aqueous solution was investigated in detail by employing the five kinds of metal oxide nanofibers as photocatalysts under ultraviolet (UV) irradiation separately. The results show that ZnO, TiO2 and NiO nanofibers exhibit excellent photocatalytic efficiency and high cycling ability to MB, which may be ascribed to unique porous structures and the highly efficient separation of photogenerated electron-hole pairs. In brief, this paper aims to provide a feasible approach to achieve five first transition-metal oxide nanofibers with excellent performance, which is important for practical applications.

1. Introduction

Transition-metal oxide nanoparticles have been a subject of intense research due to unique optical, electrical, catalytic, spin and electronic properties [1,2,3]. It has been widely used in energy, sensor, sterilization and photocatalysis [4,5,6,7], and is an extremely important part of the research of inorganic functional materials. In the study of transition-metal oxide nanomaterials, preparation technology has an important influence on the microstructure and macroscopic properties of nanomaterials. Up to now, a rich variety of methods, namely the template directed method, solvothermal or hydrothermal synthesizer, self-assembly and vapor-phase approach [8,9,10,11], have been proposed for fabricating transition-metal oxide nanoparticles. Over the past decades, significant progress has been achieved by the aforementioned methods. However, some intractable problems, such as long preparation cycles, high equipment requirements, low yield, and especially the problem of agglomeration [12,13,14,15], are still great challenges to overcome. Therefore, it has become an urgent task for scientists to explore simple methods and equipment to prepare transition-metal oxide nanopaticles with uniform size, good dispersibility and high yield.
One-dimensional metal oxide nanomaterials [16,17], as the name implies, refer to materials containing metal oxide nanoparticles in one-dimensional nanostructures. Due to the spatial orientation of one-dimensional structures, nanoparticles can be uniformly dispersed along the axial direction of the nanomaterials, which can effectively be against the agglomeration of nanoparticles. Among the different strategies for producing one-dimensional metal oxide nanomaterials, electrospinning has proved a remarkably simple, straightforward and cost-effective process to obtain long continuous metal oxide nanofibers with a diameter ranging from submicrometre to nanometre scales [18,19,20,21,22]. To date, many groups have focused on designing one-dimensional transition-metal oxide nanofibers composed of nanoparticles. Lu et al. successfully developed a simple strategy for the preparation of Fe3O4/N-C hybrid nanofibers as artificial peroxidase mimics combining electrospinning and pyrolysis processes, which have promising potential applications in biosensing, medical diagnostics and environmental monitoring [23]. Kim et al. successfully synthesized aligned TiO2 nanofibers (NFs) using an electrospinning technique with a two-piece Al collector. They demonstrated that, by controlling the needle-to-collector distance and applied voltage, well-aligned TiO2 NFs with controllable diameters can be obtained [24]. Xue et al. fabricated Co3O4 nanoparticles (NPs) anchored on N-doped mesoporous carbon nanofibers (Co3O4/NMCF) by electrospinning combined with simple heat treatment. Because of its superior electrochemical performance, Co3O4/NMCF composite is a promising choice, serving as an efficient electrocatalyst for oxygen reduction reaction (ORR) [25]. Apparently, transition-metal oxide nanofibers are rich in types and structures, resulting in a variety of properties and applications. Therefore, systematic comparative studies on a series of transition-metal oxide nanofibers, including the composition, morphology and formation mechanism, can effectively analyze the relationship between structure and properties of nanomaterials. In addition, the synthesis of functional materials with expected structures can be controlled according to one’s wishes, so as to achieve an excellent performance. Yet, to the best of our knowledge, few studies have been done on this aspect. In addition, it should be noted that the preparation process of one-dimensional transition-metal oxide nanofibers is linear nucleation and growth of nanocrystals in the one-dimensional direction. The properties of the nanofibers are related not only to their structure, but also to the crystal form, grain size and crystallinity of the nanocrystals. Systematic analysis of the formation process of nanocrystals in nanofibers is the key to study the formation mechanism of the transition-metal oxide nanofibers and, more importantly, provides a new way of thinking for the preparation of nanocrystal materials.
In this article, we report a series of nanocrystalline transition-metal (Ti, Mn, Co, Ni and Zn) oxide nanofibers with controllable structure and uniform morphology by electrospinning and controlled calcination (Figure 1). In the electrospinning process, we selected polyvinylpyrrolidone (PVP) as the utilized stabilizer to assemble transition-metal oxide nanomaterials, because it is water-soluble and perfectly fulfills both steric and ligand requirements for stabilization [26]. Then, the formation process and structural characteristics of metal oxide nanofibers were systematically characterized in detail. In addition, a possible formation mechanism of the nanofibers composed of metal oxide crystals was also investigated. Finally, as electrospun nanofibers are widely used in many fields, such as supercapacitors, lithium batteries, biological devices, piezoelectric devices, photochemistry and photocatalytic fields [27,28,29,30,31], we chose their photocatalytic properties as an example to explore their excellent performance characteristics.

2. Materials and Methods

2.1. Materials

Polyvinylpyrrolidone (PVP, weight-average molecular weight (Mw)) = 30000), manganese (II) acetate tetrahydrate, zinc acetate, nickel (II) acetate tetrahydrate, cobalt (II) acetate tetrahydrate, tetrabutyl titanate, methylene blue (MB) and absolute ethyl alcohol were purchased from Sinopharm Chemical Reagent Co., Ltd. (Shanghai, China). All chemical reagents were analytical grade and employed without post-processing. The deionized water used in the experiments possessed a resistivity of 18.2 MΩ·cm.

2.2. Preparation of Nanocrystalline First Transition-Metal (Ti, Mn, Co, Ni and Zn) Oxide Nanofibers

The organometallic saline solution was added to the uniform and transparent PVP ethanol solution (14 mL, 0.3 g/mL), and the homogeneous liquid was obtained by ultrasonic treatment. For the electrospinning process, the solution was poured into the syringe with a needle of 1 mm diameter at the tip and connected to a high voltage power supply. The needle tip to the collector drum distance was fixed at 15 cm. The nanofibers were spun with a flow rate of 3 mL/h at 17–18 kV, and the obtained nanofibers were dried in an oven for 4 h at 60 °C. Finally, the as-spun nanofibers were put into a ceramic crucible and calcined in a muffle furnace with a heating rate of 10 °C/min, where the end temperature was 500 °C. After many experimental screenings (such as solution viscosity, flow rate, electric field intensity and work distance), the detailed parameters are shown in Table 1. It should be pointed out that the amount of acetate is determined by its solubility in PVP/ethanol solution, and a certain amount of water is necessary. In addition, butyl titanate is a common raw material for the preparation of nano-TiO2, but it is easy to decompose in water, so glacial acetic acid is often added to prevent its hydrolysis.

2.3. Photocatalytic Tests of Nanocrystalline Metal Oxide Nanofibers

The photocatalytic activities of metal oxide nanofibers were studied by the degradation of MB. In this process, 20 mg nanofibers were suspended in 200 mL MB aqueous solution (10 mg/L). The suspension needed to be stirred continuously for 30 min to ensure adsorption/desorption equilibrium in the dark and then exposed to a 40 W UV lamp at room temperature. The supernatant was collected and separated by centrifugation at irradiation time intervals, and then determined by UV spectrophotometer. The degradation efficiency of dye is calculated by the following equation [32]:
Degradation ( % ) = C 0 C C × 100
C0 is the initial concentration of dye before irradiation and C is the concentration of dye after a certain irradiation time. The photocatalytic degradation kinetics were analyzed using pseudo-first-order kinetics:
ln(C0/C) = kt
C is the concentration and C0 is the initial concentration of the reactant. k refers to the reaction rate kinetic constant and t is the irradiation time.

2.4. Characterization

The morphology of the samples was observed by S-4800 scanning electron microscope (SEM, Hitachi, Tokyo, Japan) and JEM-2100 transmission electron microscope (TEM, JEOL, Tokyo, Japan). The functional groups in the samples were characterized by fourier transform infrared spectroscopy (FTIR) (Bruker Tensor Ⅱ, Karlsruhe, Germany), and the scanning range of the samples was 4000–400 cm−1. The crystal structures of the samples were determined by X-ray diffraction (XRD, ARL XTRA, Zurich, Switzerland). The scanning rate was 0.1 s/step and the scanning range was 10–80°. Thermogravimetric analysis (TGA, NETZSCH, Selb, Germany) of the samples was measured in air with a heating rate of 10 °C/min. The pore size distribution and specific surface area were obtained by surface and pore analyzer (Quantachrome, Boynton Beach, State, USA) by using nitrogen analysis.

3. Results and Discussion

3.1. Morphologies of Nanofibers before and after Calcination

SEM measurements were performed to study morphology of the nanofibers before and after calcination. Figure 2a–e represents Ti(BuO)4/PVP, Mn(Ac)2/PVP, Co(Ac)2/PVP, Ni(Ac)2/PVP and Zn(Ac)2/PVP blended nanofibers with fiber diameters in the range of 300–700, 200–600, 300–600, 800–1000 and 350–600 nm, respectively. It can be seen that the nanofibers exhibit uniform diameter and continuous long nanofiber smooth morphology. Furthermore, due to unsteady bending of the spinning jet, the nanofibers are arranged in random orientation [33]. Therefore, the nanofibers with a three-dimensional random orientation network structure are finally formed. Figure 2a’–e’ represents TiO2, Mn2O3, Co3O4, NiO and ZnO nanofibers calcined at 500 °C, respectively. It can be seen that the calcined nanofibers still remain the three-dimensional scaffold, and consist of well-twisted continuous nanofiber structures. Due to the oxidative decomposition of organometallic salt and removal of PVP, the nanofibers show a shape of shrinkage. The diameters of the nanofibers decreased to 200–600 nm for TiO2, 190–260 nm for Mn2O3, 150–370 nm for Co3O4, 350–550 nm for NiO and 240–500 nm for ZnO nanofibers. In detail, all five obtained nanofibers are composed of neat nanoparticles with a necklace-like arrangement, and exhibit high spatial orientation and necklace-like porous structure. TiO2 and ZnO nanofibers are curled irregularly. Mn2O3, Co3O4 and NiO nanofibers show straight geometry with granular rough microstructure. In addition, Figure 3a–e exhibits the TEM of TiO2, Mn2O3, Co3O4, NiO and ZnO nanofibers, respectively, from which the nanoparticles and the porous surface structures can be clearly reflected.
The grains are densely packed along the nanofiber length. Specifically, it can be seen that the TiO2 and NiO nanoparticles have a uniform and compact arrangement with an average diameter of 10 and 20 nm, respectively. While, the sizes of Mn2O3, Co3O4 and ZnO nanoparticles are relatively large, with sizes of 80–100, 60–80, 50–75 nm, respectively. In addition, the edges of Mn2O3, Co3O4 and ZnO nanofibers are rough, and the arrangement of Mn2O3 particles is relatively dispersed. It is obvious that the crystallinity of TiO2 and NiO nanofibers is different from others. After careful consideration, we think the possible reasons are as follows. Due to the different solubility of these five metal salts in PVP solution, only the electrospun precursors of TiO2 and NiO nanofibers are clear and transparent, while the other three precursors are homogeneous emulsions. In the calcination process, when the temperature rises above the decomposition point of organometallic salts, a small amount of metastable nucleations appears in the amorphous region, and the nanocrystal grains with smaller size are formed as the surrounding atoms are adsorbed to the crystal nucleus. However, the particles of Mn(Ac)2 and Co(Ac)2, Zn(Ac)2 are relatively large, the sizes of Mn2O3, Co3O4 and ZnO nanocrystal grains are much larger than that of TiO2 and NiO during nucleation, and have a relatively loose arrangement. Therefore, the crystallinity of TiO2 and NiO nanofibers is different from the others.

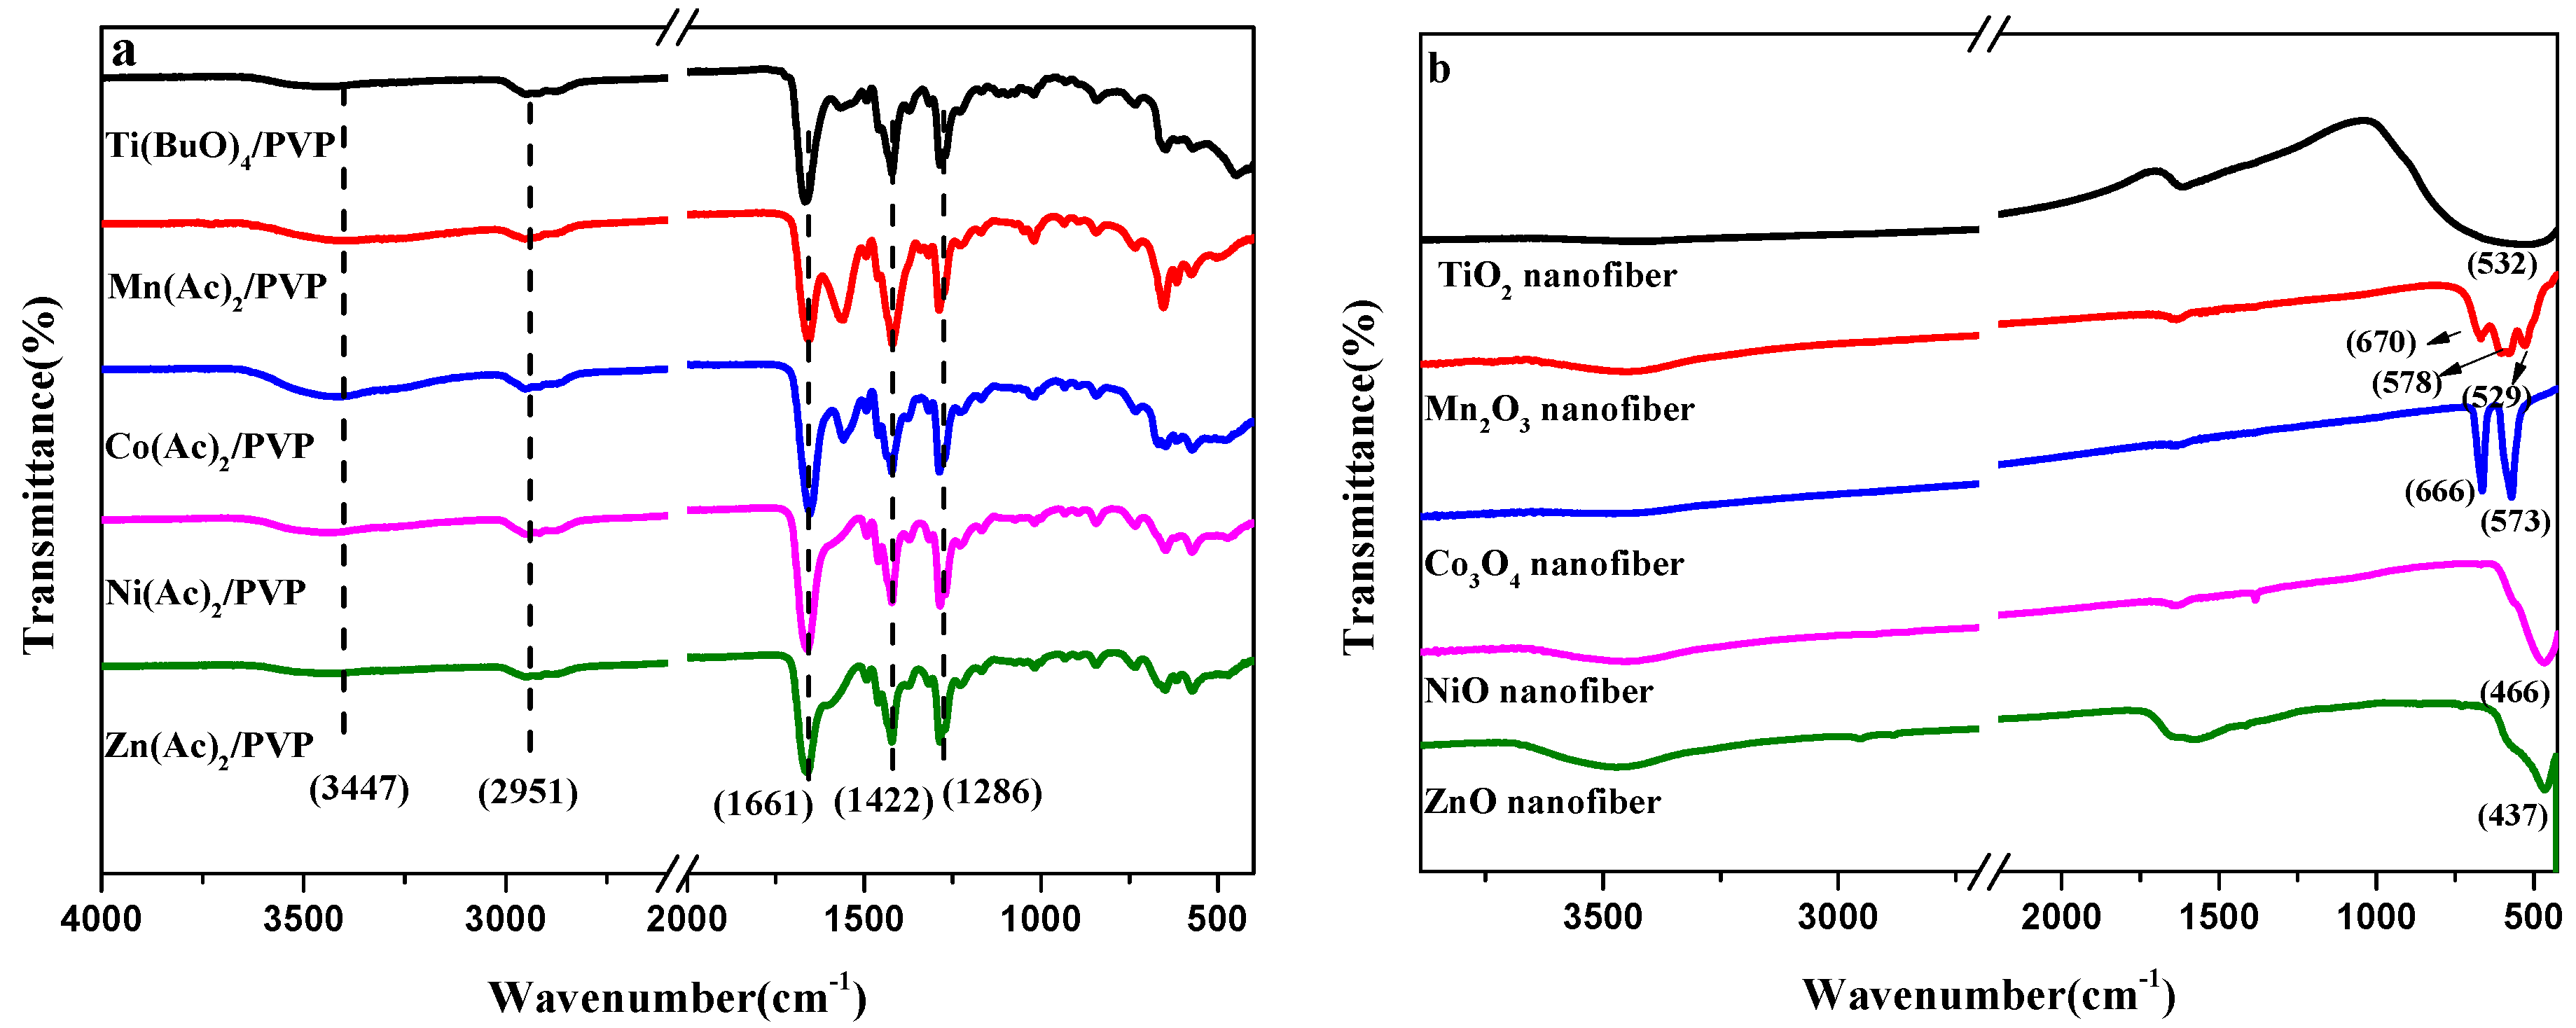
3.2. FTIR Characterization of TiO2, Mn2O3, Co3O4, NiO and ZnO Nanofibers

In order to determine the composition and structural changes of nanofibers before and after calcination, FTIR was carried out. It can be seen from Figure 4a that there is a weak broad peak at about 3447 cm−1, which is the –OH stretching vibration peak of the water molecule adsorbed on the surface of PVP nanofibers. The peaks at 2951, 1422 and 1286 cm−1 correspond to the –CH2 asymmetric addition. There is a strong absorption peak at 1661 cm−1, which is attributed to the CH2 stretching vibration in PVP [34]. In addition, the broad hump around 1000 cm−1 is probably due to the uneven baseline, which may be caused by poor particle size and poor transparency of the sample. From Figure 4b, we can see that the infrared characteristic peaks of PVP disappear after calcination at 500 °C, indicating that the PVP is completely oxidized and decomposed. There is a wide peak at 532 cm−1 in TiO2 nanofibers, which is caused by the stretching vibration of Ti–O–Ti. It has been proven that TiO2 nanocrystals are formed [35]. The peaks at 670 and 578 cm−1 in the infrared peak of Mn2O3 nanofibers are caused by the longitudinal optical (LO) mode and the transverse optical (TO) mode in the tensile vibration (Mn–O) of Mn2O3, respectively, while the peak at 529 cm−1 is caused by the bending vibration (Mn–O) of Mn2O3 [36]. Co3O4 nanofibers exhibit strong absorption peaks at 666 and 573 cm−1, which is related to the tensile vibration of the Co–O band [37]. The single peak at 466 cm−1 in NiO nanofibers and 437 cm−1 in ZnO nanofibers can be assigned to Ni–O and Zn–O vibrational peaks respectively [38,39]. In brief, it can be seen that nanocrystalline metal oxide nanofibers are formed by calcination.

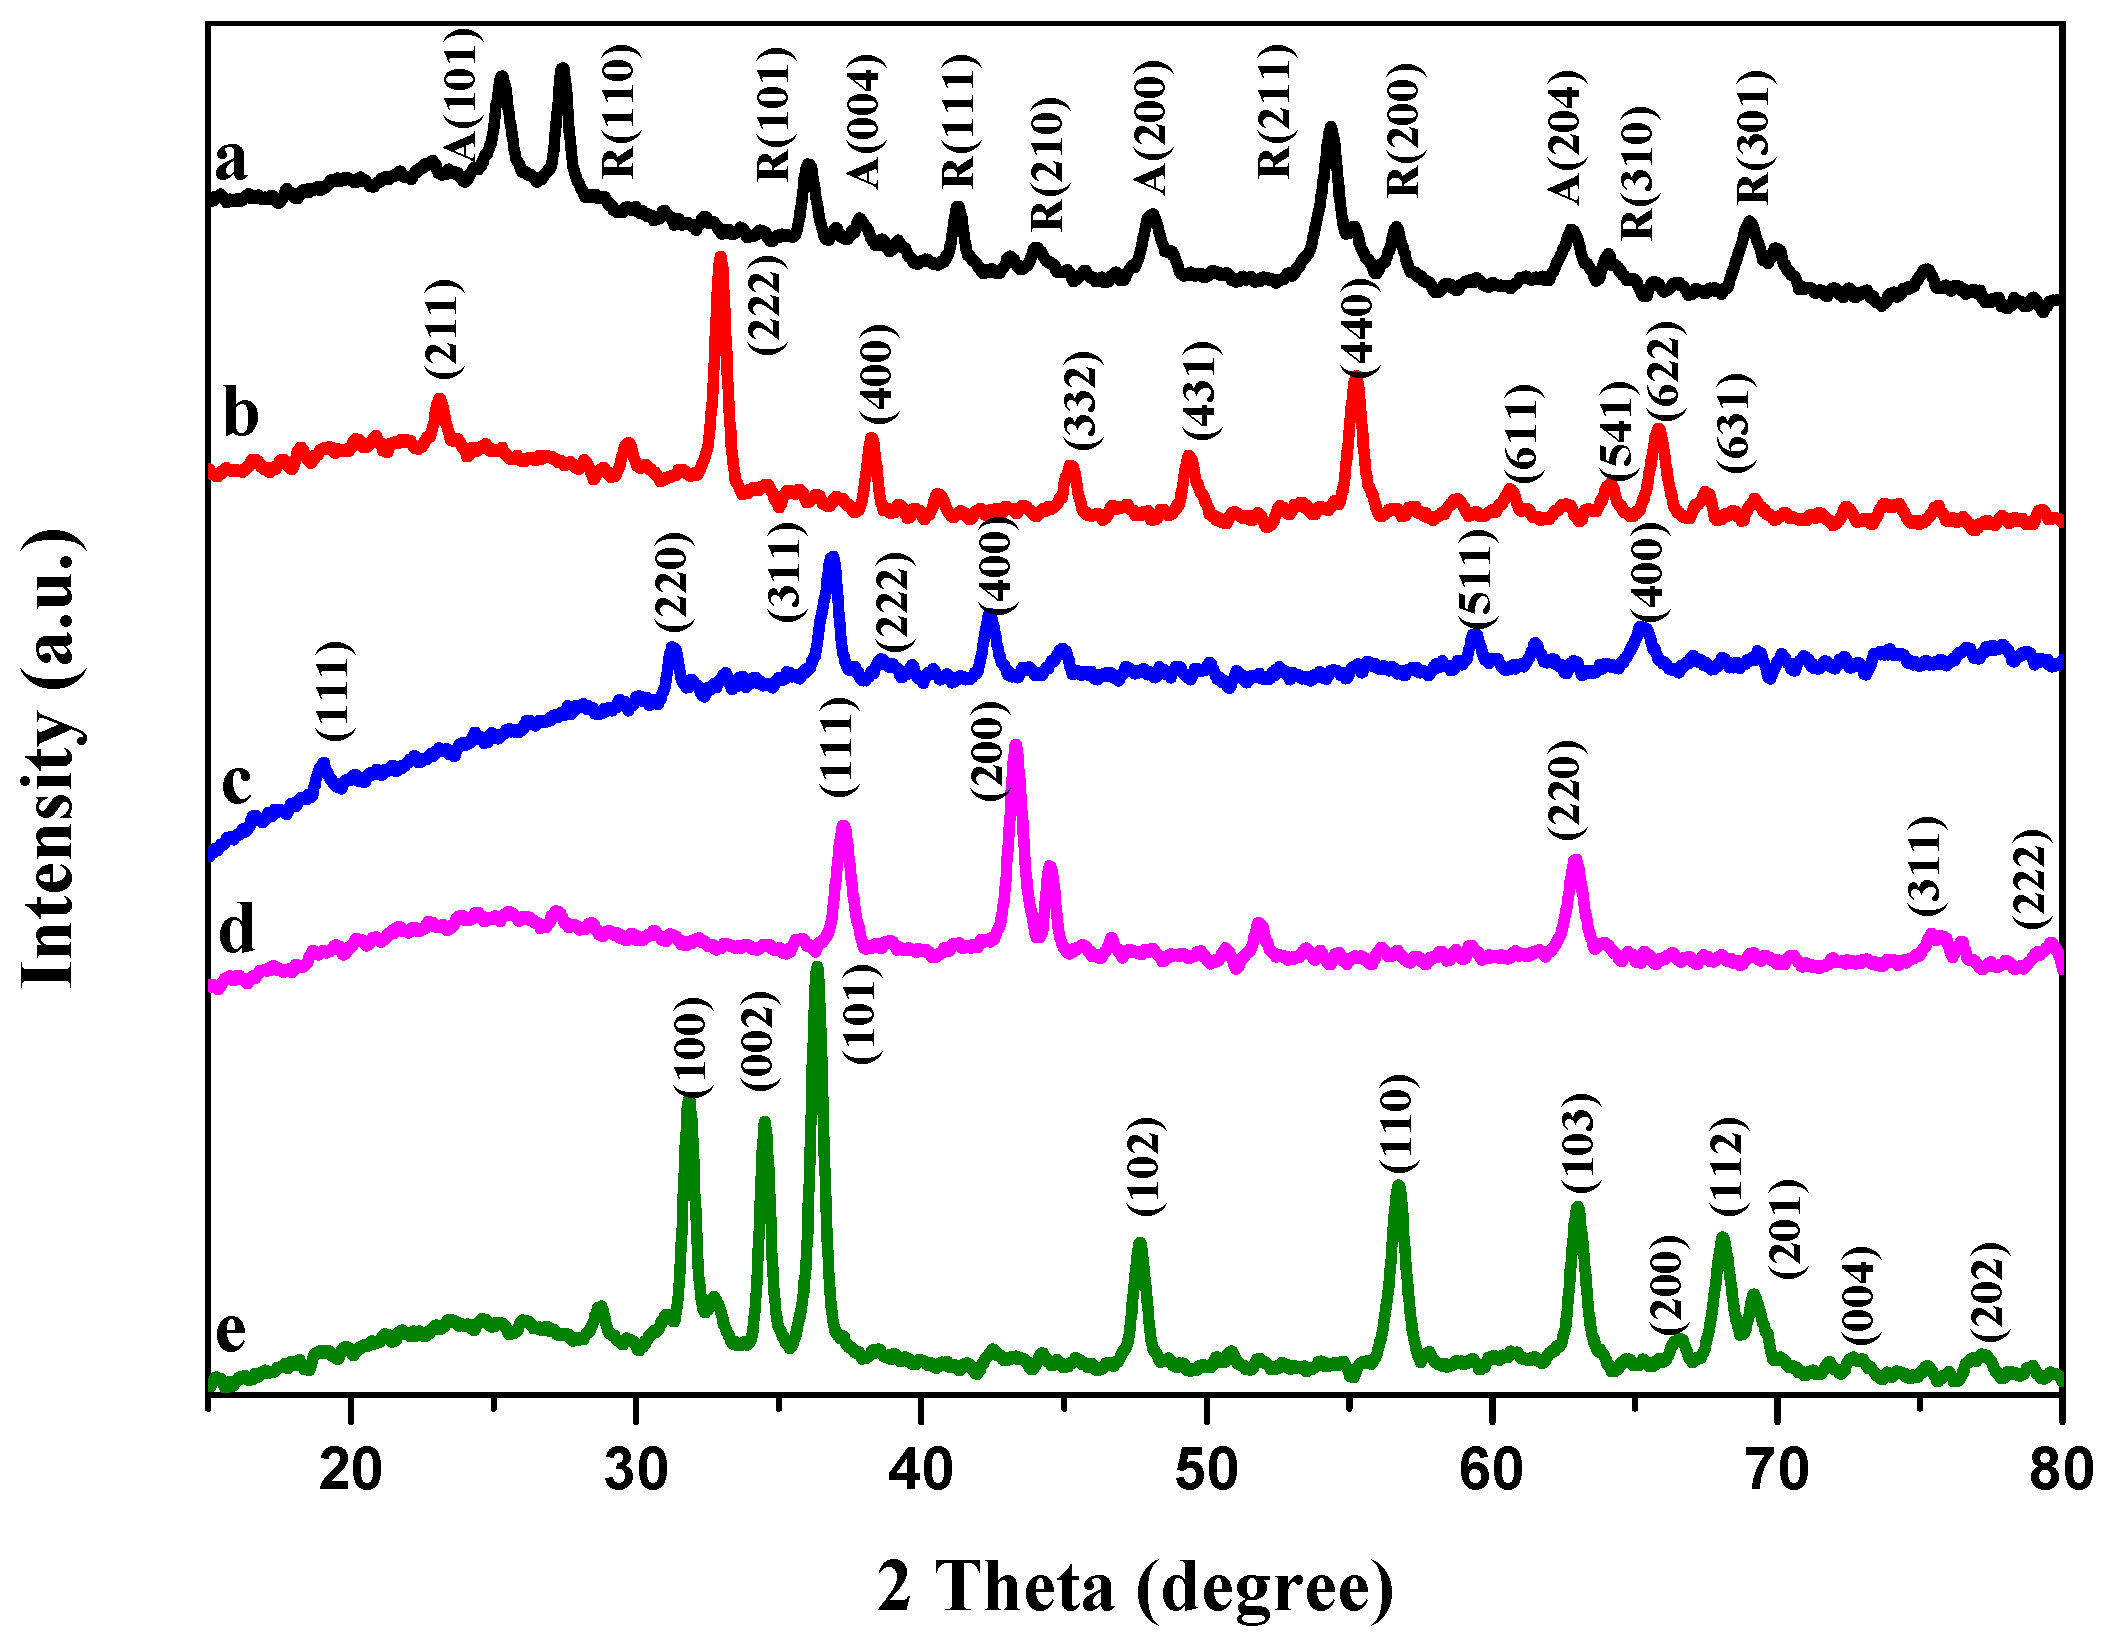
3.3. XRD Characterization of TiO2, Mn2O3, Co3O4, NiO and ZnO Nanofibers

For determining the crystalline phase of the calcined nanofibers, the samples were characterized by XRD. Figure 5a–e represents TiO2, Mn2O3, Co3O4, NiO and ZnO nanofibers, respectively. It indicates that diffraction peaks appearing at 2θ of 25.3°, 37.9°, 48.1° and 62.9° in the XRD pattern are well attributed to the anatase phase with a tetragonal structure of TiO2 (JCPDS card no. 21-1272), corresponding to its (101), (004), (200) and (204) facets, respectively. In addition, the peaks at 2θ of 27.4°, 36.1°, 41.2°, 44.0°, 54.4°, 56.6°, 64.0° and 69.0° in the XRD pattern belong to the tetragonal rutile phase of TiO2. This reveals that there were two kinds of crystal forms in the obtained TiO2 nanofibers. As shown in Figure 5b, the formation of Mn2O3 is revealed by the diffraction peaks at 2θ values of 23.2°, 33.0°, 38.3°, 45.4°, 49.4°, 55.2°, 60.7°, 64.1°, 65.9° and 67.6° corresponding to the (211), (222), (400), (332), (431), (440), (611), (541), (622) and (631) crystal planes of Mn2O3 (JCPDS card no. 41-1142), respectively [36]. As observed in Figure 5c, all diffraction peaks are well indexed to pure Co3O4 with the structure of JCPDS card no. 65-3103, where the diffraction peaks at 2θ values of 18.9°, 31.3°, 36.9°, 38.6°, 44.9°, 59.4° and 65.3° are ascribed to the reflections of (111), (220), (311), (222), (400), (511) and (440) planes of the Co3O4, respectively [40]. Figure 5d,e indicate the phase of NiO and ZnO. The formation of NiO is revealed by the diffraction peaks at 2θ values of 37.3°, 43.3°, 62.9°, 75.3° and 79.2° corresponding to (111), (200), (220), (311) and (222) crystal planes of NiO, respectively [41], while the diffraction peaks at 2θ values of 31.9°, 34.5°, 36.4°, 47.7°, 56.7°, 63.1°, 66.2°, 68.0°, 69.2°, 72.6° and 77.3° correspond to (100), (002), (101), (102), (110), (103), (200), (112), (201), (004) and (202) crystal planes of ZnO, respectively [42].
In addition, to verify the XRD results, the HRTEM diagrams of the nanofibers are shown in Figure 3a’–e’ respectively. As presented in Figure 3a’, the interplanar distances between lattice fringes of 0.350 nm and 0.327 nm correspond to the anatase phase (101) and the tetragonal rutile phase (110) in TiO2, respectively. The lattice fringes with a spacing of 0.276 nm can be clearly observed in Figure 3b’, which is in agreement with the spacing of (222) planes of Mn2O3. Figure 3c’ shows clear lattice fringes of 0.279 nm corresponding to the crystallographic (111) plane of Co3O4, which indicates that the sample was structurally uniform and well crystallized. As shown in Figure 3d’,e’, the interplanar distances between lattice fringes of 0.240 and 0.279 nm correspond to the facet (101) of NiO and the facet (110) of ZnO, respectively. The results of XRD and HRTEM analysis suggest that the calcined nanofibers are composed of metal oxide nanocrystals.

3.4. N2 Adsorption-Desorption Isotherms and Pore Size Distribution of TiO2, Mn2O3, Co3O4, NiO and ZnO Nanofibers

To characterize these porous nanofibers further, the N2 adsorption-desorption isotherms and the pore diameter distributions of all the samples are shown in Figure 6, and a summary of the specific surface area, pore volume and average pore diameter data is shown in Table 2. According to the classification of international union of pure and applied chemistry (IUPAC), all the samples exhibit characteristic type IV isotherms with H3-type hysteresis loops, indicating the presence of uniform microporous structure. The pore size distributions of TiO2, Mn2O3, Co3O4, NiO and ZnO nanofibers are 3.823, 3.820, 3.834, 3.816 and 3.407, respectively, which is consistent with the pore size distributions of the corresponding samples obtained from the desorption data of isotherms. The pore volume of the TiO2, Mn2O3, Co3O4, NiO and ZnO nanofibers are 0.079, 0.072, 0.082, 0.328 and 0.081 m3/g, respectively, and the specific areas are 121.445, 18.600, 52.717, 393.645 and 57.219 m2/g, respectively. Obviously, NiO nanofibers have the largest specific surface area compared with other nanofibers, which agrees with the result of the TEM. The specific surface area ascribes to the porous structure and the small particle size [43,44,45], and the smaller the particle size, the larger specific surface area. Therefore, among the five nanofibers, the NiO nanofibers with the smallest particle size (10 nm) have the largest specific surface area (393.645 m2/g).

3.5. Possible Mechanism Analysis of Metal. Oxide Nanofibers

In order to explore the formation mechanism of nanocrystalline metal oxide nanofibers, TGA experiments of each nanofiber were evaluated in air. As shown in Figure 7, the five nanofibers are roughly divided into three stages during the calcination process from 35 to 500 °C. The first stage is at about 35–180 °C, and in this stage, the weight loss is relatively small (<10%), mainly caused by the residual organic reagents in the nanofiber and the evaporation of water. The second stage is at approximately 150–350 °C, which is caused by the decomposition of acetate and the side chain of PVP. The third stage is at 350–500 °C, which is mainly caused by the decomposition of residual PVP and crystal formation [46]. The specific data are shown in Table 3. On the basis of the aforementioned experimental analysis, a possible formation mechanism of the nanocrystalline metal oxide nanofibers can be explained as follows. During the calcination process, the PVP in the nanofiber will undergo intermolecular and intramolecular thermal decomposition and be accompanied by nucleation and growth of grains, which will result in a corresponding change in surface morphology. Specifically, when the temperature rises above the decomposition point of organometallic salts, a small amount of metastable nucleations appears in the amorphous region due to the low concentration of metal ions in the nanofibers, and the nanocrystal grains with smaller size are formed as the surrounding atoms are adsorbed to the crystal nucleus. At this time, the PVP molecules become flexible but do not decompose, so the small nanocrystal grains will move gently with the PVP molecules. As the probability of the movement toward each orientation is equivalent, the particles are uniformly dispersed in the PVP nanofibers. Then, when the temperature continues to increase, the PVP molecules move dramatically and begin to decompose, which is the main reason for the bending of the calcined nanofibers. At this moment, the newly formed nanocrystal grains grow larger, and have a better crystallinity. Furthermore, due to the limitation of the one-dimensional morphology of nanofibers, the annexation and growth of the grains can be limited in the axial direction of the nanofibers that retain the morphology of the original shape. Finally, when the PVP molecules are completely decomposed, the grains become coarser and connected with each other in the process of heat preservation, and the nanocrystalline metal oxide nanofibers with porous structure are finally formed. It is worth noting that according to the analysis of the above process, temperature plays a crucial role. As shown in Figure 2a’,e’, the obtained TiO2 and ZnO nanofibers are curled irregularly and are uneven in thickness, which may be due to the dramatic movement, collapse and adhesion of PVP caused by the excessive temperature rise. In addition, the appearance of two crystal forms of TiO2 is also related to temperature. TiO2 is mainly composed of the anatase phase at a relatively low temperature stage. When the temperature is elevated, the anatase phase is unstable and then gradually converted into the rutile phase [47].

3.6. Photocatalytic Activities of Metal Oxide Nanofibers

Finally, in order to verify the excellent properties of the prepared nanocrystalline metal oxide nanofibers, the photocatalytic experiments were carried out. Figure 8a–e presents the absorption spectra of MB aqueous solution in the presence of the ZnO, TiO2, NiO, Mn2O3 and Co3O4 nanofibers under exposure to UV light for different durations. In Figure 8a–c, with the increase of the irradiation time, the absorption peak corresponding to MB at 664 nm diminishes gradually, testifying the degradation of MB. It indicates that MB can be degraded by ZnO, TiO2 and NiO nanofibers, respectively. However, the absorption peak of MB remained relatively unchanged in Figure 8d,e, indicating that Mn2O3 and Co3O4 could not induce the degradation of MB. As shown in Figure 8f, under dark conditions, MB dye was decolorized about 3.7%, 5.5% and 4.5% in the presence of ZnO, TiO2, NiO nanofibers due to adsorption of the dye. After irradiation with UV light for 150 min, 97.6% of MB was decomposed by using the ZnO nanofiber as the photocatalyst, while at the same time TiO2 and NiO nanofiers revealed 93.8% and 86.7% degradation. Table 4 shows a summary of TiO2, ZnO and NiO nanofibers employed in the photocatalysis of a wide range of dyes and pollutants. The results indicate that the prepared TiO2, ZnO and NiO nanofibers in the paper have good photocatalytic properties, especially NiO nanofibers.
In order to further investigate the photocatalytic activities of these samples, the photocatalytic degradation kinetics were analyzed. From Figure 9a, the samples exhibit a good linear relationship between ln(C/C0) and irradiation time t. The reaction rate constants (slope of the fitting line) of ZnO, TiO2 and NiO nanofibers are 0.02447, 0.01874 and 0.01269 min−1, respectively. In addition, the recycle ability of ZnO, TiO2 and NiO nanofibers were also studied (Figure 9b), after the third recycle, the photocatalytic efficiency remains 95.9%, 87.1% and 65.4%, respectively, which indicates that ZnO and TiO2 nanofibers have an excellent catalytic cycling ability. Many researchers have explained the mechanism of photolysis [55,56,57,58]: when the ZnO, TiO2 and NiO are excited by UV light with energy higher than or equal to their band gaps, electrons (e) in the valence band (VB) can be excited to the conduction band (CB), leaving corresponding holes (h+) in the VB. Photogenerated electrons (e) on the surface of nanoparticles are easily captured by electronic acceptors such as oxygen dissolved in water to form superoxide radicals (·O2). At the same time, photo-induced holes (h+) can oxidize the organic chemicals adsorbed on the surface of metal oxides or be trapped by electronic donors like OH and H2O to produce ·OH. The oxidation ability of ·OH and ·O2 are very strong, which can make the combination bond of various organic compounds break, so that MB can be oxidized to obtain CO2 and H2O. The process is as follows:
TiO2 + hv → h+ + e
h+ + OH → ·OH
h+ + H2O → ·OH + H+
e + O2 → ·O2
H2O + ·O2 → HO2· + OH
HO2· + H2O → H2O2 + ·OH
H2O2 + e → ·OH + OH
H2O2 + ·O2→ ·OH + OH + O2
·OH + MB → intermediates → CO2 + H2O
Furthermore, it should be pointed out that the photocatalytic degradation is actually a free radical reaction. The photodegradation efficiency is mainly due to electron-hole pair recombination inhibition by charge transfer processes. In the previous study, the particle sizes of Co3O4 and Mn2O3 were relatively large. When Co3O4 and Mn2O3 are excited by UV light, electrons (e) are easily recombined with holes (h+) in the process of reaching the conduction band and starting to move toward the surface of the particles, which are emitted in the form of heat [59]. Therefore, ·OH and ·O2 cannot be formed in this process, so methyl blue cannot be degraded by Co3O4 and Mn2O3 nanofibers.

4. Conclusions

In this study, five nanocrystalline first transition-metal (Ti, Mn, Co, Ni and Zn) oxide nanofibers with regular microstructure and lattice structures were fabricated by electrospinning and controlled calcination. The obtained nanofibers composed of metal oxide nanocrystals have continuously twisted three-dimensional scaffold structures. Metal oxide nanocrystals with a grain size lower than 100 nm grow uniformly and orderly along the original nanofiber direction, showing a high individual independence and spatial orientation. The special structure can effectively prevent their own aggregation. Moreover, the calcined nanofibers have a high specific surface area and uniform porous structure, which follow the order of NiO nanofiber (393.645 m2/g) > TiO2 nanofiber (121.445 m2/g) > ZnO nanofiber (57.219 m2/g) > Co3O4 nanofiber (52.717 m2/g) > Mn2O3 nanofiber (18.600 m2/g). Due to these special structures, the nanofibers expose many active sites, which can effectively improve the application performance. In addition, we used nanofibers to perform a photocatalytic reaction of methyl orange, which shows that ZnO, TiO2 and NiO nanofibers have excellent catalytic activity and catalytic cycling. Therefore, we have reason to believe that nanocrystalline metal oxides nanofibers prepared by electrospinning and controlled calcination could have excellent properties in their respective fields.

Author Contributions

W.L., Y.G., Y.C. conceived and designed the experiments; Y.C., Y.Z., W.L., Y.S. performed the experiments and analyzed the data; H.L. contributed reagents/materials/analysis tools; Y.C., W.L. wrote the paper.

Funding

This work was supported by State Natural Sciences Fund, China (Project No. 21506236, 51372276), Research and Application of Gelatin Green Manufacturing 2.0 Technology by Enzymatic method (KFJ-STS-ZDTP-016) and Hangzhou Research Institute of Technical Institute of Physics and Chemistry, CAS Fund (Project No. 2016050201, 2016050202).

Conflicts of Interest

The authors declare no conflicts of interest.

References

  1. Lee, S.K.; Park, Y.; Kim, J. Thermoresponsive Behavior of Magnetic Nanoparticle Complexed pNIPAm-co-AAc Microgels. Appl. Sci. 2018, 8, 1984. [Google Scholar] [CrossRef]
  2. Huang, Y.W.; Wu, C.H.; Aronstam, R.S. Toxicity of transition metal oxide nanoparticles: Recent insights from in vitro studies. Materials 2010, 3, 4842–4859. [Google Scholar] [CrossRef] [PubMed]
  3. Uppuluri, R.; Sen, A.G.; Rosas, A.S.; Mallouk, T.E. Soft chemistry of ion-exchangeable layered metal oxides. Chem. Soc. Rev. 2018, 47, 2401–2430. [Google Scholar] [CrossRef] [PubMed]
  4. Sun, M.H.; Huang, S.Z.; Chen, L.H.; Li, Y.; Yang, X.Y.; Yuan, Z.Y.; Su, B.L. Applications of hierarchically structured porous materials from energy storage and conversion, catalysis, photocatalysis, adsorption, separation, and sensing to biomedicine. Chem. Soc. Rev. 2016, 45, 3479–3563. [Google Scholar] [CrossRef] [PubMed]
  5. Shen, Y.F. Carbothermal synthesis of metal-functionalized nanostructures for energy and environmental applications. J. Mater. Chem. A 2015, 3, 13114–13188. [Google Scholar] [CrossRef]
  6. Orozco, R.D.M.; López, R.A.; González, V.R. Hydrogen-gas sensors based on graphene functionalized palladium nanoparticles: Impedance response as a valuable sensor. New J. Chem. 2015, 39, 8044–8054. [Google Scholar] [CrossRef]
  7. Hlekelele, L.; Franklyn, P.J.; Dziike, F.; Durbach, S.H. Novel synthesis of Ag decorated TiO2 anchored on zeolites derived from coal fly ash for the photodegradation of bisphenol-A. New J. Chem. 2018, 42, 1902–1912. [Google Scholar] [CrossRef]
  8. Jiang, X.; Yu, L.; Yao, C.; Zhang, F.; Zhang, J.; Li, C. Synthesis and characterization of Gd2O3 hollow microspheres using a template-directed method. Materials 2016, 9, 323. [Google Scholar] [CrossRef]
  9. Wojnarowicz, J.; Chudoba, T.; Gierlotka, S.; Lojkowski, W. Effect of Microwave Radiation Power on the Size of Aggregates of ZnO NPs Prepared Using Microwave Solvothermal Synthesis. Nanomaterials 2018, 8, 343. [Google Scholar] [CrossRef]
  10. Schmidt, D.; Raab, N.; Santhanam, V.; Dittmann, R.; Noyong, M.; Simon, U. Resistive switching of sub-10 nm TiO2 nanoparticle self-assembled monolayers. Nanomaterials 2017, 7, 370. [Google Scholar] [CrossRef]
  11. Woo, H.S.; Chan, W.N.; Lee, J.H. Design of Highly Selective Gas Sensors via Physicochemical Modification of Oxide Nanowires: Overview. Sensors 2016, 16, 1531. [Google Scholar] [CrossRef] [PubMed]
  12. Purbia, R.; Paria, S. Yolk/shell nanoparticles: Classifications, synthesis, properties, and applications. Nanoscale 2015, 7, 19789–19873. [Google Scholar] [CrossRef] [PubMed]
  13. Lin, S.J.; Zhao, Y.; Xia, T.; Meng, H.; Ji, Z.X.; Liu, R.; George, S.; Xiong, S.J.; Wang, X.; Zhang, H.Y.; et al. High content screening in zebrafish speeds up hazard ranking of transition metal oxide nanoparticles. ACS Nano 2011, 5, 7284–7295. [Google Scholar] [CrossRef] [PubMed]
  14. Duan, Z.W.; He, H.L.; Liang, W.Y.; Wang, Z.Q.; He, L.; Zhang, X.H. Tensile, Quasistatic and Dynamic Fracture Properties of Nano-Al2O3-Modified Epoxy Resin. Materials 2018, 11, 905. [Google Scholar] [CrossRef] [PubMed]
  15. Guo, X.T.; Zhang, G.X.; Li, Q.; Xue, H.G.; Pang, H. Non-noble Metal-Transition Metal Oxide Materials for Electrochemical Energy Storage. Energy Storage Mater. 2018, 15, 171–201. [Google Scholar] [CrossRef]
  16. Xu, F.; HO, H.P. Light-activated metal oxide gas sensors: A review. Micromachines 2017, 8, 333. [Google Scholar] [CrossRef]
  17. Zhai, T.; Fang, X.; Liao, M.; Xu, X.; Zeng, H.; Yoshio, B.; Golberg, D. A comprehensive review of one-dimensional metal-oxide nanostructure photodetectors. Sensors 2009, 9, 6504. [Google Scholar] [CrossRef]
  18. Ditaranto, N.; Basoli, F.; Trombetta, M.; Cioffi, N.; Rainer, A. Electrospun Nanomaterials Implementing Antibacterial Inorganic Nanophases. Appl. Sci. 2018, 8, 1643. [Google Scholar] [CrossRef]
  19. Fu, Y.; Liu, L.; Cheng, R.; Cui, W. ECM decorated electrospun nanofiber for improving bone tissue regeneration. Polymers 2018, 10, 272. [Google Scholar] [CrossRef]
  20. Shafiei, M.; El-chami, I.; Rintoul, L.; Bahreyni, B. Morphology of electrospun poly(ethylene oxide) ultra-fine fibres with incorporated MoO3 nanoparticles. Mater. Des. 2017, 113, 76–83. [Google Scholar] [CrossRef]
  21. Ramakrishnan, R.; Sundarrajan, S.; Rajen, J.; Ramakrishna, S. Nanostructured Ceramics by Electrospinning. J. Appl. Phys. 2007, 102, 111101. [Google Scholar]
  22. Yu, Z.; Fang, Y.; Huang, M.; Li, R.; Zhan, J.; Zhou, C.; He, G.; Xia, H. Preparation of a liquid boron-modified polycarbosilane and its ceramic conversion to dense SiC ceramics. Polym. Adv. Technol. 2011, 22, 2409–2414. [Google Scholar] [CrossRef]
  23. Jiang, Y.; Song, N.; Wang, C.; Pinna, N.; Lu, X. Facile synthesis of Fe3O4/nitrogen-doped carbon hybrid nanofibers as a robust peroxidase-like catalyst for sensitive colorimetric detection of ascorbic acid. J. Mater. Chem. B 2017, 5, 5499–5505. [Google Scholar] [CrossRef]
  24. Kim, J.H.; Lee, J.H.; Kim, J.Y.; Sang, S.K. Synthesis of aligned TiO2 nanofibers using electrospinning. Appl. Sci. 2018, 8, 309. [Google Scholar] [CrossRef]
  25. Xue, H.; Wang, T.; Gong, H.; Guo, H.; Fan, X.; Song, L.; Xia, W.; Feng, Y.; He, J. Co3O4 nanoparticle-decorated n-doped mesoporous carbon nanofibers as an efficient catalyst for oxygen reduction reaction. Catalysts 2017, 7, 189. [Google Scholar] [CrossRef]
  26. Wang, D.; Astruc, D. The recent development of efficient Earth-abundant transition-metal nanocatalysts. Chem. Soc. Rev. 2017, 46, 816. [Google Scholar] [CrossRef] [PubMed]
  27. Wujcik, E.K.; Aceto, S.R.; Heskett, D.; Bose, A. Synthesis of Co-Electrospun Lead Selenide Nanostructures within Anatase Titania Nanotubes for Advanced Photovoltaics. Fibers 2015, 3, 173–183. [Google Scholar] [CrossRef] [Green Version]
  28. Zhang, L.; Zhang, Q.H.; Xie, H.Y.; Guo, J.; Lyu, H.L.; Li, Y.G.; Sun, Z.G.; Wang, H.Z.; Guo, Z.H. Electrospun titania nanofibers segregated by graphene oxide for improved visible light photocatalysis. Appl. Catal. B Environ. 2017, 201, 470–478. [Google Scholar] [CrossRef]
  29. Liu, Y.; Liu, Y.; Zhang, C.; Tan, H.; Yan, X.; Wei, H.; Guo, Z. Hyperbranched polyester-stabilized nanotitania-coated vectran fibers with improved UV-blocking performance. Macromol. Mater. Eng. 2015, 300, 64–69. [Google Scholar] [CrossRef]
  30. Singh, P.; Mondal, K.; Sharma, A. Reusable electrospun mesoporous ZnO nanofiber mats for photocatalytic degradation of polycyclic aromatic hydrocarbon dyes in wastewater. J. Colloid Interface Sci. 2013, 394, 208–215. [Google Scholar] [CrossRef]
  31. Singh, N.; Mondal, K.; Misra, M.; Sharma, A.; Gupta, R.K. Quantum dot sensitized electrospun mesoporous titanium dioxide hollow nanofibers for photocatalytic applications. RSC Adv. 2016, 6, 48109–48119. [Google Scholar] [CrossRef] [Green Version]
  32. Matmin, J.; Affendi, I.; Ibrahim, S.I.; Endud, S. Additive-Free Rice Starch-Assisted Synthesis of Spherical Nanostructured Hematite for Degradation of Dye Contaminant. Nanomaterials 2018, 8, 702. [Google Scholar] [CrossRef]
  33. Chen, C.H.; Chen, S.H.; Kuo, C.Y.; Li, M.L.; Chen, J.P. Response of dermal fibroblasts to biochemical and physical cues in aligned polycaprolactone/silk fibroin nanofiber scaffolds for application in tendon tissue engineering. Nanomaterials 2017, 7, 219. [Google Scholar] [CrossRef] [PubMed]
  34. Lee, P.J.; Saion, E.; Alhada, N.M.; Soltani, N. A simple up-scalable thermal treatment method for synthesis of zno nanoparticles. Metals 2015, 5, 2383–2392. [Google Scholar] [CrossRef]
  35. Zheng, M.; Gu, M.; Jin, Y.; Jin, G. Preparation, structure and properties of TiO2-PVP hybrid films. Mat. Sci. Eng. B 2000, 77, 55–59. [Google Scholar] [CrossRef]
  36. Cao, H.; Wu, X.; Wang, G.; Yin, J.; Yin, G.; Zhang, F.; Liu, J.K. Biomineralization strategy to α-Mn2O3 hierarchical nanostructures. J. Phys. Chem. C 2012, 116, 21109–21115. [Google Scholar] [CrossRef]
  37. Kumar, M.; Subramania, A.; Balakrishnan, K. Preparation of electrospun Co3O4 nanofibers as electrode material for high performance asymmetric supercapacitors. Electrochim. Acta 2014, 149, 152–158. [Google Scholar] [CrossRef]
  38. Soleimanpour, A.M.; Khare, S.V.; Jayatissa, A.H. Enhancement of hydrogen gas sensing of nanocrystalline nickel oxide by pulsed-laser irradiation. ACS Appl. Mater. Inter. 2012, 4, 4651–4657. [Google Scholar] [CrossRef]
  39. Xiong, G.; Pal, U.; Serrano, J.G.; Ucer, K.B.; Williams, R.T. Photoluminesence and ftir study of ZnO nanoparticles: The impurity and defect perspective. Phys. Status Solidi 2010, 3, 3577–3581. [Google Scholar] [CrossRef]
  40. Gong, Y.; Wang, Y.; Sun, G.; Jia, T.; Jia, L.; Zhang, F.; Lin, L.; Zhang, B.; Cao, J.; Zhang, Z. Carbon nitride decorated ball-flower like Co3O4 hybrid composite: Hydrothermal synthesis and ethanol gas sensing application. Nanomaterials 2018, 8, 132. [Google Scholar] [CrossRef]
  41. Naseri, M.; Dehzangi, A.; Kamari, H.; See, A.; Abedi, M.; Salasi, R.; Goli-Kand, A.N.; Dianat, P.; Larki, F.; Abedini, A.; et al. Structure and physical properties of NiO/Co3O4 nanoparticles. Metals 2016, 6, 181. [Google Scholar] [CrossRef]
  42. Ran, J.; He, M.; Li, W.; Cheng, D.; Wang, X. Growing ZnO nanoparticles on polydopamine-templated cotton fabrics for durable antimicrobial activity and UV protection. Polymers 2018, 10, 495. [Google Scholar] [CrossRef]
  43. Chen, X.; Zhang, F.; Wang, Q.; Han, X.; Li, X.; Liu, J.Y.; Lin, H.M.; Qu, F.Y. The synthesis of ZnO/SnO2 porous nanofibers fordye adsorption and degradation. Dalton Trans. 2015, 44, 3034–3042. [Google Scholar] [CrossRef] [PubMed]
  44. Zeng, Q.X.; Xu, G.C.; Zhang, L.; Lin, H.; Lv, Y.; Jia, D.Z. Porous CuO nanofibers derived from a Cu-based coordination polymer as a photocatalyst for the degradation of rhodamine B. New J. Chem. 2018, 42, 7016–7024. [Google Scholar] [CrossRef]
  45. Zhao, B.; Deng, J.H.; Liang, L.Y.; Zuo, C.Y.X.; Bai, Z.Y.; Guo, X.Q.; Zhang, R. Lightweight porous Co3O4 and Co/CoO nanofibers with tunable impedance match and configuration-dependent microwave absorption properties. CrystEngComm 2017, 19, 6095–6106. [Google Scholar] [CrossRef]
  46. Kuchi, C.; Harish, G.S.; Reddy, P.S. Effect of polymer concentration, needle diameter and annealing temperature on TiO2-PVP composite nanofibers synthesized by electrospinning technique. Ceram. Int. 2018, 44, 5266–5272. [Google Scholar] [CrossRef]
  47. Santos, A.M.C.; Mota, M.F.; Leite, R.S.; Neves, G.A.; Medeiros, E.S.; Menezes, R.R. Solution blow spun titania nanofibers from solutions of high inorganic/organic precursor ratio. Ceram. Int. 2018, 44, 1681–1689. [Google Scholar] [CrossRef]
  48. Yar, A.; Haspulat, B.; Üstün, T.; Eskizeybek, V.; Avcı, A.; Kamış, H.; Achour, S. Electrospun TiO2/ZnO/PAN hybrid nanofiber membranes with efficient photocatalytic activity. RSC Adv. 2017, 7, 29806–29814. [Google Scholar] [CrossRef]
  49. Nasr, M.; Soussan, L.; Viter, R.; Eid, C.; Habchi, R.; Miele, P.; Bechelany, M. High photodegradation and antibacterial activity of BN-Ag/TiO2 composite nanofibers under visible light. New J. Chem. 2018, 42, 1250–1259. [Google Scholar] [CrossRef]
  50. Liang, Y.; Zhou, B.; Li, N.; Liu, L.; Xu, Z.; Li, F.; Li, J.; Mai, W.; Qian, X.; Wu, N. Enhanced dye photocatalysis and recycling abilities of semi-wrapped TiO2@carbon nanofibers formed via foaming agent driving. Ceram. Int. 2018, 44, 1711–1718. [Google Scholar] [CrossRef]
  51. Liu, L.; Liu, Z.; Yang, Y.; Geng, M.; Zou, Y.; Shahzad, M.B.; Dai, Y.; Qi, Y. Photocatalytic properties of Fe-doped ZnO electrospun nanofibers. Ceram. Int. 2018, 44, 19998–20005. [Google Scholar] [CrossRef]
  52. Li, J.; Zhao, F.; Zhang, L.; Zhang, M.; Jiang, H.; Li, S.; Li, J. Electrospun hollow ZnO/NiO heterostructures with enhanced photocatalytic activity. RSC Adv. 2015, 5, 67610–67616. [Google Scholar] [CrossRef]
  53. Zhang, Z.; Shao, C.; Li, X.; Wang, C.; Zhang, M.; Liu, Y. Electrospun nanofibers of p-type NiO/n-type ZnO heterojunctions with enhanced photocatalytic activity. ACS Appl. Mater. Interfaces 2010, 2, 2915–2923. [Google Scholar] [CrossRef] [PubMed]
  54. Yang, Z.M.; Hou, S.C.; Huang, G.F.; Duan, H.G.; Huang, W.Q. Electrospinning preparation of p-type NiO/n-type CeO2 heterojunctions with enhanced photocatalytic activity. Mater. Lett. 2014, 133, 109–112. [Google Scholar] [CrossRef]
  55. Chen, X.J.; Gao, Y.N.; Liu, P. Effects of Nano-TiO2 Mediated Photocatalysis on Microcystis aeruginosa Cells. Appl. Sci. 2018, 8, 2073. [Google Scholar] [CrossRef]
  56. Mathew, S.; Ganguly, P.; Rhatigan, S.; Kumaravel, V.; Byrne, C.; Hinder, S.J.; Bartlett, J.; Nolan, M.; Pillai, S.C. Cu-Doped TiO2: Visible Light Assisted Photocatalytic Antimicrobial Activity. Appl. Sci. 2018, 8, 2067. [Google Scholar] [CrossRef]
  57. Hwang, S.H.; Kim, Y.K.; Song, H.Y.; Lim, S.K.; Park, H. ZnO rods rooted on manifold carbon nanofiber paper as a scalable photocatalyst platform: The effects of ZnO morphology. RSC Adv. 2016, 6, 85521–85528. [Google Scholar] [CrossRef]
  58. Inoue, Y. Photocatalytic water splitting by RuO2-loaded metal oxides and nitrides with d0- and d10 -related electronic configurations. Energy Environ. Sci. 2009, 2, 364–386. [Google Scholar] [CrossRef]
  59. Kumar, S.G.; Rao, K.S.R.K. Zinc oxide based photocatalysis: Tailoring surfacebulk structure and related interfacial charge carrier dynamics for better environmental applications. RSC Adv. 2015, 5, 3306–3351. [Google Scholar] [CrossRef]
Figure 1. Schematic illustration of the fabrication of nanocrystalline metal oxide nanofibers by electrospinning and controlled calcination.
Applsci 09 00008 g001
Figure 2. SEM (scanning electron microscope) images of the electrospun nanofiber (a) Ti(BuO)4/PVP, (b) Mn(Ac)2/PVP, (c) Co(Ac)2/PVP, (d) Ni(Ac)2/PVP, (e) Zn(Ac)2/PVP) and the nanofibers calcined at 500 °C (a’) TiO2 nanofiber, (b’) Mn2O3 nanofiber, (c’) Co3O4 nanofiber, (d’) NiO nanofiber, (e’) ZnO nanofiber).
Applsci 09 00008 g002
Figure 3. TEM and high resolution transmission electron microscopy (HRTEM) images of (a,a’) TiO2 nanofiber, (b,b’) Mn2O3 nanofiber, (c,c’) Co3O4 nanofiber, (d,d’) NiO nanofiber, (e,e’) ZnO nanofiber.
Applsci 09 00008 g003
Figure 4. FTIR spectra of (a) the as-spun nanofibers and (b) electrospun nanofibers calcined at 500 °C.
Applsci 09 00008 g004
Figure 5. X-ray diffraction (XRD) spectra of a: TiO2 nanofiber, b: Mn2O3 nanofiber, c: Co3O4 nanofiber, d: NiO nanofiber, e: ZnO nanofiber.
Applsci 09 00008 g005
Figure 6. (a) N2 adsorption-desorption isotherms and (b) pore diameter distribution of electrospun nanofibers calcined at 500 °C.
Applsci 09 00008 g006
Figure 7. Thermogravimetric analysis (TGA) curve of electrospun Ti(BuO)4/PVP, Mn(Ac)2/PVP, Co(Ac)2/PVP, Ni(Ac)2/PVP and Zn(Ac)2/PVP nanofibers.
Applsci 09 00008 g007
Figure 8. Adsorption spectra of methylene blue solution under UV light in the presence of (a) TiO2 nanofiber, (b) Mn2O3 nanofiber, (c) Co3O4 nanofiber, (d) NiO nanofiber, (e) ZnO nanofiber, and (f) photocatalytic MB dye degradation activity.
Applsci 09 00008 g008
Figure 9. (a) Fitted curves with pseudo-first order kinetic model of nanofibers under the UV light irradiation. (b) Three successive cycles of photocatalytic experiments under UV light irradiation.
Applsci 09 00008 g009
Table 1. The detailed parameters of the preparation of nanocrystalline first transition-metal (Ti, Mn, Co, Ni and Zn) oxide nanofibers.
NanofibersPVP/Ethanol (0.3 g/mL)Organometallic Salt (g)H2O (mL)Acetic Acid (mL)
TiO2143.0-2
Mn2O3142.02-
Co3O4142.02-
NiO141.32-
ZnO141.52-
Table 2. Specific area distribution, pore volume distribution and pore diameter distribution of the metal oxides nanofibers.
NanofibersTiO2Mn2O3Co3O4NiOZnO
Specific area (m2/g)121.44518.60052.717393.64557.219
Pore volume (m3/g)0.0790.0720.0820.3280.081
Pore diameter (nm)3.8233.8203.8343.8163.407
Table 3. Decomposition of fibers during calcination.
NanofibersFirst Stage:
Evaporation of Alcohol and Physisorbed Water
Second Stage 1:
Decomposition of Acetate and a Fraction of PVP
Third Stage: Decomposition of Residual PVP and the Formation of Crystals
T (°C)Weight Loss (%)T (°C)Weight Loss (%)T (°C)Weight Loss (%)
Mn2O335–1564.5156–33422.3334–50058.3
Co3O435–1738.5173–34432.3344–50047.2
NiO35–1806.8180–32845.9328–50040.8
ZnO35–1875.8135–34644.7346–60040.6
TiO235–1556.5155–28516.7285–50062.0
1 The second stage of TiO2 nanofiber is the decomposition of tetrabutyl titanate and a fraction of PVP.
Table 4. Summary of commonly employed TiO2, ZnO and NiO nanofibers for photocatalysis.
PhotocatalystsRaw Materials (Concentration)DyeLight SourceDegradation (%)Time
(min)
Ref.
TiO2 nanofiberTi rodsMalachite green (10−5 M)Ultraviolet lamp93%240[48]
TiO2 nanofiberTitanium tetraisopropoxide/PVPMethylene blue (20 mg/L)Visible light, 150 W25%80[49]
TiO2@CNFs nanofiberTiO2/polyacrylonitrile (PAN)Rhodamine (10 mg/L)Ultraviolet lamp, 25 0W98.2%60[50]
ZnO nanofiberZn(CH3COO)2·2H2O/polyvinyl alcohol (PVA)Methylene blue (10 mg/L)Mercury lamp, 5 0W50%360[51]
ZnO nanofiberZn rodsMalachite green (10−5 M)Ultraviolet lamp91%240[48]
ZnO nanofiberZnCl2/PVPMethylene blue (10 mg/L)Ultraviolet lamp, 500 W98.6%100[43]
NiO nanofiberNi(CH3COO)2·4H2O/polyethersulfone (PES)Methyl orange (10 mg/L)Ultraviolet lamp, 12 W40%150[52]
NiO nanofiberNi(CH3COO)2·4H2O/PANRhodamine B (10 mg/L)Ultraviolet lamp, 50 W46.2%50[53]
NiO nanofiberNi(CH3COO)2/PVPMethylene blue (10 mg/L)Ultraviolet lamp, 300 W47.3%80[54]

