A Hybrid Algorithm for Predicting Median-Plane Head-Related Transfer Functions from Anthropometric Measurements


1
School of Physics and Optoelectronics, South China University of Technology, Guangzhou 510641, China
2
School of Management, Guangdong University of Technology, Guangzhou 510520, China
*
Author to whom correspondence should be addressed.
Appl. Sci. 2019, 9(11), 2323; https://0-doi-org.brum.beds.ac.uk/10.3390/app9112323
Submission received: 22 March 2019
/
Revised: 23 May 2019
/
Accepted: 3 June 2019
/
Published: 5 June 2019
Abstract
:Since head-related transfer functions (HRTFs) represent the interactions between sounds and physiological structures of listeners, anthropometric parameters represent a straightforward way to customize (or predict) individualized HRTFs. This paper proposes a hybrid algorithm for predicting median-plane individualized HRTFs using anthropometric parameters. The proposed hybrid algorithm consists of three parts: decomposition of HRTFs; selection of key anthropometric parameters; and establishing a prediction formula. Firstly, an independent component analysis (ICA) is applied to median-plane HRTFs from multiple subjects to obtain independent components and subject-dependent weight coefficients. Then, a factor analysis is used to select key anthropometric parameters relevant to HRTFs. Finally, a regression formula that connects ICA weight coefficients to key anthropometric parameters is established by a multiple linear regression. Further, the effectiveness of the proposed hybrid algorithm is verified by an objective evaluation via spectral distortion and a subjective localization experiment. The results show that, when compared with generic Knowles Electronics Manikin for Acoustic Research (KEMAR) HRTFs, the spectral characteristics of the predicted HRTFs are closer to those of the individualized HRTFs. Moreover, the predicted HRTFs can alleviate front–back and up–down confusion and improve the accuracy of localization for most subjects.
1. Introduction
Three-dimensional spatial sound localization includes directional (i.e., azimuth and elevation) and distance localization. Lateral localization mainly depends on interaural differences, such as the interaural time difference (ITD) and the interaural sound level difference (ILD), caused by different transmission paths from sound sources to the left/right ear. Vertical localization, on the other hand, mainly relies on the change in the magnitude spectrum when sound waves propagate to the ears, that is, the spectral cue. Head-related transfer functions (HRTFs), defined as the system transfer function of the sound filter from a sound source to human eardrums in the frequency domain, include the aforementioned ITD, ILD, and spectral characteristics. One major application of binaural HRTFs is the creation of a virtual auditory display (VAD). A VAD can not only be used as an experimental platform in research of binaural hearing, but also has various applications in such fields as virtual reality, mobile communication, and multimedia [1,2,3]. From a physical point of view, HRTFs are closely related to human physiological structures. For example, different head sizes result in different levels of ITD, and different shapes and sizes of pinnae lead to different spectral characteristics. Therefore, HRTFs are individual-dependent, and each specific individual owns a specific set of HRTFs (individualized HRTFs). Previous literatures have reported that the use of non-individualized HRTFs in VADs, especially in the case of a static situation, often leads to a series of problems, such as increased front–back confusion and inside-of-head localization [4]. Therefore, to guarantee the authenticity of VADs, it is necessary to use individualized HRTFs for signal processing.
Acoustic measurement and numerical simulation are two primary approaches to obtain individualized HRTFs accurately [5,6,7,8,9,10,11]. However, acoustic measurement is time-consuming and requires a special apparatus; the calculation suffers from high requirements for computer performance and the scanning of physiological structures. Therefore, these two methods cannot support practical applications. In order to solve conflicts between the need for and acquisition of individualized HRTFs, researchers have proposed a method called the customization of individualized HRTFs. Customization (i.e., approximate acquisition) refers to simplifying the process of acquisition of individualized HRTFs as much as possible, while preserving individual auditory characteristics. As VADs have wide application, the customization of individualized HRTFs has attracted widespread attention.
Because HRTFs are closely related to individual physiological structures, HRTF customization based on anthropometric parameters is natural. Zotkin et al. [12] suggested that the similarity of anthropometric parameters between individuals corresponded to the similarity of their HRTFs. So, it is possible to select best-matching HRTFs from an HRTF baseline database according to the deviation in pinnae parameters. Then, subsequent studies on the optimization of matching parameters were carried out [13,14,15,16,17,18,19,20,21]. Zeng et al. [13] explored the statistical relationships between HRTF characteristic vectors and anthropometric parameters. Liu and Zhong [14] studied the similarity between anthropometric parameters, and proposed an improved database-matching method using four pinna-related anthropometric parameters. Iida et al. [15] first estimated the frequencies of the two lowest spectral notches (N1 and N2) by a listener’s pinnae anthropometry, and then selected the best-matching HRTFs, of which N1 and N2 were the closest to the estimates. Middlebrooks pointed out that the differences in anthropometric dimensions between individuals would cause the overall translation of HRTFs along with the frequency axis, and thus proposed a frequency-scaling method for customizing individualized HRTFs [16,17]. In the method, the optimal frequency scale factor inferred from the anthropometric parameters was applied to the known HRTFs to obtain the approximation of the individualized HRTFs. Generally, the current mainstream method is to use correlation analysis and multiple linear regression analysis to find anthropometric parameter sets that are closely related to HRTFs [18,19,20,21].
Data analysis methods have also been employed in the individualization of HRTFs. He et al. synthesized HRTFs using a sparse representation with different pre-processes and post-processes trained from anthropometric parameters [22]. Furthermore, the radial basis neural network has been utilized in HRTF estimation based on anthropometric parameters and achieved promising performance [23]. Qi et al. proposed a sparsity-constrained weight mapping to individualize HRTFs, which obtained optimal weights to combine HRTFs based on the relationships of anthropometric parameters between the trained subjects and the target subject [24]. Schönstein et al. used a reversive feature elimination support vector machine (RFE-SVM) to select anthropometric parameters [25].
Although the abovementioned studies have conducted beneficial research on HRTF customization, more sufficient methods are needed to customize HRTFs according to the essence of HRTF characteristics. In this work, a hybrid algorithm based on anthropometric parameters is proposed. In the method, decomposition of HRTFs is first performed using independent component analysis (ICA) to explore the independent characteristics of HRTFs. Then, the selection of key anthropometric parameters is implemented using a factor analysis to detect the inner structure among the anthropometric parameters. Finally, the establishment of a prediction formula is accomplished using multiple linear regression. In this study, median-plane HRTF prediction in the CIPIC database (Center for Image Processing and Integrated Computing, University of California) is used as an illustrative example. The rest of the paper is organized as follows. Section 2 discusses in detail the principle and effect of the proposed hybrid algorithm based on anthropometric parameters; Section 3 validates the effectiveness of the proposed algorithm using objective spectral distortion criteria and a subjective listening experiment. Section 4 summarizes the whole work.
2. Methodology
HRTFs, or their time-domain counterparts, head-related impulse responses (HRIRs), describe the transmission process of sound waves scattering and reflecting through the head, torso, and pinnae in the free field [1]. Usually, an HRTF is defined as
here PL and PR are the complex sound pressure produced by the sound source in the left and right ears of the listener, respectively; P0 is the complex sound pressure at the center of the head when the human head is absent; f is the sound frequency; and a represents HRTF-related anthropometric parameters. An interaural polar coordinate system is adopted in this paper. Sound localization is determined by azimuth θ (−90° ≤ θ ≤ 90°), elevation φ (−90° < φ ≤ 270°), and distance r.
Equation (1) shows that an HRTF is a multivariate function that includes spatial sound localization, frequency, etc. Therefore, it is necessary to employ an appropriate decomposition method to reduce the dimensions and extract characteristics. ICA is an effective method for decomposing large amounts of data, and has been widely used in brain/speech signal processing, wireless communication, feature extraction, data mining, fault diagnosis, and other fields [26]. ICA is based on a higher-order statistical analysis (such as kurtosis), and thus yields independent base-vectors. In the structural model of HRTFs, the effects of anatomical structures were classified into three independent sub-models: effects of the head model, effects of the torso model, and pinna models [27]. Moreover, Chen performed a division analysis on HRIRs, revealing head and pinna effects, torso reflection, and knee reflection [28]. The theory of the structure models and anatomical filters/effects provides the theoretical foundations for utilizing ICA for HRTF decomposition.
As shown in Figure 1, a variety of statistical methods are combined to establish a hybrid algorithm for the customization of individualized HRTFs based on anthropometric parameters. On the one hand, ICA decomposition is applied to the magnitude of HRTFs to obtain the independent components and individual-dependent weight coefficients. The individual-dependent weight coefficient is used as the dependent variable to establish the subsequent prediction formula. On the other hand, factor analysis is applied to all anthropometric parameters to remove redundancy between these parameters. As a result, key anthropometric parameters are selected as independent variables in the subsequent prediction formula. Finally, the prediction formula relating weight coefficients to key anthropometric parameters is established by a multiple linear regression analysis. In application scenarios, the individualized coefficient weights for a specific listener are determined by substituting the measured listener’s individualized anthropometric parameters into the proposed prediction formula. Then, the listener’s customized HRTF can be obtained by substituting the predicted weight coefficients into an ICA-based HRTF formula. This is the basic idea of the proposed hybrid algorithm for customization of individualized HRTFs from anthropometric measurements.
2.1. Independent Component Analysis of HRTFs
In the first step of the hybrid algorithm, ICA is applied to magnitudes of HRTFs to obtain independent components and weight coefficients. There are several algorithms to implement ICA. In order to achieve fast convergence, a fast fixed-point algorithm based on negative entropy maximization is adopted here (FastICA) [29]. The procedure is as follows:
Step 1: HRTF data of n subjects are denoted as Hn,m, where m represents the sum of the frequency and directions of HRTF. It should be pointed out that, in order to fully extract subject-relevant individualized characteristics, all subjects constitute a vector direction of the matrix, that is:
Hn,m = [H1 H2 H3 H4 … Hn].
Step 2: Centre (i.e., de-average) on Hn,m to obtain a new matrix
Step 3: Whiten (i.e., sphere) on ; here, we use principal component analysis (PCA) to obtain the direct result as
where Ʌ and U represent the eigenvector matrix and the eigenvalue matrix of the covariance matrix , respectively. That is, a whitened linear transformation V is computed to obtain the whitened matrix
V= Ʌ−1/2U
Step 4: Select the number d of independent components needed to be estimated.
Step 5: Initialize all random vectors Wi, i = 1, 2,…, d. Each of Wi has a unit norm and is chosen randomly. Then, perform orthogonal standardization to W = [W1 W2 W3 … Wd].
W ← (WW T)−1/2W
Step 6: For each i = 1, 2, …, d, update Wi using an approximate Newton iteration algorithm, where is the first derivative of the original .
Step 7: Perform orthogonal normalization processing on the updated matrix W according to the formula in Step 5.
Step 8: If it has not converged, return to Step 6 to repeat the process until the final convergence, and obtain the weight coefficient matrix A = W−1 and independent component matrix IC = WHn,m.
Step 9: Next, the FastICA algorithm is performed 10 times, and the run with the independent components that have the highest kurtosis (non-gaussianity) is selected.
Step 10: Finally, reconstruct HRTFs from the selected independent component matrix and the weight coefficient matrix
If d = n, Equation (8) means complete reconstruction, that is, the reconstructed is as same as the original H; if d < n, is an approximation of the original H.
This work used the CIPIC HRTF database [7]. The database was established in 2001 by the UC Davis CIPIC Interface Laboratory. It contains HRTF data (44.1 kHz sampling frequency, 200 points sampling length) for 45 subjects, including the Knowles Electronics Manikin for Acoustic Research (KEMAR) with large and small ears, with 1250 directions per person (25 azimuths × 50 elevations). Meanwhile, it also includes 27 anthropometric parameters of 35 subjects (17 head and torso anthropometric parameters and 10 pinna anthropometric parameters).
As an illustrative example of the proposed algorithm, we selected data from 35 subjects with 27 complete anthropometric parameters, and divided them into a validation group (containing five subjects, numbers 003, 010, 018, 020, and 027) and the computational group (the remaining 30 subjects). The role of the computational group (also known as the baseline) is to implement the flow algorithm in Figure 1 to obtain an HRTF ICA decomposition and multiple linear regression formula between weight coefficients and anthropometric parameters. On the other hand, the role of the validation group is to input the anthropometric parameters of the subjects into the constructed HRTF ICA decomposition and multiple linear regression formula of weights and anthropometric parameters to predict their individualized HRTFs. Finally, we compare it with the measured individualized HRTFs to show the performance of the proposed algorithm.
In the process of HRTF decomposition using ICA, we calculated HRTF data below 20 kHz (232 frequency points) from 30 subjects at 25 elevation directions (an interval of 5.625°) in the front of the median plane. The directions and the frequency points (25 directions × 232 frequency points, m = 5800) were combined, and the HRTF data from the left and right ears (30 subjects × 2, n = 60) were combined, so the final variable is a two-dimensional matrix H60,5800. Our previous study has demonstrated the effectiveness of ICA decomposition and reconstruction of the vertical KEMAR HRTF [30]. The results indicated that the combination of the preceding six independent components can effectively characterize the main spectral characteristics of the median plane without introducing perceptible auditory defects. Considering that more individual-dependent variations are contained in this work, the preceding 10 independent components d = 10 were selected in the HRTF ICA decomposition for 30 subjects. Thus, the ICA decomposition of the median-plane HRTFs is obtained as
In Equation (9), A60,10 is the individual-dependent weight coefficients, which are used in the subsequent linear regression analysis; IC10,5800 is the direction and frequency-dependent base vector, which is used for the subsequent reconstruction of the individualized HRTF. During implementation, PCA is implemented before applying FastICA to reduce the HRTFs to 10 dimensions. The decorrelation approach is a symmetric method that estimates all the independent components in parallel. The nonlinearity used in the fixed-point algorithm is .
We plot one example of the input HRTF and the output independent components in Figure 2. It can be observed that the original data and the independent components share the same spectral characteristics, such as pinna-related spectral notches and torso-related spectral cues.
Spectral distortion (SD) is used to evaluate the deviation between the original and reconstructed HRTFs. For a specific subject, SD is defined as [31]:
where N = 232 represents the number of calculated frequency points. For different spatial directions, the average SD is defined as:
where M = 25 is the number of involved spatial directions. The closer the values of SD and the value are to zero, the lower the deviation between the original and reconstructed HRTFs. Figure 3 shows the value of the original and reconstructed HRTFs from 30 subjects in the baseline. It indicates that the value is substantially around 4 dB in the 25 directions, implying that the HRTF decomposition using the preceding 10 independent components is stable and effective for reconstruction at all directions in the median plane.
2.2. Factor Analysis of Anthropometric Parameters
In order to obtain a concise formula between weight coefficients and anthropometric parameters, we used a factor analysis to select the key anthropometric parameters related to HRTF before formula derivation. There are 27 anthropometric parameters of the subjects in the CIPIC HRTF database (see Table 1), where x1~x8 are the anthropometric parameters of the head and neck, x9~x17 are the anthropometric parameters of the torso, and d1~d8, θ1, and θ2 are the anthropometric parameters of the pinna.
Factor analysis can be written in a matrix form [32]:
where Xi,j = [x1 x2 … x17 d1 d2 … d7 θ1 θ2] are the 27 anthropometric parameters of 30 subjects, μ is the mean value of X across subjects, α is the factor loading matrix, F is the common factor vector, and ε is the special factor vector.
X = μ + α F + ε
The steps in factor analysis are as follows:
Step 1: Perform normalization on Xi,j (i = 1, 2, …, 30; j = 1, 2, …, 27), eliminating differences in dimensions and the order of magnitude.
where is the mean value of Xi,j, and is the standard deviation of Xi,j.
Step 2: Estimate the factor load matrix α and special variance matrix D using maximum likelihood estimation [33].
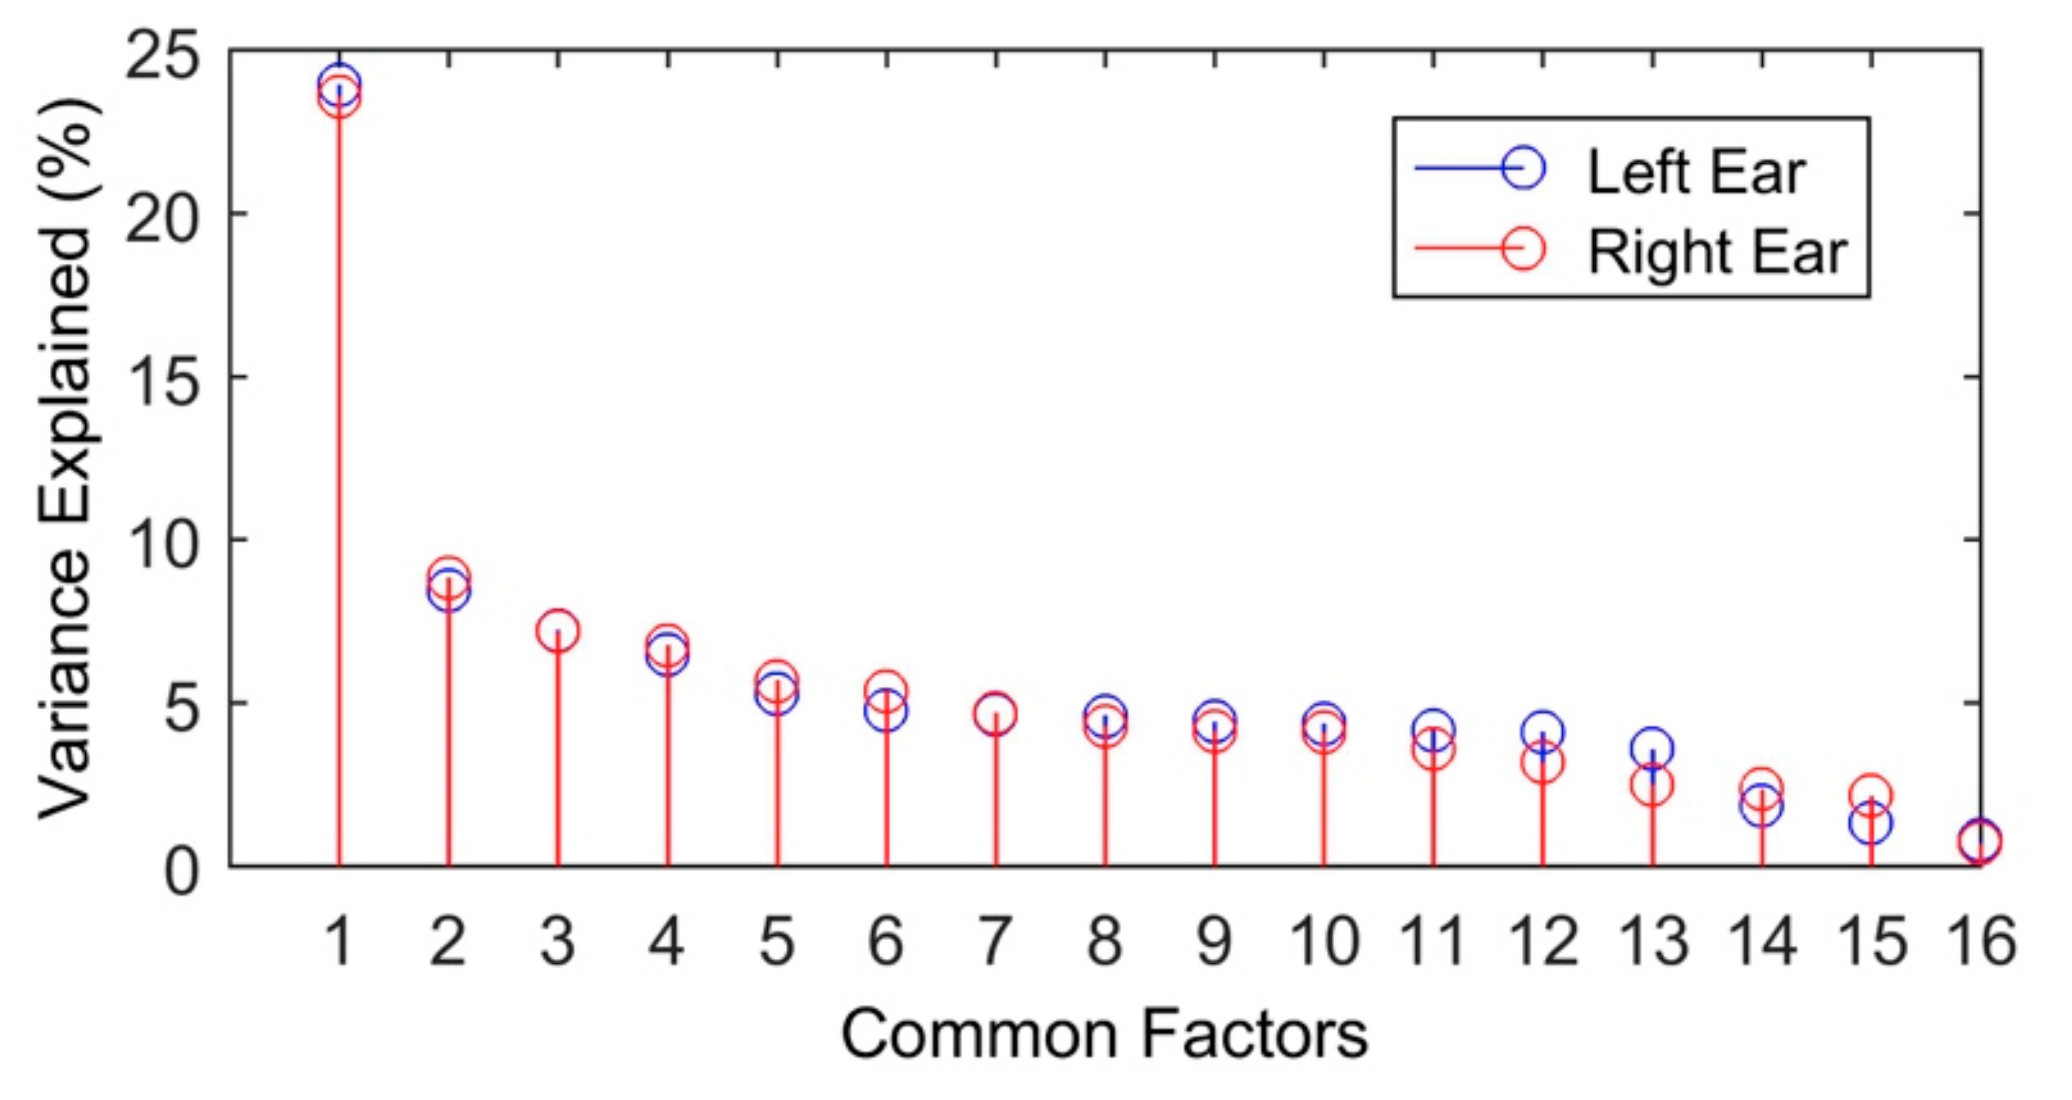
Step 3: Calculate the variance contribution rate and the cumulative variance contribution rate C. According to the cumulative variance contribution rate, we have selected 16 common factors with a cumulative variance contribution rate of about 90%.
Step 4: The maximum variance orthogonal rotation method is used to rotate the factor load matrix α to have greater practical meaning [33]. The purpose of the maximum variance rotation method is to differentiate the absolute values of the elements on each column of the factor load matrix α, that is, the absolute values of a few elements are as large as possible, whereas the other elements as small as possible to zero.
Step 5: Finally, the Barlett factor score is estimated by the weighted least squares method [33].
The above factor analysis was conducted through the function Factoran in the MATLAB software. By inputting anthropometric parameters and the desired number of factors, the Factoran function in MATLAB will output the maximum likelihood estimates of the factor loadings α, the maximum likelihood estimates of the specific variances D, the rotation matrix T, and predictions of the common factors, also known as factor scores F. According to Equation (14), the variance contribution rate was calculated and the above 16 factors were selected with a rate of about 90%. The variance contribution rate of the 16 factors from the left and right ears are shown in Figure 4, and the cumulative variance contribution rate is about 90%. Therefore, we selected these 16 common factors to represent the 27 anthropometric parameters of the subjects. According to the factor load matrix α, anthropometric parameters with a larger load were chosen to be a specific factor. For example, Table 2 shows the selection of anthropometric parameters for Factor 1. x1, x3, x6, x8, x9, x12, x16, and x17 have relatively large loads on the common Factor 1 (the bolded numbers in the table), so it is classified as this factor.
Finally, we conducted a comprehensive analysis that combined the physical meaning of the anthropometric parameters and the results of the factor analysis. For the left ear, Factor No. 1 contained eight anthropometric parameters and, finally, x1, x16 were selected because their factor load values are largely a better representation of the head structure. For Factor No. 2, x2 and x10 were reserved for the same reason. For the right ear, x1 and x16 remained in Factor No. 1, while x2 was reserved in Factor 2. In summary, the anthropometric parameters that remained and were introduced into the subsequent linear regression analysis were x1, x2, x4, x5, x7, x10, x11, x14, x15, x16, d1, d2, d3, d4, d5, d6, d7, d8, θ1, and θ2 (shown in bold in Table 3).
As seen in Figure 4, the variance contribution rate of Factor No. 1 is significantly larger than that of the other 15 factors. As shown in Table 3, the anthropometric parameters contained in Factor No. 1 and No. 2 can be used to characterize the outline of the head and neck, and the anthropometric parameters in Factor No. 3 and No. 4 can roughly describe the morphological features of pinna and concha. This demonstrates that the factor load matrix after factor analysis is easy to interpret. The corresponding special variance value is also very small, indicating that the factor-loading matrix obtained here is a good fit.
2.3. Multiple Linear Regression
The multiple linear regression formula represents a linear quantitative relationship between a dependent variable and multiple independent variables. It not only reveals the influence of the independent variables on the dependent variable, but also predicts the dependent variable via the regression formula. Its matrix form is [34]:
where A represents the individual-dependent weight coefficient from ICA decomposition of HRTFs; Q represents the anthropometric parameters; β represents the regression coefficient; and σ is the constant term. The multivariate regression parameter β is estimated by the least squares method. If the estimated of the regression coefficient vector has been obtained, then . The residual , representing the preceding 10 independent components of ICA decomposition, can be calculated. In this work, the stepwise selection method was used to select the anthropometric parameters involved in the multiple regression formula [34].
A = βQ + σ
Figure 5 shows part of the graphical user interface (GUI) of the stepwise function in MATLAB. The individual-dependent weight coefficient A60,10 from ICA decomposition of HRTFs is analyzed by the regression analysis with the anthropometric parameter Q60,20 from the factor analysis. The left x1~x20 in Figure 5 represent the 20 anthropometric parameters, while the right side in the figure uses the t-test to eliminate parameters that have no significant effect on the weight coefficients, and the F-test for linear regression yields the corresponding F and p values.
According to the flow of the proposed HRTF customization through anthropometric parameters in Figure 1, the regression formulas obtained are shown in Table 4, and the results of the corresponding significance analysis are shown in Table 5. It should be noted that there are no relationships between x5, x16, and A10,1, so 18 anthropometric parameters are incorporated into the formula. So far, the entire procedure of implementing a hybrid algorithm based on anthropometric parameters for predicting individualized median-plane HRTFs is as follows:
- (1)
- Measure the dimensions of 18 anthropometric parameters of the specific subject, namely x1, x2, x4, x7, x10, x11, x14, x15, d1, d2, d3, d4, d5, d6, d7, d8, θ1, and θ2;
- (2)
- Substitute the measured anthropometric parameters into each of the regression formulas in Table 4, predicting the subject-specific weight coefficient A;
- (3)
- Substitute the weight coefficient A to the ICA decomposition formula of HRTFs (i.e., Equation (9), reconstructing the individualized HRTFs of the specific subject.
- (4)
- Perform the above steps for the left and right ears, respectively.
3. Evaluation
According to the above steps for implementing the proposed hybrid prediction algorithm, the anthropometric parameters of the five subjects in the validation group were input into the regression formulas in Table 4. Then, the reconstructed HRTFs of the five subjects were obtained. In this section, the combination of the objective standard deviation and the subjective localization experiment are used to verify the effectiveness of the hybrid algorithm based on anthropometric parameters for predicting individualized median-plane HRTFs.
3.1. Objective Metrics
Figure 6 shows the HRTF magnitude spectrum of a typical subject (No. 1) at the 0° elevation in the median plane, in which the low frequencies (below 400 Hz) are eliminated due to measurement error. It can be seen that the predicted HRTFs and the original measured HRTFs are similar with a good consistency at the pinna-related spectral notches. Considering that the localization cues from pinnae are mainly concentrated in the frequency band from 5 kHz to 12 kHz, the predicted HRTFs using the proposed algorithm may not suffer from the deterioration of localization accuracy.
Substituting the predicted and corresponding measured HRTFs into Equations (10) and (11), the SD as well as of each subject in the validation group can be obtained. Figure 7 shows the variation of SD with elevations for each subject in the validation group. As shown, the predicted HRTFs of Subject No. 1, No. 2, and No. 5 have a smaller SD value than that of the KEMAR HRTF at most elevation directions, suggesting that the proposed algorithm is advantageous in the median plane. The predicted HRTFs of Subject No. 3 and Subject No. 4 have a larger SD value than that of the KEMAR HRTF at some elevation directions. This may be caused by the fact that Figure 7 only demonstrates the prediction performance of an illustrative example of the proposed algorithm (see Section 2.1); the limited number of subjects in the illustrative example (i.e., 30 subjects in the calculation group) may not be sufficient to achieve the best reconstruction performance. Moreover, the anthropometric parameters of the CIPIC HRTF database used in the illustrative example are mainly measured via a photographic method; therefore, they are likely to contain measurement errors to certain extent.
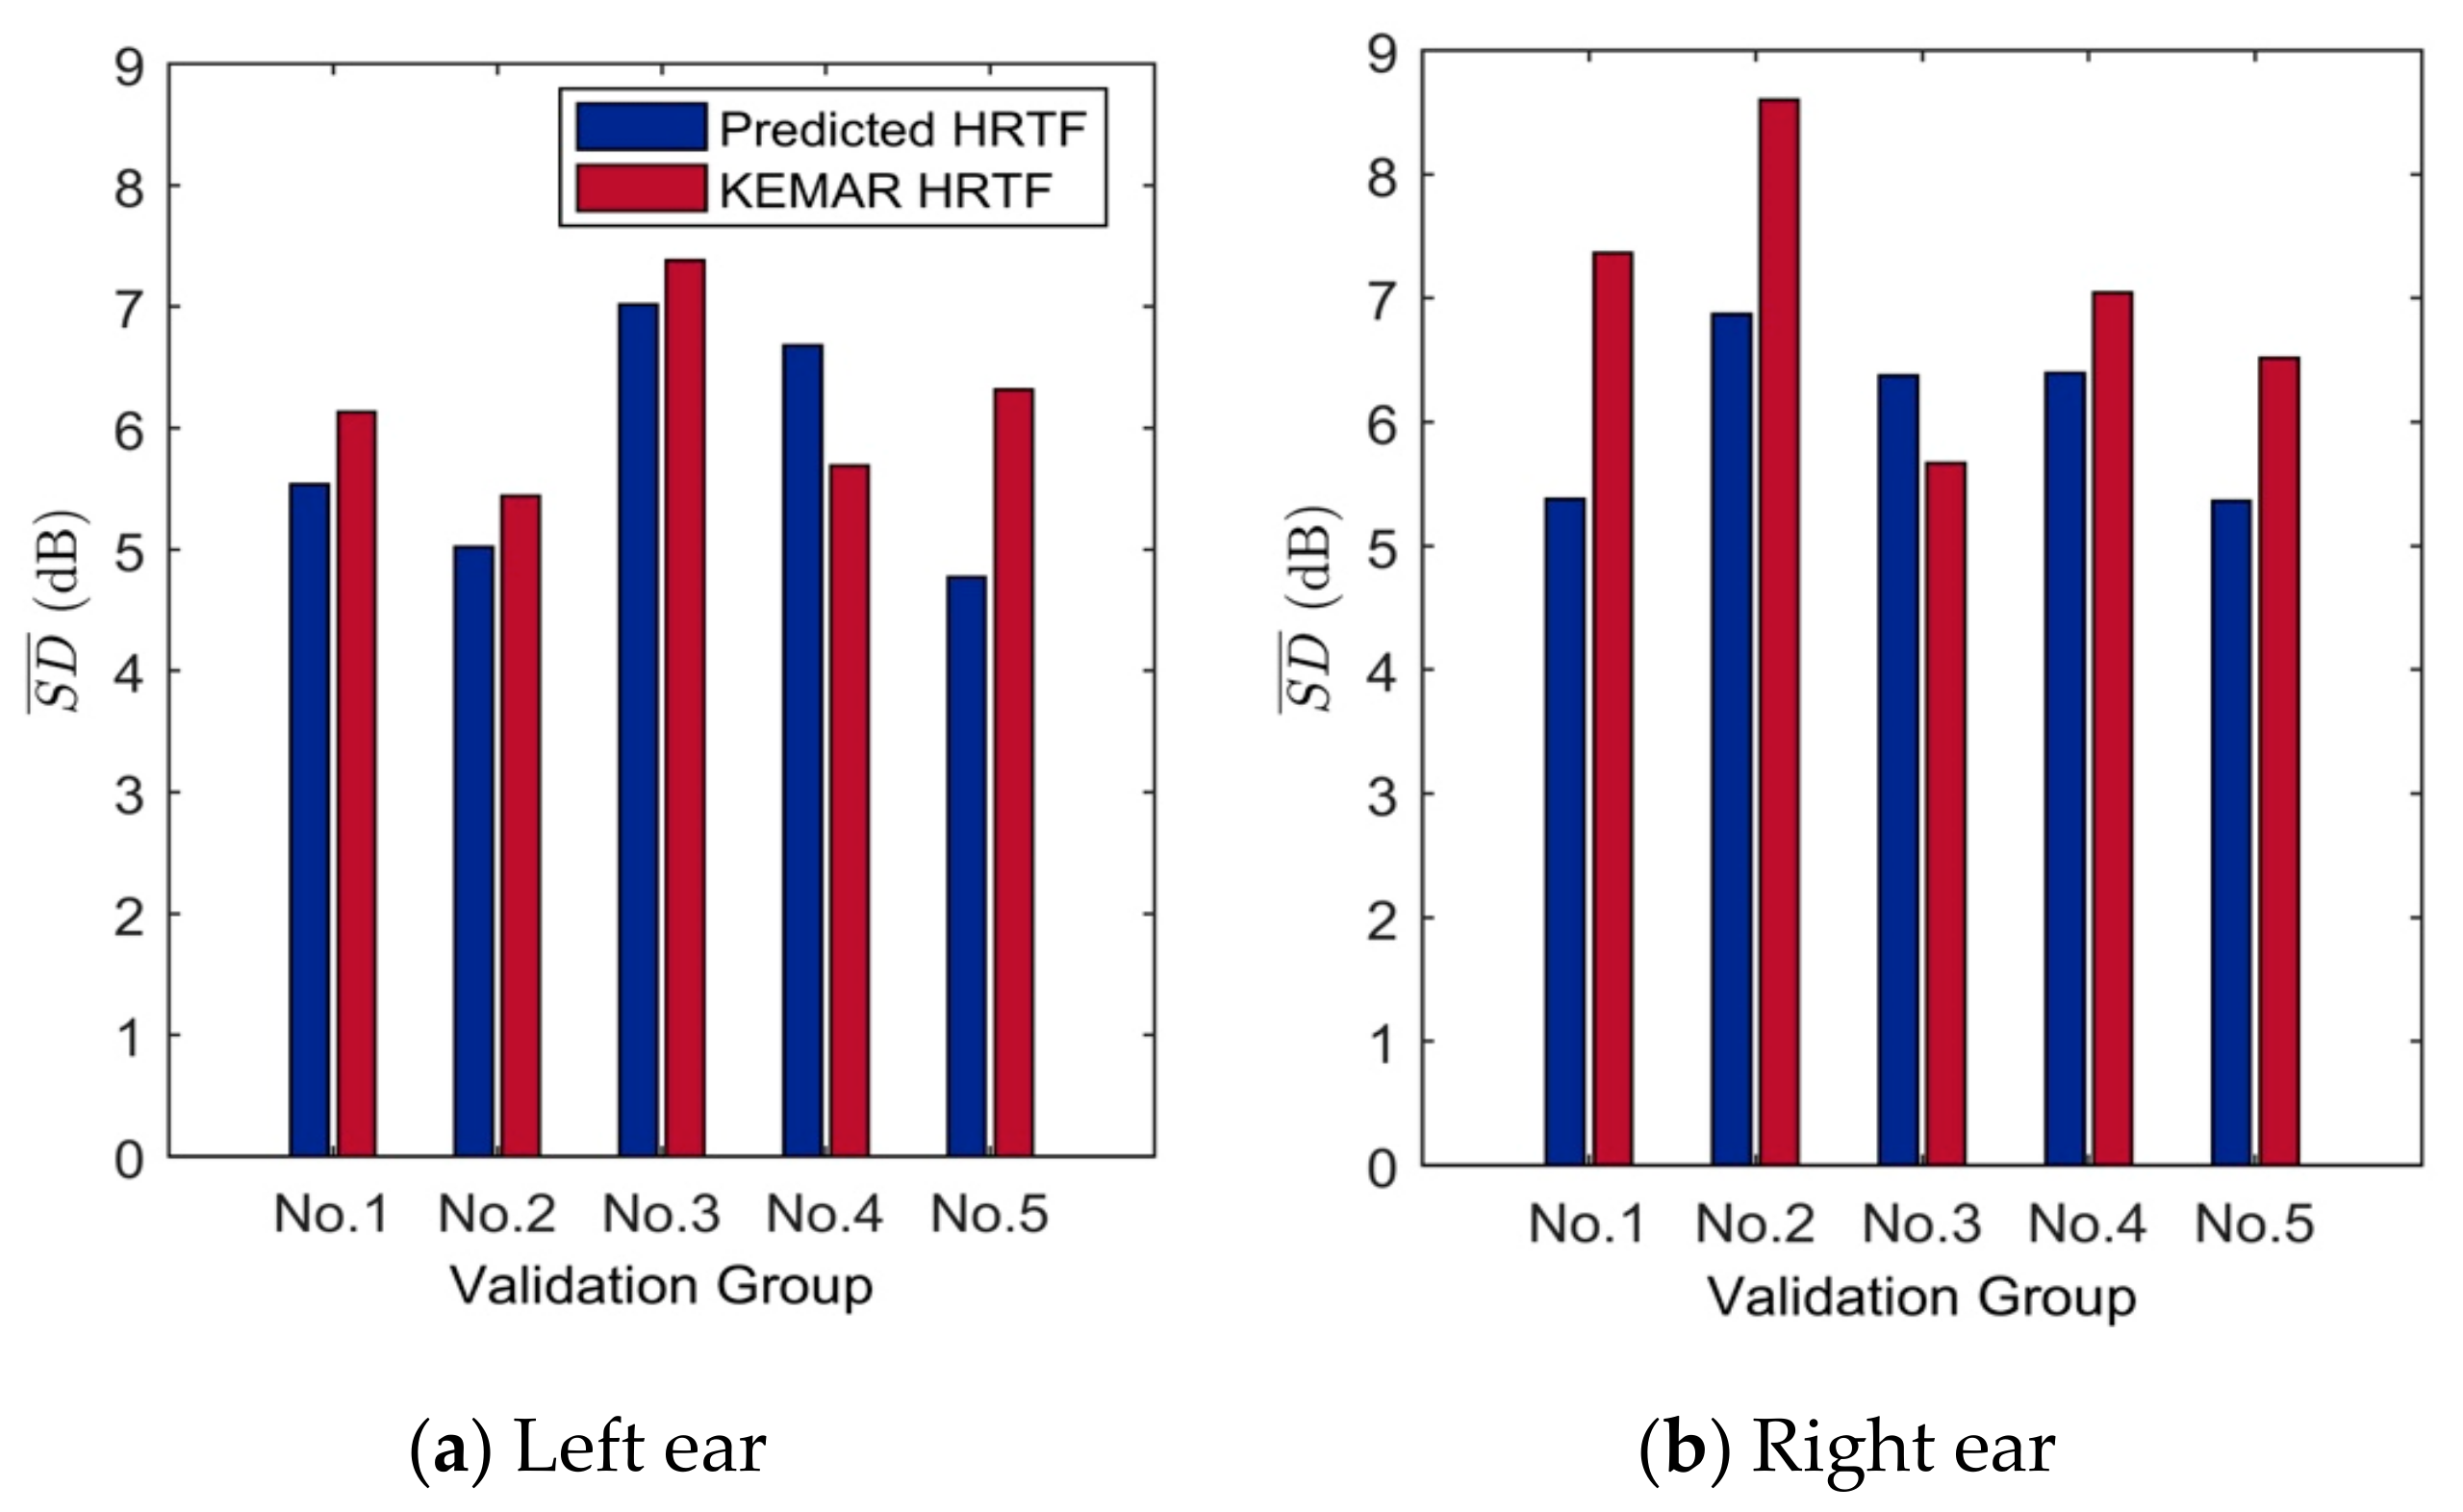
Furthermore, the that is averaged across 25 elevations is calculated according to Equation (11). Similarly, the values between KEMAR and the predicted HRTFs for the five subjects in the validation group are compared as shown in Figure 8. For most subjects, of the predicted (customized) HRTFs is smaller than that of the KEMAR HRTF. In particular, the values of Subject No. 1, No. 2, and No. 5 decrease by 1.2 dB, 1.1 dB, and 1.3 dB, respectively.
In summary, for most subjects, the spectral characteristics of the predicted HRTFs are consistent with the original (i.e., measured) HRTFs; the value of the predicted HRTFs is reduced as compared to the KEMAR HRTFs. Therefore, the proposed HRTF customization hybrid algorithm based on ICA decomposition and anthropometric parameter measurement is effective with the customized HRTFs prior to KEMAR HRTFs with respect to spectral characteristics.
3.2. Subjective Localization Experiments
A localization experiment was further undertaken to verify the effectiveness of the proposed hybrid algorithm subjectively. Six graduate students (from 22 to 27 years old) participated in the experiment. They have experience in sound localization experiments and been screened by the Orbiter medical audiometer with a hearing loss of less than 10 dBHL below 8 kHz and less than 15 dBHL from 8 kHz to 12.5 kHz. The anthropometric parameters of the six subjects were extracted using the anthropometric parameter extraction method based on the three-dimensional scanned head model [35]. Dimensions of the measured anthropometric parameters of these six subjects are shown in Table 6. The predicted HRTFs were reconstructed by substituting the extracted anthropometric parameters into the regression formulas in Table 4.
In terms of experimental signals, the predicted HRIR and KEMAR HRIR were separately convoluted with a white noise to obtain the binaural signals for rendering. Specifically, the white noise is 10 s with the sampling resolution of 44,100 Hz and the quantization resolution of 16 bits.
Note that the predicted HRIR and KEMAR HRIR signals used here are the minimum phase functions, which are determined by the magnitudes of the predicted and KEMAR HRTFs, respectively. The target sound direction is selected from the median plane of six elevations: −45°, 0°, 22.5°, 45°, 67.5°, and 90°. Each subject needed to make 72 judgments (six source directions × two HRTF types × six repetitions). For each experimental condition, there were 36 judgments (six subjects × six repetitions). All the signal segments were presented randomly to each subject. The experimental hardware platform was a Windows 7 platform-based computer, the sound card was ESI® maya22usb, and the headset was a pair of Sennheiser IE 80.
As our work focuses on the vertical localization in the median plane, the median-plane coordinates were arranged with elevation angles labelled at intervals of 5°. Before the experiment, the subject’s head was aligned to the center of the median-plane coordinates. In the experiment, the subject held a laser pen, and pointed to the perceived direction of sound source by straightening his/her arm. Then, the elevation angle of the perceived sound source was read and recorded by the experimenter. Playback was allowed until the subject determined the perceived directions and no feedback was provided to the subject.
Table 7 shows the experimental results of the six subjects. The absolute angle error is defined as the absolute value of the difference between the direction judged by the subject and the preset target direction. The table shows the average angle error from 36 judgments. Note that the angle errors were calculated after correcting for front–back and up–down confusions [2]. As to the absolute angle error, the HRTFs predicted by the proposed algorithm demonstrate a better localization effect than the KEMAR HRTFs in all of the six test directions. A further t-test shows that there is a significant difference in localization performance at elevations of 0° and 22.5° (p < 0.01) and elevations of 45°, 67.5°, and 90° (p < 0.05), whereas no significant difference is observed at the elevation of −45° (p > 0.05). For the front–back and up–down confusion rates, the predicted HRTF of the proposed algorithm is 5.5% and 3.3% lower than those of the KEMAR HRTFs, respectively.
In summary, the proposed HRTF customization hybrid algorithm based on ICA decomposition and anthropometric parameter measurement is effective compared with KEMAR HRTFs with respect to both objective and subjective evaluations.
3.3. Discussion
In the proposed hybrid algorithm, independent component analysis is used to decompose the magnitude of HRTFs, factor analysis is used to select significant anthropometric parameters, and finally multiple linear regression is used to establish the prediction formula. With the proposed hybrid algorithm, individual HRTFs can be customized by measuring the anthropometric parameters. Furthermore, the performance is evaluated by the objective SD value and a subjective localization experiment.
In order to further validate our proposed algorithm, we compare our method with other customization studies. Firstly, most studies extracted anthropometric parameters from photos, and some large-sized anthropometric parameters, such as head circumference and head height, were measured by a ruler. However, our work utilizes the anthropometric parameter extraction method based on a three-dimensional scanned head model, guaranteeing that the anthropometric parameter measurement had high accuracy. This is an important preliminary step for individual HRTF estimation based on anthropometric parameters. Secondly, our method outperforms the other customization studies regarding subjective localization performance. Our proposed method has the average angle error of 14.5° across six elevations, while Iida’s method achieved the average angle error of 20.7° [15] and Hwang et al. achieved the average angle error of 24.5° [36] for various elevations in the median plane. Therefore, our method improves the median-plane localization performance by around 6.2° as compared to the existing method.
4. Conclusions
This paper proposes an individualized HRTF customization hybrid algorithm based on ICA decomposition of HRTFs and measurements of anthropometric parameters. The HRTF data of 30 subjects are first decomposed by ICA, and the spatial base vectors as well as weight coefficients are obtained. In parallel, a factor analysis is performed on 27 anthropometric parameters to eliminate redundancy. Then, the weight coefficients from ICA decomposition and anthropometric parameters selected by the factor analysis are fitted by a linear regression analysis to establish an individualized HRTF prediction formula containing anthropometric parameters. According to the objective evaluation of SD, the mean SD values of three of the five subjects in the validation group decrease by 1.2 dB, 1.1 dB, and 1.3 dB, respectively. The subjective localization experiment has also verified that the predicted HRTFs have a better localization effect than the generic KEMAR HRTFs in terms of absolute angle error and front–back and up–down confusion rates.
This work will facilitate customization of individualized HRTF data quickly and effectively in practical applications of virtual auditory display. It should be noted that, because the spectral characteristics of HRTFs are particularly essential in elevation localization, the proposed customization of individualized HRTF focuses on the elevation directions in the median plane without the presence of binaural localization cues. In principle, the proposed algorithm can be generalized to other spatial directions. Future works can continue to verify the applicability of this algorithm in three-dimensional space.
Author Contributions
X.Z. contributed to the research idea and framework of this study, and X.L. performed the experimental work and data analysis. X.L., H.S., and X.Z. discussed and wrote the contents of the manuscript.
Funding
The National Nature Science Foundation of China under Grant No. 11474103 and the Guangdong Modern Vision-audio Information Engineering Technology Research Center (Guangzhou University, 2017.12–2019.12) supported this work.
Conflicts of Interest
The authors declare no conflict of interest.
References
- Blauert, J.P. Spatial Hearing; Revised edition; MIT Press: Cambridge, MA, USA, 1997. [Google Scholar]
- Xie, B.S. Head-Related Transfer Function and Virtual Auditory Display; J. Ross Publishing: Plantation, FL, USA, 2013. [Google Scholar]
- Møller, H. Fundamentals of binaural technology. Appl. Acoust. 1992, 36, 171–218. [Google Scholar] [CrossRef] [Green Version]
- Wenzel, E.M.; Arruda, M.; Kistler, D.J.; Wightman, F.L. Localization using nonindividualized head-related transfer functions. J. Acoust. Soc. Am. 1993, 94, 858–867. [Google Scholar] [CrossRef]
- Gupta, N.; Barreto, A.; Joshi, M.; Agudelo, J.C. HRTF database at FIU DSP Lab. In Proceedings of the IEEE International Conference on Acoustics, Speech and Signal Processing Proceedings, Dallas, TX, USA, 14–19 March 2010; pp. 169–172. [Google Scholar]
- Møller, H.; Sørensen, M.F.; Hammershøi, D.; Jensen, C.B. Head-related transfer functions of human subjects. J. Audio Eng. Soc. 1995, 43, 300–321. [Google Scholar]
- Algazi, V.R.; Duda, R.O.; Thompson, D.M.; Avendano, C. The CIPIC HRTF database. In Proceedings of the 2001 IEEE Workshop on the Applications of Signal Processing to Audio and Acoustics, New Platz, NY, USA, 21–24 October 2001; pp. 99–102. [Google Scholar]
- Xie, B.S.; Zhong, X.L.; Rao, D.; Liang, Z.Q. Head-related transfer function database and its analyses. Sci. China Ser. G Phys. Mech. Astron. 2007, 50, 267–280. [Google Scholar] [CrossRef]
- Gumerov, N.A.; O’Donovan, A.E.; Duraiswami, R.; Zotkin, D.N. Computation of the head-related transfer function via the fast multipole accelerated boundary element method and its spherical harmonic representation. J. Acoust. Soc. Am. 2010, 127, 370–386. [Google Scholar] [CrossRef] [PubMed] [Green Version]
- Rui, Y.Q.; Yu, G.Z.; Xie, B.S.; Liu, Y. Calculation of individualized near-field head-related transfer function database using boundary element method. In Audio Engineering Society 134th Convention; Audio Engineering Society: New York, NY, USA, 2013; pp. 1–8. [Google Scholar]
- Katz, B.F.G. Boundary element method calculation of individual head-related transfer function. II. Impedance effects and comparisons to real measurements. J. Acoust. Soc. Am. 2001, 110, 2449–2455. [Google Scholar] [PubMed]
- Zotkin, D.Y.N.; Hwang, J.; Duraiswaini, R.; Davis, L.S. HRTF personalization using anthropometric measurements. In Proceedings of the IEEE Workshop on Applications of Signal Processing to Audio and Acoustics, New Paltz, NY, USA, 19–22 October 2003; pp. 157–160. [Google Scholar]
- Zeng, X.Y.; Wang, S.G.; Gao, L.P. A hybrid algorithm for selecting head-related transfer function based on similarity of anthropometric structures. J. Sound Vib. 2010, 329, 4093–4106. [Google Scholar] [CrossRef]
- Liu, X.J.; Zhong, X.Z. An improved anthropometry-based customization method of individual head-related transfer functions. In Proceedings of the Acoustics, Speech and Signal Processing (ICASSP), 2016 IEEE International Conference, Shanghai, China, 20–25 March 2016; pp. 336–339. [Google Scholar]
- Iida, K.; Ishii, Y.; Nishioka, S. Personalization of head-related transfer functions in the median plane based on the anthropometry of the listener’s pinnae. J. Acoust. Soc. Am. 2014, 136, 317–333. [Google Scholar] [CrossRef] [PubMed]
- Middlebrooks, J.C. Individual differences in external-ear transfer functions reduced by scaling in frequency. J. Acoust. Soc. Am. 1999, 106, 1480–1492. [Google Scholar] [CrossRef] [PubMed]
- Middlebrooks, J.C. Virtual localization improved by scaling nonindividualized external-ear transfer functions in frequency. J. Acoust. Soc. Am. 1999, 106, 1493–1510. [Google Scholar] [CrossRef] [PubMed]
- Jin, C.T.; Zolfaghari, R.; Long, X.; Sebastian, A.; Hossain, S.; Glaunes, A.; Tew, A.; Shahnawaz, M.; Sarti, A. Considerations regarding individulization of head-related transfer functions. In Proceedings of the Acoustics, Speech and Signal Processing (ICASSP), Calgary, AB, Canada, 15–20 April 2018; pp. 6787–6791. [Google Scholar]
- Xu, S.; Li, Z.; Salvendy, G. Identification of anthropometric measurements for individualization of head-related transfer functions. Acta Acust. Unit. Acust. 2009, 95, 168–177. [Google Scholar] [CrossRef]
- Hu, H.M.; Zhou, L.; Ma, H.; Wu, Z.Y. HRTF personalization based on artificial neural network in individual virtual auditory space. Appl. Acoust. 2008, 69, 163–172. [Google Scholar] [CrossRef]
- Fels, J.; Vorländer, M. Anthropometric parameters influencing head-related transfer functions. Acta Acust. Unit. Acust. 2009, 95, 331–342. [Google Scholar] [CrossRef]
- He, J.; Gan, W.S.; Tan, E.L. On the preprocessing and postprocessing of HRTF individualization based on sparse representation of anthropometric features. In Proceedings of the IEEE International Conference on Acoustics, Speech and Signal Processing, Brisbane, Australia, 19–24 April 2015; pp. 639–643. [Google Scholar]
- Meng, L.; Xiaochen, W.; Wei, C.; Chunling, A.; Ruimin, H. Individualization of Head-related Transfer Functions based on radial basis function neural network. In Proceedings of the 2018 IEEE International Conference on Multimedia and Expo (ICME), San Diego, CA, USA, 23–27 July 2018; pp. 1–6. [Google Scholar]
- Qi, X.; Tao, J. Sparsity-constrained weight mapping for head-related transfer functions individualization from anthropometric features. In Proceedings of the Annual Conference of the International Speech Communication Association, (INTERSPEECH 2018), Hyderabad, India, 2–6 September 2018; pp. 841–845. [Google Scholar]
- Schönstein, D.; Katz, B.F.G. HRTF selection for binaural synthesis from a database using morphological parameters. In Proceedings of the International Congress on Acoustics (ICA), Sydney, Australia, 23–27 August 2010; pp. 1–6. [Google Scholar]
- Hyvärinen, A.; Karhunen, J.; Oja, E. Independent Component Analysis; John Wiley & Son: New York, NY, USA, 2001. [Google Scholar]
- Phillip, B.C.; Duda, R.O. A structural model for binaural sound synthesis. IEEE Trans. Speech Audio Process. 1998, 6, 476–488. [Google Scholar] [Green Version]
- Chen, W.; Hu, R.; Wang, X.; Yang, C.; Meng, L. Individualization of head related impulse responses using division analysis. China Commun. 2018, 15, 92–103. [Google Scholar] [CrossRef]
- Hyvärinen, A. Fast and robust fixed point for independent component analysis. IEEE Trans. Neural Netw. 1999, 10, 626–634. [Google Scholar] [CrossRef] [PubMed]
- Zhong, X.L.; Liu, X.J. Extraction and modeling of the median-plane spectral features. J. South China Univ. Technol. Nat. Sci. 2018, 46, 130–133. [Google Scholar]
- Tommasini, F.C.; Ramos, O.A.; Hüg, M.X.; Bermejo, F. Usage of spectral distortion for objective evaluation of personalized HRTF in the median plane. Int. J. Acoust. Vib. 2015, 20, 81–89. [Google Scholar] [CrossRef]
- Yong, A.G.; Pearce, S. A beginner’s guide to factor analysis: Focusing on exploratory factor analysis. Tutor. Quant. Methods Psychol. 2013, 9, 79–94. [Google Scholar] [CrossRef]
- Harman, H.H. Modern Factor Analysis; University of Chicago Press: Chicago, IL, USA, 1976. [Google Scholar]
- Gareth, J.; Daniela, W.; Trevor, H.; Robert, T. An Introduction to Statistical Learning; Springer New York: New York, NY, USA, 2013; Volume 103. [Google Scholar]
- Liu, X.J.; Zhong, X.L. Extracting anthropometric parameters from a scanned 3D-head-model. In Proceedings of the Information Science and Control Engineering (ICISCE), 2015 2nd International Conference, Shanghai, China, 24–26 April 2015; pp. 225–228. [Google Scholar]
- Hwang, S.; Park, Y.; Park, Y. Customization of spatially continuous head-related impulse responses in the median plane. Acta Acust. Unit. Acust. 2010, 96, 351–363. [Google Scholar] [CrossRef]
Figure 1.
Workflow of the hybrid algorithm.

Figure 2.
Independent components of head-related transfer functions (HRTFs).

Figure 3.
Mean spectral distortion across 25 elevations in the median plane when using 10-order independent component analysis (ICA) reconstructive HRTFs. Values are averaged among 30 subjects in the illustrative set.
Figure 3.
Mean spectral distortion across 25 elevations in the median plane when using 10-order independent component analysis (ICA) reconstructive HRTFs. Values are averaged among 30 subjects in the illustrative set.

Figure 4.
Variance explained by the 16 common factors in the factor analysis.

Figure 5.
The interface of the stepwise function in MATLAB.

Figure 6.
The HRTF magnitude of a typical subject in the validation group at elevation 0° in the median plane.
Figure 6.
The HRTF magnitude of a typical subject in the validation group at elevation 0° in the median plane.

Figure 7.
Spectral distortion (SD) of the validation group at 25 elevations in the median plane. The values are averaged across left and right ears.
Figure 7.
Spectral distortion (SD) of the validation group at 25 elevations in the median plane. The values are averaged across left and right ears.

Figure 8.
Mean spectral distortion of the validation group at 25 elevations in the median plane.


Table 1.
Definition of anthropometric parameters in the CIPIC database [7].
Table 1.
Definition of anthropometric parameters in the CIPIC database [7].
| Variable | Measurement | Type | Variable | Measurement | Type |
|---|---|---|---|---|---|
| x1 | head width | head | x15 | seated height | torso |
| x2 | head height | head | x16 | head circumference | torso |
| x3 | head depth | head | x17 | shoulder circumference | torso |
| x4 | pinna offset down | head | d1 | cavum concha height | pinna |
| x5 | pinna offset back | head | d2 | cymba concha height | pinna |
| x6 | neck width | neck | d3 | cavum concha width | pinna |
| x7 | neck height | neck | d4 | fossa height | pinna |
| x8 | neck depth | neck | d5 | pinna height | pinna |
| x9 | torso top width | torso | d6 | pinna width | pinna |
| x10 | torso top height | torso | d7 | intertragal incisure width | pinna |
| x11 | torso top depth | torso | d8 | cavum concha depth | pinna |
| x12 | shoulder width | torso | θ1 | pinna rotation angle | pinna |
| x13 | head offset forward | torso | θ2 | pinna flare angle | pinna |
| x14 | height | torso |
Table 2.
The selection of anthropometric parameters.
| Anthropometric Parameters | Factor Loadings | Anthropometric Parameters | Factor Loadings | ||
|---|---|---|---|---|---|
| Left | Right | Left | Right | ||
| x1 | 0.76 | 0.75 | x15 | 0.53 | 0.51 |
| x2 | 0.19 | 0.14 | x16 | 0.78 | 0.74 |
| x3 | 0.76 | 0.81 | x17 | 0.82 | 0.82 |
| x4 | 0.24 | 0.25 | d1 | 0.24 | 0.11 |
| x5 | 0.03 | 0.04 | d2 | 0.16 | 0.20 |
| x6 | 0.90 | 0.91 | d3 | 0.15 | 0.08 |
| x7 | 0.12 | 0.13 | d4 | 0.28 | 0.22 |
| x8 | 0.86 | 0.83 | d5 | 0.26 | 0.22 |
| x9 | 0.85 | 0.85 | d6 | 0.04 | −0.01 |
| x10 | 0.42 | 0.43 | d7 | 0.08 | 0.08 |
| x11 | 0.33 | 0.33 | d8 | 0.12 | 0.10 |
| x12 | 0.95 | 0.96 | θ1 | 0.38 | 0.38 |
| x13 | 0.02 | 0.02 | θ2 | 0.08 | −0.02 |
| x14 | 0.63 | 0.63 | |||
Table 3.
Anthropometric parameters in the 16 common factors.
| Factors | Anthropometric Parameters (Left Ear) | Anthropometric Parameters (Right Ear) |
|---|---|---|
| 1 | x1, x3, x6, x8, x9, x12, x16, x17 | x1, x3, x6, x8, x9, x12, x16, x17 |
| 2 | x2, x10, x13 | x2, x13 |
| 3 | d6 | d3, d7 |
| 4 | d3, d7 | d4, d6 |
| 5 | x7 | d1, d5 |
| 6 | x11 | x7 |
| 7 | d4 | d2 |
| 8 | d1, d5 | x11 |
| 9 | x4 | θ1 |
| 10 | d2 | d8 |
| 11 | θ2 | θ2 |
| 12 | x5 | x5 |
| 13 | θ1 | x4 |
| 14 | x15 | x10 |
| 15 | d8 | x15 |
| 16 | x14 | x14 |
Table 4.
Regression formula of our HRTF customization approach using anthropometric parameters.
| X | Individual Weight Coefficients A10×1 | |||||||||
|---|---|---|---|---|---|---|---|---|---|---|
| A1 | A2 | A3 | A4 | A5 | A6 | A7 | A8 | A9 | A10 | |
| Constant | −3308 | −20893 | −10045 | 2709 | −38680 | −21861 | −6340 | 38677 | −10592 | 16686 |
| x1 | 0 | 0 | 0 | 0 | 0 | 0 | 0 | 0 | −1090 | 1394 |
| x2 | 0 | 0 | 0 | 0 | 1374 | 0 | 0 | 0 | 0 | 0 |
| x4 | 0 | 0 | 0 | 0 | 2148 | 0 | 2363 | 0 | −2780 | 0 |
| x7 | 0 | 571 | 0 | 0 | 0 | 0 | 0 | 0 | 0 | 0 |
| x10 | 0 | 0 | 0 | 0 | −989 | 0 | 679 | 0 | 0 | 0 |
| x11 | 741 | 0 | 0 | 0 | 353 | 448 | 0 | 0 | 0 | 0 |
| x14 | −198 | 0 | 0 | 0 | 0 | 0 | 0 | 0 | 0 | −111 |
| x15 | 0 | 234 | 167 | 0 | 0 | 0 | 0 | −432 | 0 | 0 |
| d1 | 0 | 0 | 0 | 0 | 0 | 5586 | 0 | 0 | 9394 | 0 |
| d2 | 0 | 0 | 0 | 0 | 0 | 10087 | 0 | 0 | 0 | 0 |
| d3 | 0 | 0 | 0 | 0 | 3644 | 5886 | 0 | 0 | 0 | 0 |
| d4 | 0 | −5010 | 0 | 0 | 0 | −6393 | 0 | 0 | 0 | 0 |
| d5 | 0 | 0 | 0 | 0 | 0 | 0 | 0 | 0 | 0 | −3352 |
| d6 | 0 | 0 | 0 | −4649 | 0 | 0 | 0 | 0 | 0 | 0 |
| d7 | 8015 | 6398 | 0 | 11380 | 0 | 0 | 0 | 0 | 0 | 10086 |
| d8 | 0 | 0 | 0 | 0 | 0 | −7781 | 0 | 0 | 0 | 0 |
| θ1 | 0 | 0 | 0 | 8851 | 0 | 0 | −16624 | 0 | 10857 | 0 |
| θ2 | 0 | 0 | 0 | 0 | 0 | 0 | 0 | 0 | 8569 | 0 |
Table 5.
Statistical test of the regression formulas.
| A1 | A2 | A3 | A4 | A5 | A6 | A7 | A8 | A9 | A10 | |
|---|---|---|---|---|---|---|---|---|---|---|
| F value | 14.8 | 16.4 | 5.6 | 7.3 | 7.9 | 6.7 | 7.2 | 19.6 | 9.7 | 8 |
| p value | <0.0001 | <0.0001 | <0.05 | <0.0001 | <0.0001 | <0.0001 | <0.0001 | <0.0001 | <0.0001 | <0.0001 |
Table 6.
Dimensions of the anthropometric parameters for six subjects (Unit: cm).
| X | No. 1 | No. 2 | No. 3 | No. 4 | No. 5 | No. 6 | |
|---|---|---|---|---|---|---|---|
| x1 | 15.720 | 15.438 | 15.390 | 15.730 | 15.147 | 15.020 | |
| x2 | 20.500 | 22.007 | 20.220 | 21.530 | 20.100 | 20.070 | |
| x4 | 4.5 | 3.5 | 3.0 | 4.0 | 2.5 | 4.0 | |
| x5 | 1.508 | 1.787 | 1.605 | 1.500 | 1.214 | 1.408 | |
| x7 | 6.005 | 6.280 | 3.446 | 4.800 | 6.160 | 4.307 | |
| x10 | 13.0 | 11.0 | 12.0 | 10.5 | 11.0 | 11.5 | |
| x11 | 23.0 | 19.5 | 21.0 | 22.9 | 25.5 | 20.6 | |
| x14 | 180 | 165 | 170 | 163 | 163 | 161 | |
| x15 | 93.0 | 83.5 | 86.2 | 81.0 | 87.7 | 85.0 | |
| x16 | 57.0 | 56.0 | 56.0 | 56.0 | 56.0 | 55.5 | |
| d1 | L | 1.960 | 1.564 | 1.645 | 1.827 | 1.660 | 1.653 |
| R | 1.993 | 1.456 | 1.624 | 1.690 | 1.717 | 1.655 | |
| d2 | L | 0.659 | 0.658 | 0.577 | 0.706 | 0.505 | 0.522 |
| R | 0.682 | 0.538 | 0.868 | 0.611 | 0.472 | 0.575 | |
| d3 | L | 1.470 | 1.310 | 1.305 | 1.221 | 1.615 | 1.656 |
| R | 1.550 | 1.544 | 1.201 | 1.353 | 1.531 | 1.677 | |
| d4 | L | 1.978 | 1.779 | 2.052 | 1.110 | 1.647 | 1.961 |
| R | 2.073 | 1.757 | 2.002 | 1.221 | 1.810 | 2.072 | |
| d5 | L | 5.991 | 5.206 | 5.659 | 5.527 | 5.381 | 5.792 |
| R | 5.923 | 5.135 | 5.864 | 5.631 | 5.473 | 5.938 | |
| d6 | L | 3.461 | 3.043 | 2.523 | 3.219 | 2.828 | 2.841 |
| R | 3.116 | 2.976 | 2.496 | 3.226 | 2.612 | 2.909 | |
| d7 | L | 0.765 | 0.510 | 0.54 | 0.664 | 0.524 | 0.621 |
| R | 0.763 | 0.497 | 0.523 | 0.661 | 0.536 | 0.573 | |
| d8 | L | 1.232 | 1.282 | 1.186 | 1.200 | 1.229 | 1.186 |
| R | 1.172 | 1.243 | 1.151 | 1.196 | 1.175 | 1.148 | |
| θ1 | L | 25.1° | 24.4° | 21.8° | 23.6° | 22.9° | 21.8° |
| R | 22.0° | 20.7° | 17.8° | 25.6° | 21.4° | 23.3° | |
| θ2 | L | 34.7° | 18.7° | 34.8° | 23.8° | 27.6° | 25.2° |
| R | 39.2° | 23.2° | 37.3° | 28.9° | 30.0° | 28.1° | |
Table 7.
Results of the localization experiment and corresponding statistical tests.
| Elevations | Predicted HRTF | KEMAR HRTF | t-Test | |
|---|---|---|---|---|
| Absolute angle error | −45° | 10.4° | 19.6° | t = −1.1 p = 0.266 |
| 0° | 11.8° | 33.3° | t = 3.4 p = 0.002 | |
| 22.5° | 17.2° | 32° | t = 4.3 p = 0.000 | |
| 45° | 17.2° | 21.4° | t = 2.5 p = 0.018 | |
| 67.5° | 13.9° | 19.2° | t = −2.1 p = 0.047 | |
| 90° | 16.9° | 33.1° | t = −2.5 p = 0.019 | |
| Front–back confusion rate | 5.1% | 10.6% | ||
| Up–down confusion rate | 6.9% | 10.2% | ||
© 2019 by the authors. Licensee MDPI, Basel, Switzerland. This article is an open access article distributed under the terms and conditions of the Creative Commons Attribution (CC BY) license (http://creativecommons.org/licenses/by/4.0/).
Share and Cite
MDPI and ACS Style
Liu, X.; Song, H.; Zhong, X. A Hybrid Algorithm for Predicting Median-Plane Head-Related Transfer Functions from Anthropometric Measurements. Appl. Sci. 2019, 9, 2323. https://0-doi-org.brum.beds.ac.uk/10.3390/app9112323
AMA Style
Liu X, Song H, Zhong X. A Hybrid Algorithm for Predicting Median-Plane Head-Related Transfer Functions from Anthropometric Measurements. Applied Sciences. 2019; 9(11):2323. https://0-doi-org.brum.beds.ac.uk/10.3390/app9112323
Chicago/Turabian StyleLiu, Xuejie, Hao Song, and Xiaoli Zhong. 2019. "A Hybrid Algorithm for Predicting Median-Plane Head-Related Transfer Functions from Anthropometric Measurements" Applied Sciences 9, no. 11: 2323. https://0-doi-org.brum.beds.ac.uk/10.3390/app9112323
Note that from the first issue of 2016, this journal uses article numbers instead of page numbers. See further details here.