Environmental Impact Assessment of Banagrass-Based Cellulosic Ethanol Production on Hawaii Island: A Spatial Analysis of Re-Suspended Soil Dust and Carbon Dioxide Emission


Abstract
:1. Introduction
2. Materials and Methods
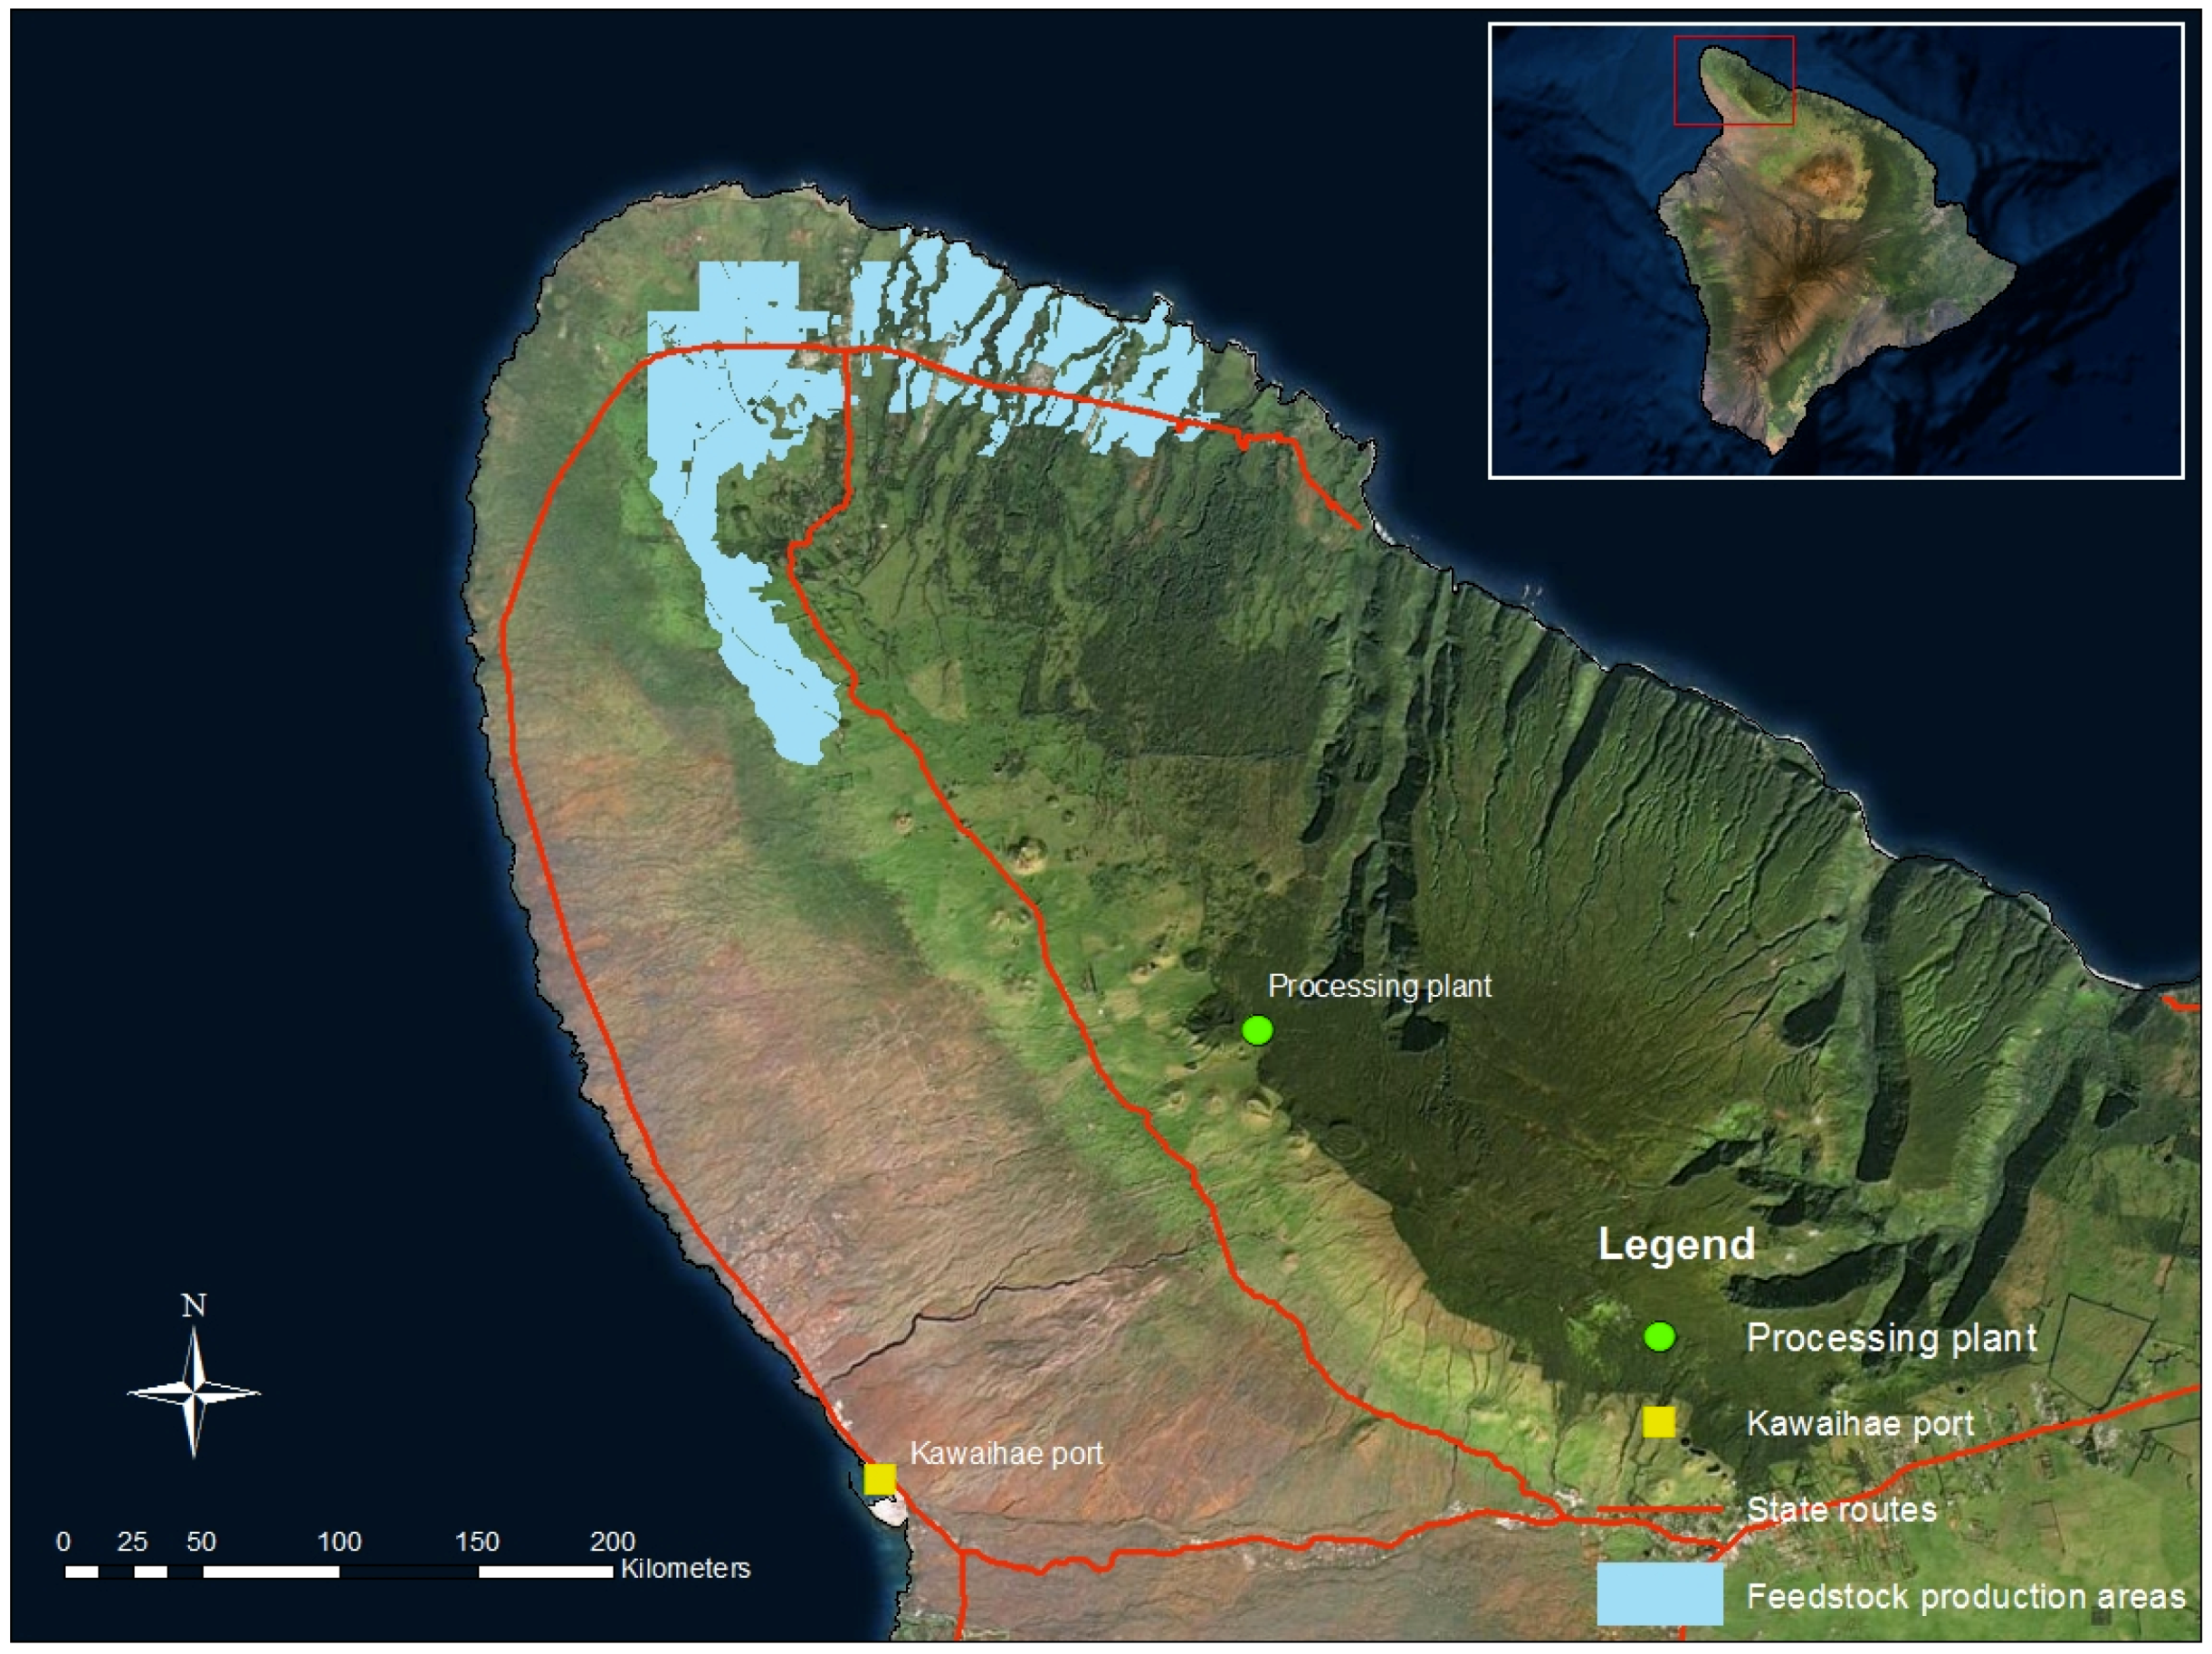
2.1. Study Areas and Data
2.2. Methods
2.2.1. Dust Pollution
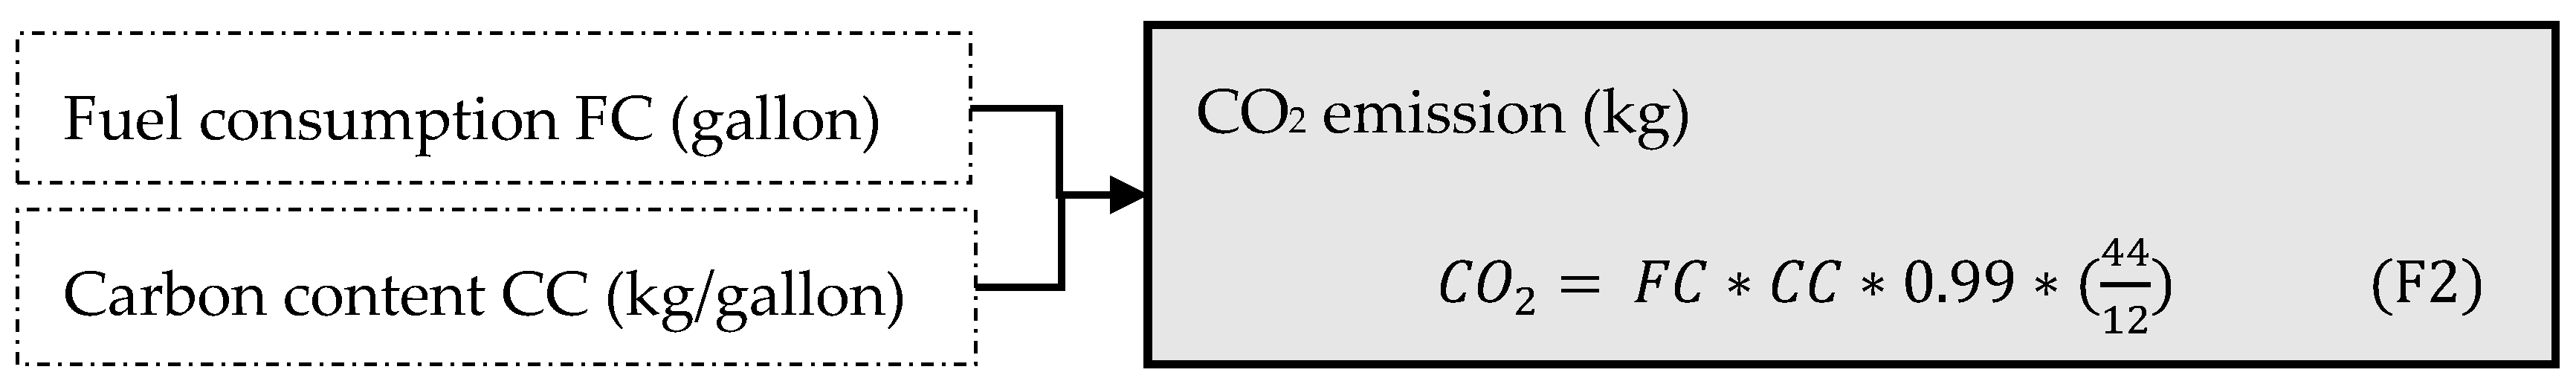
2.2.2. CO2 Pollution
3. Results and Discussion
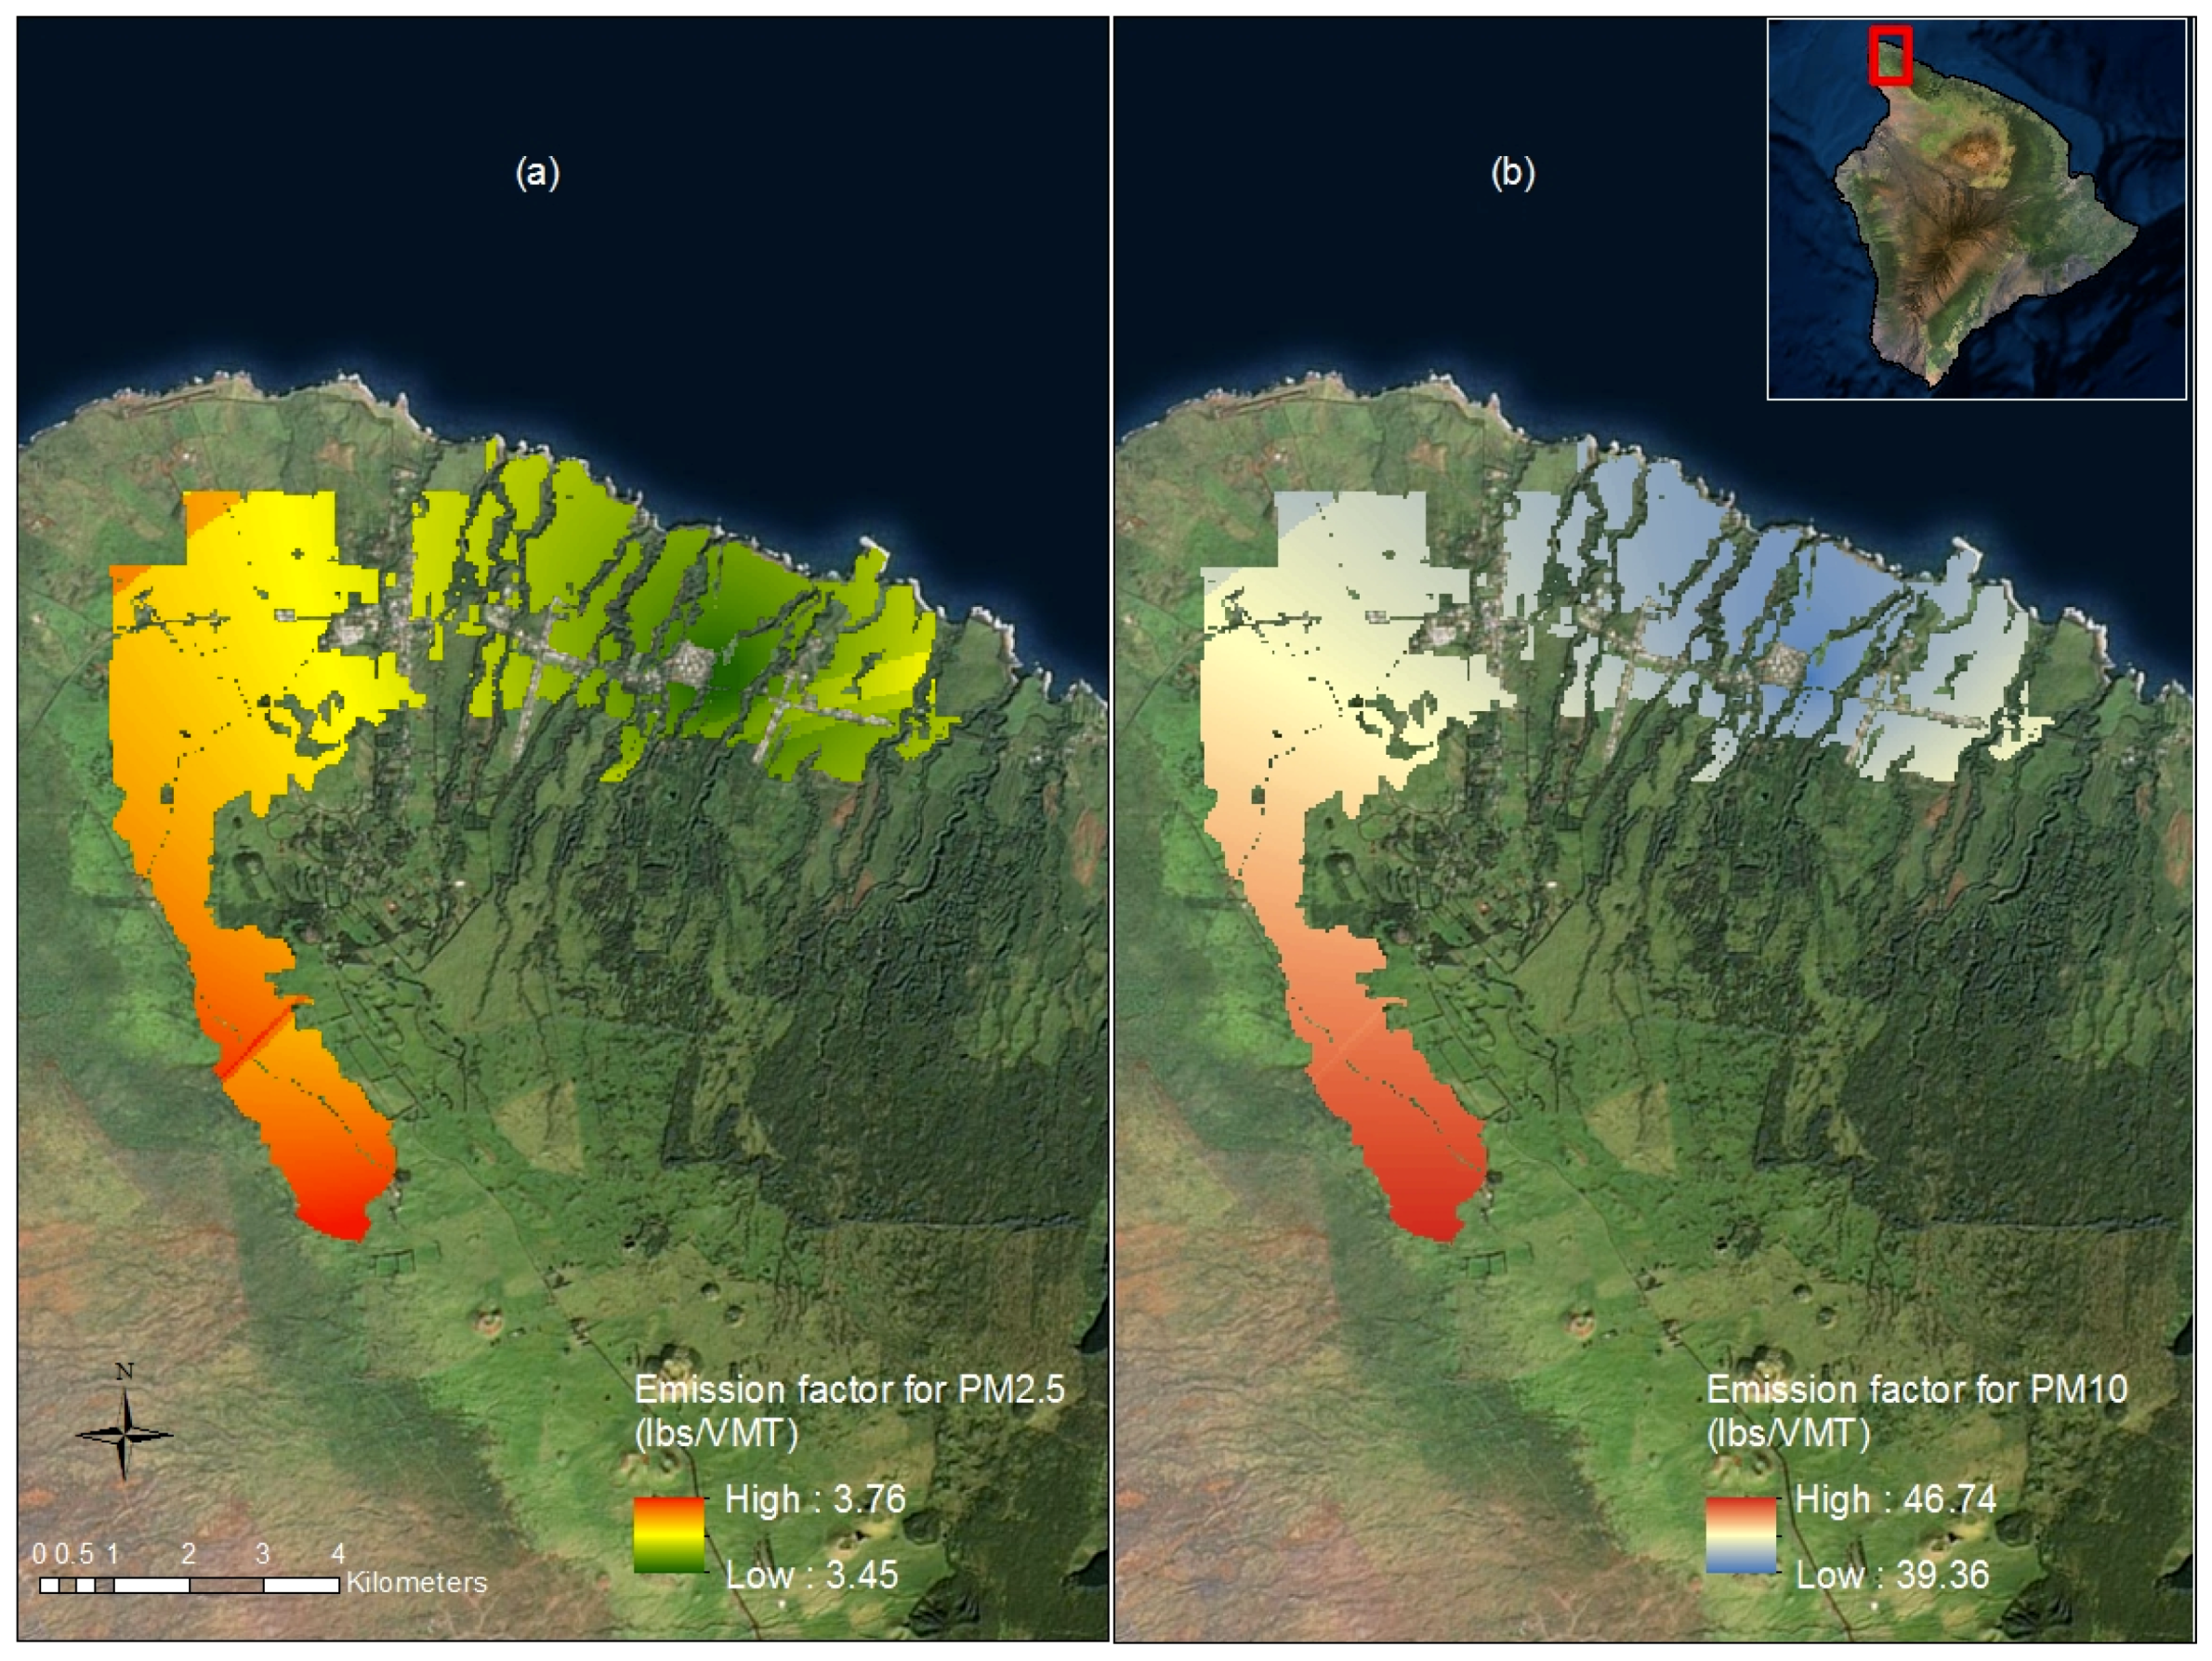
3.1. Dust Emission
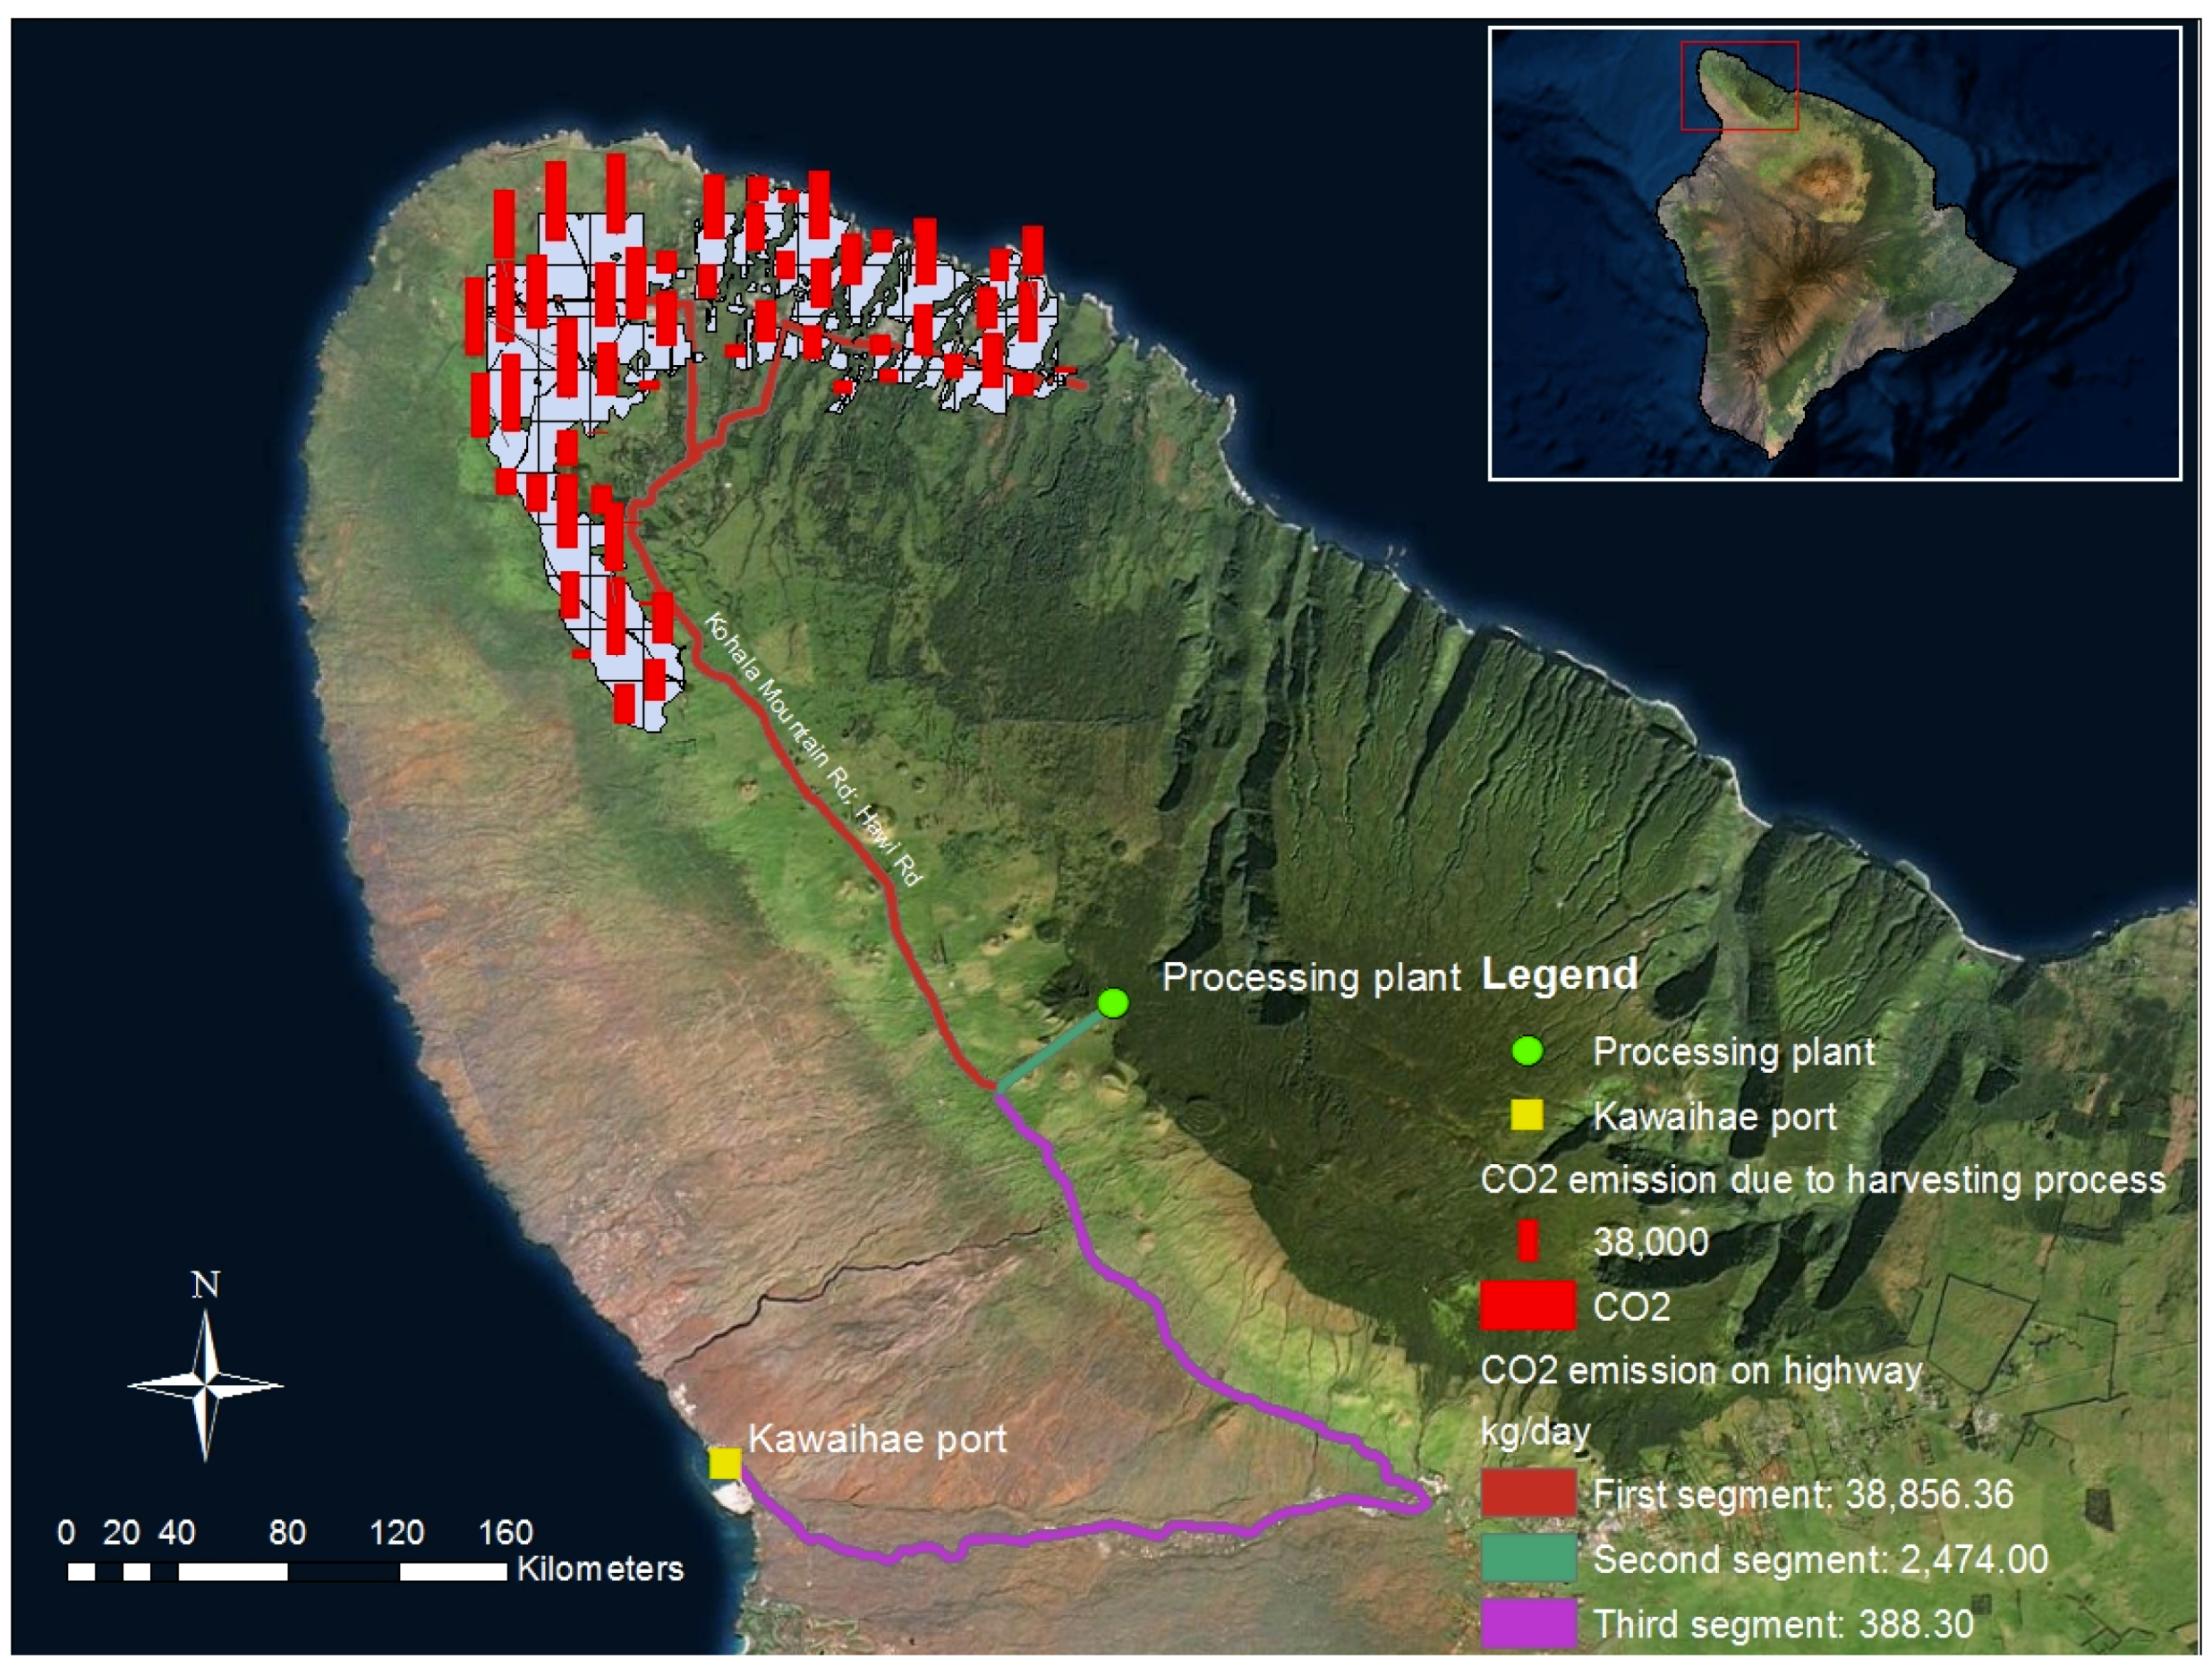
3.2. CO2 Emission
4. Conclusions
Author Contributions
Funding
Acknowledgments
Conflicts of Interest
References
- Tran, C.; Yanagida, J. Can Hawaii Meet Its Renewable Fuel Target? Case Study of Banagrass-Based Cellulosic Ethanol. ISPRS Int. J. Geo-Inf. 2016, 5, 146. [Google Scholar] [CrossRef]
- PBD Pacific Biodiesel (PBD). Operation Schedule; PBD Pacific Biodiesel: Torrance, CA, USA, 2015. [Google Scholar]
- Black & Veatch. The Potential for Biofuels Production in Hawai’i; Black & Veatch Corporation: Overland Park, KS, USA, 2010. [Google Scholar]
- Kinoshita, C.M.; Zhou, J. Siting Evaluation for Biomass-Ethanol Production in Hawaii; National Renewable Energy Lab: Golden, CO, USA, 1999.
- CARB. Senate Bill No. 700-Florez; California Air Resources Board: Sacramento, CA, USA, 2003.
- Countess Environmental. WRAP Fugitive Dust Handbook; Prepared for Western Governors’ Association; Countess Environmental: Westlake Village, CA, USA, 2006. [Google Scholar]
- EPA. Compilation of Air Pollutant Emission Factors: Stationary Point and Area Sources, 5th ed; EPA: Research Triangle Park, NC, USA, 1995.
- Wanjura, J.D.; Parnell, C.B.; Shaw, B.W.; Capareda, S.C. Source Testing of Particulate Matter Emissions from Cotton Harvesters–System Design. In Proceedings of the National Cotton Council Beltwide Cotton Conference, San Antonio, TX, USA, 4–6 Janurary 2006; pp. 370–378. [Google Scholar]
- EPA. e-CFR: Title 40: Protection of Environment, Part 52-Approval and Promulgation of Implementation Plans, Subpart A-General Provisions,§52.21 Prevention of Significant Deterioration of Air Quality; LII: Ithaca, NY, USA, 2016; Volume e-CFR.
- AECOM Appendix G: Air Quality Technical Support Document for the Hollister Underground Mine Project EIS-Draft. Available online: http://www.blm.gov/style/medialib/blm/nv/field_offices/elko_field_office/information/nepa/eiss/archives/hollister_projects/hollister_deis__6/hollister_deis_appendicies.Par.41353.File.dat/Appendix_G_Air-Quality.pdf (accessed on 25 May 2016).
- 40 CFR (Code of Federal Regulations) § 52.21—Prevention of Significant Deterioration of Air Quality. Available online: https://www.law.cornell.edu/cfr/text/40/52.21 (accessed on 28 June 2019).
- EPA Carbon Dioxide Emissions | Climate Change: Overview of Greenhouse Gases. Available online: https://www3.epa.gov/climatechange/ghgemissions/gases/co2.html (accessed on 7 May 2016).
- Neulicht, R.; Shular, J. Emission Factor Documentation for ap-42. Section 13.2. 2: Unpaved Roads. 1998. Available online: https://www3.epa.gov/ttn/chief/ap42/ch13/bgdocs/b13s02-2.pdf (accessed on 7 May 2016).
- CFDC; Nebraska Ethanol Board. A Guide for Evaluating the Requirements of Ethanol Plants; Nebraska Ethanol Board: Lincoln, NE, USA, 2006.
- ESRI North America Detailed Streets. Available online: http://www.arcgis.com/home/item.html?id=f38b87cc295541fb88513d1ed7cec9fd (accessed on 21 March 2012).
- OSP Office of Planning | Download GIS Data. Available online: http://planning.hawaii.gov/gis/download-gis-data/ (accessed on 14 April 2015).
- Giambelluca, T.W.; Chen, Q.; Frazier, A.G.; Price, J.P.; Chen, Y.L.; Chu, P.S.; Eischeid, J.K.; Delparte, D.M. Online rainfall atlas of Hawai’i. Bull. Am. Meteorol. Soc. 2013, 94, 313–316. [Google Scholar] [CrossRef]
- NCDC Climate Data Online (CDO)-The National Climatic Data Center’s (NCDC) Climate Data Online (CDO). Available online: https://www.ncdc.noaa.gov/cdo-web/ (accessed on 8 June 2016).
- NRCS Web Soil Survey. Available online: http://websoilsurvey.sc.egov.usda.gov/App/HomePage.htm (accessed on 2 May 2015).
- NCSS National Cooperative Soil Survey Soil Characterization Database. Available online: http://ncsslabdatamart.sc.egov.usda.gov/ (accessed on 22 January 2016).
- Cassel, T.; Trzepla-Nabaglo, K.; Flocchini, R. PM10 emission factors for harvest and tillage of row crops. In Proceedings of the 12th International Emission Inventory Conference, San Diego, CA, USA, 29 April–3 May 2003. [Google Scholar]
- EPA. AP 42, Fifth Edition, Volume I | Chapter 13: Miscellaneous Sources| Section 13.2.2 Unpaved Road. 2006. Available online: https://www3.epa.gov/ttn/chief/ap42/ch13/final/c13s0202.pdf. (accessed on 7 May 2016).
- Pari, L.; Grassi, G.; Sénéchal, S.; Capaccioli, S.; Cocchi, M. State of the art: Harvesting, storage and logistic of the sweet sorghum. Power (kW) 2008, 12, 20. [Google Scholar]
- Osgood, R.V.; Dudley, N.S.; Jakeway, L.A. A Demonstration of Grass Biomass Production on Molokai; Hawaii Agriculture Research Center: Honolulu, HI, USA, 1996. [Google Scholar]
- Salassi, M.; Deliberto, M.; Hilbun, B. Sugar Production in Louisiana. Available online: http://www.lsuagcenter.com/NR/rdonlyres/4BAAA44C-19FA-43A1-8F2A-FB3403D04335/95867/2014SugarBudgets1.pdf (accessed on 26 February 2016).
- Diggle, P.J.; Ribeiro, P.J. Bayesian inference in Gaussian model-based geostatistics. Geogr. Environ. Model. 2002, 6, 129–146. [Google Scholar] [CrossRef]
- Krivoruchko, K. Spatial Statistical Data Analysis for GIS Users; Esri Press: Redlands, CA, USA, 2011. [Google Scholar]
- Ogoshi, R. Banagrass Yields from Field Trials; ISPRS: Christian Heipke, Germany, 2015. [Google Scholar]
- EPA. Average Carbon Dioxide Emissions Resulting from Gasoline and Diesel Fuel; US EPA: Washigton, DC, USA, 2005.
- Kecojevic, V.; Komljenovic, D. Haul truck fuel consumption and CO2 emission under various engine load conditions. Min. Eng. 2010, 62, 44–48. [Google Scholar]
- Saber, A.; Roberts, F.L.; Guduguntla, A.K. Evaluating the Effects of Heavy Sugarcane Truck Operations on Repair Cost of Low Volume Highways; Louisiana Transportation Research Center: Baton Rouge, LA, USA, 2008. [Google Scholar]
- Davis, S.C.; Williams, S.E.; Boundy, R.G.; Moore, S.A. 2015 Vehicle Technologies Market Report–Chapter 3: Heavy Trucks. Available online: http://cta.ornl.gov/vtmarketreport/pdf/chapter3_heavy_trucks.pdf (accessed on 11 July 2016).
- National Academies. Technologies and Approaches to Reducing the Fuel Consumption of Medium-and Heavy-Duty Vehicles; National Academies Press: Washington, DC, USA, 2010. [Google Scholar]
- EPA. AP-42: Compilation of Air Pollutant Emission Factors Volume I: Stationary Point and Area Sources; EPA: Washington, DC, USA, 2006.


| Type of Machines | Unit | Values | Sources |
|---|---|---|---|
| Production land areas | Ha | 3080 | Tran and Yanagida (2016) [1] |
| Daily feedstock required | Wet tons | 1056 | Calculated by authors |
| Daily harvested areas | Ha | 16.88 | Calculated by authors |
| Claas CC 1400 harvester | |||
| Numbers of harvesters | Harvester | 8 | Biomass Research and Development Initiative (BRDI) project at the University of Hawaii, Manoa. |
| Weight per harvester | Tons | 11 | Pari et al. (2008) [23] |
| Mean harvester speed | Mph | 1 | Osgood et al. (1996) [24] |
| Adjusted biomass harvest rate per machine | Ton/hour | 16.28 | Osgood et al. (1996) [24] |
| Adjusted harvester productivity per machine | Ha/hour | 0.26 | Osgood et al. (1996) [24] |
| Trucks/trailers | |||
| Numbers of trucks/trailers per day | Trucks | 18 | Calculated by authors |
| Weight per truck/trailer | Tons | 23.65 | Salassi et al. (2014) [25] |
| Capacity per truck/trailer | Tons | 4.86 | Kinoshita and Zhou (1999) [4] |
| Content | Unit | EPM2.5 | EPM10 |
|---|---|---|---|
| Emission factor per vehicle mile traveled | lbs/VMT | ||
| Minimum | 3.45 | 39.36 | |
| Maximum | 3.76 | 46.74 | |
| Average | 3.62 | 42.73 | |
| Standard deviation | 0.06 | 1.78 | |
| Emission factor per acre | lbs/acre | ||
| Minimum | 5.30 | 60.56 | |
| Maximum | 5.79 | 71.90 | |
| Average | 5.57 | 65.74 | |
| Standard deviation | 0.09 | 2.73 | |
| Total emission factor per year | Tons/year | 21.84 | 248.18 |
| Content | Unit | Values |
|---|---|---|
| Harvesting operations | ||
| Daily fuel consumption | Gallon/day | 637.54 |
| CO2 emissions per day | Kg/day | 6429.04 |
| CO2 emissions per year from harvesting operations | Tons/year | 2586.66 |
| Transporting/hauling operations | ||
| Transporting routes | ||
| Length of the first segment | Miles | 26.69 |
| Length of the second segment | Miles | 1.69 |
| Length of the third segment | Miles | 25.67 |
| Daily feedstock transporting | ||
| Number of trips | Round-trips | 217 |
| CO2 emissions from the first segment per day | Kg/day | 38,856.36 |
| CO2 emissions from the second segment | Kg/day | 2460.37 |
| Total daily CO2 emissions | Kg/day | 41,316.73 |
| Daily ethanol transporting | ||
| Number of trips | Round-trips | 3 |
| CO2 emissions on the second segment | Kg/day | 13.63 |
| CO2 emissions on the third segment | Kg/day | 388.30 |
| Total daily CO2 emissions | Kg/day | 401.93 |
| CO2 emissions per day from transporting operations | Kg/day | 41,718.66 |
| CO2 emissions per year from transporting operations | Tons/year | 16,785.22 |
| Total daily CO2 emission (including harvesting and transporting operations) | Kg/day | 48,147.70 |
| Total yearly CO2 emission (including harvesting and transporting operations) | Tons/year | 19,371.72 |
© 2019 by the authors. Licensee MDPI, Basel, Switzerland. This article is an open access article distributed under the terms and conditions of the Creative Commons Attribution (CC BY) license (http://creativecommons.org/licenses/by/4.0/).
Share and Cite
Tran, C.C.; Yanagida, J.F. Environmental Impact Assessment of Banagrass-Based Cellulosic Ethanol Production on Hawaii Island: A Spatial Analysis of Re-Suspended Soil Dust and Carbon Dioxide Emission. Appl. Sci. 2019, 9, 2648. https://0-doi-org.brum.beds.ac.uk/10.3390/app9132648
Tran CC, Yanagida JF. Environmental Impact Assessment of Banagrass-Based Cellulosic Ethanol Production on Hawaii Island: A Spatial Analysis of Re-Suspended Soil Dust and Carbon Dioxide Emission. Applied Sciences. 2019; 9(13):2648. https://0-doi-org.brum.beds.ac.uk/10.3390/app9132648
Chicago/Turabian StyleTran, Chinh C., and John F. Yanagida. 2019. "Environmental Impact Assessment of Banagrass-Based Cellulosic Ethanol Production on Hawaii Island: A Spatial Analysis of Re-Suspended Soil Dust and Carbon Dioxide Emission" Applied Sciences 9, no. 13: 2648. https://0-doi-org.brum.beds.ac.uk/10.3390/app9132648