Simulation Study of Low-Velocity Impact on Polyvinyl Butyral Laminated Glass Based on the Combined TCK-JH2 Model

1
School of Civil Engineering and Transportation, South China University of Technology, Guangzhou 510640, China
2
Civil Engineering Institute, Guangzhou College of South China University of Technology, Guangzhou 510800, China
*
Author to whom correspondence should be addressed.
Appl. Sci. 2019, 9(15), 3204; https://0-doi-org.brum.beds.ac.uk/10.3390/app9153204
Submission received: 15 July 2019
/
Revised: 27 July 2019
/
Accepted: 31 July 2019
/
Published: 6 August 2019
Abstract
:In this paper, both experimental tests and numerical simulations of Polyvinyl Butyral (PVB) laminated glass pane under low-speed impact were carried out. In order to accurately predict the responses of annealed glass under low-speed impact, a constitutive model combined of the Taylor–Chen–Kuszmaul (TCK) model and the Johnson-Holmquist Ceramic (JH2) model is proposed. In order to describe the tensile damage characteristic of annealed glass, a rate-dependent TCK model is employed. The JH2 model is adopted when the glass material is under compression. The velocity and force of impactor, deflection of central point of glass pane, and the cracking pattern are studied to verify the combined TCK-JH2 model. Furthermore, the effects of the thickness of glass layer and PVB interlayer are investigated.
1. Introduction
Due to good transparency, annealed glass is often used in window panes and curtain wall systems in modern buildings. However, annealed glass is threatened by extreme loads such as impact and blast. Under these extreme conditions, sudden cracking, fragmentation, and even splashing of debris may occur due to the brittleness. For example, post-disaster reports of Hurricane Alicia (Houston, Tex., 1983), Hurricane Hugo (Carolinas, 1989), and Hurricane Andrew (Florida, 1992) cite windborne debris as a major contributor to glass damage [1]. In addition, in the Norway bomb attacks of 2011, shock waves from the explosion led to the damage of glass, and 209 out of the total 325 injuries were associated with glass laceration [2]. Even though the study of glass materials under dynamic loading is vital, there is no suitable constitutive model for numerical simulation yet. For this reason, it is necessary to analyze the causes of the destruction of glass windows under dynamic loading so as to find a more appropriate constitutive model to describe the process of damage.
Annealed glass, which had undergone a slow cooling process, mainly consists of silicon dioxide. Due to the strong chemical bonds, glass can theoretically have a strength of dozens of gigapascals. However, because of several factors such as imperfections like scratches and bubbles, the actual strength of glass is far less than the theoretical strength.
Moreover, due to the surface flaws, the tensile strength of glass is much less than the compressive strength. Table 1 shows that the compressive strength of glass is 7–20 times greater than the tensile strength. The experimental results [3] show that, under impact loading, the nucleation of the crack in the laminated glass plate is in the tension zone. For this reason, we need a more appropriate constitutive model to describe the tensile behavior of glass under dynamic loading.
In the numerical simulation of glass response under dynamic loading, the elastic model is the most convenient owing to its computational efficiency. For instance, Larcher [7] analyzed the dynamic behavior of glass panes under blast loading with the elastic model that combines principal stress and principal strain as a failure criterion. Furthermore, the elastic model combined with Tuler-Butcher [8] failure criterion can also be seen in recent research, in which the time-dependent dynamic characteristic is considered. In addition, Xu [9] applied the elastoplastic constitutive model to simulate the dynamic response of a glass windshield under impact loading. In their research, the plastic failure strain was studied. They drew a conclusion that the simulation results agreed well with the test when the plastic strain was set to be 0.001 or 0.0005.
However, in Table 1 we can also find that the dynamic strength is obviously greater than the static strength. Peroni [5] and Zhang [6] pointed out that not only compressive strength, but also tensile strength is rate dependent. Tensile dynamic increment factors (DIF) of annealed glass with respect to strain rate were formulated by Zhang [6]. This implies that the linear elastic model with a single failure criterion are inappropriate in the simulation of failure of glass under the dynamic condition. At present, there are few relative studies on dynamic tensile constitutive of glass materials, especially considering strain rate effect.
Taylor, Chen, and Kuszmaul [10,11] implemented the Taylor–Chen–Kuszmaul (TCK) model, which is a continuum damage model, to describe the behavior of oil shale under explosion loading conditions.
By defining the relationship between volume strain and the number of microcracks, the TCK model describes the damage evolution process from a microscopic point of view. In [10], damage grows when the strain rate is greater than the maximum strain rate (max). Shahzamanian [12] proposed the modification that damage can grow with every strain rate. Therefore, in the modified TCK model, not only the tensile damage characteristic, but also the strain rate effect of materials is able to be considered.
In general, brittle materials undergo plasticity during compression. Moreover, the yield strength increases evidently with the increase of strain rate. The JH2 model [4] (the Johnson-Holmquist Ceramic model) is able to describe these characteristics very well. For this reason, JH2 is widely used in the dynamic simulation of glass. For example, the response of laminated glass under blast loading is calculated with the JH2 constitutive model by Hidallana-Gamage [13]. A study of the laminated glass response to blast and windborne debris with the JH2 constitutive model was conducted by Zhang [14,15]. Since the material constants of glass of JH2 in [14,15] are originally used for military ballistic penetration analysis, an error occurs when these constants are adopted in the analysis of window glass. As a result, Zhang [6,16] updated the constants of the JH2 model for window glass through a series of experiments. Based on JH2, a series of improved models, which are applied to the analysis of the transparent armor, were proposed by Johnson and Holmquist [17,18,19]. These models describe the compressive characteristics of glass very well, and yet the description of the tensile characteristics is not accurate enough.
In this paper, in order to describe the tensile damage characteristic of annealed glass, a rate-dependent TCK model is employed. The JH2 model is adopted when the glass material is under compression. After the implementation of this combined TCK-JH2 model is described, some experiment tests were conducted with various PVB laminated glass panes under impact loading. The experimental results are compared with the numerical results in order to verify the combined TCK-JH2 model. Furthermore, the effects of the thickness of glass layer and PVB interlayer are investigated.
2. The Combined TCK-JH2 Model
Since the TCK model is appropriate to describe the tensile characteristics of glass under impact loading, it will be employed when the material is under tension. Meanwhile, in order to simulate the compressive response of glass precisely, the JH2 model is employed when the material is under compression. In this paper, volumetric strain (εv) is used to determine the status of material. When εv > 0, it is determined that the material is under tension. Otherwise, it is determined to be under compression.
2.1. TCK Model
The TCK model describes the damage development process of brittle materials under tension. The equation of damage constitutive model can be expressed as follows:
where σij is stress component, eij is deviatoric parts of the strain components, εkk = ε11 + ε22 + ε33, δij is Kronecker delta, K is bulk modulus of material, G is shear modulus of material, Dt is tensile damage scalar, as shown in the following expression:
which can be expressed by Poisson’s ratio after damage initiate () and crack density (Cd). Additionally, the expressions of and Cd are as follows:
where the υ is Poisson’s ratio and β is a crack geometry parameter related to the shape of microcracks. When β = 0, the microcrack is flat and its volume is 0. When β = 1, the microcrack is a cube. In this paper, we make an assumption that the microcrack is a cube. As a result, β = 1. N is the number of microcracks, which is treated by a Weibull distribution. In addition, a is size of the microcrack. The corresponding expressions are
where k and m are parameters of Weibull distribution, εv is volumetric strain, KIC is the static fracture toughness, ρ0 is the initial density of material, c is the sound speed, and max is the strain rate at fracture.
In [12], the TCK model had been slightly modified, and average crack size is considered as
in which the is the current volumetric strain rate. This modification means that damage can grow with any strain rate in this article.
2.2. JH2 Model
The JH2 model can be used to describe the damage development process of brittle materials under compression. It consists of an equation of state, a strength model, and a damage model.
2.2.1. Equation of State
The equation of state of glass material can be written as follows:
where K1, K2, K3 are constants, and K1 is the material bulk modulus. μ = ρ/ρ0 − 1, in which ρ is the current density and ρ0 is the initial density. Δp is the increment of pressure after damage initiates. Pressure increment can be solved as:
where the βp is the coefficient of conversion. In this paper, βp = 1, which means the loss of the internal elastic energy (ΔU) will be totally translated to hydrostatic pressure potential energy.
2.2.2. Strength Model
The strength model of JH2 can be expressed by the equations as follows:
where A, B, C, M, N, and T are constants of the model, Dc is the compressive damage scalar. Stress can be normalized in the form of σ* = σ/σHEL, where the σHEL is the equivalent stress at Hugoniot Elastic Limit (HEL) [20]. σi* = σi/σHEL is the normalized strength of the intact glass. σf* = σf/σHEL is the normalized compressive strength of the glass at fracture. p* = p/pHEL is the normalized hydrostatic pressure, where the pHEL is the pressure at HEL. T* = T/pHEL is the normalized maximum tensile hydrostatic pressure. = / is the normalized strain rate, where = 1.0 s−1.
2.2.3. Damage Model
The damage in the JH2 model can be defined by:
where Δεp is the plastic strain during a cycle of integration, and is the plastic strain to fracture under constant pressure, P. The specific expression is given by
where D1 and D2 are material constants.
2.3. Determination of Material Constants
The glass material model is a combination of the TCK model and JH2 model. In the TCK model, there are two constants to be determined: k and m. In [11] the authors provided a convenient method to determine these two constants, which can be written as
where σt is the tensile strength at a specific strain rate. C0 is an undetermined term. Two points on the fracture stress versus strain rate curve can be used with Equation (15) to determine m. After the determination of m, the constants of k can be determined by Equation (16). The stress versus strain rate curve used in this paper is obtained from [6].
3. Verification of the Combined TCK-JH2 Model
In order to verify the combined TCK-JH2 model in predicting the dynamic responses of annealed glass material, drop-weight tests as well as the numerical simulations of laminated glass panes were carried out. The experimental tests and the numerical simulations are presented in detail in the following section.
3.1. Drop-Weight Test
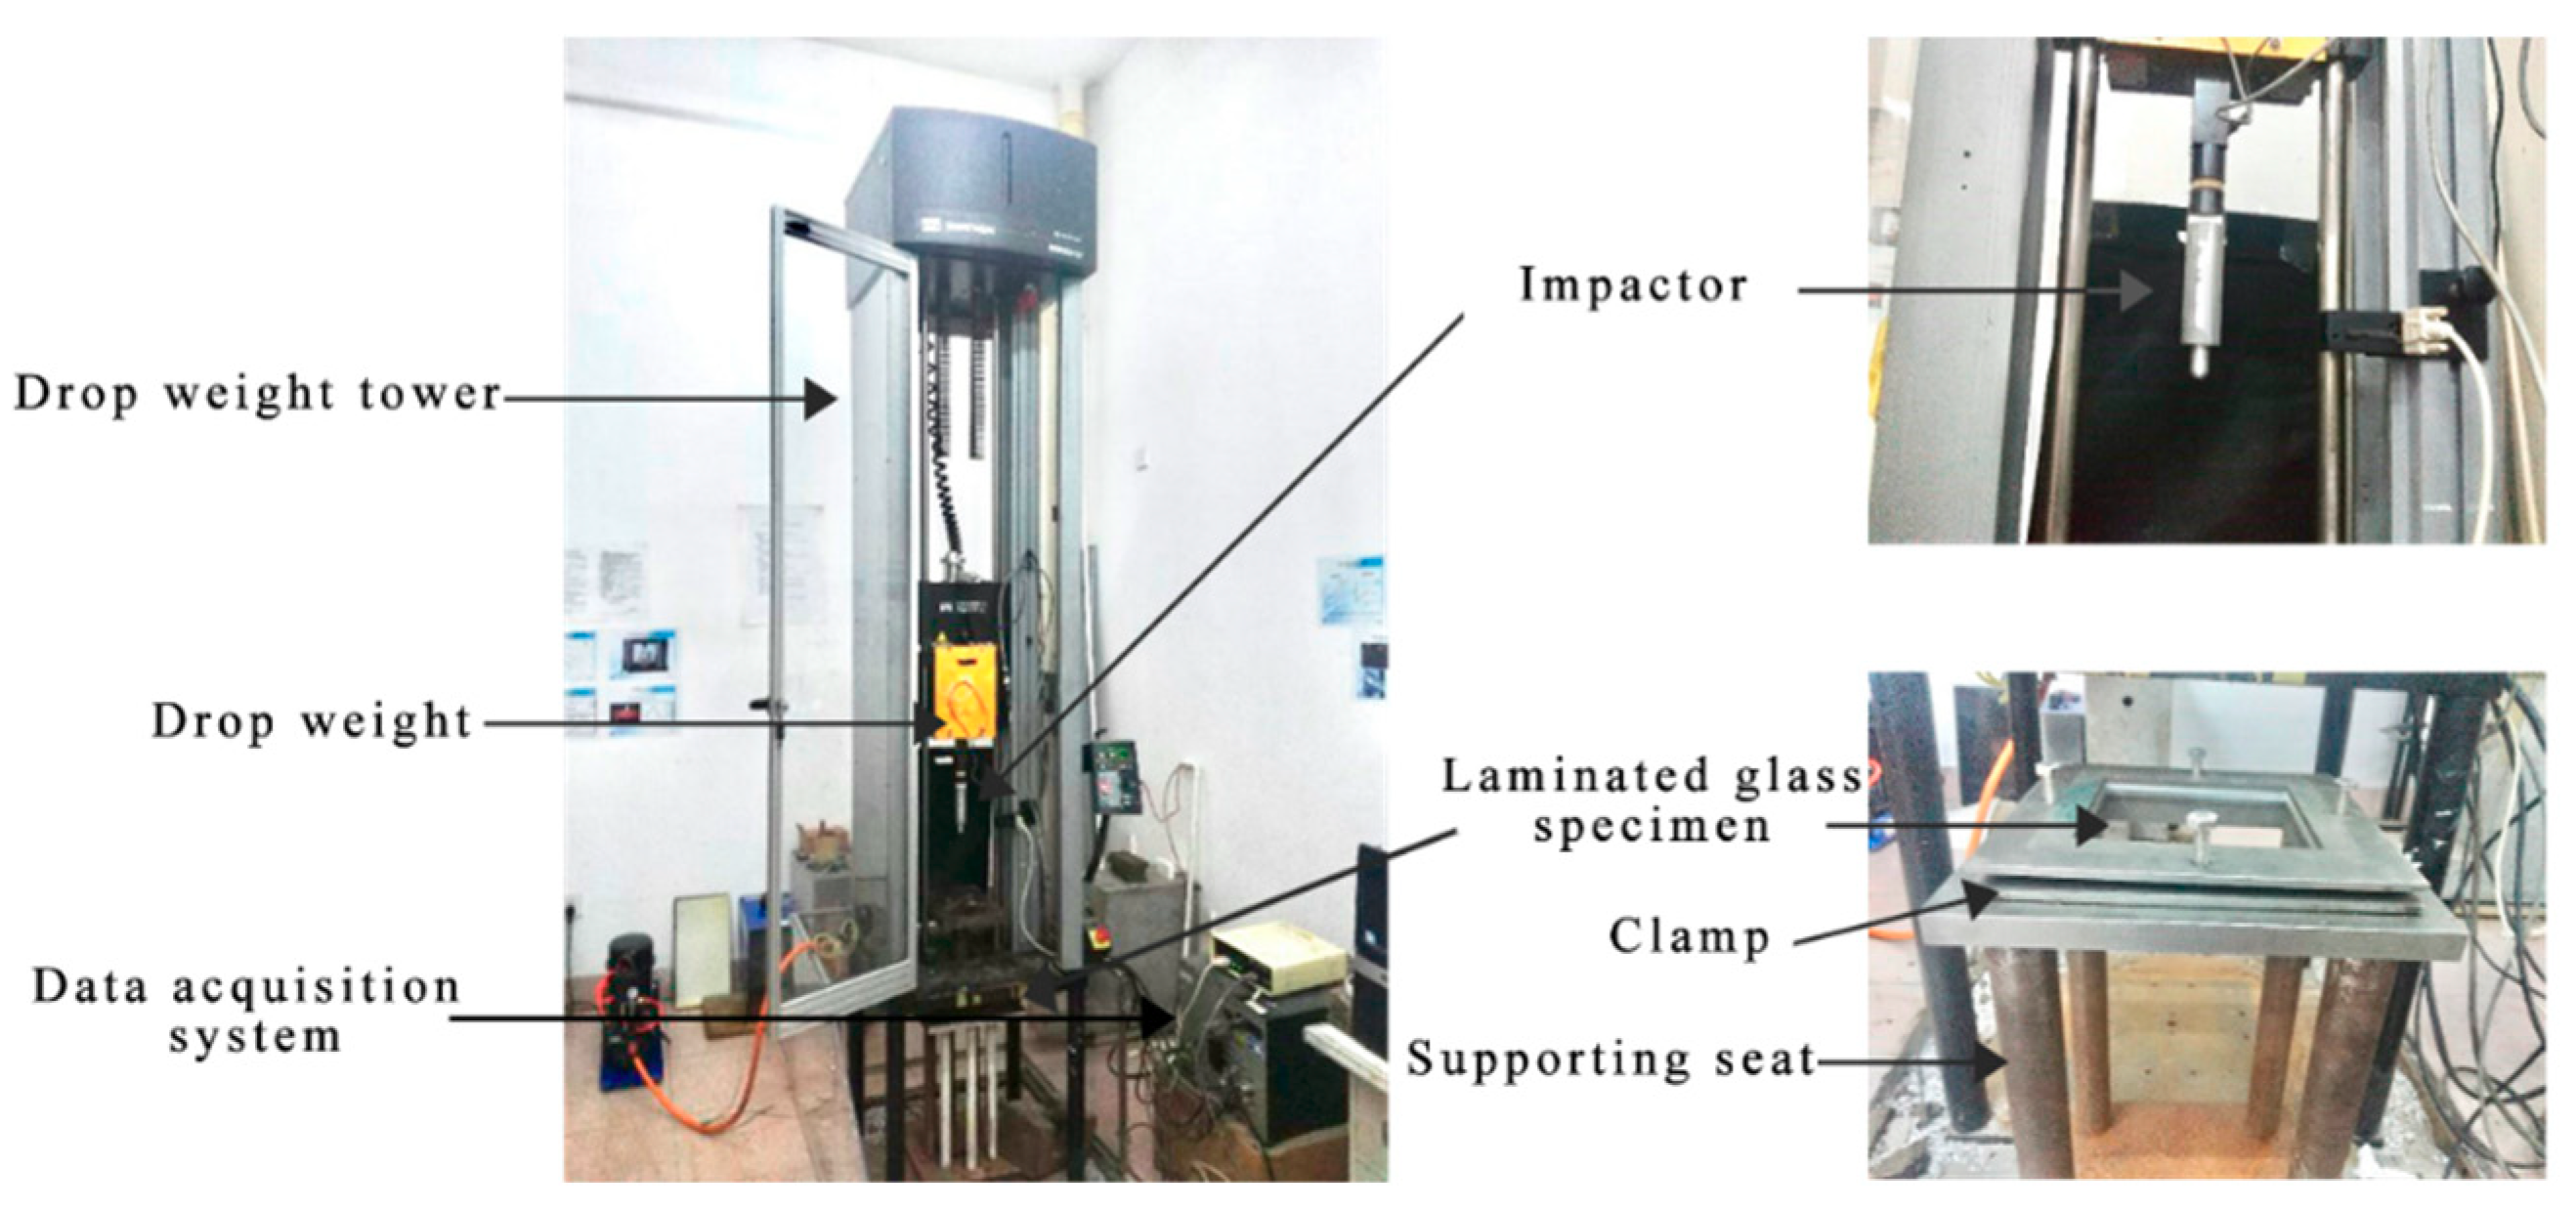
The laminated glass used in this experimental study was provided by Guangzhou Huafeng Safety Glass Co. Ltd., No. 68, Big Bridge street, Xilang, Liwan District, Guangzhou, Guangdong, China. The drop-weight tests were carried out by Instron® Dynatup 9250 HV impact instrument, as shown in Figure 1. The Instron® Dynatup 9250 HV impact instrument used in this experiment was manufactured by Instron®, 825 University Ave. Norwood, MA 02062-2643, USA. The impact test apparatus consists of a drop tower equipped with an impactor that can vary the balance weight, and a high-speed data acquisition system was also equipped to obtain data during the test. The test machine can adjust the impact energy by adjusting the weight mass or the drop height. During the test, the laminated glass specimen was supported by a clamper which mainly consists of the nut, bolt, a pair of rubber cushions and a pair of steel clamp plate. The specimen was placed in the clamper and the bolt was tightened. The clamper was placed on the supporting seat.
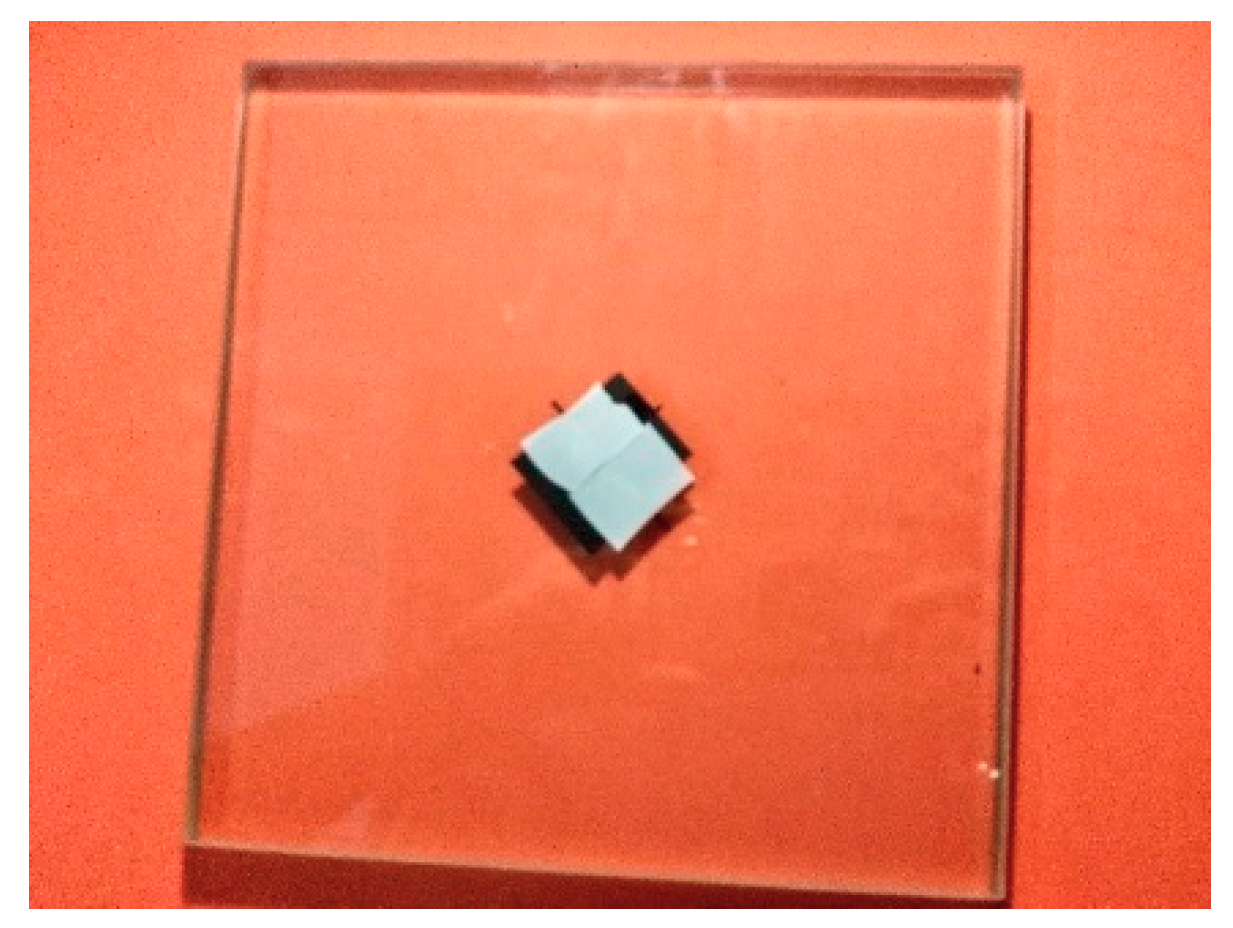
The laser displacement sensor OptoNCDT 1605 was employed to measure the displacement of the central point of the specimen under impact loading. The OptoNCDT 1605 was manufactured by Micro-Epsilon Messtechnik GmbH & Co.KG, Koenigbacher Str.15 D-94496 Ortenburg/Germany As a laser is used to test, the requirement for the tested object is that the target can diffuse reflection, not absorb the laser and not let the laser penetrate the specimen. However, the specimen to be tested was the laminated glass with good transparency. Therefore, we needed to stick black and white stickers on the back of laminated glass, as shown in Figure 2. The underlying black sticker ensured that the laser did not penetrate the laminated glass. The white sticker ensured that the laser was not absorbed on the surface. Moreover, the white sticker was made of materials that diffuse reflection rather than mirror reflections.
Acceleration and reaction force of the impactor can be acquired automatically by The Instron® Dynatup 9250 HV impact instrument. The acquisition time interval was set to 100 ms. The acquisition frequency was 81.9 kHz. The frequency of laser displacement sensor OptoNCDT 1605 was set to 50 kHz.
The diameter of the hemispherical end of impactor was 15.95 mm. The mass of the impactor was 10.093 kg. The rubber cushion was 20 mm wide and 4 mm thick. The laminated glass was a square with a width of 200 mm. The thickness of the laminated glass and its corresponding impact velocity is shown in Table 3.
A total of four specimens were tested: LG-03114, LG-06114, LG-06076, and LG-06038. Specimens were named in the following manner: take specimen LG-03114 for example, LG means laminated glass. Next, 03 means that the thickness of glass is 3 mm. Finally, 114 means that the thickness of interlayer is 1.14 mm.
The LG-03114 and LG-06114 have similar velocity while the impact velocity of LG-06076 and LG-06038 are close to each other. By comparing LG-03114 and LG-06114, we can study the effect of the thickness of glass layer. By comparing LG-06076 and LG-06038, we can study the effect of the thickness of PVB interlayer.
3.2. Finite Element Model
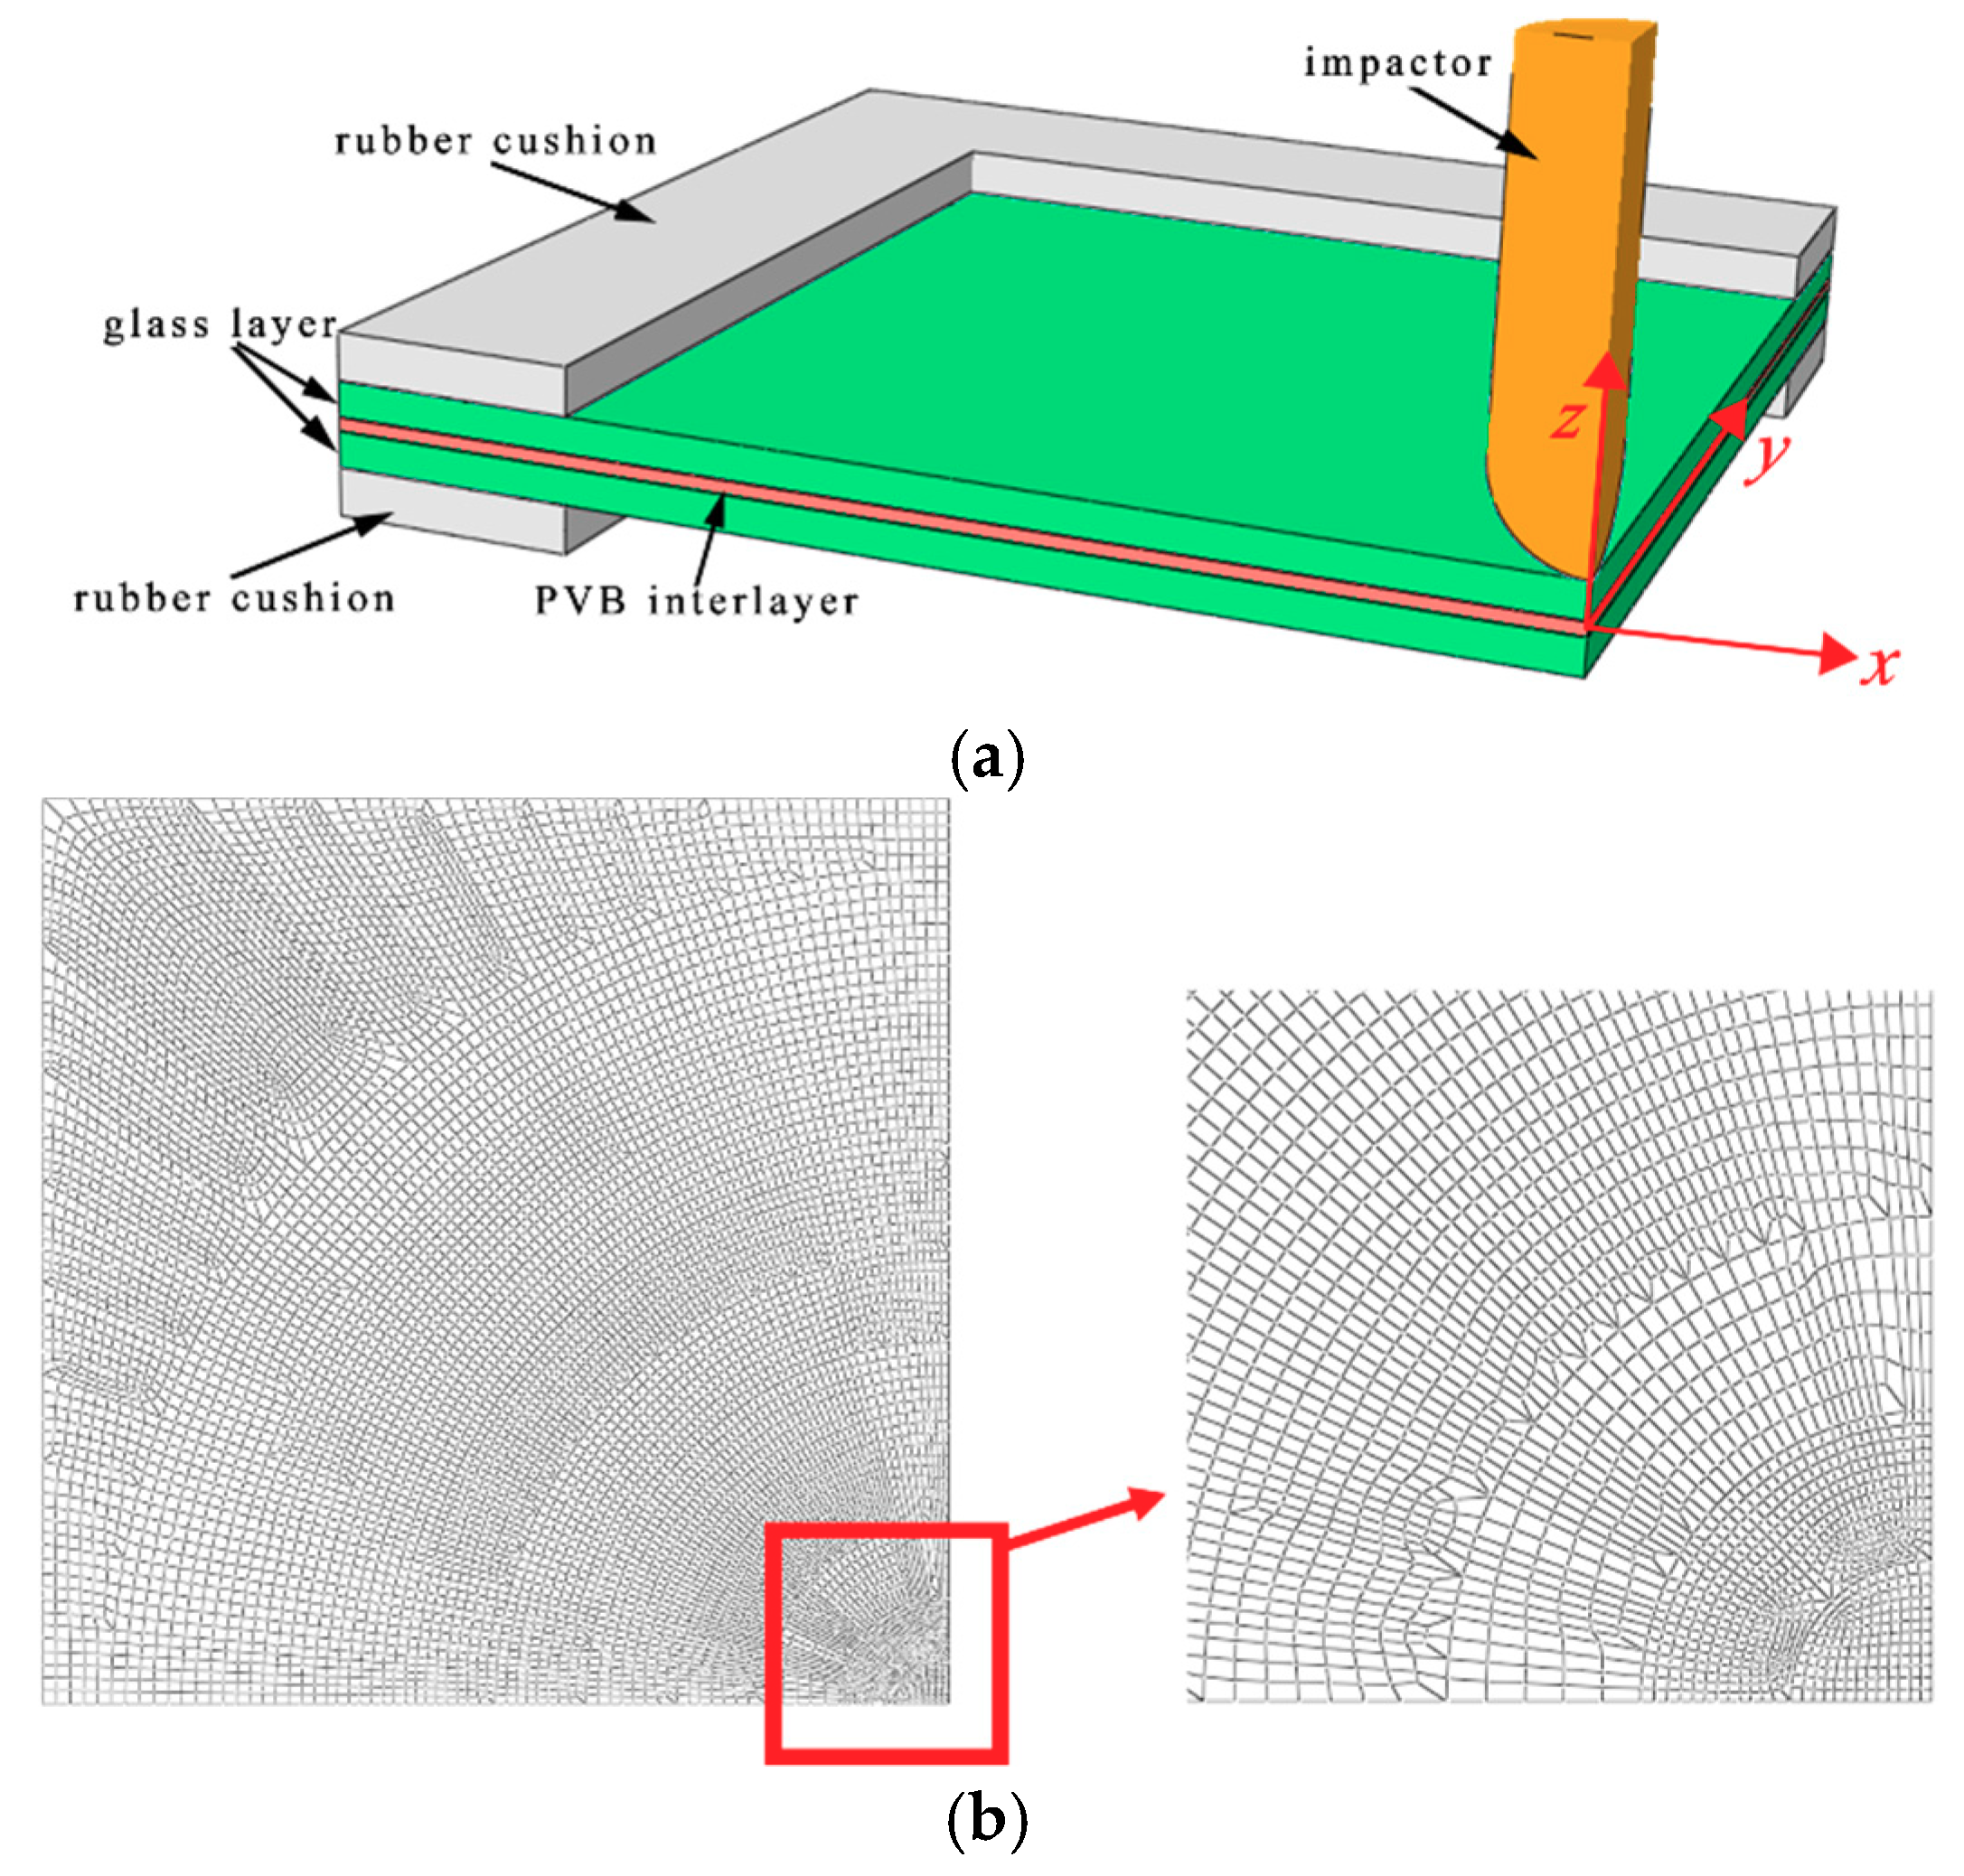
The drop-weight test described above was replicated numerically to verify the glass material model. Figure 3a shows the parts of the finite element model. The finite element model consists of the impactor, two layers of glass, the PVB interlayer, and the rubber cushion. The dimensions of these parts are in accordance with tests. However, due to symmetry, only one quarter of the model was simulated to decrease the analysis time.
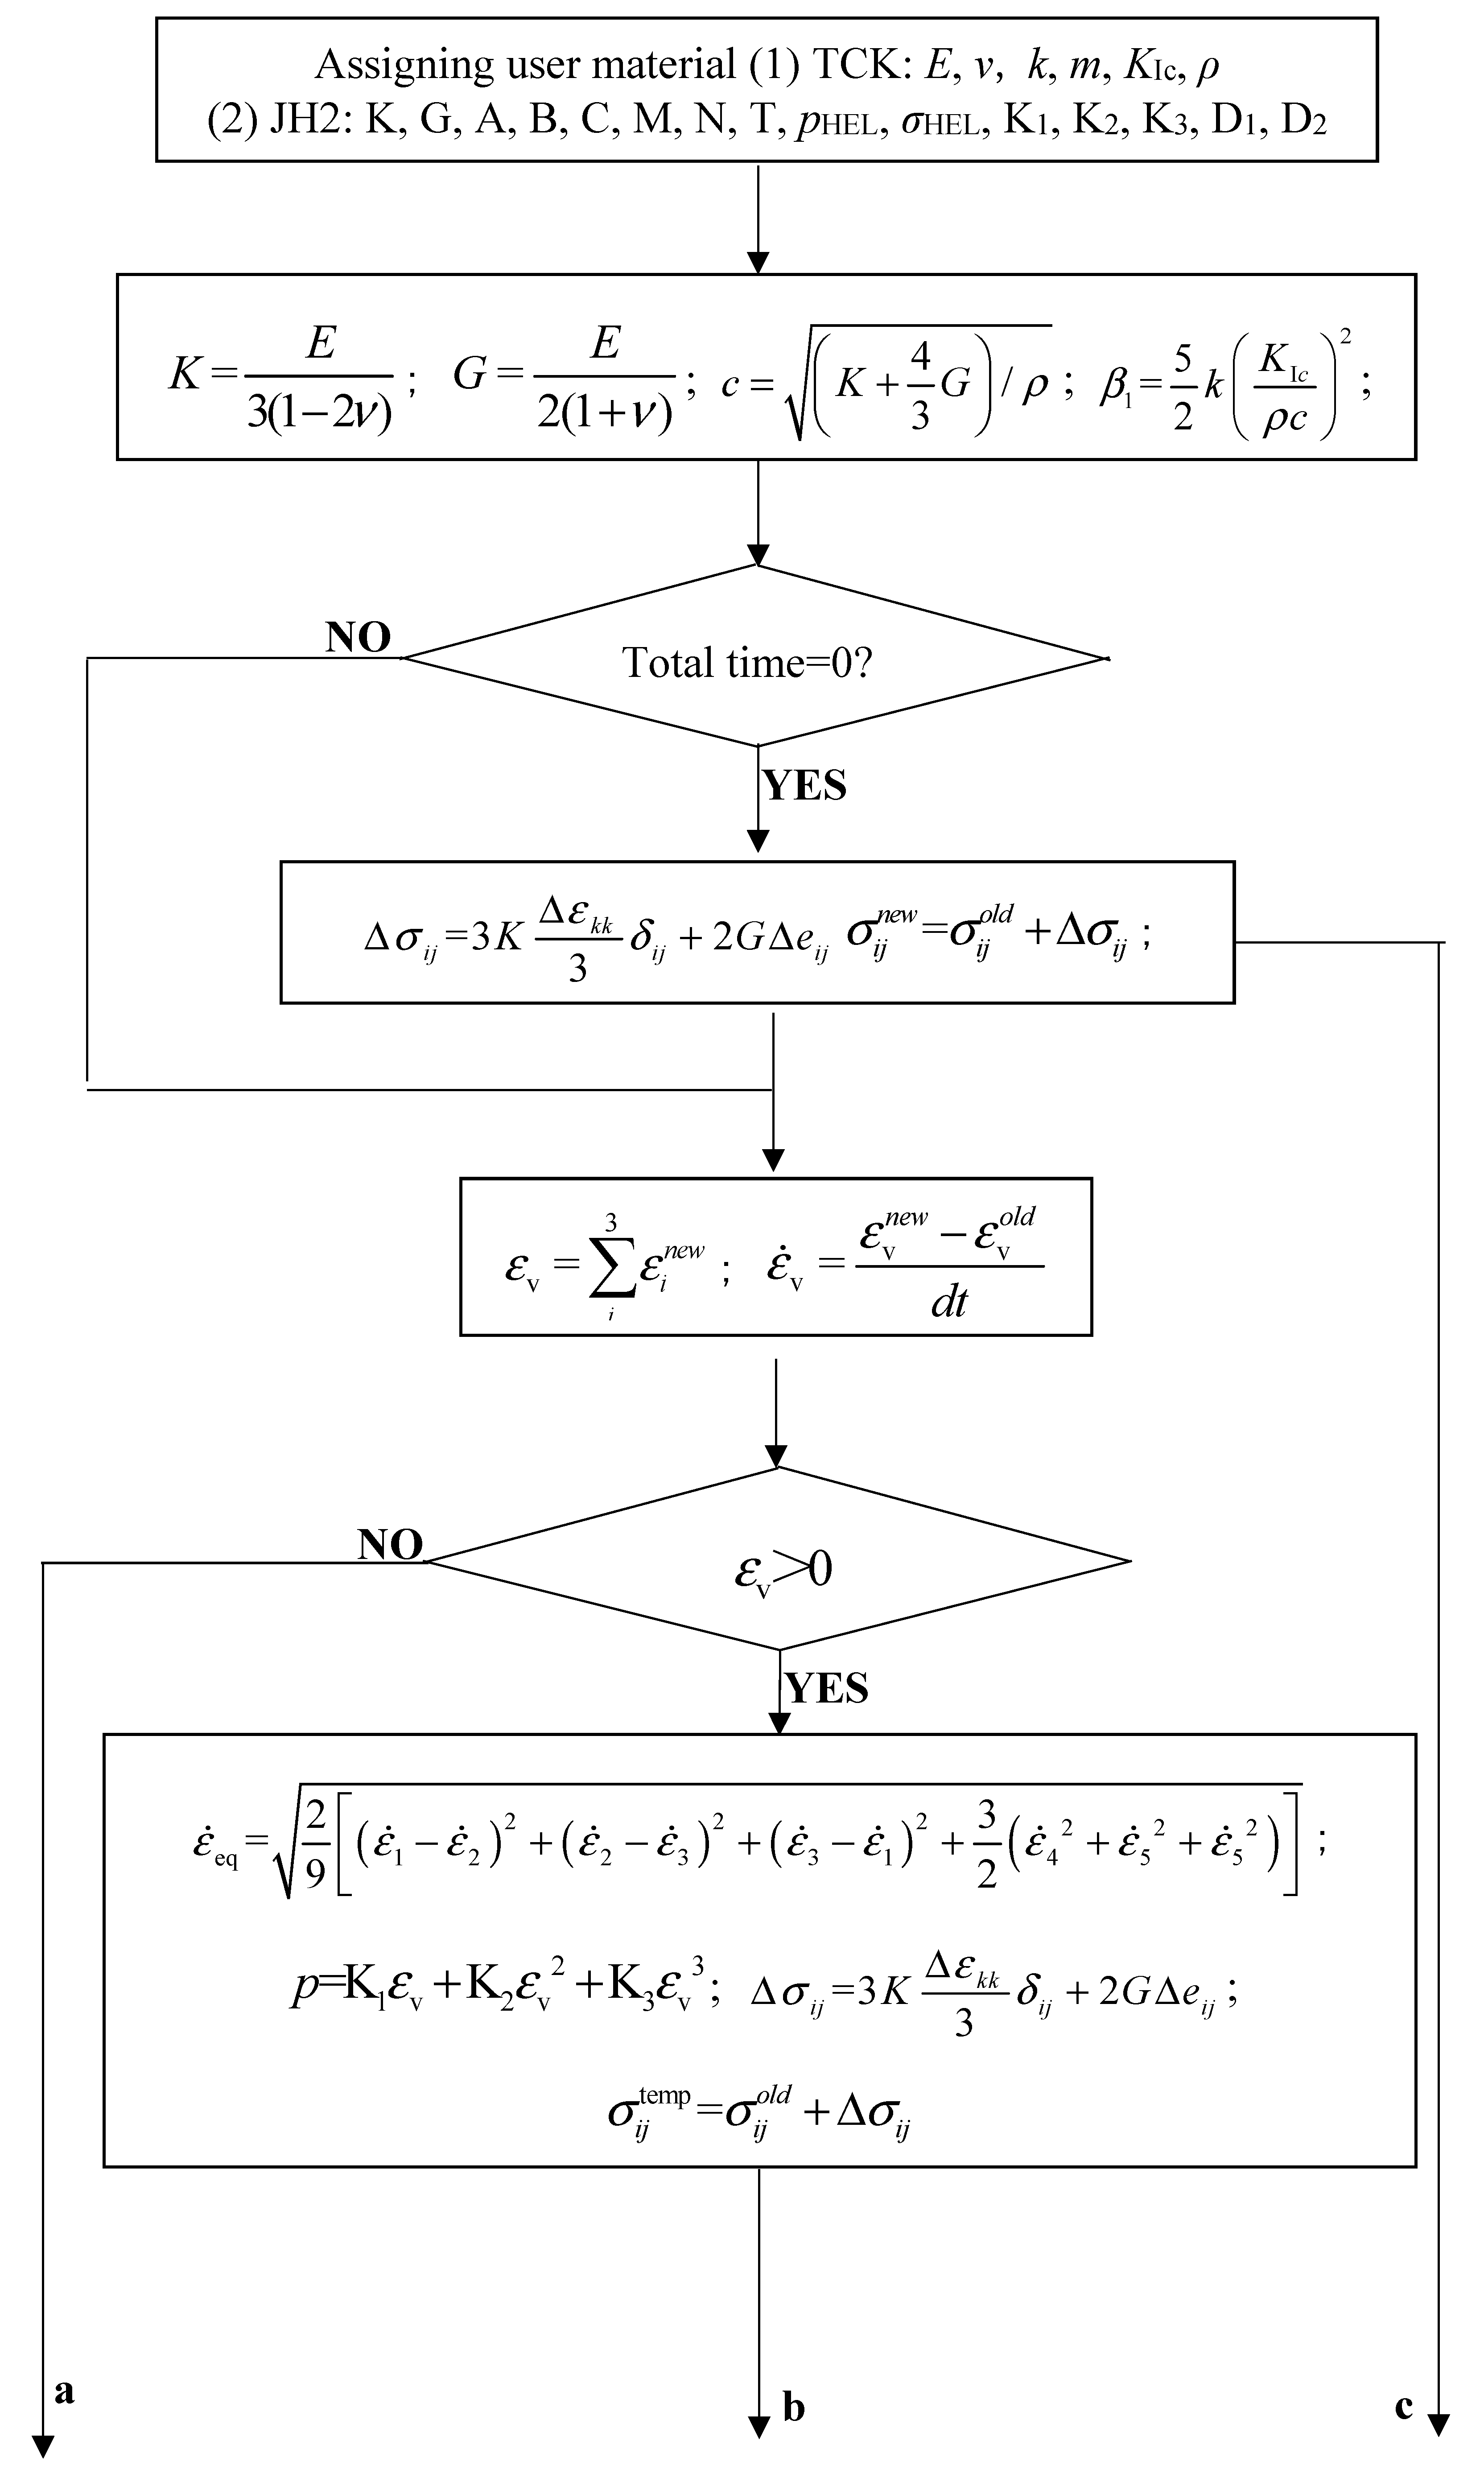
In numerical simulation, the combined TCK-JH2 constitutive model was employed to describe the material model of glass. The constants of this model are shown in Table 2. Based on the combined TCK-JH2 model, a user-defined material subroutine (VUMAT) was compiled by FORTRAN and connected with commercial finite element code ABAQUS/Explicit to calculate the tensile and compressive damage. The volumetric strain εv was used as a criterion to determine to element status. When εv > 0, it is determined that the material is under tension. Otherwise, it is determined to be under compression. Two damage scalars were adopted: Dt (under tension) and Dc (under compression). From tension to compression, the stiffness of the element should be multiplied by (1 − Dc). However, from Compression to tension, the stiffness of the element should be multiplied by (1 − Dt)(1 − Dc). Details of implementation process of the combined TCK-JH2 model is presented by a flow chart in the Appendix A. The interlayer material PVB was revealed to be a rate-dependent material in laboratory tests. It is common that the elastic model is employed to describe PVB material under static loading. However, when PVB is under high strain rate, hardening and strengthening occur. For this reason, the elastoplastic model [7,13,14] is used in this paper. Yield stress (σyield), initial Young’s modulus (Einitial), and failure stress (σfailure) of PVB at different strain rates are described as:
The density, Poisson’s ratio, and plastic modulus (Eyield) of PVB used in this study is shown in the Table 4 [7,13,14].
The elastic model is used to describe the rubber cushion in this study. The Young’s modulus and Poisson’s ratio are 2.3 MPa and 0.495 respectively. The impactor was regarded as a non-deformed rigid object. The Young’s modulus and Poisson’s ratio are 210 GPa and 0.3, respectively.
The average mesh size was 1 mm. At the area near the impact regions, glass layer, PVB interlayer and impactor were meshed with denser elements. As a result, the mesh size around the contact point was 0.5 mm. The hourglass mode was carefully checked in the mesh model. In order to prevent the zero-energy mode of the element, the mesh model with different number of elements through-thickness were pre-simulated. When the proportion of artificial strain energy is 10% less than the internal energy, the accuracy of the mesh model is satisfied. Through some pre-simulations, the element size in the thickness direction was set to 0.3 mm. In the thickness direction of PVB interlayer, it was meshed into four elements. An eight-node linear brick element with reduced integration was adopted in this finite element model. The Figure 3b shows the mesh model of the glass layers and the PVB interlayer shares the same meshing pattern.
Tie constraint was defined between the contact surfaces of glass and PVB interlayer. The surface contact, in which the tangential formulation is set to be frictionless and the normal behavior is set to be a hard contact, was used to define interactions between glass and cushion as well as glass and impactor.
In the definition of boundary condition, the vertical direction of the upper and lower surfaces of the rubber cushion are constrained, as shown:
where the u3 is the translational degrees of freedom in the z direction. tglass, tPVB, and tcushion are the thickness of glass layer, PVB interlayer, and the rubber cushion, respectively.
On the symmetric surfaces of impactor, laminated glass and rubber cushion, the symmetric boundary conditions are defined as:
where the u1 and u2 are the translational degrees of freedom in the x and y directions, respectively. The directions of x, y, and z are shown in the rectangular coordinate system in Figure 3a.
4. Results and Discussion
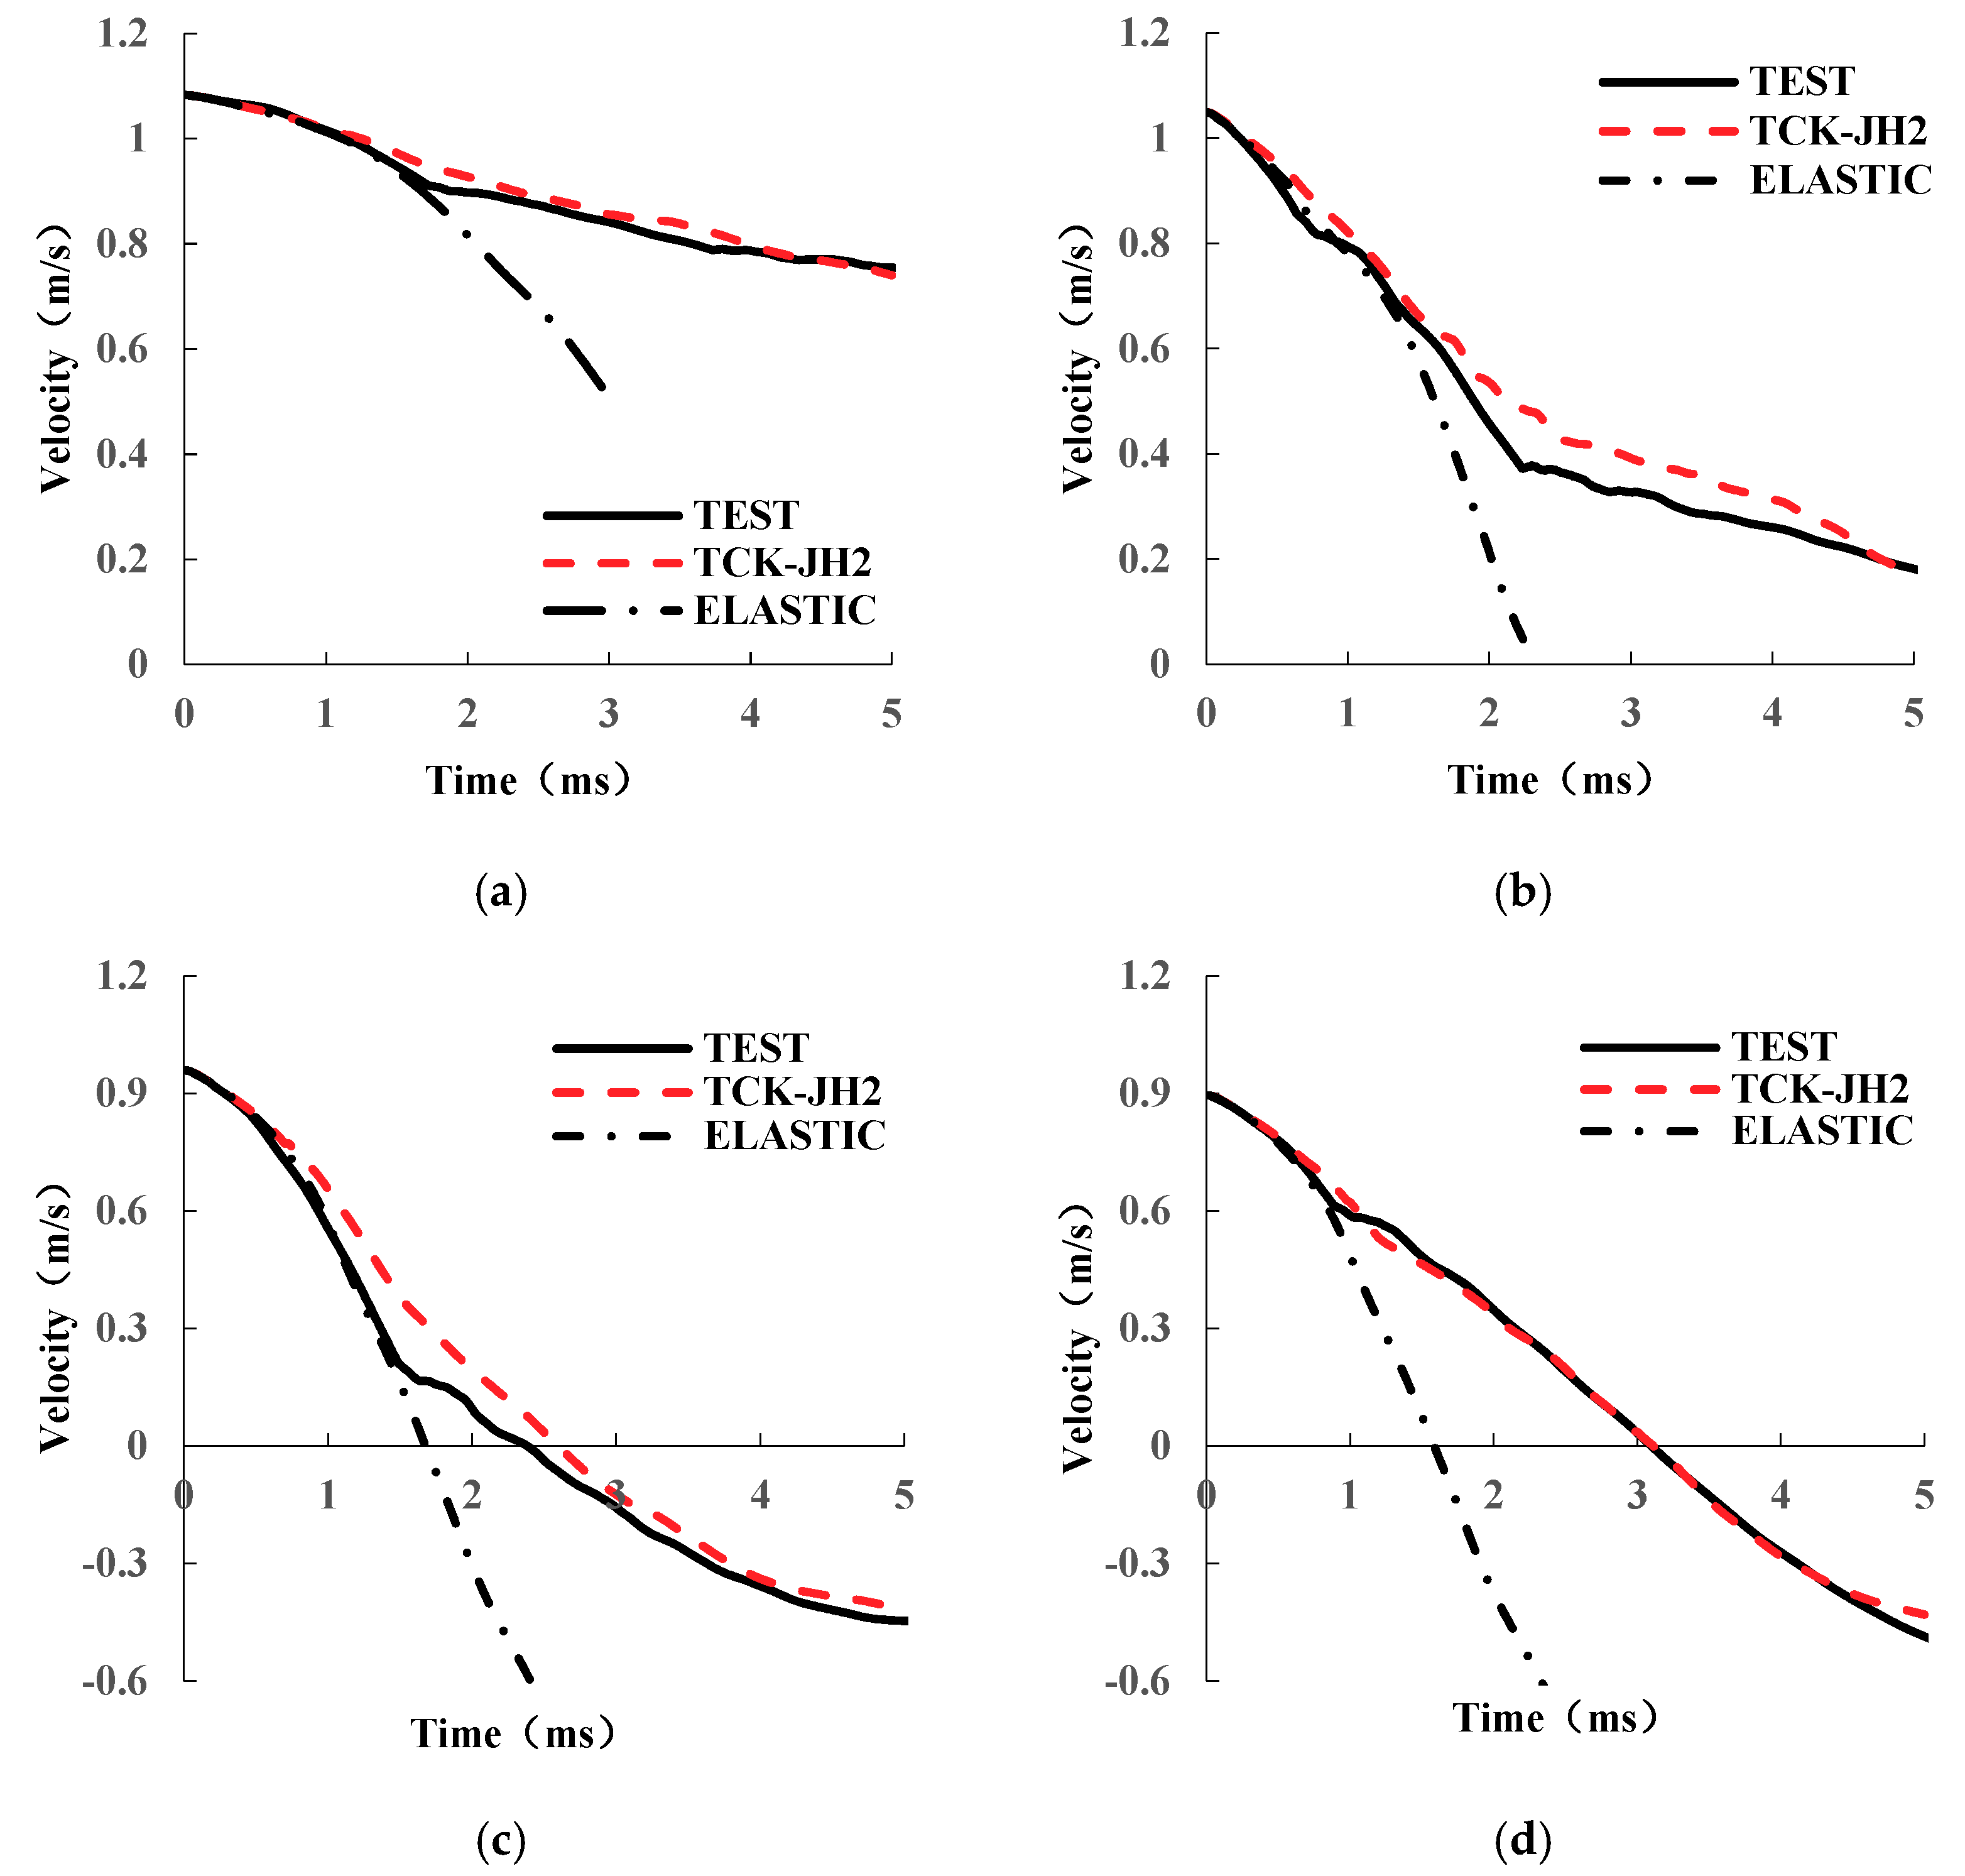
Figure 4 presents the velocity-time curves of impactor tested with four specimens of different thicknesses. In these figures, experimental results and numerical results conducted with the combined TCK-JH2 model and elastic model are given. The experimental results are presented with black solid lines. The numerical results conducted with the elastic model are presented with the red black dotted lines and the results conducted with TCK-JH2 model are presented with red dash lines.
The elastic model conducted in this study can be described by the following equation:
where the σ is stress, ε is strain, and E is Young’s modulus. The impact process can be divided into two stages. In the initial stage, the glass layers are in elastic state. In this state, the results from the combined TCK-JH2 model and the elastic model are similar, which indicates that the combined model is able to simulate the elastic response of glass accurately.
In the second stage, glass layers start cracking due to the accumulation of damage. After the cracking, the stiffness of the laminated glass pane significantly decreases. It can be observed that the slope of the velocity-time curve changes. From this we can conclude that the combined TCK-JH2 model can accurately simulate the accumulation of the damage of glass layers.
Comparing the velocity-time curves of Figure 4a,b, when the impact velocity and the thickness of PVB interlayer are the same, it can be seen that the thicker glass layer has better deceleration effect. Comparing Figure 4c with Figure 4d, under the same impact velocity and glass thickness, it can be seen that the thicker PVB interlayer has better deceleration effect.
Figure 5 depicts the force-time curves of impactor. Obvious vibration can be detected along the force-time curves, which mostly results from the reflection of stress wave. The vibration is serious in Figure 5a,b owing to the bigger impact velocity.
Like velocity-time curve, the force-time curve can be divided into two stages. At the initial stage, the glass layer is in elastic state, and the force acting on the impactor gradually increases to a peak value. Along with the accumulation of damage, the glass begins to crack. At the same moment, the force dramatically reduces and remains at a lower value.
The peak force at Figure 5a is 1.96 kN whereas 5.09 kN at Figure 5b, which shows that the laminated glass can be strengthened obviously by increasing the thickness of the glass. By comparing Figure 5c,d, it is found that increasing the thickness of PVB interlayer can also increase the strength of laminated glass.
The numerical results simulating with the combined TCK-JH2 model are also presented in Figure 5. As comparison indicates, two stages of the impact process are correctly predicted. The peak force of the initial stage and the moment of cracking are close to the experimental results. Therefore, numerical simulation conducted with the combined TCK-JH2 material model for glass gives good predictions of reaction force in low-speed impact. To a minor extent, some mismatches of peak force time can be detected in the comparison between the numerical results and experimental results in Figure 5. The reasons for this phenomenon are various. For example, the flaws on the surfaces of the glass layers could result in the premature cracking of the glass, which may be the primary reason.
After the cracking of the glass layer, the velocity curves keep decreasing in Figure 4 meanwhile the force curves still remain above zero in Figure 5. This phenomenon can be explained in that although the glass layers are damaged, the laminated glass panes still have the ability to carry loads. This is because the glass can bear compression even though it is completely damage. The combined TCK-JH2 constitutive model of glass is equipped with two damage variables, Dt (under tension) and Dc (under compression). When the Dt reaches 1, the corresponding element fails to bear any loads. However, when the Dc reaches 1, the element still residue a small part of stiffness of its intact state. As a consequence, the damaged section can still bear loads.
Figure 6 presents the deflection-time curves of the central point of the laminated glass pane from the experimental results as well as the numerical simulation results conducted with the combined TCK-JH2 model.
After the cracking occurs to the glass layers, the slope of the deflection curves gets lower. The moment of maximum deflection corresponds to the moment when the velocity of impactor drops to zero. Finally, the deflection decreases owing to the residual elasticity of the laminated glass pane.
Comparing the deflection-time curves of Figure 6a,b, it can be seen that the peak deflection of LG-06114 is evidently smaller than the one of LG-03114. As shown in Figure 6c,d, the peak deflection of specimen LG-06076 is 1.17 mm whereas the LG-06038 is 1.80 mm. It is concluded that the laminated glass pane with the thicker PVB interlayer can effectively reduce the deformation. Moreover, as the PVB interlayer is thinner, the vibration of the deflection-time curve is more obvious.
Comparing the experimental results with the numerical results of Figure 6, the finite element model can predict the peak deflection and its corresponding time correctly, which also shows that the finite element conducted with the combined TCK-JH2 model is able to predict the deflection of laminated glass under low-speed impact.
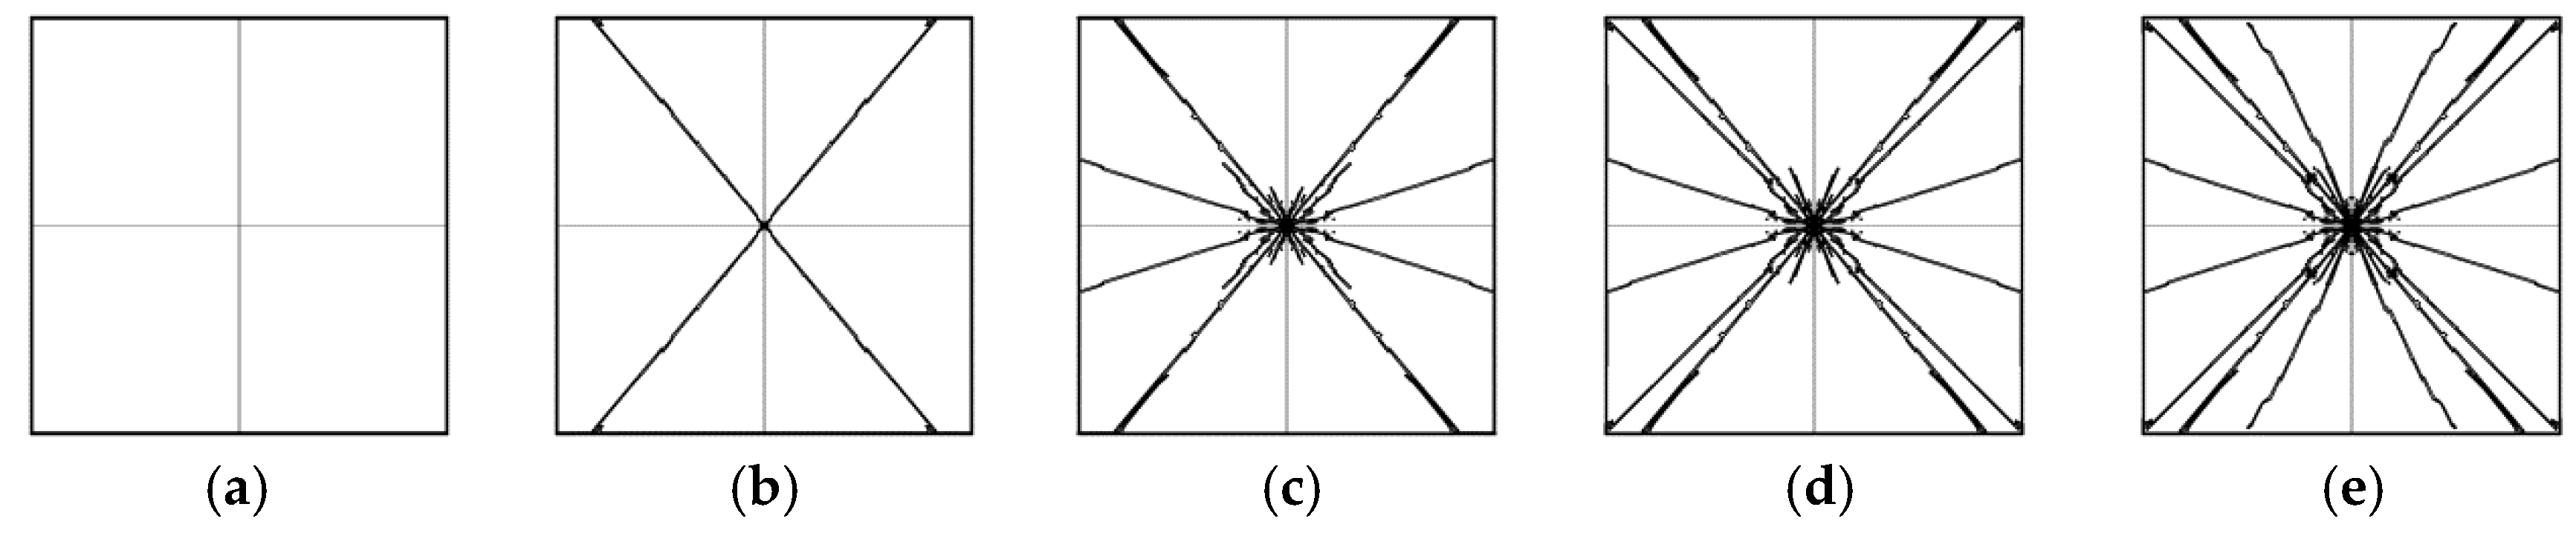
Figure 7 shows the typical crack pattern of the test and numerical results, which is conducted with the specimen LG-03114. Other specimens tested in this paper share the same crack pattern with specimen LG-03114. The element deletion method was used to demonstrate the position and geometry of cracks. When the Dt reaches to 1, the corresponding element is deleted. The numerical results conducted with TCK-JH2 model are consistent with the experimental results. A large number of radial cracks can be observed both in the test and numerical results. Moreover, the radial cracks are most dense at the diagonal line where the angular velocity is discontinuous. No circular crack appeared in the simulation results, which is consistent with the testing results.
The cracking process of the laminated glass pane is shown in Figure 8. The first crack can be detected at the impact area of the glass at about 2 ms, corresponding to the time of the sudden drop of force in Figure 5. After that, the stiffness of the laminated glass pane decreases and the number of radial cracks increases. In the end, as the velocity of the impactor decreases, the cracking of laminated glass pane tends to be stable.
5. Conclusions
A combined TCK-JH2 material constitutive model of glass was proposed. The TCK model was adopted under tension whereas JH2 model was adopted under compression. Specimens with different glass thickness and PVB thickness were tested. The experimental results were employed to verify the numerical simulation results. By comparison, the main results are summarized in the following points:
- (1)
- The combination of the TCK-JH2 model was successfully implemented using the VUMAT FORTRAN ABAQUS subroutine. This constitutive model is rate-dependent both under the tensile and compressive conditions, which makes sure that the simulation of damage is more precise during the dynamic loading process.
- (2)
- After comparisons, the numerical results of velocity-time curve, force-time curve, deflection-time curve, and crack pattern are in reasonable agreement with experimental results. We can conclude that the combined TCK–JH2 model can accurately simulate the damage process of annealed glass under impact loading.
- (3)
- Lastly, increasing the thickness of glass layer or PVB interlayer has a good deceleration effect. The laminated glass can be strengthened obviously by increasing the thickness of the glass. Increasing the thickness of PVB interlayer can also slightly increase the strength of glass. Increasing the thickness of the glass layer or PVB interlayer can effectively reduce the deflection of the laminated glass pane under impact loading.
Author Contributions
D.W. and D.L. performed the numerical analysis and wrote the whole paper; Z.Z. performed the experimental tests.
Funding
The authors would like to gratefully acknowledge research grants from the National Natural Science Foundation of China (Project Nos: 11672110).
Conflicts of Interest
The authors declare that there is no conflict of interest regarding the publication of this paper.
Abbreviations
| a | Size of the microcrack |
| Cd | Crack density |
| c | Sound speed |
| Dc | Compressive damage scalar |
| Dt | Tensile damage scalar |
| E | Young’s modulus |
| Einitial | Initial Young’s modulus |
| Eyield | Plastic modulus |
| eij | Deviatoric parts of the strain components |
| G | Shear modulus |
| K | Bulk modulus |
| KIC | Static fracture toughness |
| k | Parameters of Weibull distribution |
| m | Parameters of Weibull distribution |
| p* | Normalized hydrostatic pressure |
| pHEL | Pressure at Hugoniot Elastic Limit |
| T* | Normalized maximum tensile hydrostatic pressure |
| tglass | Thickness of glass layer |
| tPVB | Thickness of PVB interlayer |
| tcushion | Thickness of rubber cushion |
| u1 | Translational degrees of freedom in x direction |
| u2 | Translational degrees of freedom in y direction |
| u3 | Translational degrees of freedom in z direction |
| β | Crack geometry parameter |
| βp | Coefficient of conversion |
| Δp | Increment of pressure after damage initiates |
| Δεp | Plastic strain during a cycle of integration |
| δij | Kronecker delta |
| Plastic strain to fracture under constant pressure | |
| εv | Volumetric strain |
| Strain rate | |
| Normalized strain rate | |
| max | Strain rate at fracture |
| μ | ρ/ρ0 – 1 |
| ν | Poisson’s ratio |
| Poisson’s ratio after damage initiate | |
| ρ | Current density |
| ρ0 | Initial density |
| σ* | Normalized equivalent stress |
| σf* | Normalized compressive strength of the glass at fracture |
| σHEL | Equivalent stress at Hugoniot Elastic Limit |
| σi* | Normalized strength of the intact glass |
| σij | Stress component |
| σt | Tensile strength |
| σyield | Yield stress |
| σfailure | Failure stress |
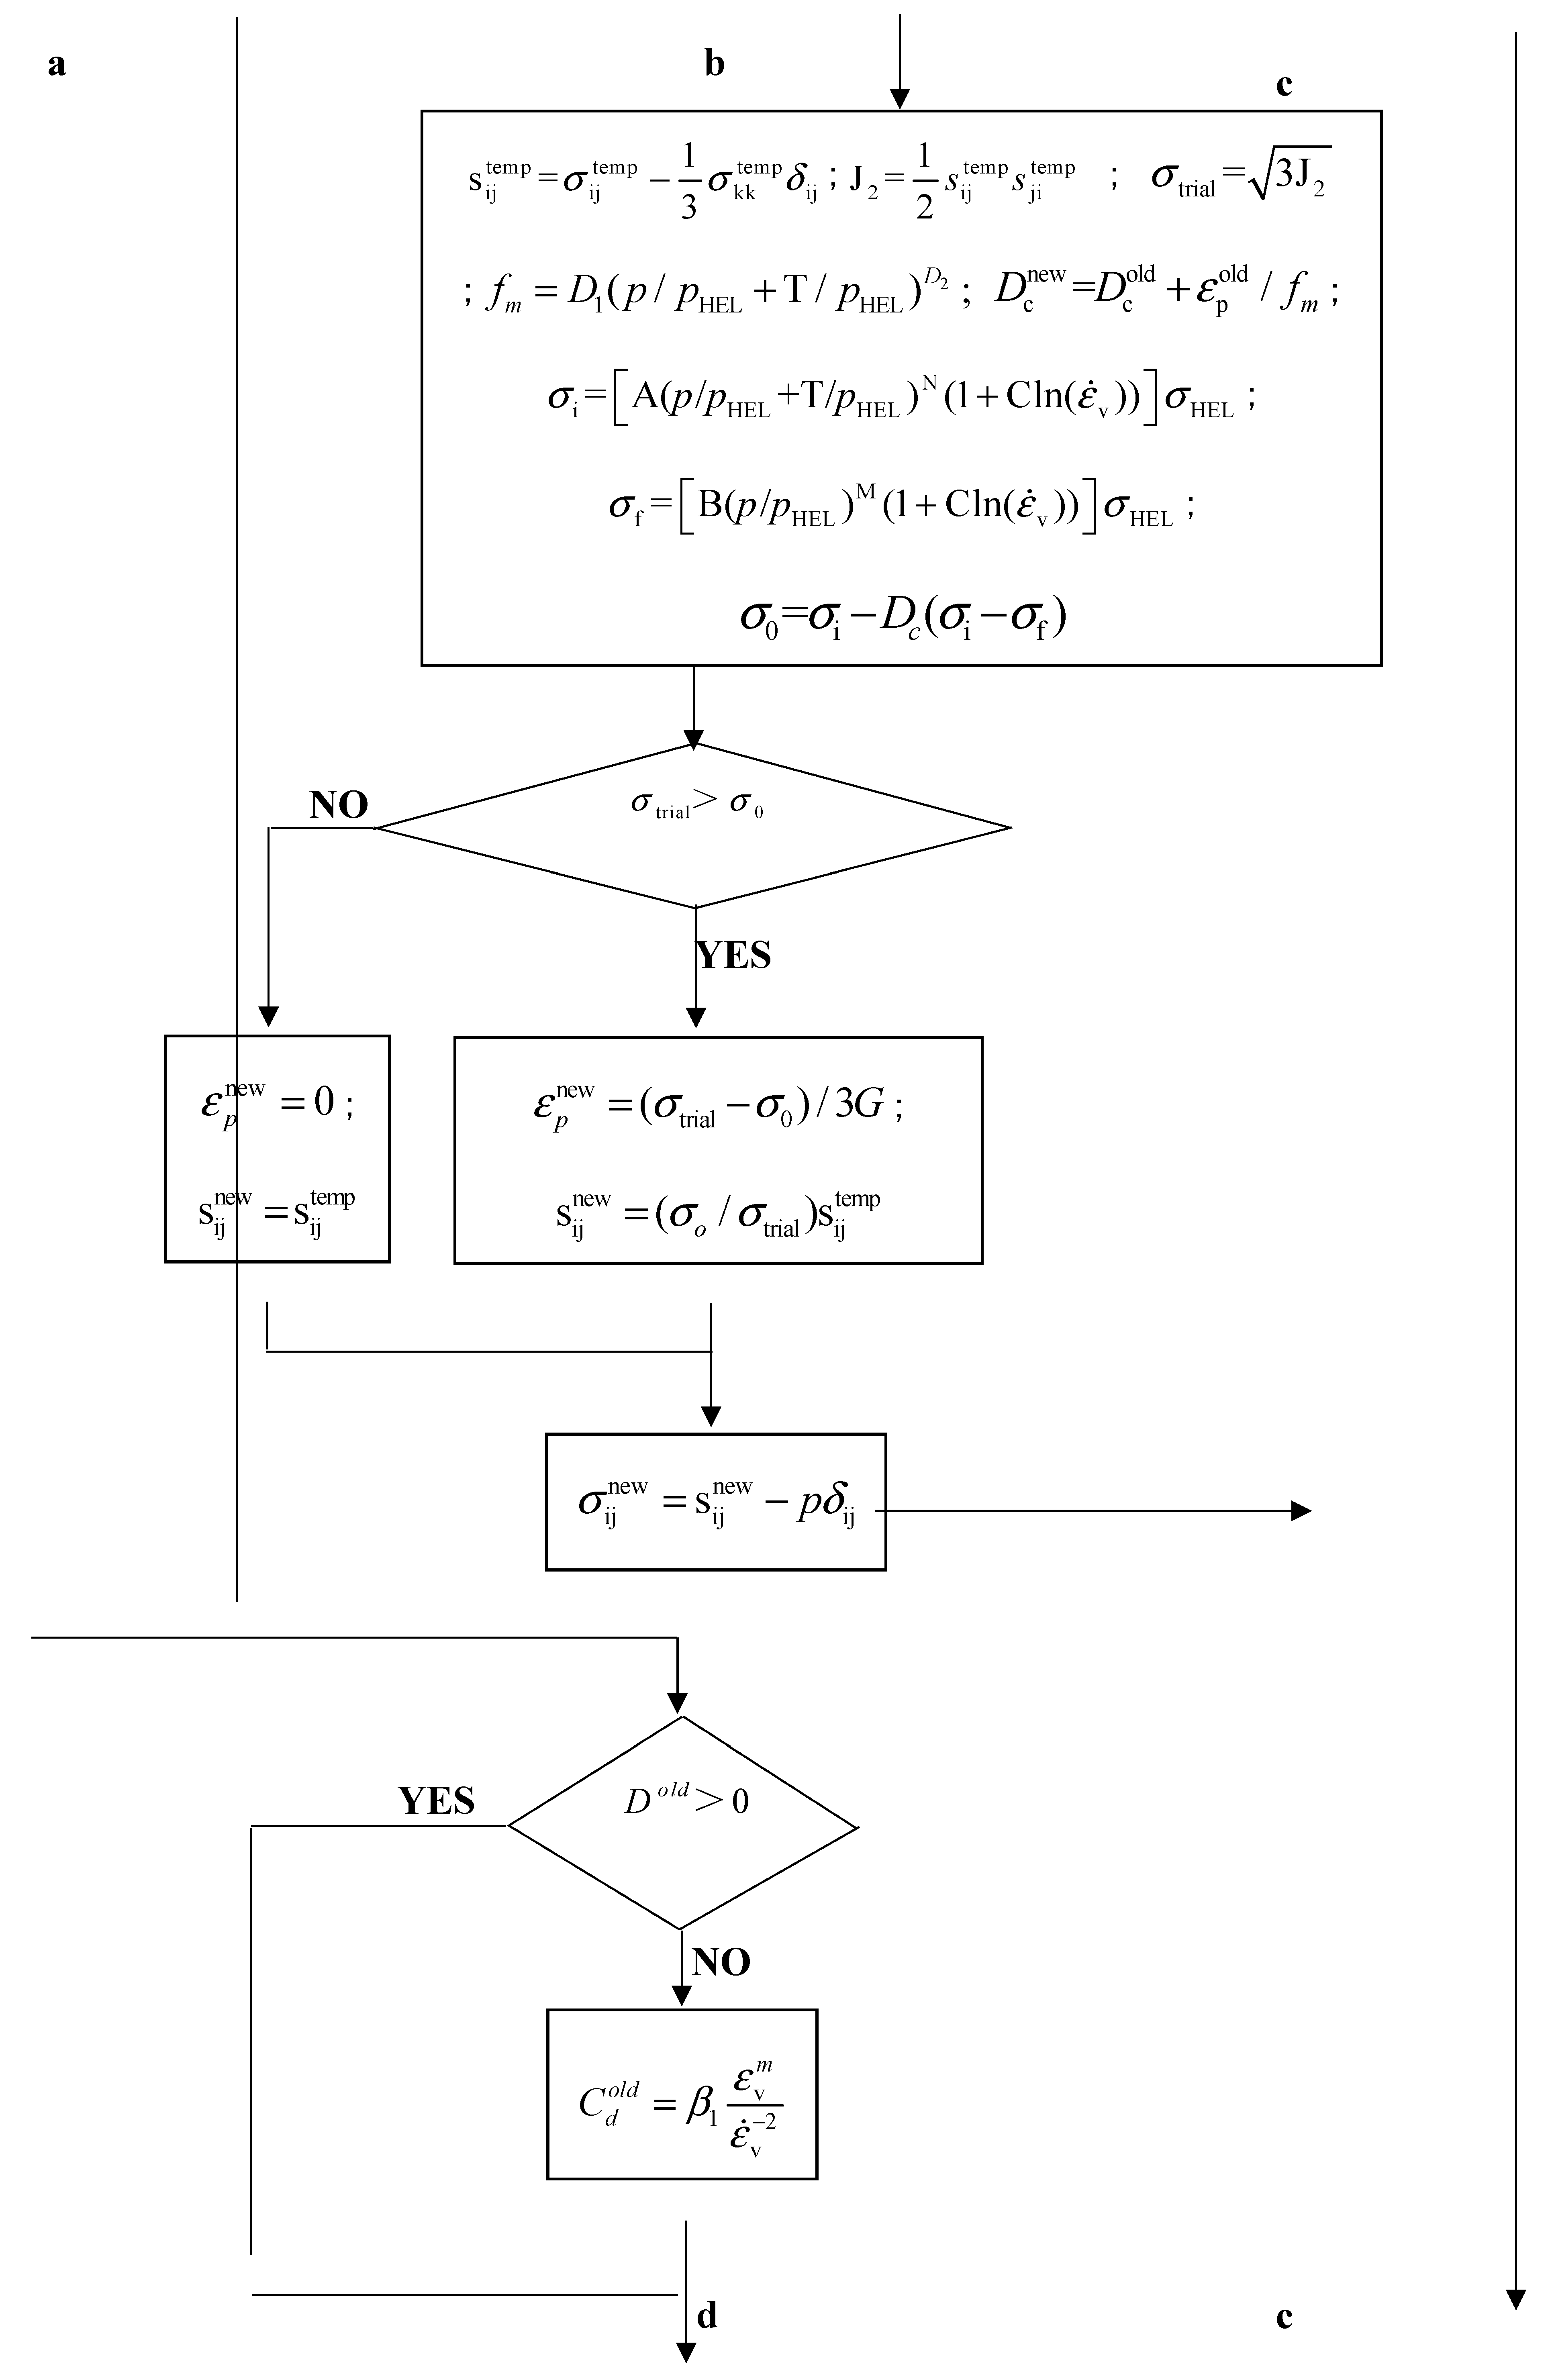
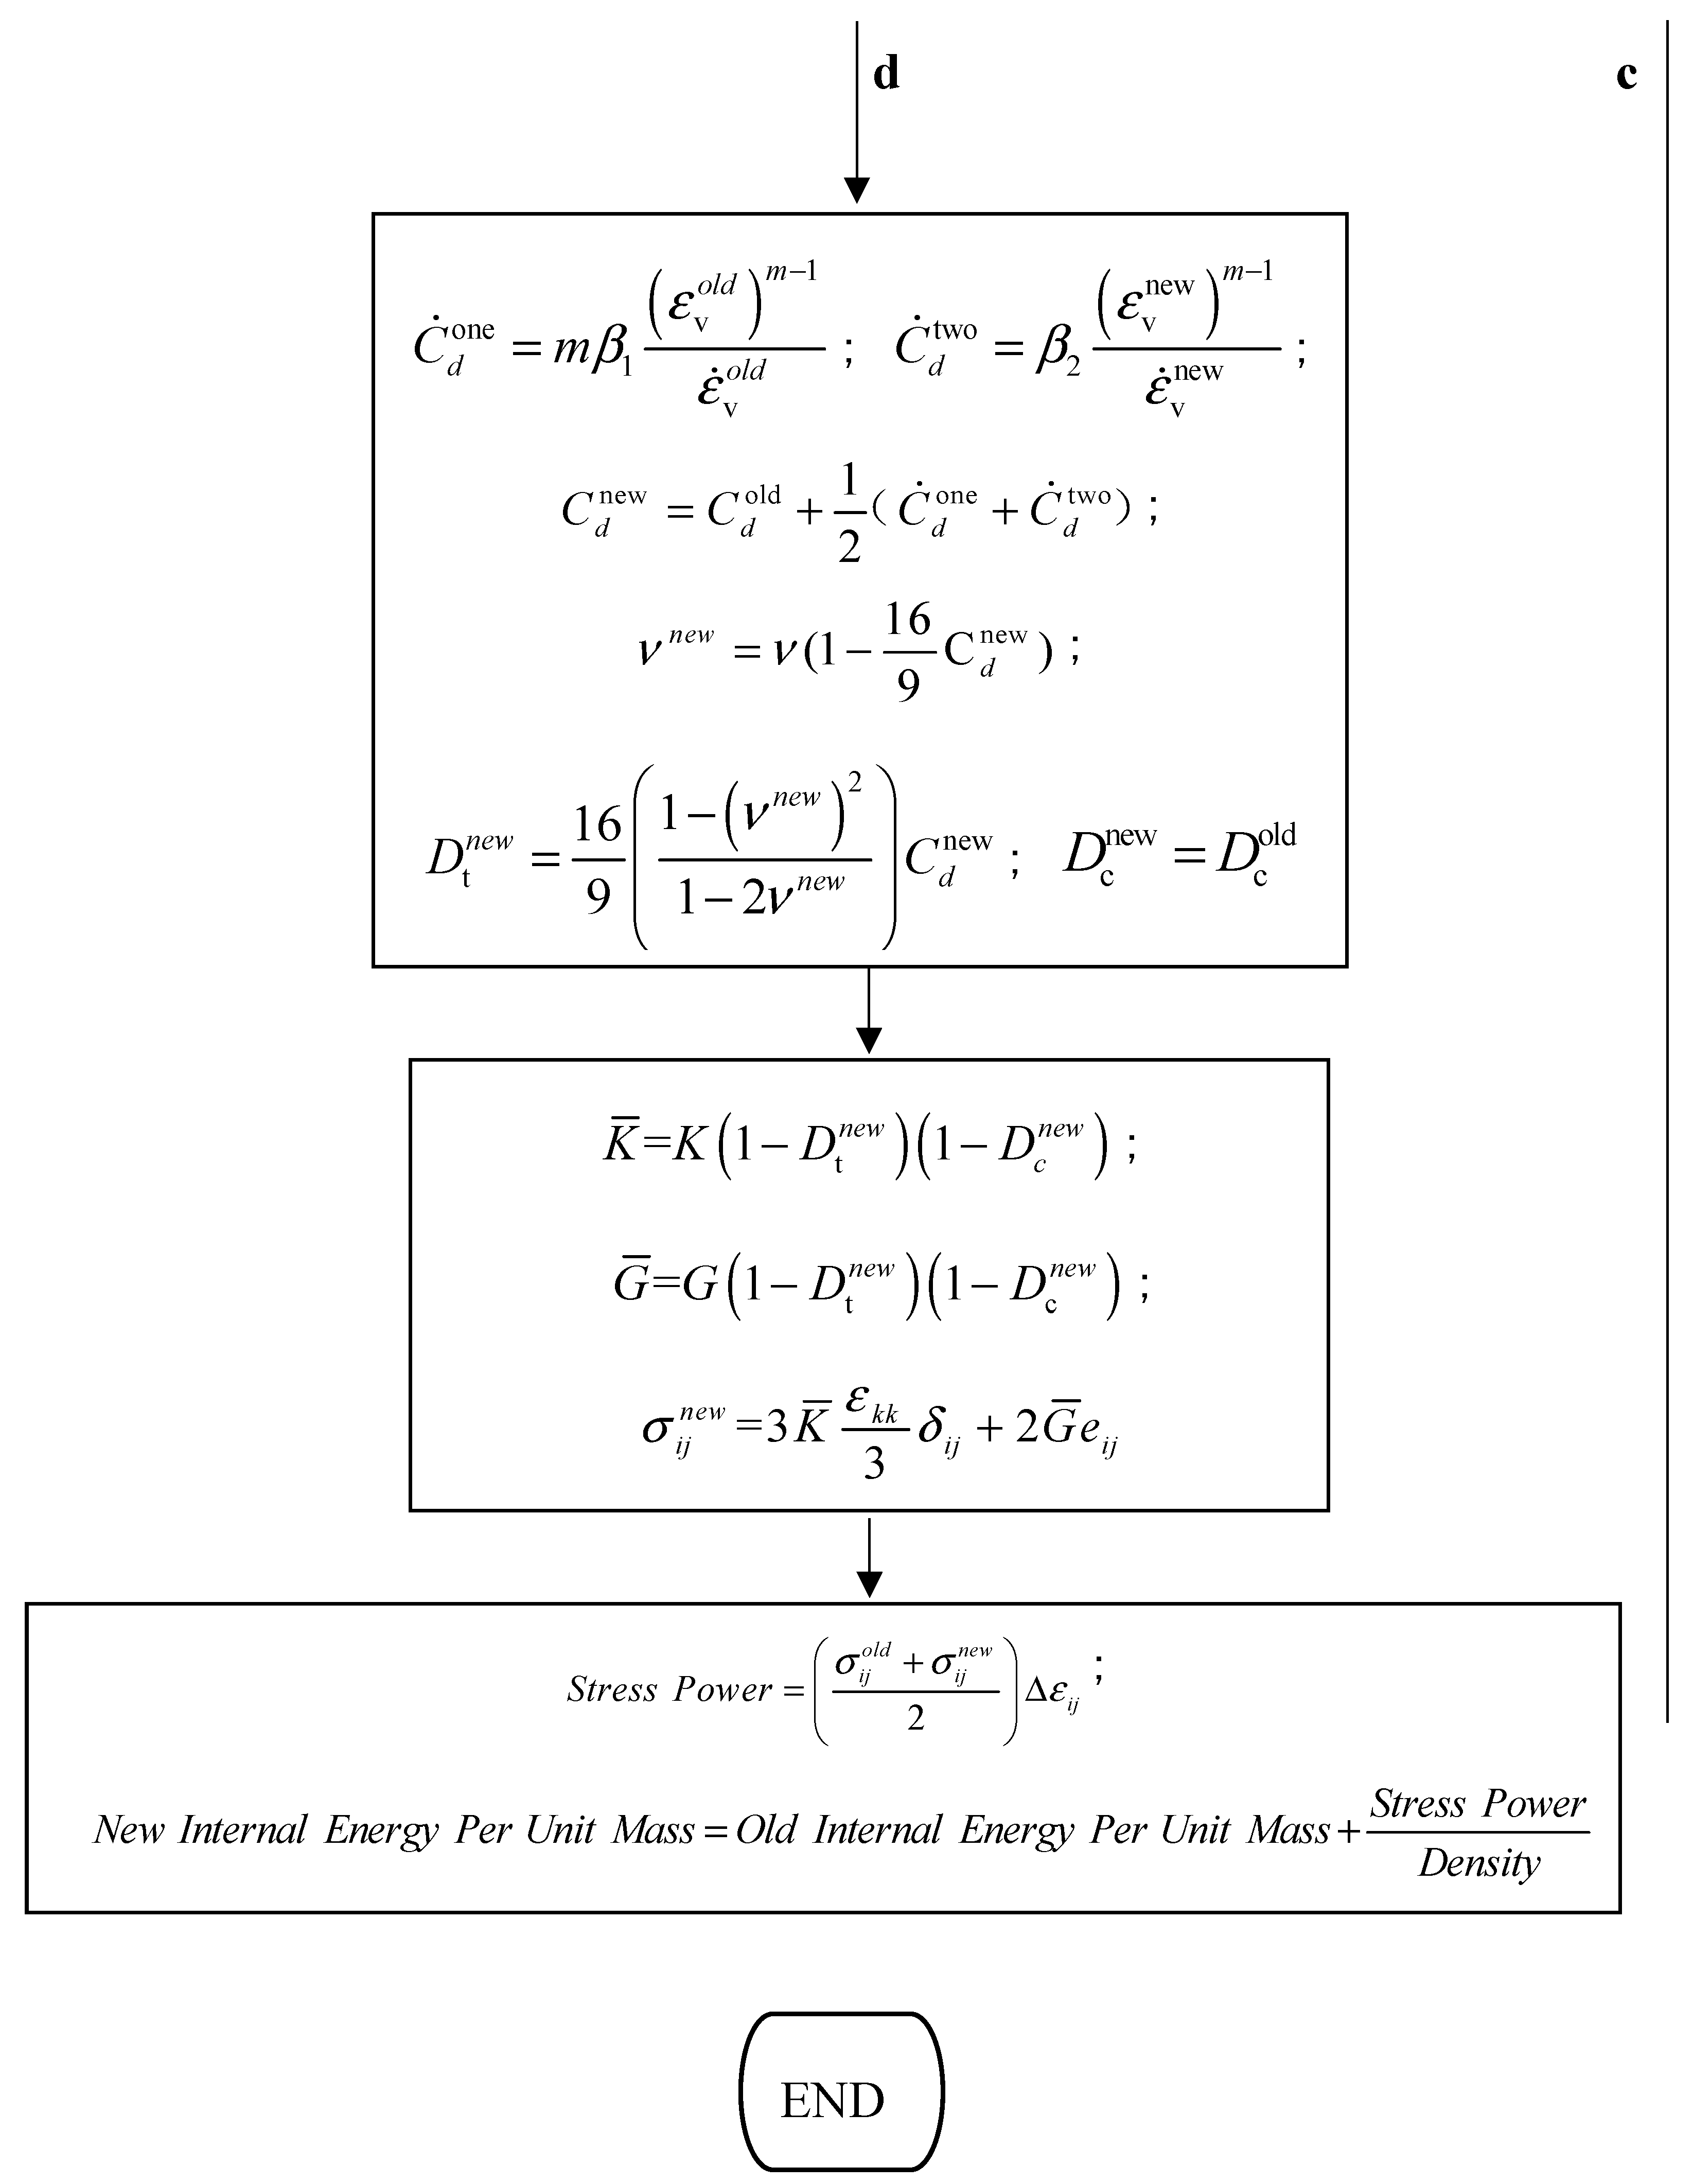
Appendix A
Figure A1.
Flow chart of details of implementation process of the combined TCK-JH2 model.


References
- Joseph, E.; Minor, P.E. Lessons Learned from Failures of the Building Envelope in Windstorms. J. Archit. Eng. 2005, 11, 10–13. [Google Scholar] [CrossRef]
- Anders Behring Breivik: The Indictment. Available online: https://www.theguardian.com/world/2012/apr/16/anders-behring-breivik-indictment (accessed on 26 July 2016).
- Zang, M.; Lei, Z.; ODA, J. Static Characteristic and Impact Fracture Behavior of Automobile Glass. J. Mech. Eng. 2009, 45, 268–272. [Google Scholar] [CrossRef]
- Holmquist, T.J.; Johnson, G.R.; Lopatin, C.M.; Grady, D.E.; Hertel, E.S., Jr. High strain rate properties and constitutive modeling of glass. In Proceedings of the 15th International Symposium on Ballistics, Jerusalem, Israel, 21–24 May 1995; pp. 237–244. [Google Scholar]
- Peroni, M.; Solomos, G.; Pizzinato, V.; Larcher, M. Experimental Investigation of High Strain-Rate Behaviour of Glass. Appl. Mech. Mater. 2011, 82, 63–68. [Google Scholar] [CrossRef]
- Zhang, X.; Zou, Y.; Hao, H.; Li, X.; Ma, G.; Liu, K. Laboratory Test on Dynamic Material Properties of Annealed Float Glass. Int. J. Prot. Struct. 2012, 3, 407–430. [Google Scholar] [CrossRef]
- Larcher, M.; Solomos, G.; Casadei, F.; Gebbeken, N. Experimental and numerical investigations of laminated glass subjected to blast loading. Int. J. Impact Eng. 2012, 39, 42–50. [Google Scholar] [CrossRef]
- Kang, B.; Moon, S.; Lim, J.; Choi, B.H. Observation and simulations of an impact on the automotive windshield using the time-dependent dynamic failure criterion. Proc. Inst. Mech. Eng. Part D J. Automob. Eng. 2014, 229, 866–874. [Google Scholar] [CrossRef]
- Xu, X.Q.; Liu, B.H.; Wang, Y.; Li, Y.B.; Xu, J. A numerical model on PVB laminated windshield subjected to headform low-speed impact. J. Phys. Conf. Ser. 2013, 451, 012016. [Google Scholar] [CrossRef] [Green Version]
- Rajendran, A.M.; Kroupa, J.L. Impact damage model for ceramic materials. J. Appl. Phys. 1989, 66, 3560–3565. [Google Scholar] [CrossRef]
- Taylor, L.M.; Chen, E.P.; Kuszmaul, J.S. Microcrack-induced damage accumulation in brittle rock under dynamic loading. Comput. Methods Appl. Mech. Eng. 1986, 55, 301–320. [Google Scholar] [CrossRef]
- Shahzamanian, M.M. Implementation of a rate dependent tensile failure model for brittle materials in ABAQUS. Int. J. Impact Eng. 2016, 97, 127–147. [Google Scholar] [CrossRef]
- Hidallana-Gamage, H.D.; Thambiratnam, D.P.; Perera, N.J. Failure analysis of laminated glass panels subjected to blast loads. Eng. Fail. Anal. 2014, 36, 14–29. [Google Scholar] [CrossRef]
- Zhang, X.; Hao, H.; Ma, G. Parametric study of laminated glass window response to blast loads. Eng. Struct. 2013, 56, 1707–1717. [Google Scholar] [CrossRef]
- Zhang, X.; Hao, H.; Ma, G. Laboratory test and numerical simulation of laminated glass window vulnerability to debris impact. Int. J. Impact Eng. 2013, 55, 49–62. [Google Scholar] [CrossRef]
- Zhang, X.; Hao, H.; Ma, G. Dynamic material model of annealed soda-lime glass. Int. J. Impact Engl. 2015, 77, 108–119. [Google Scholar] [CrossRef] [Green Version]
- Holmquist, T.J.; Johnson, G.R. Characterization and evaluation of silicon carbide for high-velocity impact. J. Appl. Phys. 2005, 97, 93502. [Google Scholar] [CrossRef]
- Holmquist, T.J.; Johnson, G.R. A Computational Constitutive Model for Glass Subjected to Large Strains, High Strain Rates and High Pressures. J. Appl. Mech. 2011, 78, 051003. [Google Scholar] [CrossRef]
- Holmquist, T.J.; Johnson, G.R.; Gerlach, C.A. An improved computational constitutive model for glass. Philos. Trans. Ser. A Math. Phys. Eng. Sci. 2017, 375, 20160182. [Google Scholar] [CrossRef] [PubMed] [Green Version]
- Alexander, C.S.; Chhabildas, L.C.; Templeton, D.W. The Hugoniot Elastic Limit of soda-lime glass. In Shock Compression of Condensed Matter, AIP Conference Proceedings, Melville, Elert, M., Ed.; AIP Press: New York, NY, USA, 2017; Volume 733, pp. 733–738. [Google Scholar]
- Nyounguè, A.; Bouzid, S.; Dossou, E.; Azari, Z. Fracture characterisation of float glass under static and dynamic loading. J. Asian Ceram. Soc. 2016, 4, 371–380. [Google Scholar] [CrossRef] [Green Version]
Figure 1.
Impact loading testing machine setup.

Figure 2.
Specimen with black and white stickers.

Figure 3.
Finite element model of the drop-weight test: (a) parts of the model, (b) 1/4 mesh model.

Figure 4.
Comparison of velocity-time curves between simulation results and experimental results of specimens: (a) LG-03114, (b) LG-06114, (c) LG-06076, and (d) LG-06038.
Figure 4.
Comparison of velocity-time curves between simulation results and experimental results of specimens: (a) LG-03114, (b) LG-06114, (c) LG-06076, and (d) LG-06038.

Figure 5.
Comparison of force-time curves between simulation results and experimental results of specimens: (a) LG-03114, (b) LG-06114, (c) LG-06076, and (d) LG-06038.
Figure 5.
Comparison of force-time curves between simulation results and experimental results of specimens: (a) LG-03114, (b) LG-06114, (c) LG-06076, and (d) LG-06038.


Figure 6.
Comparison of central-point deflection between simulation results and experimental results of specimens: (a) LG-03114, (b) LG-06114, (c) LG-06076, and (d) LG-06038.
Figure 6.
Comparison of central-point deflection between simulation results and experimental results of specimens: (a) LG-03114, (b) LG-06114, (c) LG-06076, and (d) LG-06038.

Figure 7.
Typical crack pattern of the test and simulation results: (a) experimental result and (b) numerical result.
Figure 7.
Typical crack pattern of the test and simulation results: (a) experimental result and (b) numerical result.

Figure 8.
Sequences of cracking of the numerical result of LG-03114 at: (a) 0 ms, (b) 2 ms, (c) 4 ms, (d) 6 ms, and (e) 8 ms.
Figure 8.
Sequences of cracking of the numerical result of LG-03114 at: (a) 0 ms, (b) 2 ms, (c) 4 ms, (d) 6 ms, and (e) 8 ms.


Table 1.
Static and dynamic strength of glass material.
| Reference | Static Strength (MPa) | Dynamic Strength (MPa) | ||
|---|---|---|---|---|
| Tensile | Compressive | Tensile | Compressive | |
| Holmquist [4] | 150 | 1023 | — | 1150 (250 s−1) |
| Peroni [5] | 54.5 | 1087 | 89.5 | 1179 (1109 s−1) |
| Zhang [6] | 19.27 | 256.13 | 33 (696 s−1) | 600 (241 s−1) |
Table 2.
Constants for combined TCK-JH2 model.
| E (GPa) | ν | k (mm−3) | m | KIC [21] | ||||
|---|---|---|---|---|---|---|---|---|
| 70 | 0.3 | 1015 | 7 | 35.4 | ||||
| ρ (kg/m3) | G (GPa) | A | N | B | M | C | ||
| 2530 | 26.9 | 0.75 | 0.72 | 0.20 | 1.0 | 0.035 | 1.0 | 0.50 |
| HEL (MPa) | PHEL (MPa) | T (MPa) | β | D1 | D2 | K1 (MPa) | K2 (MPa) | K3 (MPa) |
| 1003 | 334 | 27.8 | 1.0 | 0.043 | 0.85 | 43.2 | −67.2 | 153.2 |
Table 3.
Details of the specimens.
| Specimen | Width (mm) | Thickness (mm) | Glass Layer Thickness (mm) | PVB Interlayer Thickness (mm) | Impact Velocity (m/s) |
|---|---|---|---|---|---|
| LG-03114 | 200 | 7.14 | 3 | 1.14 | 1.083 |
| LG-06114 | 13.14 | 6 | 1.14 | 1.050 | |
| LG-06076 | 12.76 | 6 | 0.76 | 0.960 | |
| LG-06038 | 12.38 | 6 | 0.38 | 0.896 |
Table 4.
Polyvinyl Butyral (PVB) material properties.
| ρ (kg/m3) | ν | Eyield (MPa) |
|---|---|---|
| 1100 | 0.495 | 11 |
© 2019 by the authors. Licensee MDPI, Basel, Switzerland. This article is an open access article distributed under the terms and conditions of the Creative Commons Attribution (CC BY) license (http://creativecommons.org/licenses/by/4.0/).
Share and Cite
MDPI and ACS Style
Wei, D.; Li, D.; Zhang, Z. Simulation Study of Low-Velocity Impact on Polyvinyl Butyral Laminated Glass Based on the Combined TCK-JH2 Model. Appl. Sci. 2019, 9, 3204. https://0-doi-org.brum.beds.ac.uk/10.3390/app9153204
AMA Style
Wei D, Li D, Zhang Z. Simulation Study of Low-Velocity Impact on Polyvinyl Butyral Laminated Glass Based on the Combined TCK-JH2 Model. Applied Sciences. 2019; 9(15):3204. https://0-doi-org.brum.beds.ac.uk/10.3390/app9153204
Chicago/Turabian StyleWei, Demin, Dong Li, and Zongheng Zhang. 2019. "Simulation Study of Low-Velocity Impact on Polyvinyl Butyral Laminated Glass Based on the Combined TCK-JH2 Model" Applied Sciences 9, no. 15: 3204. https://0-doi-org.brum.beds.ac.uk/10.3390/app9153204
Note that from the first issue of 2016, this journal uses article numbers instead of page numbers. See further details here.