Dependency Analysis based Approach for Virtual Machine Placement in Software-Defined Data Center


1
School of Electrical Engineering and Computer Science, Gwangju Institute of Science and Technology (GIST), Gwangju 61005, Korea
2
LG Electronics, Seoul 07329, Korea
*
Author to whom correspondence should be addressed.
Appl. Sci. 2019, 9(16), 3223; https://0-doi-org.brum.beds.ac.uk/10.3390/app9163223
Submission received: 12 July 2019
/
Revised: 4 August 2019
/
Accepted: 5 August 2019
/
Published: 7 August 2019
(This article belongs to the Special Issue Computational Intelligence, Soft Computing and Communication Networks for Applied Science)
Abstract
:In data centers, cloud-based services are usually deployed among multiple virtual machines (VMs), and these VMs have data traffic dependencies on each other. However, traffic dependency between VMs has not been fully considered when the services running in the data center are expanded by creating additional VMs. If highly dependent VMs are placed in different physical machines (PMs), the data traffic increases in the underlying physical network of the data center. To reduce the amount of data traffic in the underlying network and improve the service performance, we propose a traffic-dependency-based strategy for VM placement in software-defined data center (SDDC). The traffic dependencies between the VMs are analyzed by principal component analysis, and highly dependent VMs are grouped by gravity-based clustering. Each group of highly dependent VMs is placed within an appropriate PM based on the Hungarian matching method. This strategy of dependency-based VM placement facilitates reducing data traffic volume of the data center, since the highly dependent VMs are placed within the same PM. The results of the performance evaluation in SDDC testbed indicate that the proposed VM placement method efficiently reduces the amount of data traffic in the underlying network and improves the data center performance.
1. Introduction
The traffic volume in data centers has surged exponentially with the increasing demand for cloud-based services. A data center traffic forecast by Cisco reported that the annual global data center Internet protocol (IP) traffic will reach 20.6 zettabytes (ZB) (1.7 ZB per month) by the end of 2021, up from 6.8 ZB per year (568 exabytes per month) in 2016 [1]. This rapid increase in the network traffic volume in data centers can degrade the service performance and increase the infrastructure cost for service providers. In a data center, cloud-based services are usually deployed among virtual machines (VMs) to provide high-performance scalable services at a reasonable operational cost [2]. Because the traffic volume among the VMs significantly affect the quality of service (QoS) performance, traffic-aware VM placement is an important issue for data center operation and management. There has been a significant amount of work on the VM placement for reducing data traffic, avoiding congestion, and load balancing [3].
Consider a scenario in which it is required to expand a service because the number of customers increases or some additional functionalities are needed to the service. Initially, it is possible that all VMs involved in a service can be placed in a single PM. However, when expanding a service, additional VMs are created on other PMs if the amount of available resources on the PM that was used previously is not sufficient for the additional VMs. The VMs running a specific service are highly dependent on each other while other VMs are less dependent on each other with less communication. Further, even among the VMs belonging to the same service, the traffic dependency between each pair of VMs significantly varies. If highly dependent VMs are distributed in different PMs, it can increase the data traffic volume in the data center network, which negatively impacts the service performance. Therefore, it is essential to consider the traffic dependency among VMs for VM placement in a data center. However, the traffic dependency among VMs has been rarely considered for VM placement in the literature.
The service providers aim to make their services highly scalable in order to respond to customers’ needs as quickly as possible while minimizing the operational cost. However, scaling conventional data centers entails an enormous operational cost. Thus, the data centers are being re-architected with software-defined technologies. Software-defined technology enables the flexible orchestration of workloads as well as dynamic configuration management of the infrastructure. This kind of software centric data center is referred to as a software-defined data center (SDDC) [4,5]. Compared to legacy data centers, SDDC enables dynamic and flexible management and configuration of the data center resources such as computing, networking, and storage. In SDDC, all hardware resources are virtualized into a pool of virtual resources. These pooled resources are dynamically allocated, maintained, and deleted depending on required functionality and size by the software that manages the entire data center. Thus, SDDC is simple to manage, fast to deploy, and financially competitive compared to the legacy data center [6]. Owing to the software-defined properties of SDDC, all the functionalities of a data center can be automated. For instance, Facebook announced that each administrator of its data center is able to manage at least 20,000 servers through the use of automation [7].
In this paper, we propose a dependency-based strategy for VM placement in order to achieve high scalability in SDDC by reducing the traffic volume in the data center network. In the proposed strategy, the appropriate locations for VMs are identified based on the traffic dependency among VMs by using principal component analysis (PCA) and gravity-based clustering. PCA is a dimension reduction algorithm that projects high dimensional data into a new space of smaller dimension by eliminating the redundancy in high dimensional data [8]. Gravity-based clustering is a gravitational search based data clustering algorithm, which finds cluster centers iteratively in order to arrive at the optimal clustering solution [9]. Using the visibility functionalities available in SDDC, the necessary information for the proposed strategy, such as the east–west traffic statistics and the resource utilization of the VMs, can be readily obtained from the data center. Further, SDDC allows VMs to be dynamically moved between different physical servers using the VM migration functionalities. The key contributions of this work are summarized as follows:
- We propose an approach of analyzing the traffic dependency among the VMs using the PCA for an efficient VM placement strategy in a large scale SDDC hosting a number of VMs.
- We propose a new VM placement method using a gravity-based clustering and Hungarian matching methods for reducing the volume of network traffic in the SDDC.
- We build an SDDC testbed using open source solutions and verify the efficiency of the proposed VM placement method in real environment.
The remainder of this paper is organized as follows. Section 2 presents background and related studies on SDDCs and VM placement. Section 3 describes the system description and problem statement. Section 4 explains our proposed VM placement strategy. Section 5, Section 6 and Section 7 provide detailed explanations of the performance evaluation. Lastly, the study is concluded in Section 8.
2. Background and Related Work
In this section, we provide the overview of background and related work in terms of SDDC and VM placement in data center.
2.1. Software-Defined Data Center
SDDC is a new paradigm of data center that enables dynamic and flexible management and configuration of the data center resources such as computing, networking, and storage [10]. With SDDCs, customers can use newly created infrastructure that they have requested for the development and operation of services within a few minutes [11]. In addition, it enables full control over all kinds of the underlying resources regardless of their vendor dependencies. Thus, SDDCs capitalize on the agility, elasticity and scalabilty of cloud computing. The chief advantage is the automation of all functions through an intelligent software agent, especially manually intensive tasks related to provisioning and operational management. Generally, SDDC is based on an integration of various software-defined technologies including the followings:
- Software-Defined Networking (SDN) is a new paradigm of networking, in which a control plane is separated from the data plane on individual network devices. The network control functionalities of each network device are directly managed by a centralized SDN controller. OpenFlow is a communication protocol used by the SDN controller to communicate with the forwarding elements over the network [12]. Such technology enables solving key challenges in data centers through the abstraction of lower level functionality that removes the complexities of the underlying hardware by separating the data and control planes. Owing to its dynamic and automated network management, a network function provisioning through the programmable interfaces is much easier and faster compared to the traditional network management [13]. Since the current SDN technology assists as an essential functionality in various cloud data centers, it is expected to become a core of future network services [14].
- Software-Defined Computing (SDC) is the first step toward developing the SDDC. It is based on the use of server virtualization to efficiently exploit the system resources and make critical decisions quickly [11]. SDC enables to build computational functions among multiple hardware devices rather than be assigned to a specific hardware device. Moreover, depending on the availability of resources, the compute functions can be moved around to different pieces of virtual infrastructure. This approach enables various benefits such as hardware cost savings, operational visibility and control of the entire system, and increased agility of service management [15]. Additionally, SDC is not only the virtualization of the underlying hardware resources, it also includes APIs that used to automate the entire infrastructure for supporting flexibility in the data centers [16].
- Software-Defined Storage (SDS) is used to manage large amounts of data in the storage system by isolating the data-control layer (the software component that manages and controls the storage resources) from the data-storage layer (the underlying infrastructure of the storage assets). Such isolation enables reducing the management complexity and operation cost of the infrastructure [17]. The controller (software layer) applies various policies on different types of storage elements according to data flows. With its central control unit, it is possible to manage different storage elements in the system regardless of their vendors rather than installing the control software on each element [18]. Additionally, such technology enables designing the data storage systems in order to ensure QoS requirements of the applications [19].
- Software-Defined Security (SDSec) achieves network security enforcement by separating the security control plane from the security processing (data) plane [20]. The control plane is in charge of security decisions, and the security logic of the controller is deployed in the data plane through programmable security mechanisms [21]. Additionally, SDSec is usually implemented with network function virtualization (NFV) such as NFV-based firewall and intrusion detection systems deployed in the network. Such technologies are designed to consolidate and deliver the security components needed to support a fully virtualized infrastructure [22,23].
Software-defined technologies have been used for efficient data center management in several studies. For instance, Gupta et al. [11] introduced an SDDC architecture for QoS-aware service orchestration and developed an integrated system of software-defined technologies for fog computing. SK Telecom is working on implementing an SDDC with the aim of building a telco-centric data center [6]. Khosravi and Khayyambashi [24] implemented a system that provides a load-aware virtual networking service in SDDC. In [25], Xie et al. introduced a strategy of power saving for large-scale SDDC networks. They formulated a mathematical model of a power saving problem based on energy consumption characteristics with the constraint of satisfying energy optimization effectiveness. Zhang et al. [26] considered traffic engineering strategy for SDDC WANs. With the SDN functionality, they proposed a strategy of reducing data plane failure by rerouting the victim flows from failed tunnels to other healthy tunnels. In [27], Li et al. used an SDN controller to enable the central control of the data center network, and they proposed a joint optimization model to achieve high bandwidth utilization for provider and low delay for users. Gupta et al. [11] proposed software-defined computing based system that abstracts connected entities as services and allows applications to orchestrate with end-to-end QoS requirements. In [28], software-defined data service (SDDS) was introduced. SDDS is a network-aware data service approach that extends and leverages SDN technologies in a data center. It aims to minimize the network bandwidth overhead by reducing the data movements based on the network traffic statistics received from the SDN controller. By leveraging the global awareness of the network topology and network flow statistics, SDDS scales and distributes the data services in a network-aware manner. While SDDS focuses on the efficient execution of data-centric services using SDN functionalities, SDDC attempts to mitigate a scalability problem of virtualization and softwarization in an entire data center.
Software-Defined technologies enable more convenient resource management of the data center, since monitoring and automation of the entire infrastructure can be abstracted from hardware and implemented in software. In this regard, functionalities of the SDDC are efficiently used in existing works for various purposes such as improving service performance, saving energy, and reducing operational cost of the data center.
2.2. Virtual Machine Placement
VM placement is a critical operation to find the best PMs to host VMs. The VM placement problem is generally formulated as an optimization problem under various constraints [29]. Existing works on VM placement can be broadly categorized into two types such as QoS-based and power-based approaches [30]. Most of the QoS-based approaches investigated network traffic-engineering for improving data center performance such as maximizing network throughput, reducing the data rate, and load-balancing. Power-based approaches focused on reducing the energy consumption of the data center by minimizing the number of concurrently running PMs.
Several studies on network-aware VM placement in data center have been conducted. Wang et al. [31] presented a joint optimization problem of VM placement and route scheduling. They used a traffic-engineering technique to minimize the transmission delay and maximize the network throughput. Meng et al. [32] proposed a traffic-aware technique for VM placement. They formulated the VM placement as a joint optimization problem of network and server resources using the traffic matrix among VMs and the cost matrix among host machines. They used a two-tier approximation algorithm to solve the optimization problem on the scale of real data centers. Chen et al. [33] studied VM placement problem in data center by modeling the problem as joint affinity aware grouping and a bin-packing method. They grouped the VMs based on the affinity between the VMs, and used a bin-packing heuristic algorithm for resource scheduling. In [34], the authors investigated the network influence on typical applications in data centers and proposed a self-adaptive network-aware virtual machine clustering and consolidation algorithm to maintain an optimal system-wide status. Moreover, recently a lot of attention has been put to the efficient placement of VMs in the context of network function virtualization (NFV). In [35], Ma et al. studied how to efficiently deploy NFV middleboxes to minimize maximum link load ratio in SDN environment. They formulated traffic aware middlebox placement (TAMP) problem as a graph optimization problem, and then proposed a least-first-greatest-last (LFGL) strategy for solving the problem. Chi et al. [36] designed a heuristic NFV deployment algorithm for improving data center performance. The algorithm finds the number of necessary virtual network functions (VNFs), placement location of the VNFs, and traffic dispatching strategy to the VNFs for reducing amount of east–west traffic in the data center.
In [37], Yan et al. proposed workload optimization approach for VM placement in the data center. They formulated an optimization model based on resource utilization with the aim of minimizing power consumption. In [27], Li et al. addressed VNF placement problem in data center. They formulated the VNF placement problem as integer linear programming (ILP) model with the aim of minimizing the number of running PMs. The proposed strategy considers both time-varying workloads and basic resource consumptions when optimizing the resource utilization of the data center. In [38], Pham et al. introduced energy-efficient VNF placement strategy with the aim of minimizing data center cost. They formulated the network traffic cost function as an optimization problem and solved it by Markov approximation technique. Fatima et al. [39] presented a bin packing based VM placement method in cloud data centers in order to minimize the number of running PMs. They used particle swarm optimization (PSO) with variable sized bin packing (PSOLBP) algorithm for solving the optimization problem. In [40], Duong-Ba et al. studied a problem of VM placement and migration to minimize resource usage and power consumption in a data center. They formulated the optimization problem of the VM placement as a joint multiple objective function and solved it by leveraging convex optimization.
In general, most of the existing works attempted to solve the VM placement problem by turning it into a traditional bin packing problem, which is known to be NP-hard and can be solved by heuristic algorithms [34]. Since current data centers usually run thousands of VMs having a large amount of traffic volume, the analysis of traffic information for large scale data centers requires high computational cost and time. Most existing works directly analyzed the traffic information data without reducing its redundancy, and thus their complexity increases exponentially as the number of VMs increases. For solving this issue, the proposed method leverages the PCA and gravity-based clustering algorithms to reduce the complexity of high dimensional data analysis. Therefore, the proposed approach considerably reduces the time complexity for solving the VM placement problem. It reduces the amount of traffic volume and the number of running PMs at the same time. In addition, software-defined technologies are used for obtaining both the computing and networking information in real-time and controlling the VM allocation in the data center.
3. Problem Definition
3.1. System Description
We consider an SDDC architecture that is composed of SDN and SDC. Figure 1 shows an example of the SDDC, which consists of OpenFlow-enabled switches [41] and PMs. The network topology is based on a leaf-spine architecture, which is broadly used for layer 2+ switching in recent data centers [42]. All networking-related functionalities are monitored by an SDN controller, and all computing-related functionalities are monitored by an SDC controller. Since all of the data center resources are controlled by software-defined technologies, the infrastructure can be dynamically configured, and the necessary data for the proposed strategy can be easily obtained. Moreover, SDC enables VMs to be moved between different PMs with the support of a VM migration technique [43].
The VMs on each PM are used for building different functionalities of cloud-based services such as processing business logic, data management, and user interface. Currently, most of the services are based on a microservice architecture, in which the different functionalities of a service are executed separately [44]. With this microservice architecture, a single software application/functionality is implemented as a combination of multiple microservices and their interactions. Hence, the communications between the functionalities and their coordination are vital for a successful realization of service deployment [45].
Generally, a service in a data center is hosted on multiple VMs, the VMs have communication dependencies on each other. In Figure 1, there is one service running on PM with nine VMs. Note that PM hosts nine VMs, and the other PMs do not host any VMs. VMs of the same color are highly dependent on each other. This implies that the data traffic between those VMs is significantly higher than that between different VMs of different colors.
3.2. Problem Statement
Initially, a single PM could be sufficient to host all of the VMs needed for a service. However, it will be necessary to expand the service as the number of customers continuously increases or additional functionalities are needed to provide more efficient service. In these cases, more computing resources will be required so additional VMs must be created. If the amount of resources available on the currently used PM is not sufficient, additional VMs will be created on other PMs.
For example, as illustrated in Figure 1, a service was hosted on nine VMs that were placed on one PM when the service was released, but the service is later expanded by creating additional VMs on other PMs. Figure 2a shows that both highly dependent and less dependent VMs exist in each PM. Even among the VMs that belong to the same service, the traffic volume and the dependency between the pairs of VMs can be different: some VMs are highly dependent on each other (and have high levels of data traffic between them) while other VMs have less communication dependency on each other (and have less data traffic between them).
In conventional strategies, the communication dependency between VMs is not considered when a service is expanded by creating additional VMs. Thus, highly dependent VMs may be placed in different PMs, which will significantly increase the data traffic between PMs. This will negatively impact the service performance because the data traffic between the service and the customer flows through the same physical network. Moreover, traffic growth in physical network increases operating cost of the data center. As shown in Figure 2, data traffic between VMs in different PMs flows through both the virtual and physical networks of the data center. At the same time, data traffic between VMs in a same PM flows through only the virtual network. In this regard, it is desirable to minimize the traffic volume in physical network to improve the service performance.
To improve the service performance, it is desirable to minimize the traffic volume in physical network of the data center. To this end, we propose an efficient VM-placement strategy to determine the appropriate placement location for each VM by considering traffic dependency. The VM placement by the proposed strategy is illustrated in Figure 2b.
3.3. System Model
We consider an SDDC in which there are multiple VMs on each PM, and they are connected to each other by an internal virtual network that is, in turn, connected to the physical network, as shown in Figure 2. Suppose that there are n VMs placed on m PMs in the data center. Let the set of VMs be represented by and let , , and be the resources (CPU, memory, and storage, respectively) required for running a VM v. In addition, let the set of PMs be represented by , and let , , and be the resources (CPU, memory, and storage, respectively) available on PM p.
Let be an n-by-m binary matrix where each element, , is equal to 1 when is placed on and 0 otherwise.
Since the data center is an SDDC, the status of the flow information between the VMs is available via the SDN controller. Based on this information, a traffic information matrix can be created for the VMs. Let denote the n-by-n traffic information matrix with elements, , representing the data rate between and .
The total data rate in the physical network can be computed as follows:
where is equal to 1 when the and are placed on different PMs, else it is 0. Thus, in Equation (1) is the total sum of data rates between VMs that are placed on different PMs. The optimization problem for VM placement can be formulated as follows:
The constraints for the VM placement is that the sum of the necessary resources for the VMs in each PM is less than or equal to resources available on that PM. To solve this problem, a scalable VM-placement strategy based on the network traffic between the VMs is proposed. The processes of the proposed approach are described in detail in the following section.
4. Proposed VM Placement Strategy
4.1. Dependency Analysis
To reduce the amount of data traffic in the physical network, it is necessary to place highly dependent VMs in the same PM. The traffic dependency among the VMs is analyzed using the traffic information matrix . This information enables the subsequent clustering of highly dependent VMs.
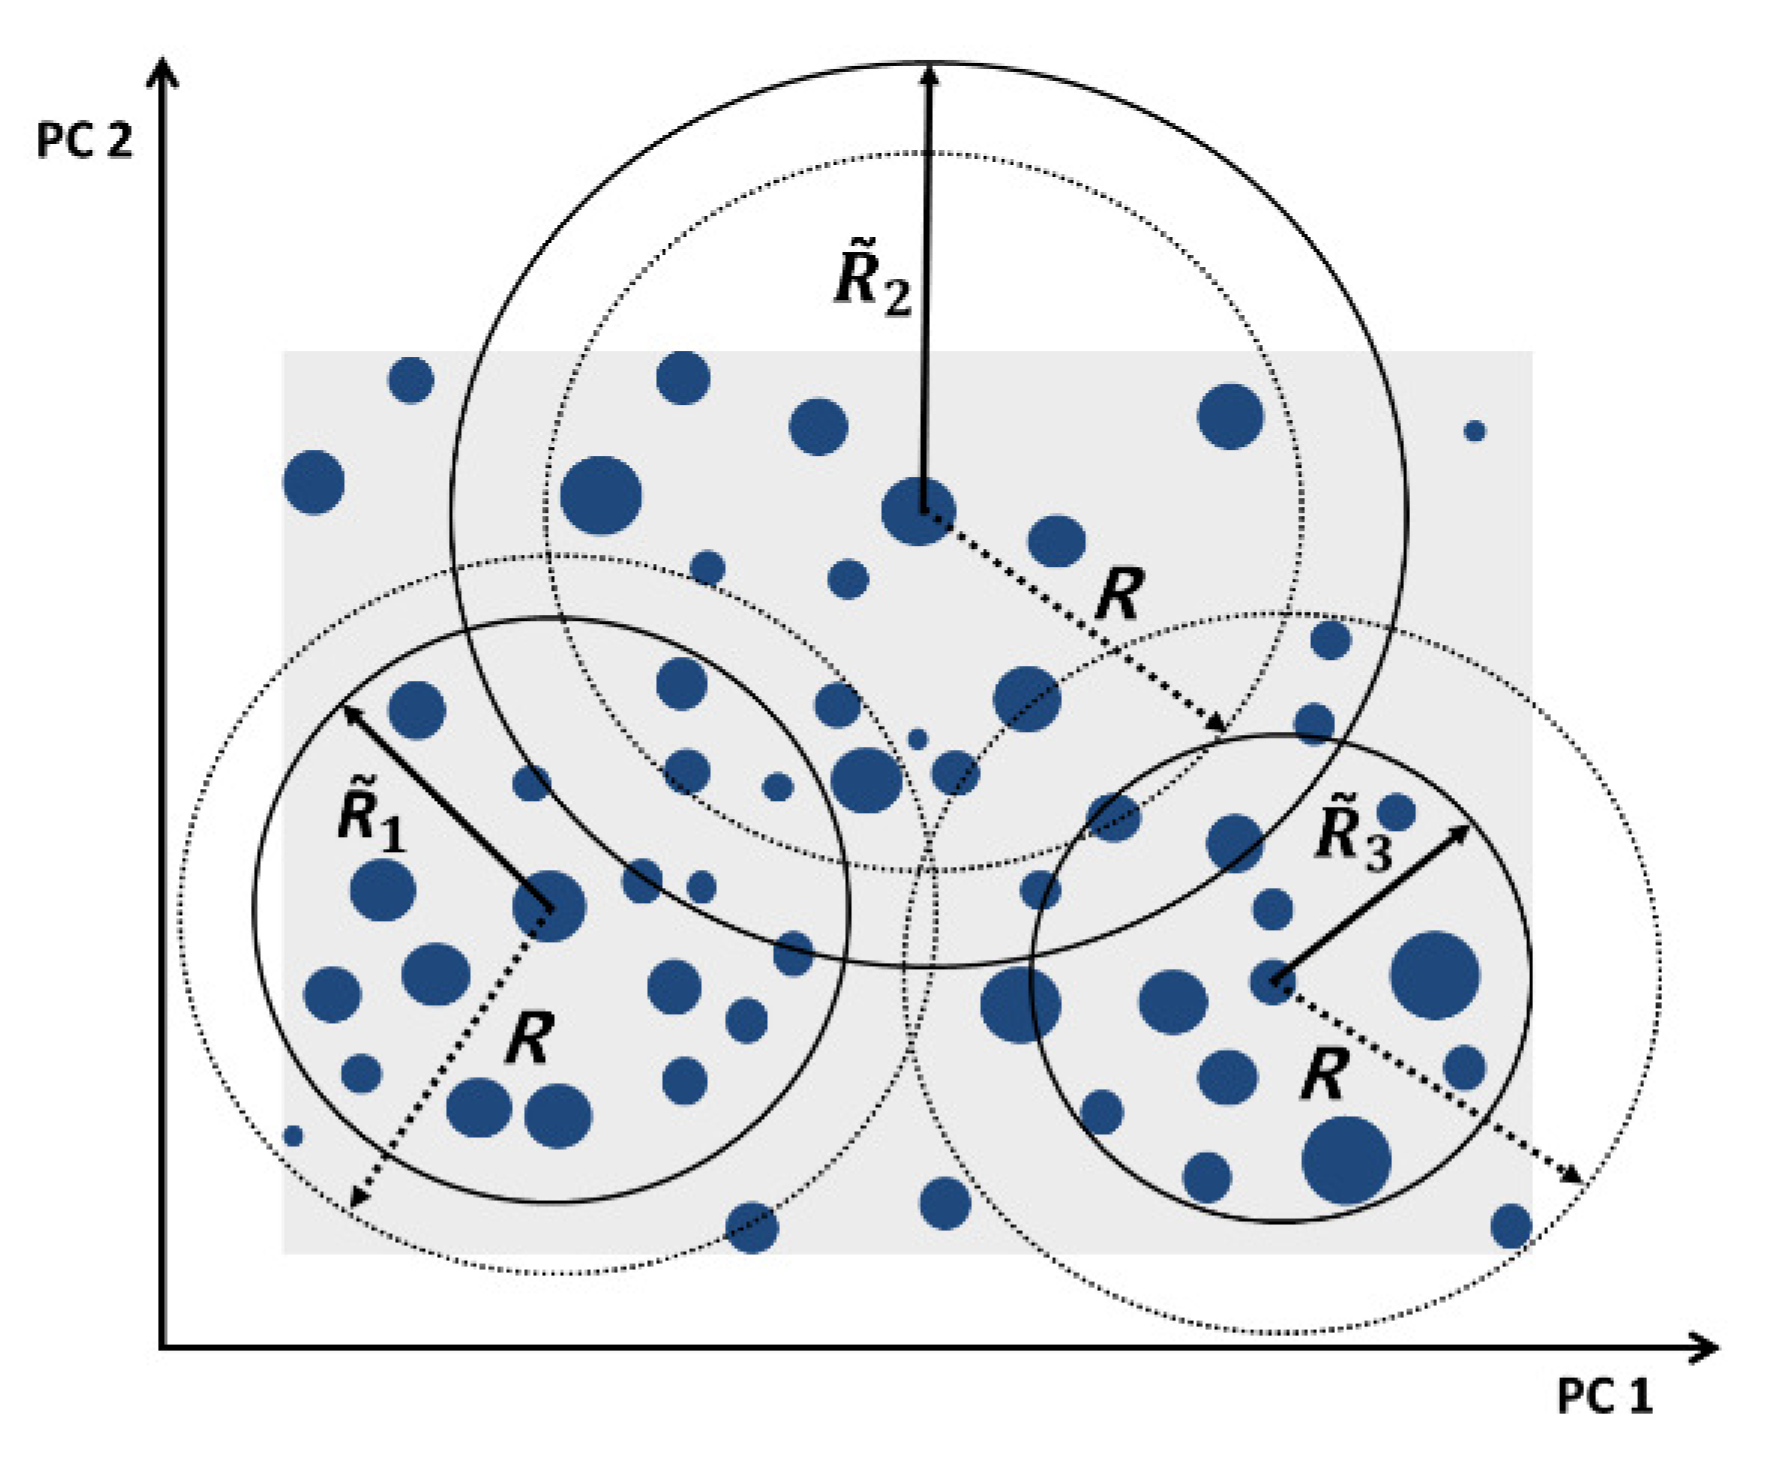
Usually, data centers run thousands of VMs so the dimension of could be extremely large, making it difficult to analyze the traffic dependency of the VMs using . In this study, PCA is used to reduce the number of dimensions and extract the features. In PCA, eigenvectors (called the principal components in PCA) are identified for the original values that are correlated with each other [46]. Then, the eigenvectors are used to create new data with a lower dimension. Correlation indicates that there is redundancy in the data. Due to this redundancy, PCA can be used to reduce the original variables into a smaller number of new variables. Thus, by PCA, is converted to a matrix with fewer dimensions (n by k), which is denoted as and referred to as the VM dependency matrix. An example of the PCA-based dimensional reduction from to is illustrated on Figure 3: the n-dimensional data are converted to two-dimensional data and depicted on a XY coordinate plane. Each point represents a VM, the size of each point is proportional to the VM resource requirement, and the distance between each pair of points represents the traffic dependency of those VMs.
4.2. Grouping VMs
After analyzing the dependency of the VMs, the next step is clustering the VMs according to their traffic dependencies. As a result of the PCA analysis, the VMs are illustrated in a low-dimensional space in which VMs that are placed closely are considered highly dependent on each other. We propose using a gravity-based clustering method [9] so that highly dependent VMs are clustered in the same group. The gravity-based clustering can make a specific number of VM clusters with different sizes. Therefore, it is useful to adjust the VM cluster size according to the resource constraints.
As mentioned in Section 3.3, there are m PMs; therefore, the VMs are first clustered into m groups. To group the VMs, the total area of the field that covers all nodes in the reduced-dimensional space is calculated, as illustrated by the shadowed region in Figure 3. Let S be the area of the region that covers all nodes in the reduced-dimensional space. Then, the region is divided into m subsections. Initially, each subsection is a circle with an area of S divided by m; the radius, R, of each circle can thus be calculated as follows:
Once the group radius R is calculated using Equation (3), m center nodes are iteratively selected. For each node, the number of nodes that exist within R from the node is counted. Then, the node with the largest number of nodes within the circle is selected as the first center node. The nodes that fall within the circle become the neighbor nodes of the center node. This process is repeated excluding the selected center node and its neighbors, and the next center node is selected from the remaining nodes. In this way, m center nodes and their neighbor nodes are identified; each selected group of a center node and its neighbor nodes is referred to as a dependency group. Any node that is located outside of all circles and not allocated to any group by this process is thereafter allocated to the group based on which circle is the closest in terms of the Euclidean distance.
Once the dependency groups are determined, they are matched into physical machines (this matching is discussed in the following subsection).
4.3. Matching Groups to PMs
After grouping the VMs, the next step is to decide which group of VMs should be placed in which PM. The groups are matched to PMs by building a graph of the VM groups and PMs, as illustrated in Figure 4. Matching is then conducted based on the weight of each VM group and PM pair, which is referred to as their closeness value. To find the closeness value, the resource ratios between each group, , and each PM, , are computed as follows:
In Equation (4), , , and are the resource ratios for the CPU, memory, and storage, respectively. If a PM has exactly the same amount of resources as those that are required by , the resource ratio of the PM and is equal to 1. Thus, the closeness between and can be computed by
While Equation (5) is used to compute the closeness values, a match that does not fully satisfy the resource requirements of a group may occur if , , or . In such cases, the matching should be avoided even though the closeness is small because the resource is not sufficient. If does not satisfy the resource constraints of , a constant penalty is added to as follows:
where is a constant number that is large enough to increase the closeness value .
The number of VM groups is initially set to m. However, if g PMs can satisfy the constraint for , the number of VM groups is reduced to g. With g VM groups, there are possible matches between VM groups and PMs. The matching that minimizes the sum of the closeness values should be identified from the possible matches. Let A be a g-by-m groups-to-PMs matching matrix; an element, , is 1 when is matched to and is 0 otherwise. The optimization to find A is formulated as follows:
The Hungarian matching algorithm, which is a well-known algorithm for solving matching problems [47,48], is used to solve the above optimization problem. First, a graph is built from the VM groups, the PMs, and their closeness values, and it is used as the input to the Hungarian matching algorithm. Using this algorithm, the independent-edge set of matches on the graph that minimizes the sum of the edge weights is identified. The output is a set of matches between groups and PMs.
4.4. Satisfying Resource Constraints
When none of the possible matches of groups and PMs can fully satisfy the resource constraints, the groups are adjusted until they satisfy the resource constraints of the matched PMs. To do this, the least dependent VMs in the group are removed until the group satisfies the resource constraints of the PM.
Since less-dependent VMs are located farther from the header node, the radius of the group is reduced, thereby removing the least dependent VMs, until the group satisfies the resource constraints of the matched PM. This process is applied to all groups that do not satisfy the resource constraints of their PMs. As a result, some VMs are removed from their initial groups. The removed VMs must then be allocated to new groups. A removed VM is added to a new group if the circle of the group is closer than the circles of other groups. However, the group should still satisfy the resource constraints of its matched PM after adding the VM. If the resource requirements of the closest group conflict with the resource constraints of the matched PM after adding the VM, the VM is allocated to the next closest group. The radius of the circle corresponding to the group is increased until it overcomes other groups to obtain the VM. In this way, the resource constraints of all groups are satisfied.
If the selected match does not satisfy the constraint in Equation (2), the radius of the group is adjusted as follows:
where is the minimum Euclidean distance between all pairs of nodes in the reduced dimension. A radius of a group that does not satisfy the resource constraint of its corresponding PM is iteratively reduced by , and a radius of a group that satisfies the resource constraint is increased by until all the groups satisfy the resource constraints. Figure 3 shows the initial radius R of circle is adjusted to , , and , respectively.
| Algorithm 1 Deciding location of VMs. |
|
Algorithm 1 shows the pseudocode of the proposed VM-placement scheme. The algorithm requires , , and as inputs, and an n-by-m VM location matrix, , is returned as the output. Initially, on Line 1, the number of groups is set to m. The PCA analysis described in Section 4.1 is performed on Line 2 by the PCA function. On Lines 3–18, possible solutions are derived as the number of VM groups is decreased. On Line 4, the initial radius of the dependency group is computed based on g and . Next, the radius for each VM group is set as R on Line 5. Then, the VMs are grouped using the clustering function on Line 7, as described in Section 4.2. After grouping the VMs, a match of groups to PMs is identified by the Hungarian_matching function on Line 8, as explained in Section 4.3. Using the VM groups, PMs, and A, the solution is obtained on Line 9. If the resources required by any group conflict with the resource constraints of the PM matched to it, the radii for VM groups are adjusted on Line 10 according to Equation (8), as described in Section 4.4. However, if all groups conflict resource constraints of the PMs, there may not exist any match of groups to PMs that fully satisfies the resource constraints, even radii for the groups are adjusted. In this case, the algorithm stops to find a solution on Line 12. Otherwise, the adjusted radii for VM groups are used for clustering the VMs. If there exists a solution for a given g, the loop spanning Lines 7–15 stops. Then, g is reduced by one, and this procedure is repeated.
Once the algorithm has finished, a set of final solutions for the VM placement has been selected from possible solutions for different values of g. For each selected solution, the data rate in the physical network is computed using Equation (1); the final solution is taken as the one that minimizes the data volume in the physical network of data center. Additionally, the traffic matrix W may change over time due to dynamic traffic fluctuation. In this case, the total data rate in physical network is computed again using Equation (1), and the VM placement is re-taken if the data rate is considerably different compared to the data rate obtained previously. After obtaining a result of the Algorithm 1, the decision of the actual placement can be made according to the new result.
5. Simulation Results and Analysis
To verify the proposed scalable placement (SP) algorithm for VMs, extensive numerical simulations were performed. The numerical simulations were evaluated using the Numpy, Sklearn, Scipy, and NetworkX libraries in Python [49]. The performance of SP was compared with that of: (i) a naïve placement, which VMs are placed among PMs without any strategy; and (ii) general placement (GP), which is a well-known strategy by which VMs are placed to minimize the number of PMs running in the data center. Through the simulations, effectiveness of the proposed SP was analyzed for different data traffic patterns and different number of VMs in the physical network.
5.1. Simulation Results of Small Network
Figure 5 shows a simple leaf-spine data center network, which comprises two spine switches, three leaf switches, and three PMs. Ten VMs are placed among the PMs with a simple placement plan, which enables additional VMs to be placed on other PMs if the remaining resources of the currently used PM are not sufficient to host the additional VMs. The necessary resources for each VM and the resources available on each PM are shown in Table 1 and Table 2, respectively. Additionally, the VMs are separated into two traffic-dependency groups: odd-numbered VMs are in dependency Group 1 and even-numbered VMs are in dependency Group 2. The data rates between VMs in the same dependency group are randomly selected from values generated according to a Gaussian distribution, and the data rates between VMs in different dependency groups are randomly selected from values generated according to a uniform distribution. Each simulation result reported here is the average values from 100 runs.
First, the data rates between VMs in dependency Groups 1 and 2 are set according to Gaussian distributions, each having a standard deviation (SD) of 100 Mbps but having different mean values of 1000 and 1500 Mbps, respectively. The data rates between the VMs in different dependency groups are set according to a uniform distribution ranging from 0 to 100 Mbps. The result of a PCA-based traffic-dependency analysis on this configuration is shown in Figure 6. VMs belonging to the same dependency group are placed closely, indicating that the SP algorithm successfully identifies the traffic dependencies of the VMs.
We analyzed the effectiveness of the SP for different data traffic patterns between the VMs in terms of the resulting data rate in the physical network. Numerical simulations were conducted with different mean and SD values for the Gaussian distribution used to set the data rates between VMs within the same dependency group and different maximum values for the uniform distribution used to set the data rates between VMs in different dependency groups.
The simulation results are shown in Figure 7. Figure 7a shows the effect of the mean value of the Gaussian distribution used for setting the data rates between the VMs in dependency Group 2 (in the range of 100–1500 Mbps) on the data rate in the physical network. The result shows that the performance of the proposed SP scheme improves considerably as the mean data rate increases. The effect of the SD of the Gaussian distribution of the data rates between VMs in dependency Group 2 (in the range of 100–1500 Mbps) on the data rate in the physical network is shown in Figure 7b. The result shows that the use of the SP algorithm considerably decreases the data rate in the physical network compared to when the naïve scheme is used. Moreover, the effect of the maximum value of the uniform distribution of the data rates between VMs in different dependency groups is shown in Figure 7c. As the maximum value increases, average data rate between the VMs of different dependency groups increases and becomes closer to the data rates between the VMs in the same dependency group.
5.2. Simulation Results of Large Network
Another simulation in a larger data center shown in Figure 8 was conducted to analyze the effect of the number of VMs on the data rate in the physical network. It was assumed that at most two PMs could be connected to each leaf switch. When more resources were required as the number of VMs was increased, the data center network was extended dynamically by adding additional switches and PMs. For simplicity, we assumed the same resource requirements for all VMs: two CPU cores, 4 GB of memory, and 50 GB of storage. Furthermore, we assumed the same resources were available on all PMs: 25 CPU cores, 50 GB of memory, and 700 GB of storage. At most twelve VMs can be placed on each PM due to the resource constraints of each PM.
Figure 9 shows the resulting data rates in the physical network and in the entire data center network (the sum of the data rates in the physical and virtual networks) as a function of the number of VMs. The result shows that the data rate in the physical network is almost same as the total data rate in the data center when the GP scheme is used for VM placement. However, in comparison, the SP algorithm considerably reduces the data rate in the physical network as the number of VMs increases. Specifically, when there are ten VMs, all VMs are placed on a single PM, the data rate in the physical network is 0 regardless of whether SP or GP is applied. However, as the number of VMs increases, data rate in physical network increases rapidly when the GP scheme is used to place the VMs because GP does not consider the traffic dependency between VMs.
In addition, we evaluated the performance of the SP algorithm in terms of amount of data traffic in the physical network, which can be computed by
where is the data rate between and , and is the number of physical links between and . The amount of data traffic in the physical network with respect to the number of VMs is shown in Figure 10. When the number of VMs is less than 30, the amount of data traffic in the physical network is less than 0.5 Tb for both SP and GP. However, it increases to almost 40 Tb for GP and to around 30 Tb for SP when the number of VMs is increased to 200. This results indicate that it is important to consider the traffic dependency between the VMs in order to reduce the data traffic in the physical network.
6. Emulation Results and Analysis
To conduct a more realistic performance evaluation, we carried out series of emulations. The emulation environment was created with an ONOS SDN controller [50] and a Mininet emulation tool [51]. The performance of SP was compared with that of: (i) naïve placement; (ii) general placement (GP); and (iii) Stoer–Wagner algorithm based placement (SWP) [34]. Naïve placement and GP are explained in Section 5. SWP is a network-aware VM placement approach that uses a Stoer–Wagner minimum cut algorithm [52] for grouping the highly dependent VMs. SWP would be the most similar work to the proposed method because it uses a traffic weight between the VMs for clustering the VMs as done in the proposed SP.
6.1. Emulation Settings
A leaf-spine data center network shown in Figure 8 was created using the Mininet [51]; it comprised two spine switches, four leaf switches, and eight PMs, and 120 VMs were created on the PMs. All the networking functionalities of the data center were monitored by the ONOS controller [50]. The resources (number of CPU cores, memory size, and storage size) required by each VM were randomly selected in the ranges 1–3 cores, 1–7 GB, and 2–300 GB, respectively. The resources of the PMs were set as shown in Table 3. The data rates between VMs in the same dependency group were assigned randomly according to a Gaussian distribution with a mean of 1024 Mbps and an SD of 100 Mbps; the data rates between VMs in different dependency groups were randomly assigned according to a uniform distribution with a minimum of 0 Mbps and a maximum of 100 Mbps.
6.2. Emulation Results
The first emulation was conducted to evaluate the effect of the number of dependency groups on the data rate in the physical network. The VMs were distributed randomly but equally to each dependency group. Since there were 120 VMs, the numbers of VMs in the dependency groups were 60:60, 40:40:40, 30:30:30:30, 24:24:24:24:24, and 20:20:20:20:20 when there were 2–6 dependency groups, respectively. With one dependency group, all VMs belonged to the same dependency group. The second emulation was conducted to measure the performance of the SP in terms of the traffic amount in the physical network when VMs were assigned unevenly to two dependency groups in various ratios. Within two dependency groups, the ratio of the numbers of VMs in the groups was varied as 12:0, 11:1, 10:2 , 9:3 , 8:4, 7:5, and 6:6. For example, with a ratio of 9:3, the first group included 90 VMs and the second group included 30 VMs.
Figure 11 shows the effects of the number of dependency groups and the ratio of the dependency groups with respect to the amount of data traffic in the physical network. The emulation results indicate that the use of SP considerably reduces the amount of data traffic volume in the physical network compared to that with the naïve, GP, and SWP placements. The reason for more traffic volume in the data center with the naïve and GP placements is that they do not consider the traffic dependency between the VMs. Additionally, the proposed SP method outperforms SWP even though SWP groups highly dependent VMs to make the traffic between different PMs to be minimum. The reason is that SWP does not minimize the number of running PMs. SWP splits a VM group into two small groups based on the Stoer–Wagner minimum cut algorithm if a resource for a specific group does not satisfy the resource constraints of its mapped PM. Thus, more VM groups are created with the SWP, and most of them are placed on different PMs. Therefore, the traffic amount in the physical network is increased as compared with SP.
Moreover, the time complexity of SWP is considerably high compared to the proposed method. For instance, if required resources for a VM group do not satisfy the resource constraints of its mapped PM, it is necessary to remove less dependent VMs until the VM group satisfies the resource constraints. For removing the less dependent VMs from the group, the proposed method finds a farthest node from a center node of the cluster and removes the node. Therefore, it only takes time for SP. However, SWP needs to split the group using the Stoer–Wagner algorithm, and its complexity is [53].
7. Experiment Result and Analysis
We built an SDDC testbed leveraging ONOS SDN controller and OpenStack cloud platform [54] for experimentally verifying the performance of the SP. The SONA architecture is used for building the testbed environment [55]. In SONA, native networking components of the OpenStack are replaced by an ONOS based networking module. Here, the ONOS cluster handles networking functionalities of the OpenStack [56]. The ONOS cluster acts as a networking manager, and the OpenStack controller works as a resource manager. The performance of SP was compared with that of: (i) a naïve placement; and (ii) GP.
7.1. Experiment Settings
Figure 12 illustrates a fat-tree topology of our SDDC testbed. It consisted of ten HP 2920 OpenFlow-enabled switches, a HP 1820 switch, and six HP workstations (five workstations for setting OpenStack environment and the other for ONOS controller). HP 2920 OpenFlow-enabled switches were used for connecting data network of OpenStack, and HP 1820 switch was used for connecting control and management networks of ONOS and OpenStack. The workstations used for the OpenStack controller node and ONOS SDN controller have an Intel Xeon W3565 3.2 GHz CPU, with 48 GB RAM, and 1 TB SSD. The workstations used for the compute nodes have an Intel Xeon E-5 1680v4 3.4 GHz CPU, with 128 GB RAM, and 1 TB SSD. The OpenStack environment was built with a controller node and four compute nodes.
Additionally, 30 VMs were created on the compute nodes, and their resources were randomly set from resources in Table 4. The VMs were divided into three dependency groups, in which each group consisted of ten VMs. Data rates between VMs in the same dependency group were assigned randomly according to a Gaussian distribution with a mean of 1024 Mbps and an SD of 100 Mbps; the data rates between VMs in different dependency groups were randomly assigned according to a uniform distribution with minimum of 0 Mbps and maximum of 100 Mbps.
7.2. Experiment Result
For the experiment, the VMs were randomly allocated to the four compute nodes (naïve scheme), the VMs wee allocated to the compute nodes according to the GP, and lastly the VMs were allocated to the compute nodes based on SP. Latencies between VMs in a same dependency group were measured in each placement case, while the VMs communicate to each other through the data network. Figure 13 shows a result of the experiment. As depicted on the figure, the average latency between the VMs in a same dependency group is considerably low in SP comparison to the other schemes. GP reduces the number of required compute nodes by placing the VMs on three compute nodes. However, SP also places the VMs on three compute nodes, and it improves the network performance of the data center by placing highly dependent VMs on a same compute node.
8. Conclusions
In this work, we introduce a VM placement strategy to address the scalability concerns in SDDC. Efficient VM placement can reduce the data rate in the underlying physical network and improve the performance of the data center. In this context, we formulate the optimization problem of reducing the data rate in the physical network and propose a traffic-dependency-based VM placement algorithm. To minimize the data traffic, the traffic dependencies between the VMs is analyzed by PCA, and highly dependent VMs are grouped and placed within the same PM by the gravity-based clustering. Through extensive numerical analyses and emulations, we demonstrated the effectiveness of the proposed SP strategy in various data center network configurations with different traffic patterns. In addition, we built an SDDC testbed environment using OpenStack cloud platform and ONOS SDN controller, and the efficiency of the proposed placement strategy was experimentally verified on the testbed. The performance evaluation results indicate that the proposed VM placement strategy significantly reduces the traffic volume in physical network and improves the data center network performance.
Author Contributions
Conceptualization, J.N.; Methodology, T.H.; Software, J.N. and J.B.; Supervision, H.L.; Writing—original draft, J.N.; and Writing—review and editing, H.L.
Funding
This work was supported by Institute of Information and Communications Technology Planning and Evaluation (IITP) grant funded by the Korea government (MSIT) (No. 2017-0-00421, Cyber Security Defense Cycle Mechanism for New Security Threats).
Conflicts of Interest
The authors declare no conflicts of interest.
References
- Cisco. Global Data Center IP Traffic Growth. Available online: https://www.cisco.com/c/en/us/solutions/collateral/service-provider/global-cloud-index-gci/white-paper-c11-738085.html (accessed on 11 July 2019).
- Jouini, M.; Rabai, L.B.A. Design challenges of cloud computing. In IGI Global Web Services: Concepts, Methodologies, Tools, and Applications; IGI Global: Hershey, PA, USA, 2019; pp. 351–376. [Google Scholar]
- Gohil, B.; Shah, S.; Golechha, Y.; Patel, D. A comparative analysis of virtual machine placement techniques in the cloud environment. Int. J. Comput. Appl. 2016, 156. [Google Scholar] [CrossRef]
- Raj, P.; Raman, A. Demystifying Software-Defined Cloud Environments. In Software-Defined Cloud Centers; Springer: Manhattan, NY, USA, 2018; pp. 13–34. [Google Scholar]
- Richard, F. The Software-Defined Data Center Is the Future of Infrastructure Architecture. Available online: https://www.vmware.com/files/include/microsite/sddc/the_software-defined_datacenter.pdf (accessed on 11 July 2019).
- SKTelecom. Evolving Telco Data Center with Software-Defined Technologies. Available online: https://manualzz.com/doc/33019990/skt-sddc-white-paper (accessed on 11 July 2019).
- Rich, M. Facebook Ops: Each Staffer Manages 20,000 Servers. Available online: http://www.datacenterknowledge.com/archives/2013/11/20/facebook-ops-staffer-manages-20000-servers/ (accessed on 11 July 2019).
- Aït-Sahalia, Y.; Xiu, D. Principal component analysis of high-frequency data. J. Am. Stat. Assoc. 2019, 114, 287–303. [Google Scholar] [CrossRef]
- Indulska, M.; Orlowska, M.E. Gravity based spatial clustering. In Proceedings of the 10th ACM International Symposium on Advances in Geographic Information Systems, McLean, VI, USA, 8–9 November 2002; pp. 125–130. [Google Scholar]
- OSDDC. Software-Defined Data Center (SDDC) Definition. Available online: https://www.dmtf.org/sites/default/files/standards/documents/DSP-IS0501_1.0.0.pdf (accessed on 11 July 2019).
- Gupta, H.; Nath, S.B.; Chakraborty, S.; Ghosh, S.K. SDFog: A Software-defined computing architecture for QoS aware service orchestration over edge devices. arXiv 2016, arXiv:1609.01190. [Google Scholar]
- McKeown, N.; Anderson, T.; Balakrishnan, H.; Parulkar, G.; Peterson, L.; Rexford, J.; Shenker, S.; Turner, J. OpenFlow: Enabling innovation in campus networks. ACM SIGCOMM Comput. Commun. Rev. 2008, 38, 69–74. [Google Scholar] [CrossRef]
- Hagos, D.H. Software-defined networking for scalable cloud-based services to improve system performance of Hadoop-based big data applications. In Web Services: Concepts, Methodologies, Tools, and Applications; IGI Global: Hershey, PA, USA, 2019; pp. 1460–1484. [Google Scholar]
- Cabaj, K.; Gregorczyk, M.; Mazurczyk, W. Software-defined networking-based crypto ransomware detection using HTTP traffic characteristics. Comput. Electr. Eng. 2018, 66, 353–368. [Google Scholar] [CrossRef] [Green Version]
- SDxCentral. What Is Software-Defined Compute?—Definition. Available online: https://www.sdxcentral.com/networking/sdn/definitions/what-is-software-defined-compute/ (accessed on 11 July 2019).
- Chen, G. Software-Defined Compute. Available online: https://www.idc.com/getdoc.jsp?containerId=IDC_P10666 (accessed on 11 July 2019).
- Darabseh, A.; Al-Ayyoub, M.; Jararweh, Y.; Benkhelifa, E.; Vouk, M.; Rindos, A. SDDC: A software-defined datacenter experimental framework. In Proceedings of the IEEE International Conference on Future Internet of Things and Cloud, Rome, Italy, 24–26 August 2015; pp. 189–194. [Google Scholar]
- Karki, S.; Nguyen, B.; Zhang, X. QoS support for scientific workflows using software-defined storage resource enclaves. In Proceedings of the IEEE International Parallel and Distributed Processing Symposium (IPDPS), Vancouver, BC, Canada, 21–25 May 2018; pp. 95–104. [Google Scholar]
- Sahu, H.; Singh, N. Software-Defined Storage. In Innovations in Software-Defined Networking and Network Functions Virtualization; IGI Global: Hershey, PA, USA, 2018; pp. 268–290. [Google Scholar] [Green Version]
- SDxCentral. What Is Software-Defined Security for SDN ? Available online: https://www.sdxcentral.com/security/definitions/what-is-software-defined-security/ (accessed on 11 July 2019).
- Compastié, M.; Badonnel, R.; Festor, O.; He, R.; Kassi-Lahlou, M. Unikernel-based approach for software-defined security in cloud infrastructures. In Proceedings of the IEEE Network Operations and Management Symposium (NOMS), Taipei, Taiwan, 23–27 April 2018; pp. 1–7. [Google Scholar]
- Massonet, P.; Levin, A.; Celesti, A.; Villari, M. BEACON project: Software-defined security service function chaining in federated clouds. In Advances in Service-Oriented and Cloud Computing: Workshops of ESOCC; Springer: Berlin/Heidelberg, Germany, 2018; Volume 707, p. 305. [Google Scholar]
- Brech, B.L.; Crowder, S.W.; Franke, H.; Halim, N.; Hogstrom, M.R.; Li, C.S.; Pattnaik, P.C.; Pendarakis, D.; Rao, J.R.; Ratnaparkhi, R.P.; et al. Security within a Software-Defined Infrastructure. U.S. Patent 15/474,207, 30 March 2017. [Google Scholar]
- Khosravi, H.A.; Khayyambashi, M.R. A system for providing load-aware virtual network service in a software-defined data center network. Int. J. Netw. Manag. 2017, 27, e1989. [Google Scholar] [CrossRef]
- Xie, K.; Huang, X.; Hao, S.; Ma, M. Distributed power saving for large-scale software-defined data center networks. IEEE Access 2018, 6, 5897–5909. [Google Scholar] [CrossRef]
- Zhang, C.; Xu, H.; Liu, L.; Niu, Z.; Wang, P. Kuijia: Traffic Rescaling in Software-Defined Data Center WANs. Secur. Commun. Netw. 2018, 2018, 6361901. [Google Scholar] [CrossRef]
- Li, D.; Hong, P.; Xue, K. Virtual network function placement considering resource optimization and SFC Requests in cloud datacenter. IEEE Trans. Parallel Distrib. Syst. 2018, 29, 1664–1677. [Google Scholar] [CrossRef]
- Kathiravelu, P.; Van Roy, P.; Veiga, L. Software-defined data services: Interoperable and network-aware big data executions. In Proceedings of the International Conference on Software Defined Systems (SDS), Barcelona, Spain, 23–26 April 2018; pp. 145–152. [Google Scholar]
- Masdari, M.; Nabavi, S.S.; Ahmadi, V. An overview of virtual machine placement schemes in cloud computing. J. Netw. Comput. Appl. 2016, 66, 106–127. [Google Scholar] [CrossRef]
- Usmani, Z.; Singh, S. A survey of virtual machine placement techniques in a cloud data center. Procedia Comput. Sci. 2016, 78, 491–498. [Google Scholar] [CrossRef]
- Wang, H.; Li, Y.; Zhang, Y.; Jin, D. Virtual machine migration planning in software-defined networks. IEEE Trans. Cloud Comput. 2017. [Google Scholar] [CrossRef]
- Meng, X.; Pappas, V.; Zhang, L. Improving the scalability of data center networks with traffic-aware virtual machine placement. In Proceedings of the IEEE INFOCOM, San Diego, CA, USA, 14–19 March 2010; pp. 1–9. [Google Scholar]
- Chen, J.; He, Q.; Ye, D.; Chen, W.; Xiang, Y.; Chiew, K.; Zhu, L. Joint affinity aware grouping and virtual machine placement. Microprocess. Microsyst. 2017, 52, 365–380. [Google Scholar] [CrossRef]
- Luo, G.; Qian, Z.; Dong, M.; Ota, K.; Lu, S. Improving performance by network-aware virtual machine clustering and consolidation. J. Supercomput. 2018, 74, 5846–5864. [Google Scholar] [CrossRef]
- Ma, W.; Beltran, J.; Pan, Z.; Pan, D.; Pissinou, N. SDN-based traffic aware placement of NFV middleboxes. IEEE Trans. Netw. Serv. Manag. 2017, 14, 528–542. [Google Scholar] [CrossRef]
- Chi, P.W.; Huang, Y.C.; Lei, C.L. In Proceedings of the Efficient NFV deployment in data center networks. In Proceedings of the IEEE International Conference on Communications (ICC), London, UK, 8–12 June 2015; pp. 5290–5295. [Google Scholar]
- Yan, J.; Zhang, H.; Xu, H.; Zhang, Z. Discrete PSO-based workload optimization in virtual machine placement. Pers. Ubiquitous Comput. 2018, 22, 589–596. [Google Scholar] [CrossRef]
- Pham, C.; Tran, N.H.; Ren, S.; Saad, W.; Hong, C.S. Traffic-aware and energy-efficient VNF placement for service chaining: Joint sampling and matching approach. IEEE Trans. Serv. Comput. 2017. [Google Scholar] [CrossRef]
- Fatima, A.; Javaid, N.; Sultana, T.; Hussain, W.; Bilal, M.; Shabbir, S.; Asim, Y.; Akbar, M.; Ilahi, M. Virtual machine placement via bin packing in cloud data centers. Electronics 2018, 7, 389. [Google Scholar] [CrossRef]
- Duong-Ba, T.H.; Nguyen, T.; Bose, B.; Tran, T.T. A Dynamic virtual machine placement and migration scheme for data centers. IEEE Trans. Serv. Comput. 2018. [Google Scholar] [CrossRef]
- López, J.; Kushik, N.; Berriri, A.; Yevtushenko, N.; Zeghlache, D. Test derivation for SDN-enabled switches: A logic circuit based approach. In IFIP International Conference on Testing Software and Systems; Springer: Cham, Switzerland, 2018; pp. 69–84. [Google Scholar]
- Walklin, S. Leaf-spine architecture for OTN switching. In Proceedings of the IEEE International Conference on Computing, Networking and Communications (ICNC), Santa Clara, CA, USA, 26–29 January 2017; pp. 95–99. [Google Scholar]
- Narantuya, J.; Zang, H.; Lim, H. Service-Aware Cloud-to-Cloud Migration of Multiple Virtual Machines. IEEE Access 2018, 6, 76663–76672. [Google Scholar] [CrossRef]
- Cerny, T.; Donahoo, M.J.; Trnka, M. Contextual understanding of microservice architecture: Current and future directions. ACM SIGAPP Appl. Comput. Rev. 2018, 17, 29–45. [Google Scholar] [CrossRef]
- Indrasiri, K. Microservices Layered Architecture. Available online: https://medium.com/microservices-in-practice/microservices-layered-architecture-88a7fc38d3f1 (accessed on 11 July 2019).
- Smith, L.I. A Tutorial on Principal Components Analysis. Available online: https://ourarchive.otago.ac.nz/bitstream/handle/10523/7534/OUCS-2002-12.pdf (accessed on 11 July 2019).
- Kuhn, H.W. The Hungarian method for the assignment problem. Nav. Res. Logist. Q. 1955, 2, 83–97. [Google Scholar] [CrossRef] [Green Version]
- Man, J.; Zhao, L.; Liu, M.; Peng, C.; Li, Q. A Bipartite Graph Matching Algorithm in Human-Computer Collaboration. Int. J. Perform. Eng. 2018, 14, 2384–2392. [Google Scholar] [CrossRef]
- Burns, D.M.; Whyne, C.M. Seglearn: A python package for learning sequences and time series. J. Mach. Learn. Res. 2018, 19, 3238–3244. [Google Scholar]
- ONF. ONOS. Available online: https://onosproject.org/ (accessed on 11 July 2019).
- ONF. Mininet. Available online: http://mininet.org/ (accessed on 11 July 2019 ).
- Stoer, M.; Wagner, F. A simple min-cut algorithm. J. ACM (JACM) 1997, 44, 585–591. [Google Scholar] [CrossRef]
- Wikipedia. Stoer-Wagner Algorithm. Available online: https://en.wikipedia.org/wiki/Stoer%E2%80%93Wagner_algorithm (accessed on 11 July 2019).
- OpenStack Foundation. OpenStack. Available online: https://www.openstack.org/ (accessed on 11 July 2019).
- ONF. SONA DC Network Virtualization. Available online: https://wiki.onosproject.org/display/ONOS/SONA%3A+DC+Network+Virtualization (accessed on 11 July 2019).
- Foresta, F.; Cerroni, W.; Foschini, L.; Davoli, G.; Contoli, C.; Corradi, A.; Callegati, F. Improving OpenStack networking: Advantages and performance of native SDN integration. In Proceedings of the IEEE International Conference on Communications (ICC), Kansas City, MO, USA, 20–24 May 2018; pp. 1–6. [Google Scholar]
Figure 1.
System description.

Figure 2.
VM placement cases in data center. (a) random VM placement; and (b) traffic dependency based VM placement.
Figure 2.
VM placement cases in data center. (a) random VM placement; and (b) traffic dependency based VM placement.

Figure 3.
Grouping VMs using PCA and gravity-based clustering.

Figure 4.
Matching groups to PMs.

Figure 5.
Simple data center network topology.

Figure 6.
PCA-based dependency analysis.

Figure 7.
Aggregate data rate in physical network for different traffic patterns between VMs: (a) mean values for the Gaussian distribution; (b) standard deviations for the Gaussian distribution; and (c) maximum values for the uniform distribution.
Figure 7.
Aggregate data rate in physical network for different traffic patterns between VMs: (a) mean values for the Gaussian distribution; (b) standard deviations for the Gaussian distribution; and (c) maximum values for the uniform distribution.

Figure 8.
Large data center network topology with more VMs.

Figure 9.
Data rate in the physical network with respect to number of VMs.

Figure 10.
Amount of traffic in the physical network with respect to number of VMs.

Figure 11.
Effect of the number and ratios of dependency groups: (a) effect of the number of dependency groups on the amount of data traffic; and (b) effect of the distribution of VMs to the dependency groups on the amount of traffic.
Figure 11.
Effect of the number and ratios of dependency groups: (a) effect of the number of dependency groups on the amount of data traffic; and (b) effect of the distribution of VMs to the dependency groups on the amount of traffic.

Figure 12.
Experimental setup of SDDC testbed.

Figure 13.
Average latency between the VMs of each group.


Table 1.
Resources required by the VMs.
| CPU (Cores) | Memory (GB) | Storage (GB) | |
|---|---|---|---|
| VM1 | 3 | 5 | 100 |
| VM2 | 2 | 8 | 120 |
| VM3 | 1 | 4 | 90 |
| VM4 | 4 | 3 | 80 |
| VM5 | 2 | 1 | 70 |
| VM6 | 2 | 2 | 170 |
| VM7 | 1 | 5 | 80 |
| VM8 | 2 | 5 | 80 |
| VM9 | 2 | 3 | 150 |
| VM10 | 3 | 4 | 90 |
Table 2.
Available resources in each PM.
| CPU (Cores) | Memory (GB) | Storage (GB) | |
|---|---|---|---|
| PM1 | 10 | 20 | 700 |
| PM2 | 12 | 23 | 420 |
| PM3 | 11 | 27 | 250 |
Table 3.
Available resource in each PM.
| CPU (Cores) | Memory (GB) | Storage (TB) | |
|---|---|---|---|
| PM1 | 39 | 101 | 3.0 |
| PM2 | 31 | 70 | 2.7 |
| PM3 | 29 | 44 | 1.8 |
| PM4 | 27 | 56 | 1.2 |
| PM5 | 34 | 57 | 2.0 |
| PM6 | 39 | 91 | 3.0 |
| PM7 | 34 | 72 | 2.4 |
| PM8 | 50 | 89 | 3.0 |
Table 4.
Resource types for experiment VMs.
| CPU (Cores) | Memory (MB) | Storage (GB) | |
|---|---|---|---|
| m1.tiny | 1 | 512 | 1 |
| m1.small | 1 | 2048 | 20 |
| m1.med | 2 | 4096 | 40 |
| m1.large | 4 | 8192 | 80 |
| m1.xlarge | 8 | 16,384 | 160 |
© 2019 by the authors. Licensee MDPI, Basel, Switzerland. This article is an open access article distributed under the terms and conditions of the Creative Commons Attribution (CC BY) license (http://creativecommons.org/licenses/by/4.0/).
Share and Cite
MDPI and ACS Style
Narantuya, J.; Ha, T.; Bae, J.; Lim, H. Dependency Analysis based Approach for Virtual Machine Placement in Software-Defined Data Center. Appl. Sci. 2019, 9, 3223. https://0-doi-org.brum.beds.ac.uk/10.3390/app9163223
AMA Style
Narantuya J, Ha T, Bae J, Lim H. Dependency Analysis based Approach for Virtual Machine Placement in Software-Defined Data Center. Applied Sciences. 2019; 9(16):3223. https://0-doi-org.brum.beds.ac.uk/10.3390/app9163223
Chicago/Turabian StyleNarantuya, Jargalsaikhan, Taejin Ha, Jaewon Bae, and Hyuk Lim. 2019. "Dependency Analysis based Approach for Virtual Machine Placement in Software-Defined Data Center" Applied Sciences 9, no. 16: 3223. https://0-doi-org.brum.beds.ac.uk/10.3390/app9163223
Note that from the first issue of 2016, this journal uses article numbers instead of page numbers. See further details here.