Modeling of Temperature Time-Lag Effect for Concrete Box-Girder Bridges

1
School of Civil Engineering, Key Laboratory of C&PC Structures of the Ministry of Education, Southeast University, Nanjing 210096, China
2
Department of Civil and Environmental Engineering, University of Michigan, Ann Arbor, MI 48109, USA
3
School of Architecture Engineering, Nanjing Institute of Technology, Nanjing 211167, China
*
Author to whom correspondence should be addressed.
Appl. Sci. 2019, 9(16), 3255; https://0-doi-org.brum.beds.ac.uk/10.3390/app9163255
Submission received: 1 July 2019
/
Revised: 5 August 2019
/
Accepted: 7 August 2019
/
Published: 9 August 2019
(This article belongs to the Special Issue Innovative Methods and Materials in Structural Health Monitoring of Civil Infrastructures)
Abstract
:Featured Application
According to field research results, a time-lag between structural response and temperature load is commonly encountered in practice. Due to the fact that it cannot be neglected for accurate structure health monitoring, a phase-shifting method is proposed; with the method, the time-lag effect can be effectively reduced, leading to a sound understanding of temperature load and its effect.
Abstract
It is common to assume the relationship between temperature and temperature response is instantaneous in bridge health monitoring systems. However, a time-lag effect between temperature and thermal strain response has been documented by the analysis of monitored field data of concrete box-girder s. This effect is clearly reflected by the ring feature in the temperature-strain correlation curve. Inevitably, the time-lag effect has an adverse impact on the accuracy and reliability of state assessment and real-time warning for structural health monitoring (SHM) systems. To mitigate the influence of the time-lag effect, a phase-shifting method is proposed based on the Fourier series expansion fitting method. The time-domain signal is firstly converted into the frequency domain signal to compute the phase difference between temperature data and response strain data at each decomposed order. Subsequently, the total phase difference can be obtained by weighted summation. The signal processing effectively reduces the hysteresis loop area and enhances the correlation between the structural response data and the temperature data. When processing the daily data in different seasons, it is found that after subtraction by the proposed method, the linear feature becomes dominant in the relationship between temperature and the strain during long-term observation.
1. Introduction
For concrete box-girder bridges, integral parts of the structural health monitoring (SHM) system include the structural state assessment system and the real-time warning system. A necessary prerequisite to achieve a reliable state assessment and real-time warning is the clear understanding of environmental load effects on the structure, especially the temperature related effects. In fact, the temperature effects have been investigated by many researchers. It is considered that the stress generated by the nonlinear temperature distribution is usually equivalent to the live load, and the temperature-induced stress is significant in the concrete structure [1]. Taysi et al. [2] studied the thermal characteristics of concrete under the influence of temperature variation on box-girder utilizing experiments and finite element simulation. Their work highlighted the distribution of thermal difference and its influencing factors. Besides, Catbas et al. [3] discovered that temperature effects possess an important impact on the reliability of full bridges by analyzing a vast amount of monitored data.
In order to analyze the influence of temperature effects on structure assessment [4,5], Huang et al. [6] applied Kalman filtering and Kalman cointegration to identify the damage and recognized that external effects (e.g., temperature) may mask the changes induced by structural damage. Moreover, Liang et al. and Li et al. [7,8] carried a sensitivity study based on the structural fundamental frequencies in which it has been found that variations in ambient temperature might lead to the misjudgment of structural health conditions. Their work emphasized on temperature effects, but the observation and analysis of temperature distributions need to be further investigated.
The temperature distribution is the state of temperature at various positions inside and outside a structure at a certain time [9]. Preliminary studies of the temperature effects only considered the general temperature effects. Xu et al. [10] examined more than 8 years’ temperature displacements using mean values of different temperatures sensors and obtained the statistical law of temperature change. Xu et al. [11] studied the change of structural dynamic response using uniform temperature rise and fall models. Nevertheless, they all ignored the difference in temperature distribution.
To further study the temperature stress, the nonlinear effect should be taken into consideration, when horizontal and vertical temperature gradients exist [12,13]. The external factors affecting the temperature distribution of concrete structures are solar radiation, nighttime cooling, cold air flow, wind, rain, snow, and other meteorological factors [1]. The internal factors that affect the temperature distribution of the concrete are mainly determined by the thermophysical properties of the concrete and the geometrical dimensions of the components. The spatial heterogeneity and time-dependent nature of temperature distribution make it difficult to determine the exact relationship between temperature and structural response [14]. Considering the monitored response data of a real bridge inevitably includes the influences of live load and environmental factors, making the problem more complicated.
To explore the temperature influences, separation of the temperature-induced part in data should be performed beforehand. For instance, Chenet al. [15] used the linear fitting method to determine the relationship between ambient temperature and temperature-induced strain while Hedegaard et al. [16] separated the time-dependent deformations from the temperature-related deformations by means of linear regression. They all achieved the purpose of separating the temperature-induced parts in the raw structural response data.
Previously, some scholars have noticed discrepancies in different temperature history data of steel bridges. For example, Zhou et al. [17] analyzed the lateral temperature distribution and temperature time history of the steel box-girder, and found a difference existed in the lateral temperature distribution of the box-girder at the same time. Brownjohn et al. [18] revealed that temporal and spatial temperature variations dominate displacement in long-span bridges. Meanwhile, the difference can reach 5 and 12 °C in winter and summer seasons, respectively. Furthermore, Brownjohn et al. [19] noticed there exists a time-lag effect due to thermal inertia effects, giving us a clear insight into the temperature time-lag effect.
To account for this temperature time-lag phenomenon, Zhao et al. [20] selected the first five principal components as the main components to determine the overall response of the -structure. Moreover, Guo et al. [21] noted that displacement data and temperature data for a steel box-girder cable-stayed bridge represented a lag time of approximately 45 min. After directly shifting the temperature data by 45 min, they found the correlation between the two was significantly improved. However, the temperature distribution and the temperature-induced effects of concrete small box-girder bridges still need to be further investigated.
Based on the above analysis, this study establishes that there is a significant time-lag effect in concrete box-girder bridges. This effect can be handled by a phase shift method, which is illustrated in a case study using field monitoring (strain and temperature) data. As a result, the aims of this paper include: (1) Investigate the time-lag phenomenon and its basic characteristics of concrete box-girder bridges; (2) cope with the issue of insufficient correlation between temperature data and strain data.
2. Time-Lag Effect
In this section, the time-lag effect is demonstrated through the field measured data of a real bridge. Firstly, the general situation of the Lieshihe Bridge and its SHM systems will be introduced. Then the collected data is illustrated and the time-lag effect is put forward. Finally, the character of the time-lag effect in different seasons is discussed.
2.1. Introduction of Lieshihe Bridge
Concrete small box-girder are commonly used in medium and small span bridges. Thanks to the stability and the structural characteristics suitable for both positive and negative bending moments, the cross-section form (concrete small box-girder) is becoming more and more popular in designing small and medium span bridges. This study focuses on the temperature effects on small concrete box-girders.
Lieshihe Bridge is a typical small box-girder bridge, located in Jiangsu province, China. This case study is used as an example to illustrate the thermal load on a bridge and the time-lag effect of temperature-induced strains on the bridge. The superstructure of Lieshihe Bridge is a 5-span continuous box-girder, as shown in Figure 1a. Each of the spans has a length of 25 m, with the total length of the bridge reaching 125 m. The main beams are small box-girder with a height of 1.5 m, as shown in Figure 1b. On the longitudinal axis, the locations for temperature and strain sensors are arranged in the middle section of the second span, while their positions on the lateral axis are illustrated in Figure 1b.
2.2. Time-Lag Effect
Concrete is a non-homogeneous material that consists of multiple different phases with complex thermal properties; heat transfer through complex geometries common in structural applications often results in nonuniform temperature distributions [22]. Temporal, spatial, and structural characteristics exist in temperature distributions on the bridge structure. Apart from the difference in temperature distributions (between different seasons and different days), a notable feature of the time delay between temperature and temperature-induced response indeed exists. The phenomenon that the temperature-induced structural response lags following the temperature is referred to as the time-lag phenomenon of the temperature-induced response. A considerable time-lag effect between temperature and temperature-induced strain can be found in concrete box-girder bridges.
The measured data of temperature and strain history at location S10 on 4 April 2017 is shown in Figure 2a,b, respectively. Furthermore, the correspondence of temperature and strain is plotted in Figure 2c.
In Figure 2a, from the 24 h time history data, starting from 00:00 AM to 23:59 PM, the temperature data shows a trend of decreasing between 00:00 AM and 04:15 AM, then an increasing between 04:15 AM and 15:00 PM, and a downward trend between 15:00 PM and 23:59 PM at last. By comparing Figure 2a,b, the strain is found to follow the same overall trend as the temperature. The curve of temperature vs. corresponding strain at the same time are plotted in Figure 2c. The relationship between the two represents a fusiform annular shape, showing a significant nonlinear correlation. As a structural response, strain changes cyclically due to the process of heating and cooling from sunshine, which lags the temperature change, as a result showing the annular feature. The strain data is inevitably contaminated by some live load, such as traffic load from moving vehicles, which determine a high number of local small-period fluctuations, as is shown in Figure 2b. The strain obtained after the removal of the live load is the temperature-induced strain. The separation methods will be introduced in Section 4.1.
The primary cause of the temperature time-lag effect may be the hysteresis of temperature transfer, as transfer of heat throughout the concrete cross section takes time. This hysteresis manifests as uneven temperature distributions, called thermal gradients or thermal inertia effects [19]. As strain represents an overall response of the structure measured at a single point, considering only one temperature measurement point may cause some inconsistencies. This paper investigates the temperature time-lag effect in concrete box-girder bridges, but further research is required to reveal the ultimate cause of this phenomenon. It`s worth noting that the time-lag effects mentioned in this paper all refer to the time scale of a single day. Considering that the daily trend of temperature is most distinct and has a direct influence on the structure, this paper mainly deals with the daily time-lag effect.
2.3. Seasonal Characteristics
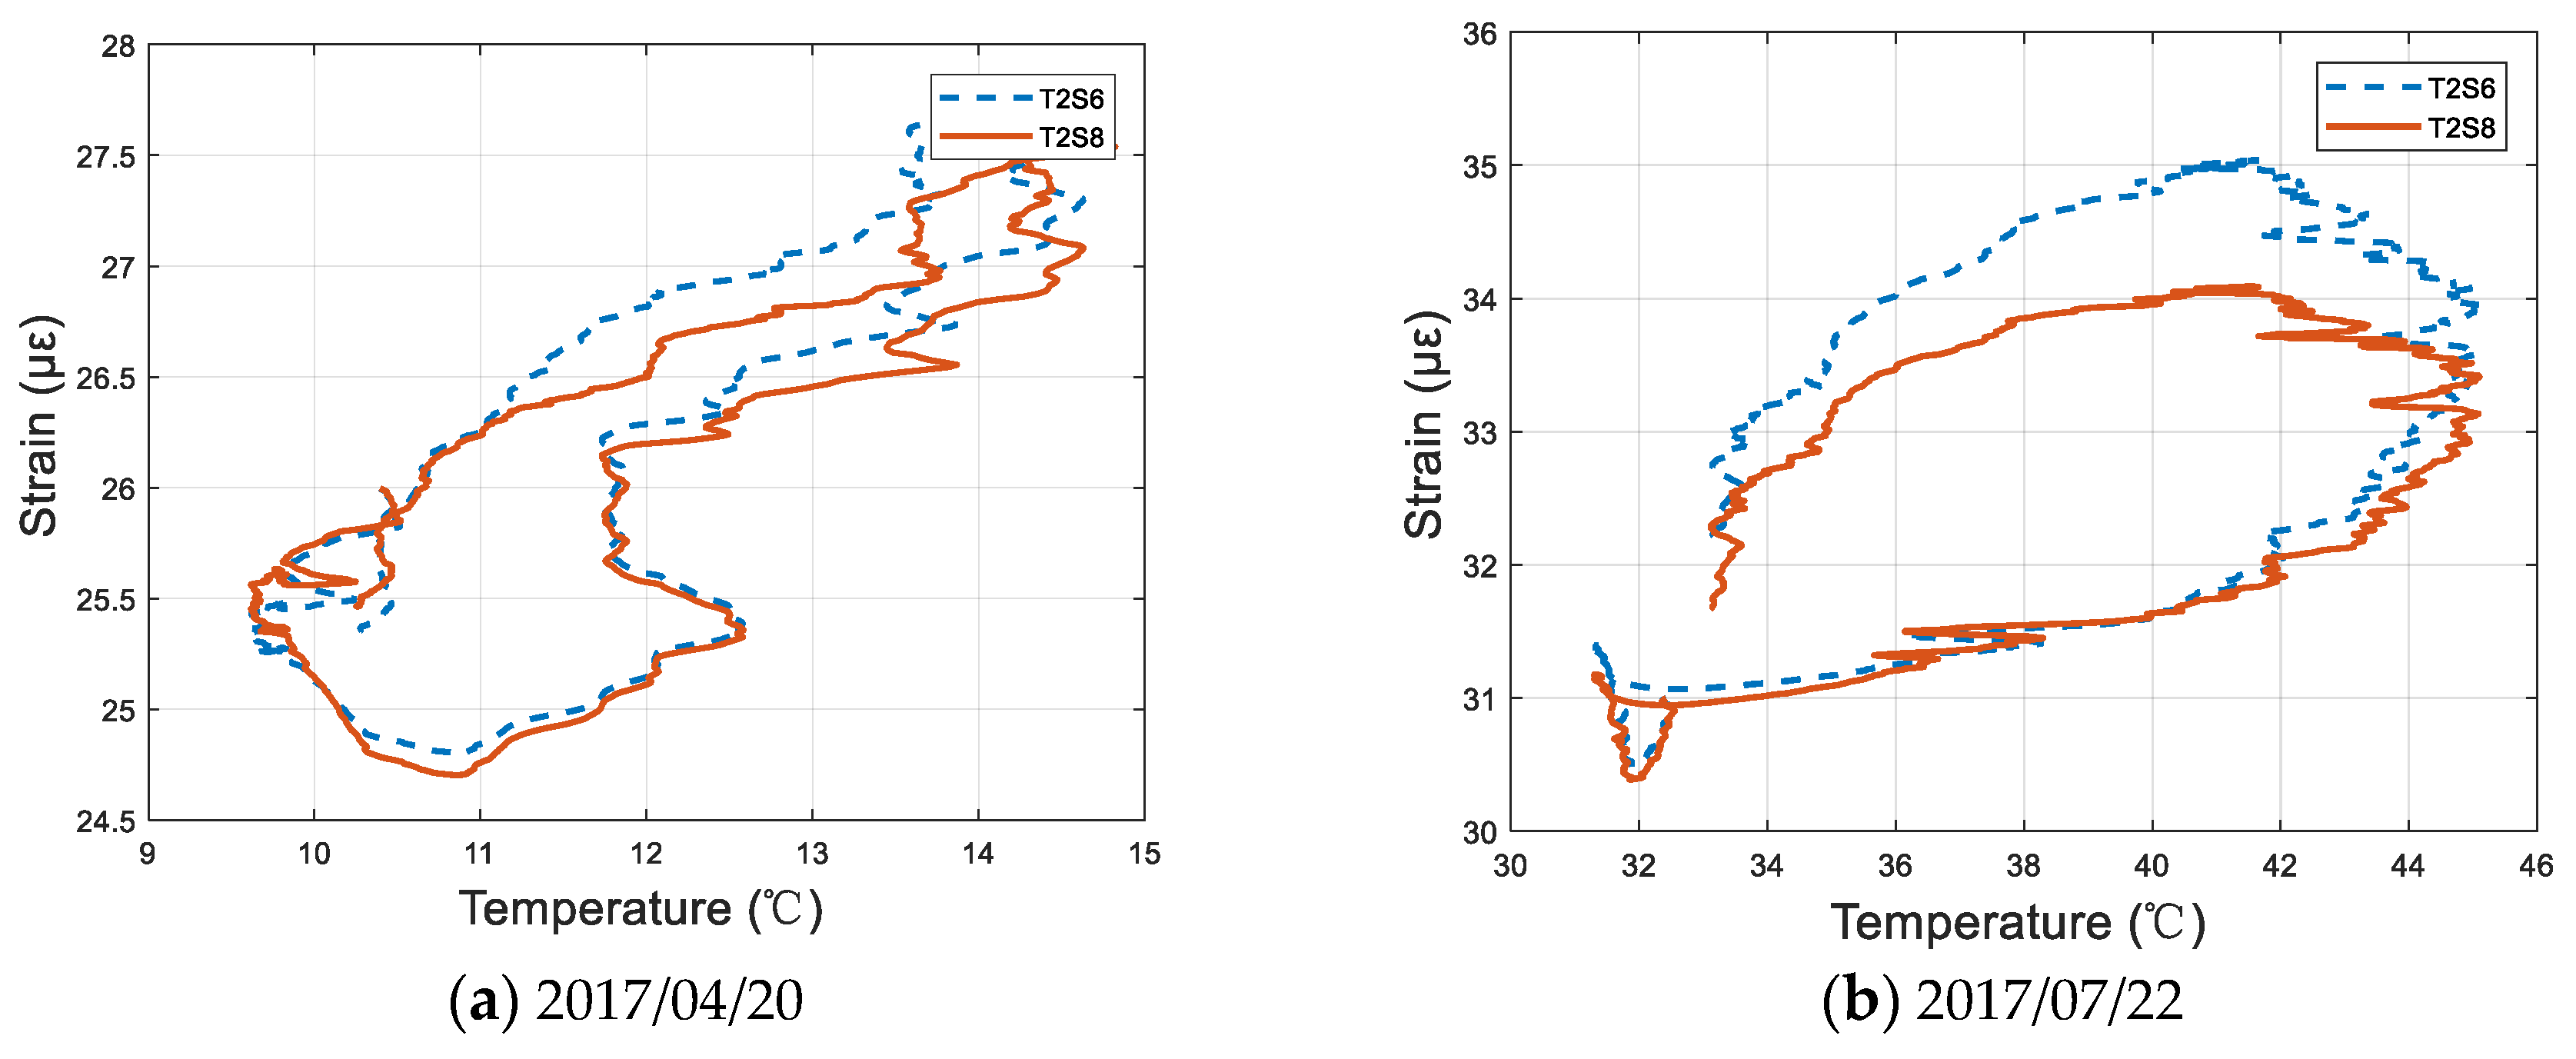
Firstly, the data of a typical day in spring and summer was selected, respectively. Then, the time-lag curve of temperature and temperature-induced strain was drawn, see Figure 3. It is obvious that the temperature and response strain curve possess typical seasonal characteristics. By comparing Figure 3a,b, it is observed that the hysteresis loop in spring, as shown in Figure 3a, is relatively more compact than that in summer, as shown in Figure 3b. It reflects that in spring the change in temperature is comparatively slower. Hence, the degree of strain response lagging temperature is also less than that in summer. It also gives us a new way to measure the extent of time-lag effect through the hysteresis loop area.
Furthermore, to illustrate the time-lag effect as a common phenomenon of concrete box-girder bridges, this paper investigated three months of data. Additionally, the hysteresis loop area of temperature and strain data of every single day are plotted in Figure 4. From Figure 4, a time-lag phenomenon of different extent in almost every day indeed exists. Moreover, the hysteresis loop area in summer (July) is larger than that in winter (November).
In summary, this part gives us a clear understanding of the time-lag phenomenon of temperature effects, a very common phenomenon in concrete box-girder bridges. Moreover, this phenomenon in the form curve annular feature can be directly reflected by the temperature vs. strain graph. Based on the analysis of data in different seasons, a seasonal characteristic was found.
3. Methods
For eliminating the time-lag effect, the premise is obtaining the phase difference between the temperature and the temperature-induced strain. To scientifically and accurately acquire the phase difference, a method based on Fourier fitting [23] is proposed.
Since any continuous periodic signal can be composed of a set of appropriate sinusoids, the Fourier transform was firstly performed on the temperature and the temperature-induced strain [24]. Specifically, the original data was fitted to obtain the phase difference of various orders [25]. Then, the phase difference between the two signals was weighted and summed, so the total phase difference was obtained. Furthermore, the flow chart of the Fourier series expansion fitting method is shown in Figure 4.
According to Figure 5, the specific processes of the method are as follows.
3.1. Temperature-Induced Response Separation
The temperature history data and structural strain data of the same day are represented as and , respectively. The wavelet decomposition and reconstruction method is used to separate the measured strain data. Consequently, the temperature-induced strain and live-load strain are extracted. The principle and process of the method are described by Zhao et al. [20].
3.2. Fourier Frequency Decomposition
The Fourier frequency decomposition in the time domain of and is used to obtain the frequency components of the data signal. The specific steps are as follows.
3.2.1. The Fourier Expansion
According to the Fourier expansion [26], the phase corresponding to each frequency component can be obtained as
where are the cosine coefficients of the Fourier factor and are the sine coefficients of the Fourier factor. And x is a discrete time variable, as to the temperature and strain data in Lieshihe bridge, x = 1/1440 × [1, 2, 3, …, 1440], owing to the sampling frequency is 1/1 min. is the reference frequency of the raw data, and is the phase of k-th order. Moreover, the amplitude of each order data signal is
The phase of each order of the signal is
3.2.2. Determining the Minimum Order of the Fourier Series Expansion P
The expansion order is determined by trial-by-level trials until the residuals root mean square error (RMSE) meets the requirements. The S order RMSE(S) between the Fourier expansion value and the temperature data can be calculated by , where S is the expansion order. The minimum expansion order M of temperature is determined by . Then, the expansion order N of strain data is also obtained in the same way. At last, the larger value of M and N is taken as P as the final expanded order.
The value of RMSE is related to the absolute value of the data value, the degree of dispersion, and so on. As a result, RMSE has no certain criterion for different kinds of data. The criterion of RMSE is determined by the correlation coefficient of fitted data and raw data in this paper.
3.3. Calculating the Phase Difference
The phase difference between the separated structural response data and the temperature data are solved at the same frequency. The specific steps are as follows.
3.3.1. Obtain the Phase of Temperature and Strain Respectively
Calculate the phase of the structural response data and the phase of the temperature data according to the Fourier series approximation expression [27]. The Fourier series approximation expression for the structural response data and temperature data are
where and represent the reference frequency of strain data and temperature data, respectively. They can be computed by 2π/L. L is the length of the normalized cycle, which is closely related to the baseline period of the raw data and can be calculated automatically by the MATLAB Fourier series fitting program. Lambda varies with data of different days. It is mainly dependent on the shape feature of the data. As the shape of data in different single days is roughly similar, so the value of Lambda is approximate 5π/2.
3.3.2. Calculate the Phase Difference
The phase difference can be calculated according to the following formula:
where is the i-th order temperature data phase and is the i-th order structure response data phase.
3.4. Determining the Total Phase Difference and Lag Time
Through a mass data research, the total phase difference can be obtained by the weighted summation of phase differences in each order. Moreover, the weight is proportional to the square of the frequency amplitude of each order.
where is the phase weight of the -th order.
The delay effect on the correlation is eliminated or reduced by translating phase difference , which can be calculated by the following equation:
where is the total delay phase to be eliminated.
Since the temperature data changes in cycles of days and the overall trend is a half-sine function, the lag time can be determined from the ratio of the lag phase difference to the half cycle of the sine function:
where is the lag time in minutes.
4. Case Study
This section includes two parts. First, the processing of separating temperature-induced strain from the field measured data is given. Then, according to the above data, the phase subtraction method based on the Fourier fitting method is described in detail and its effectiveness is verified.
4.1. Separation of Temperature-Induced Strain
The measured strain data includes the interaction of live load and temperature effects. Therefore, the separation of temperature strain is a prerequisite for thermal strain response studies. The measured data of the S6 strain measuring point of the bridge on 9 June 2017 is shown in Figure 6.
In Figure 6, the separation of temperature effects is achieved by the wavelet decomposition and reconstruction method [20]. As shown in Figure 6, this method can separate temperature strain effectively. The raw strain data is finally decomposed into temperature-induced strain (Figure 6a, the red line) and live load strain (Figure 6b). It is worth noting that the live load-induced strain in Figure 6b is larger than that in Figure 2b. The reason is the location of sensor S6 is in the center of the bridge where the girder will withstand more vehicle loads.
4.2. Phase Subtraction
The separated temperature-induced strain and temperature data was fitted subject to the Fourier decomposition. Furthermore, the temperature fitting curves of the 1st order, 4th order, and 8th order decomposition on 20 April 2017 are shown in Figure 7a. With the increase of the Fourier expansion order, the consistency was better, as shown in Figure 7b. When the data was expanded to the 6th order, the accuracy requirement was met.
The direct consequence of the time-lag phenomenon is the decline in correlation between the temperature and the temperature response. The hysteresis loop area directly reflects the degree of the time-lag phenomenon. Specifically, the larger the area, the more significant the lag effect. Therefore, the hysteresis loop area and the correlation coefficient can be used as indicators to verify the effectiveness of subtracting the time-lag phenomena by the Fourier series expansion method.
With the Fourier fitting method, the phase difference of the measured temperature and strain data on 22 July 2017 (summer) was calculated. The lag time of the S8 strain measuring point and T4 temperature measuring point can be calculated through Equation (9). As a result, the lag time was approximately 176 min in the summer season. Then, a translation of the temperature data by the lag time achieves the goal of subtracting the time-lag phenomenon. The temperature and strain correlation before and after the subtraction is shown in Figure 8. Using the same method to subtract the time-lag phenomenon in winter, Figure 9 is obtained. Meanwhile, through Equation (9), the lag time was calculated to be around 129 min in the winter season. As mentioned before, the displacement and temperature data for steel bridges possess a lag time of approximately 45 min in the research by Guo et al. [21]. As a result, the lag time in concrete structures is longer than that in steel structures.
By calculating the hysteresis areas and lag time of raw data and phase difference eliminated data, Table 1 was obtained. From Table 1, the hysteresis curve and lag times in winter with those in summer, respectively, were compared. Consequently, after subtracting, the hysteresis loop was notably reduced and the correlation coefficient was significantly improved. Therefore, the Fourier fitting method was verified to be effective.
With the proposed method, the time-lag phenomenon can be reduced. Furthermore, the long-term stable relationship between temperature load and the structural corresponding response can be more clearly reflected. Specifically, the same temperature and strain measurement points of four days in the four seasons of 2017 were selected to draw the temperature–strain curve. Then, the subtracted data curve was plotted in Figure 10. It is clear to see, although the specific distribution difference of strain varying with temperature exists in different seasons, the hysteresis loops in four seasons possess similar slopes overall. In particular, by eliminating the phase difference, the reduced curve can more clearly reflect the corresponding linear relationship characteristics of temperature-induced effects and temperature in different seasons. This feature reflects the specific mapping relationship between temperature and structure response and it is related to structure physical properties, such as structural geometry and material properties.
In summary, the wavelet decomposition and reconstruction method is useful and handy to extract temperature-induced strain. The lag time in a concrete structure is longer than that in a steel structure. Moreover, according to the comparison of hysteresis loop areas and correlation coefficient before and after subtracting the time-lag effect, the effectiveness was verified.
5. Conclusions
Temperature is the most common and critical environmental load acting on bridge structures. The non-uniformity distribution and time-dependent character of the temperature leads to the complexity of temperature response. The existence of a structural response lag behind a reference temperature was investigated by analyzing the monitored data of a small concrete box-girder bridge. This time-lag effect causes interference between temperature load and structural response, leading to difficulties in the real-time warning of the SHM system. To address this problem, this study proposed a phase difference subtraction method based on the Fourier series fitting algorithm. Then, the method was verified to be effective through a case study. The main conclusions are as follows:
- The temperature-induced effect of concrete small box-girder determine a time-lag phenomenon under the nonuniformed temperature load. Specifically, the time-lag curve in summer is fuller than that in winter, indicating that the time-lag phenomenon in summer is more notable.
- The hysteresis loop areas and correlation coefficients can be used as two indicators to describe the extent of the time-lag effect.
- The effectiveness of the Fourier series expansion and least-squares fitting method to subtract the time-lag effect was confirmed through a case study. Furthermore, using this method, the time-lag effect is reduced and the corresponding linear relationship characteristics between temperature load and temperature-induced strain in different seasons can be more clearly reflected.
- The lag time in a concrete structure is longer than that in a steel structure.
Author Contributions
Original ideas K.Y. and Y.D.; data analysis, K.Y.; funding acquisition, Y.D.; methodology, K.Y. and H.Z.; writing—original draft preparation P.S.; writing—review and editing, P.S. and F.G.
Funding
This research was funded by the National Natural Science Foundation of China (51578138 and 51608258) and the Fundamental Research Fund for the Central Universities.
Conflicts of Interest
The authors declare no conflict of interest.
References
- Xia, Q.; Cheng, Y.Y.; Zhang, J.; Zhu, F.Q. In-Service condition assessment of a long-span suspension bridge using temperature-induced strain data. J. Bridge Eng. 2017, 22, 04016124. [Google Scholar] [CrossRef]
- Taysi, N.; Abid, S. Temperature distributions and variations in concrete box-girder bridges: Experimental and finite element parametric studies. Adv. Struct. Eng. 2015, 18, 469–486. [Google Scholar] [CrossRef]
- Catbas, F.N.; Susoy, M.; Frangopol, D.M. Structural health monitoring and reliability estimation: Long span truss bridge application with environmental monitoring data. Eng. Struct. 2008, 30, 2347–2359. [Google Scholar] [CrossRef]
- Kromanis, R.; Kripakaran, P. Predicting thermal response of bridges using regression models derived from measurement histories. Comput. Struct. 2014, 136, 64–77. [Google Scholar] [CrossRef] [Green Version]
- Xiao, F.; Hulsey, J.L.; Balasubramanian, R. Fiber optic health monitoring and temperature behavior of bridge in cold region. Struct. Control Health 2017, 24, e2020. [Google Scholar] [CrossRef]
- Huang, J.Z.; Li, D.S.; Li, H.N.; Song, G.B.; Liang, Y.B. Damage identification of a largecable-stayed bridge with novel cointegrated Kalman filter method under changing environments. Struct. Control Health Monit. 2018, 25, e2152. [Google Scholar] [CrossRef]
- Liang, Y.B.; Li, D.S.; Song, G.B.; Feng, Q. Frequency Co-integration-based damage detection for bridges under the influence of environmental temperature variation. Measurement 2018, 125, 163–175. [Google Scholar] [CrossRef]
- Xiao, F.; Chen, G.S.; Hulsey, J.L. Monitoring bridge dynamic responses using fiber Bragg grating tiltmeters. Sensors 2017, 17, 2390. [Google Scholar] [CrossRef]
- Li, J.; Shang, M.; Liu, G.; Yang, T.; Pan, Y.; Zhou, J.; Zhao, Y. Two-step improvements of volumetric design method based on multi-point supported skeleton for asphalt mixtures. Constr. Build. Mater. 2019, 217, 456–472. [Google Scholar] [CrossRef]
- Xu, Y.L.; Chen, B.; Ng, C.L.; Wong, K.Y.; Chan, W.Y. Monitoring temperature effect on a long suspension bridge. Struct. Control Health Monit. 2010, 17, 632–653. [Google Scholar] [CrossRef]
- Xu, Z.D.; Wu, Z. Simulation of the effect of temperature variation on damage detection in a long-spancable-stayedbridge. Struct. Health Monit. 2007, 6, 177–189. [Google Scholar] [CrossRef]
- Hedegaard, B.D.; French, C.E.W.; Shield, C.K. Effects of cyclic temperature on the time-dependent behavior of posttensioned concrete bridges. J. Struct. Eng. 2016, 142, 04016062. [Google Scholar] [CrossRef]
- Ding, Y.L.; Zhou, G.D.; Li, A.Q.; Wang, G.X. Thermal field characteristic analysis of steel box girder based on long-term measurement data. Int. J. Steel Struct. 2012, 12, 219–232. [Google Scholar] [CrossRef]
- Liu, H.; Wang, X.; Jiao, Y. Effect of temperature variation on modal frequency of reinforced concrete slab and beam in cold regions. Shock Vib. 2016, 206, 4792786. [Google Scholar] [CrossRef]
- Chen, C.; Wang, Z.L.; Wang, Y.H.; Wang, T.; Luo, Z. Reliability assessment for PSC box-girder bridges based on SHM strain measurements. J. Sens. 2017, 2017, 8613659. [Google Scholar] [CrossRef]
- Hedegaard, B.D.; French, C.E.W.; Shield, C.K. Time-dependent monitoring and modeling of I-35W St. Anthony falls bridge. I: Analysis of monitoring data. J. Bridge Eng. 2017, 22, 04017025. [Google Scholar] [CrossRef]
- Zhou, L.R.; Xia, Y.; Brownjohn, J.M.W.; Koo, K.Y. Temperature analysis of a long-span suspension bridge based on field monitoring and numerical simulation. J. Bridge Eng. 2016, 21, 04015027. [Google Scholar] [CrossRef]
- Brownjohn, J.M.W.; Koo, K.Y.; Scullion, A.; List, D. Operational deformations in long-span bridges. Struct. Infrastruct. 2015, 11, 556–574. [Google Scholar] [CrossRef]
- Brownjohn, J.M.; Kripakaran, P.; Harvey, B.; Kromanis, R.; Jones, P.; Huseynov, F. Structural health monitoring of short to medium span bridges in the United Kingdom. Struct. Monit. Maint. 2016, 3, 259–276. [Google Scholar] [CrossRef]
- Zhao, H.W.; Ding, Y.L.; Nagarajaiah, S.; Li, A.Q. Behavior analysis and early warning of girder deflections of a steel-truss arch railway bridge under the effects of temperature and trains: Case study. J. Bridge Eng. 2019, 24, 05018013. [Google Scholar] [CrossRef]
- Guo, T.; Liu, J.; Zhang, Y.F.; Pan, S.J. Displacement monitoring and analysis of expansion joints of long-span steel bridges with viscous dampers. J. Bridge Eng. 2015, 20, 04014099. [Google Scholar] [CrossRef]
- Zhang, S.; Li, Y.; Shen, B.; Sun, X.; Gao, L. Effective evaluation of pressure relief drilling for reducing rock bursts and its application in underground coal mines. Int. J. Rock Mech. Min. 2019, 114, 7–16. [Google Scholar] [CrossRef]
- Zhou, P.; Zhang, W.; Wang, J.; Liu, J.; Su, R.; Xuemin, W. Multimode optical fiber surface plasmon resonance signal processing based on the Fourier series fitting. Plasmonics 2015, 11, 721–727. [Google Scholar] [CrossRef]
- Ding, Y.L.; Li, A.Q. Temperature-induced variations of measured modal frequencies of steel box girder for a long-span suspension bridge. Int. J. Steel Struct. 2011, 11, 145–155. [Google Scholar] [CrossRef]
- Yang, Z.-C. The least-square Fourier-series model-based evaluation and forecasting of monthly average water-levels. Environ. Earth Sci. 2018, 77, 328. [Google Scholar] [CrossRef]
- Kvernadze, G. Approximation of the singularities of a bounded function by the partial sums of its differentiated Fourier series. Appl. Comput. Harmon. Anal. 2001, 11, 439–454. [Google Scholar] [CrossRef]
- Li, W.L. Comparison of Fourier sine and cosine series expansions for beams with arbitrary boundary conditions. J. Sound Vib. 2002, 255, 185–194. [Google Scholar] [CrossRef]
Figure 1.
Photo of Lieshihe River Bridge and deployment locations of sensors.

Figure 2.
Time history plots of (a) temperature, (b) strain, and (c) temperature-strain correlation curve on 4 April 2017.
Figure 2.
Time history plots of (a) temperature, (b) strain, and (c) temperature-strain correlation curve on 4 April 2017.

Figure 3.
Plots of strain vs. temperature.

Figure 4.
Hysteresis loop area in three months of 2017.

Figure 5.
The flow chart of the Fourier series expansion.

Figure 6.
Strain time history of the raw data and the processed data.


Figure 7.
The Fourier curve fitting results (20 April 2017).


Figure 8.
Temperature vs. strain plots in summer (22 July 2017).

Figure 9.
Temperature vs. strain plots in winter (27 November 2017).

Figure 10.
Temperature–strain curve and the subtracted data curve in different seasons.


Table 1.
Comparison of indicators before and after phase difference elimination.
| Date | Correlation Coefficient | Hysteresis Loop Area | |
|---|---|---|---|
| 22 July 2017 | Before elimination | 0.698 | 29.67 |
| After elimination | 0.957 | 4.41 | |
| 27 November 2017 | Before elimination | 0.885 | 13.65 |
| After elimination | 0.974 | 3.27 |
© 2019 by the authors. Licensee MDPI, Basel, Switzerland. This article is an open access article distributed under the terms and conditions of the Creative Commons Attribution (CC BY) license (http://creativecommons.org/licenses/by/4.0/).
Share and Cite
MDPI and ACS Style
Yang, K.; Ding, Y.; Sun, P.; Zhao, H.; Geng, F. Modeling of Temperature Time-Lag Effect for Concrete Box-Girder Bridges. Appl. Sci. 2019, 9, 3255. https://0-doi-org.brum.beds.ac.uk/10.3390/app9163255
AMA Style
Yang K, Ding Y, Sun P, Zhao H, Geng F. Modeling of Temperature Time-Lag Effect for Concrete Box-Girder Bridges. Applied Sciences. 2019; 9(16):3255. https://0-doi-org.brum.beds.ac.uk/10.3390/app9163255
Chicago/Turabian StyleYang, Kang, Youliang Ding, Peng Sun, Hanwei Zhao, and Fangfang Geng. 2019. "Modeling of Temperature Time-Lag Effect for Concrete Box-Girder Bridges" Applied Sciences 9, no. 16: 3255. https://0-doi-org.brum.beds.ac.uk/10.3390/app9163255
Note that from the first issue of 2016, this journal uses article numbers instead of page numbers. See further details here.