Article

The Accuracy of Determining Cluster Size by Analyzing Ripley’s K Function in Single Molecule Localization Microscopy

Collaborative Innovation Center for Bio-Med Physics Information Technology, College of Science, Zhejiang University of Technology, Hangzhou 310023, China
*
Author to whom correspondence should be addressed.
Submission received: 12 July 2019 / Revised: 3 August 2019 / Accepted: 6 August 2019 / Published: 9 August 2019
(This article belongs to the Section Applied Biosciences and Bioengineering)

Abstract

:
Ripley’s K function was developed to analyze the spatial distribution characteristics in point pattern analysis, including geography, economics and biomedical research. In biomedical applications, it is popularly used to analyze the clusters of proteins on the cell plasma membrane in single molecule localization microscopy (SMLM), such as photo activated localization microscopy (PALM), stochastic optical reconstruction microscopy (STORM), universal point accumulation imaging in nanoscale topography (uPAINT), etc. Here, by varying the parameters of the simulated clusters on a modeled SMLM image, the effects of cluster size, cluster separation and protein ratio inside/outside the cluster on the accuracy of cluster analysis by analyzing Ripley’s K function were studied. Although the predicted radius of clusters by analyzing Ripley’s K function did not exactly correspond to the actual radius, we suggest the cluster radius could be estimated within a factor of 1.3. Employing peak analysis methods to analyze the experimental epidermal growth factor receptor (EGFR) clusters at fibroblast-like cell lines derived from monkey kidney tissue - COS7 cell surface observed by uPAINT method, the cluster properties were characterized with errors. Our results present quantification of clusters and can be used to enhance the understanding of clusters in SMLM.

1. Introduction

Single molecule localization microscopy (SMLM) is one of the most widely used imaging tools in molecular biology. Benefitting from the advantage of sub-diffraction-limit spatial resolution by localization of individual molecular blinking events from sequential detections, SMLM has been popularly used to characterize the spatial organization of membrane proteins [1,2,3]. Growing evidence suggests that the protein clustering (aggregation) at the cell membrane, one of the most important organization states, is associated with many cell functional changes and diseases: overexpression and clustering of epidermal growth factor receptor (EGFR) are observed in many cancers [4,5,6]; clustering of nicotinic acetylcholine receptors (nAChRs) in high concentrations is critical for muscle function [7,8]; clustering of ion channels (Na+, Ka+, Ca2+ channels) is essential for signal transduction [9,10,11,12]; etc. Thus, quantitative analysis of protein clusters, such as cluster number, cluster size, protein density of individual cluster, etc., is extremely important because it leads to a better understanding of the function-related clustering process of proteins. So far, the clusters detected by SMLM are commonly analyzed by Ripley’s K function (see in Materials and Methods) to give detailed information. In this approach, by analyzing the localization of proteins in a two dimensional super-resolution SMLM image, clustering is firstly identified if the density of proteins within a distance r of another protein is greater than that expected for a spatial point pattern distributed randomly within the same distance [13]. Then, other interesting cluster parameters, such as the cluster area and the molecule density inside or outside the cluster, can be extracted [14,15]. However, because of the inherent properties of mathematical methods and the extreme small size of protein clusters in molecular biology, this method has limitations (i.e., the average radius of clusters estimated by analyzing Ripley’s K function has dependence not only on the distance of cluster separation, but also on the density of proteins inside/outside the cluster domain, and the measured cluster properties by analyzing Ripley’s K function relate to the localization uncertainty of SMLM [15,16]). In summary, so far, the accuracy study of the quantitative analysis of clusters by analyzing Ripley’s K function remains elusive, but it is of the utmost need to contextualize the increasing use of Ripley’s K function in molecular biology.
In our work, to study the accuracy of cluster analysis by using the peak analysis method as described in Kiskowski et al. [16], in which disk-shaped domains are randomly drawn so that protein clustering occurs on a modeled SMLM image. The density of proteins inside the domain was set much higher than that outside domain. Varying the parameters of simulated clusters, we evaluated their effects on the accuracy of quantitative analysis of clusters by the peak analysis method. Together with experimental membrane protein cluster analysis, our results present a better understanding and characterization of cluster properties.

2. Materials and Methods

2.1. Methods for SMLM Image and Nanoclusters Analysis

In spatial statistics, Ripley’s K function is an analysis method used to characterize spatial point patterns over a given area of interest (i.e., clustered, dispersed or randomly distributed). Ripley’s K function is defined as [13,14],
K ij ( r )   =   λ j 1 E [ M ( r ) ]
where the density of points in the domain is denoted as λ , M ( r ) is the number of j points within r distance of a randomly chosen i point. E is the expectation number of events within radius r. For random distribution, a state of randomness where the events are located in a more or less uniform manner is given as, E [ M ( r ) ]   =   λ π r 2 . To normalize the Ripley’s K function [14], Ripley’s L function is introduced here as L ( r )   =   K ( r ) / π . Furthermore, Ripley’s H function is yielded, H ( r )   =   L ( r )     r . In the case of spatial point pattern of random distribution, without any point clustering, H ( r ) = 0 . In clustered or dispersed cases, H ( r )   >   0 or H ( r )   <   0 , respectively. The average radius of clusters is given by r value corresponding to the maximum of H ( r ) , termed as the ‘peak analysis method’.
In our simulation, we first generated a null image with a certain size, for example, a size of 4 × 4 µm2. On the image, random distribution of spatial point patterns at lower density of D out was generated and the positions of the points were defined by the ‘rand’ function in Matlab (MathWorks Inc. Natick, MA, USA). To generate the clusters, we randomly distributed, for example, 10 points on the image, which were set as the centers of the clusters. Given an average radius of the clusters R cluster set , 10 circles could be drawn. Then to coincide with the naïve state of the protein clusters on the cell plasma membrane, the points (proteins) at higher density of D in were distributed within these clusters randomly. It is worth noting that in our simulation, the clusters of each modeled SMLM image would have neither uniform locations, nor uniform distribution of proteins inside/outside clusters. Moreover, the random distribution of proteins serve as a ‘buffer zone’ to obviate the edge effects [17]. Finally, by applying the Gaussian convolution of these points (see in Supplementary Information, Supplementary Text), a simulated SMLM was obtained.
After constructing 2D spatial point patterns of protein distribution, Ripley’s H function was calculated as described in [18], (see in Supplementary Information, Supplementary Text). H ( r ) was generated at each point to measure the degree of clustering. If H ( r )   >   0 , the clustering was identified, the mean radius of clusters was given by the r value corresponding to peak value of H ( r ) , then the cluster size, number of clusters, and other parameters could be readily extracted and calculated. For comparison, we simply applied the well-known image processing tool ImageJ (National Institutes of Health, USA) to process the modeled SMLM image [19]. The cluster binary map was generated with a threshold-based approach using the intensity plot plugin of ImageJ [20].

2.2. Material for EGFR (Epidermal Growth Factor Receptor) Measurements at Fibroblast-Like Cell Lines Derived from Monkey Kidney Tissue—COS7 Cell Surface

COS7 cells were cultured on ethanol and phosphate-buffered saline (PBS), (Sigma-Aldrich, St Louis, MO, 63103, USA) cleaned round glass coverslips in dulbecco’s modified eagle medium (DMEM) (Gibco, Invitrogen, Carlsbad, CA, USA) supplemented with 10% fetal bovine serum (FBS) at 37 °C in 5% CO2 for 3–5 days. The day of the experiment, the cells were washed twice with PBS and fixed using 4% paraformaldehyde (PFA) at room temperature for 30 min. Before imaging, fixed cells were washed again with PBS. The antibody panitumumab (Amgen, Thousand Oaks, CA, USA) was labeled with fluorescent dyes Atto 647-NHS-ester/Atto 532-NHS-ester ((Sigma-Aldrich, St Louis, MO, 63103, USA) following the instructions of the protein labeling kit ((Sigma-Aldrich, St Louis, MO, USA). After preparation, coverslips were mounted on an open chamber and ~500 µL medium was added to the cells. For imaging, we applied an Olympus IX73 inverted microscope (Olympus, Tokyo, Japan) equipped with a 1.45 NA 100× oil immersion objective (PlanAPO, Olympus, Tokyo, Japan) to measure the EGFR distributions at the COS7 cell surface by universal point accumulation imaging in nanoscale topography (uPAINT) (Universal Point Accumulation Imaging in the Nanoscale Topography) method [21,22]. 4 µL of fluorescent ligands (2 µL Panitumumab-Atto532 and 2 µL Panitumumab-Atto647) were added and the medium homogenized carefully with 100 µL Pipetman. By using two oblique illuminations and two channels of detection on EM CCD camera (iXon, Andor Technology, Shanghai, China), we simultaneously obtained two stacks of images, which denote the substantial EGFR distributions at COS7 cell surface labeled with different colors. The initial data analysis was performed by ImageJ (National Institutes of Health, USA) and MetaMorph software (Universal Imaging Corporation, Downingtown PA, USA) using a modified QuickPALM plugin [23] and PALM Tracer plugin developed by Sibarita et al. [21,24]. Some useful links for the SMLM data processing software can be found in [19,24,25,26,27].

3. Results and Discussion

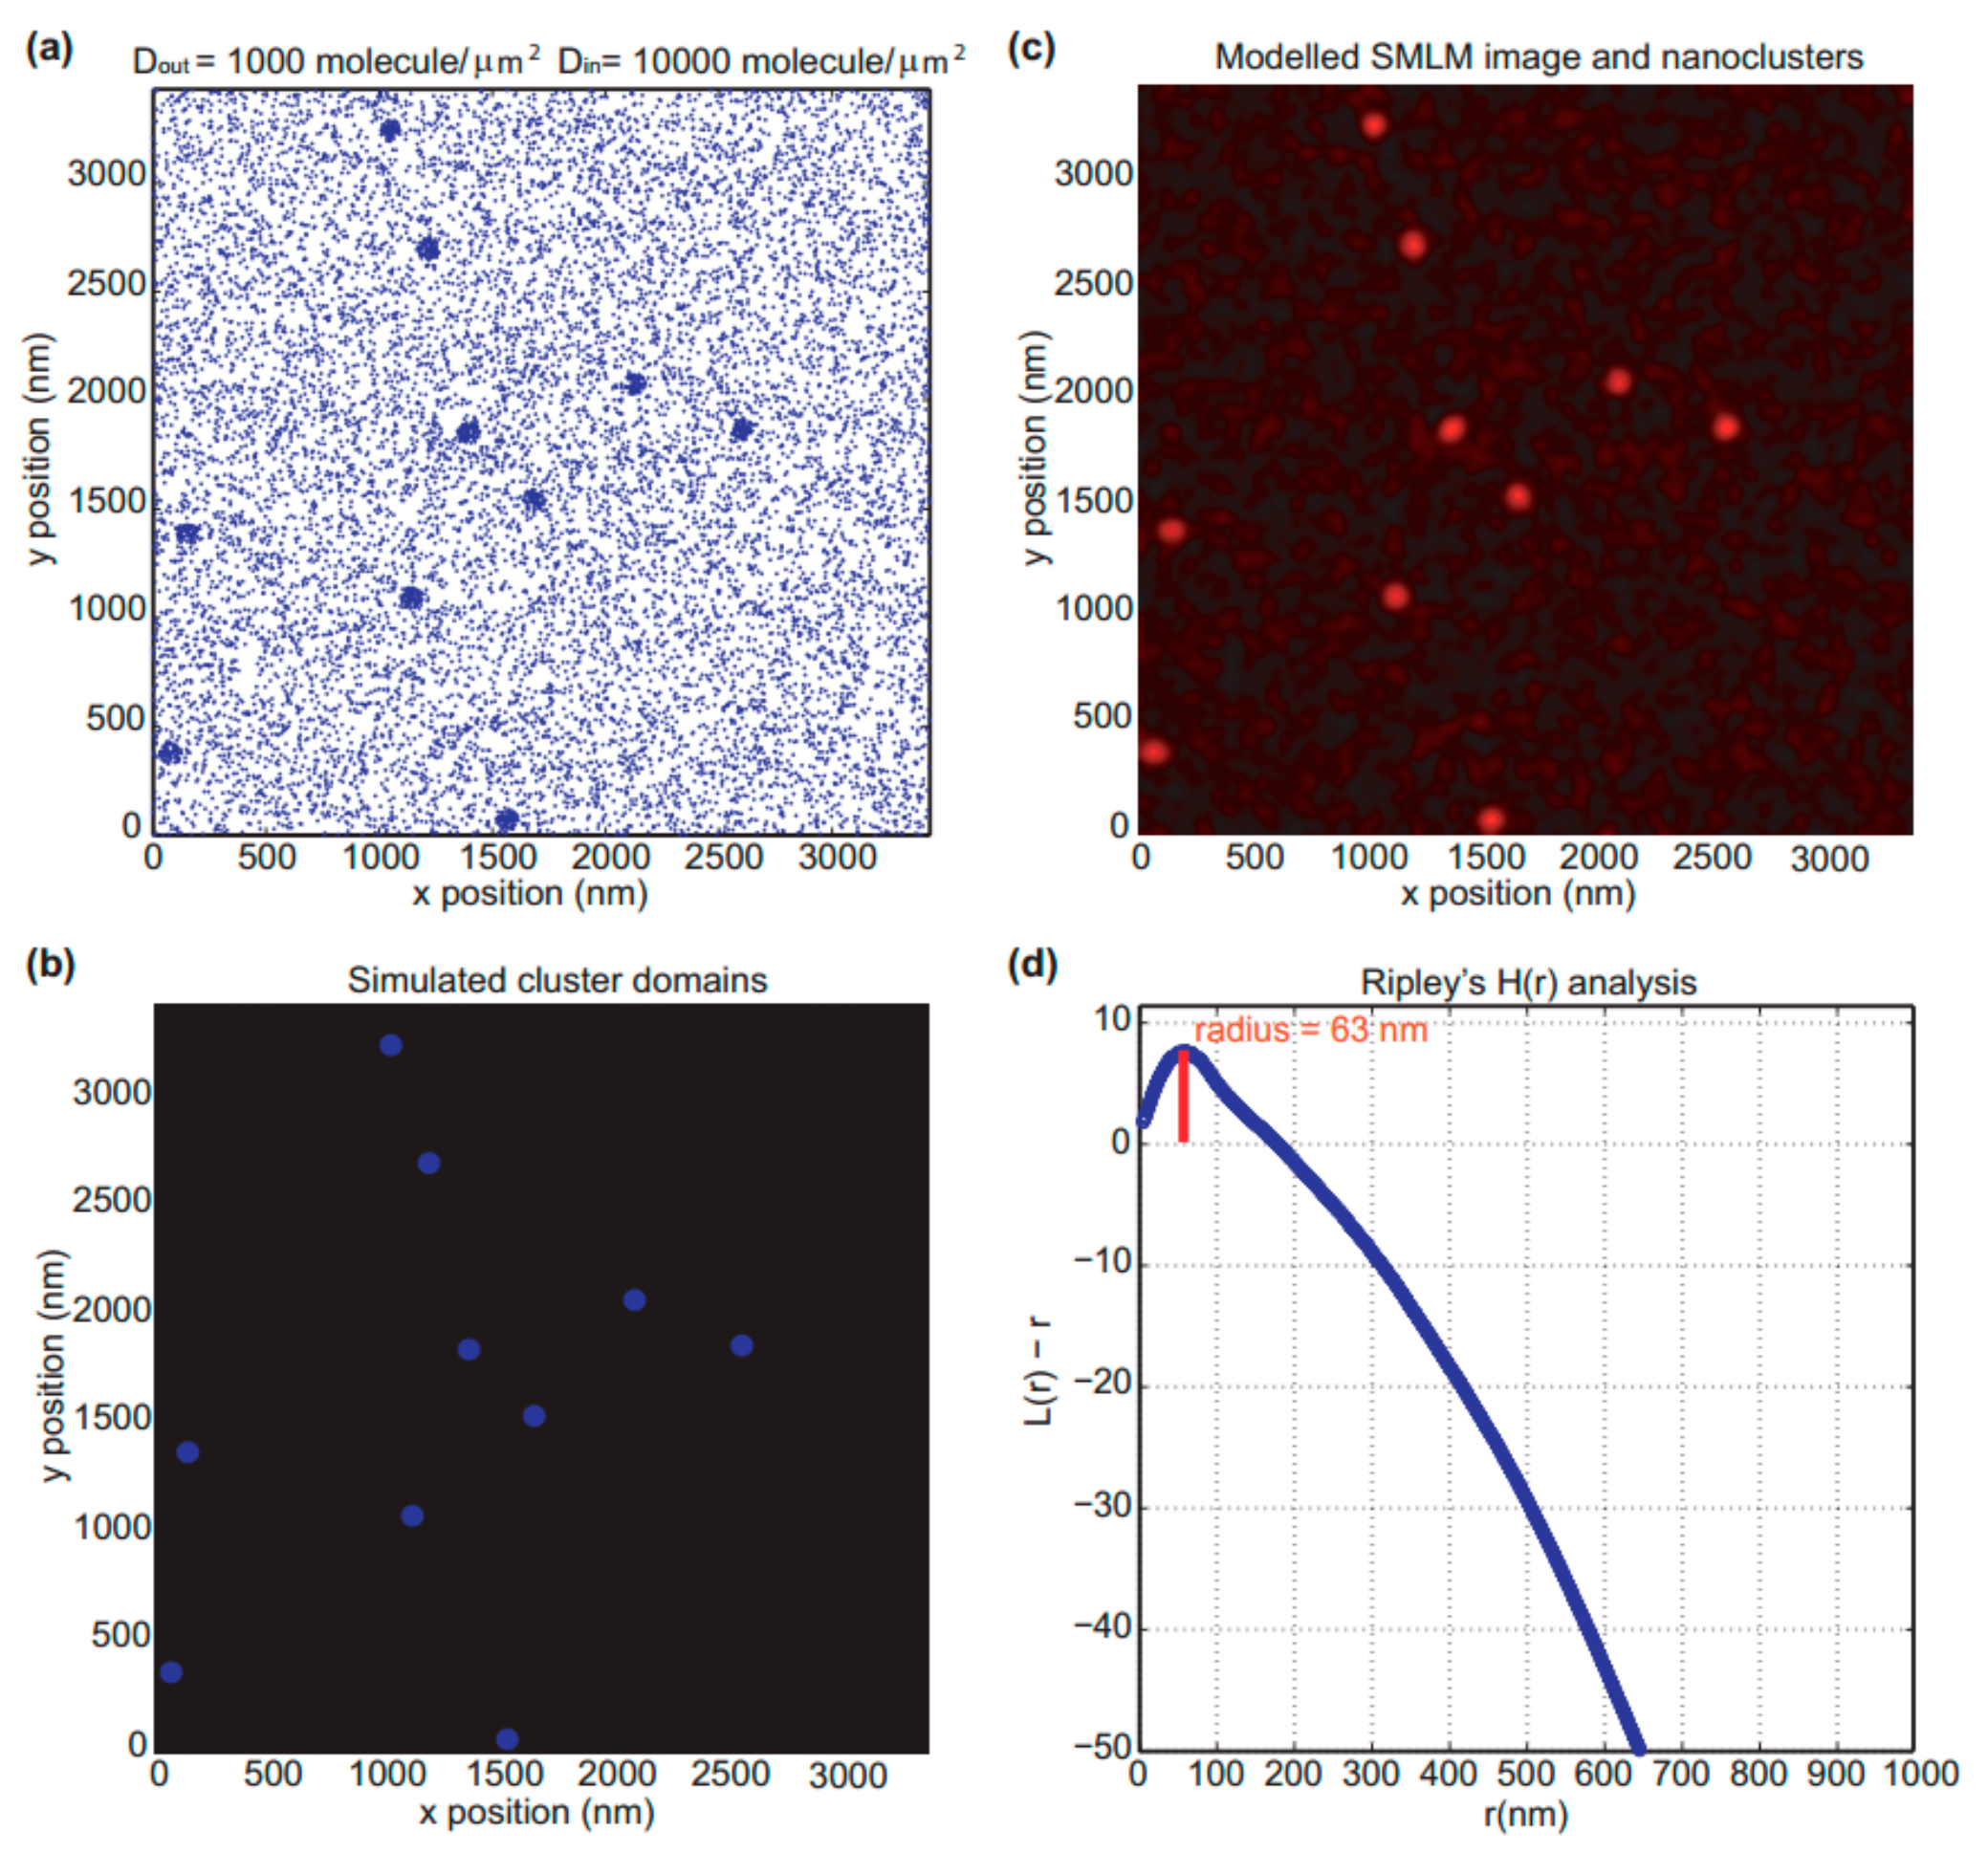
3.1. The Modeled SMLM Image and Nanoclusters

In recent photo activated localization microscopy (PALM) or stochastic optical reconstruction microscopy (STORM) experiments, the membrane proteins outside cluster were measured and had a density of ~1000 molecules/μm2, whereas the density of protein inside cluster proved to be about 10× higher [14]. We thus first generated a random distribution of spatial point patterns, at a density of D out   =   1000 molecules/μm2. Peak analysis method was applied for analyzing domain size. The results indicated a nice agreement with the expectations [16]; the measured average radius of clusters was R cluster mes   =   0 , which meant that no clustering occurred (Supplementary, Figure S1). We next simulated the clusters with an average radius of R cluster set   =   50 nm and a protein density inside cluster of D in   =   10,000 molecules/μm2 (as seen in the background of Figure S1, in Figure 1a). The disk-shaped domains were simulated as clusters, as shown in Figure 1b. The red simulated image in Figure 1c was generated by Gaussian convolution of the points in Figure 1a with a spatial resolution of 30 nm. The Ripley’s H plot was presented in Figure 1d.
It is clear that the spatial point pattern displays a high degree of clustering. The value of L ( r )     r above zero indicated that more points were being encircled by concentric circle radius between 0 nm and 180 nm for each point than the expectation of random distribution. The average radius of clusters was given by the r value corresponding to the maximum of L ( r )     r , R cluster mes   =   63 nm , which has +26% error of the actual radius R cluster set   =   50 nm . For comparison, we used the well-known software ImageJ to process the modeled SMLM image of Figure 1b (Supplementary, Figure S2). By measuring the intensity distributions of the background (the simulated image except the clusters), we found less than 10% of the points had an intensity higher than 2× the average intensity. The threshold was thus chosen as 2× the average intensity of the background. The generated binary map of clusters is in Figure S2b. By counting the total number of white pixels, we obtained radius R cluster mes   =   65 nm . The peak analysis method gave comparable results as ImageJ analysis, while it has the advantage of direct prediction of clusters. To further evaluate the accuracy of quantitative cluster analysis, we applied different parameters to the simulated images. The effects of cluster separation, cluster diameter and protein density inside/outside cluster on the accuracy of peak analysis will be discussed.

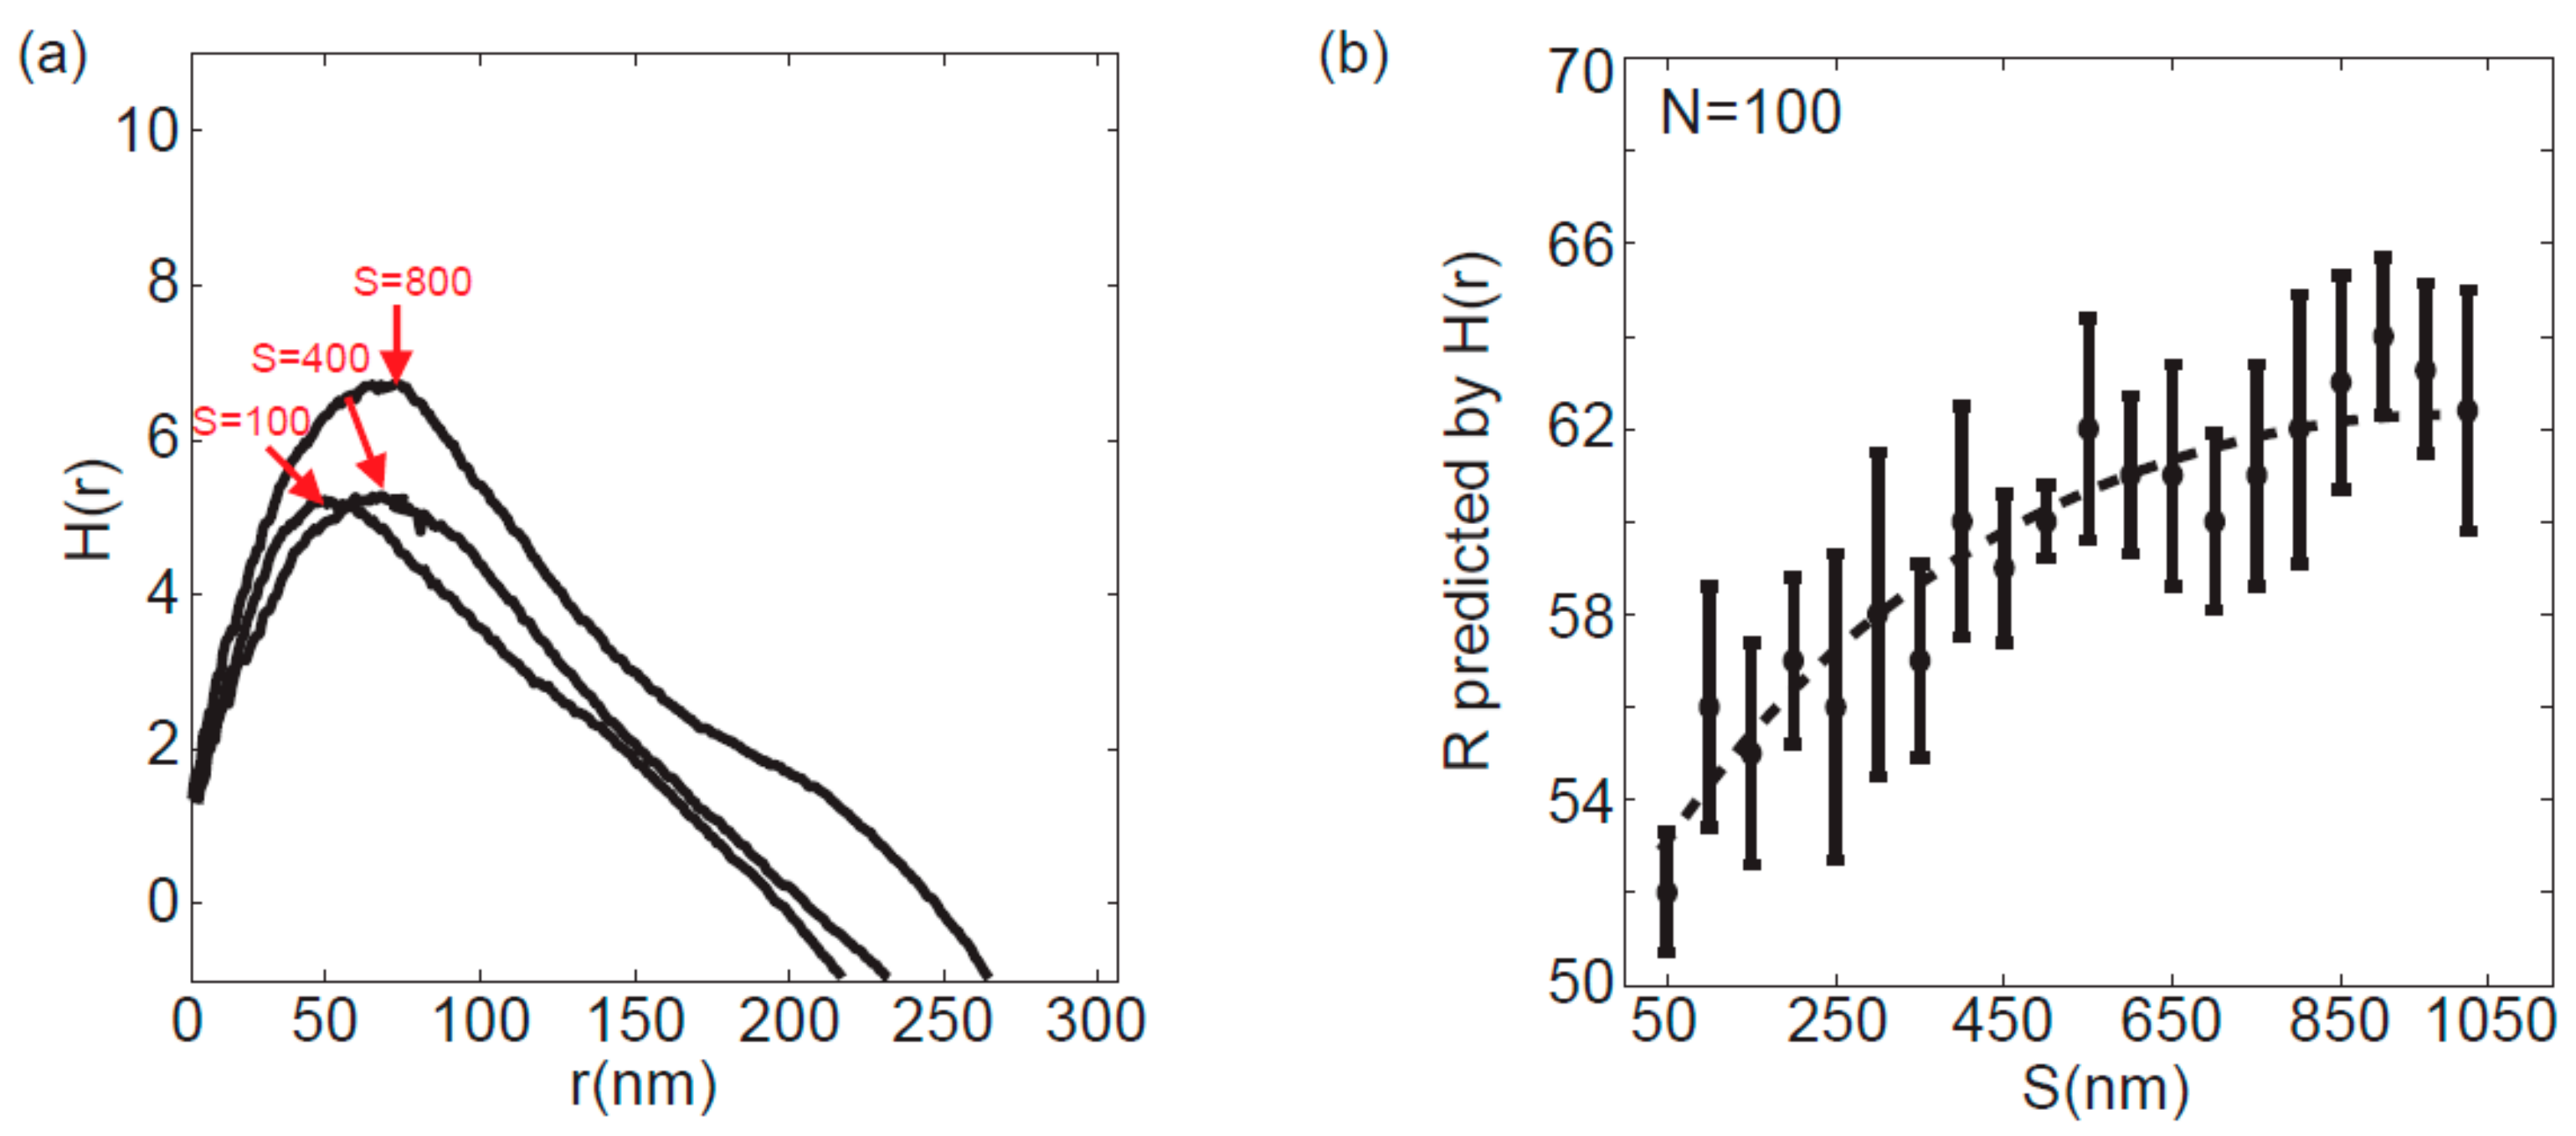
3.2. Effect of the Clusters Separation Distance on the Accuracy of Peak Analysis Method

By using the peak analysis method to analyze the regular lattice distributed clusters, Kiskowski et al. [16] concluded that the predicted average radius of clusters R cluster mes monotonically increases from the actual radius R cluster set to 2 R cluster set as the cluster separation S increases to arbitrarily large values. In our case, to simulate naïve-like conditions, we investigated the relationship between R cluster mes and S by using randomly distributed clusters; the average distance of clusters separation was defined as S cluster average . The protein density inside/outside the cluster was given as above. The simulated SMLM images at different cluster separations S cluster average and the peak analysis results are shown in Figure S3. As a higher aggregation state of clusters reduces the accumulative effects of peak analysis [16], the error of peak analysis significantly increases as the cluster separation increases from 100 nm to 800 nm (Figure 2a). It is indicated that by using peak analysis, a smaller area of analysis with a high density of clusters gives a better estimation of the cluster radius. Interestingly, our results present a more accurate prediction of cluster radius than previous studies. We repeated 100× the estimation of cluster radius for each cluster separation and found that even with an average separation of clusters that reaches 20 R cluster set , the cluster radius can be estimated within a factor of 1.3 of the actual radius; moreover, the mean and standard deviations of every 100 independent point distributions were not related to the cluster separation (Figure 2b). Notice that for simplicity, in this simulation, we increased the clusters separation distance using the identical clusters with an average diameter of 50 nm.

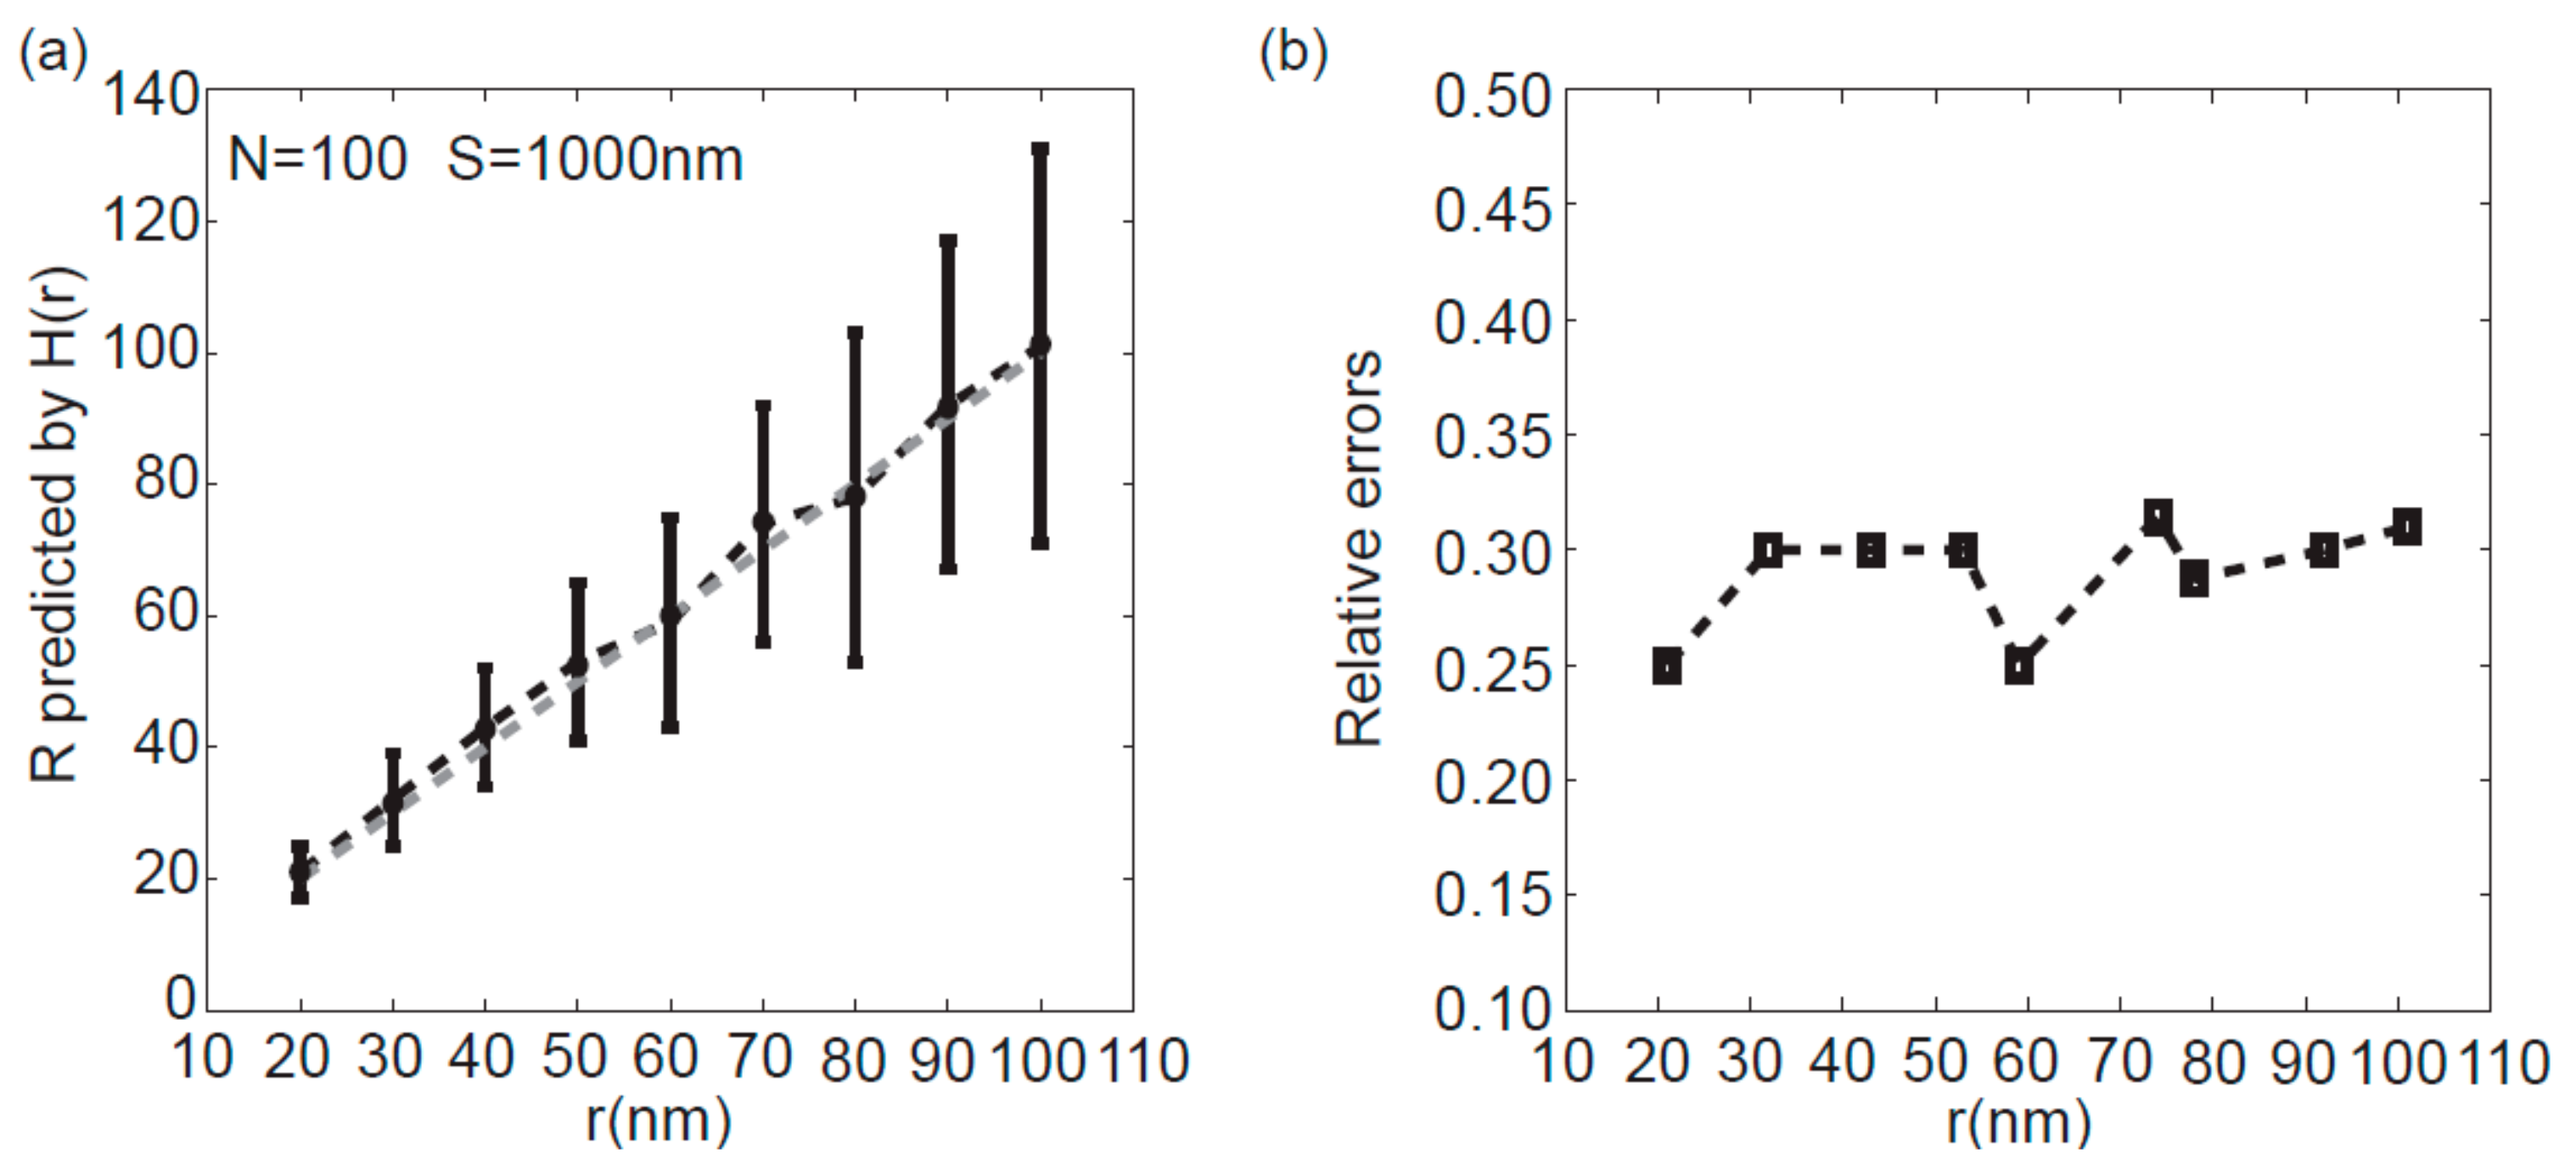
3.3. Effect of the Cluster Diameter on the Accuracy of Peak Analysis Method

Since the purpose of peak analysis is to predict the average radius of clusters, it is important to study the accuracy of estimation for different sized clusters. As membrane protein clusters are often smaller than 100 nm in diameter [28], we varied the set radius of clusters from 20 nm to 100 nm while holding the cluster separation constant at 1000 nm, for each simulation. Ripley’s H function is calculated in Figure S4. From the estimated radius of the cluster and the standard deviation of 100 point patterns in Figure 3a, we found that the predicted cluster radius by peak analysis (dashed black, n = 100) corresponds well to the actual radius (dashed gray), but the standard deviations (SD) are greatly increased as the radius varies from 20 nm to 100 nm. The major reason for this interesting phenomenon may increase the cluster diameter equivalent to reduction of the ‘buffer zone, bringing more errors in peak analysis. To evaluate further, the relative error defined as the SD over the actual radius is calculated in Figure 3b; we found that the relative errors were always close to 30%. This result is consistent with the above result, up to 1000 nm cluster separation, and we suggest that the peak analysis method may predict the cluster radius within a factor of 1.3 of actual radius. Moreover, these findings suggest that although the relative errors do not depend on the cluster radius, for a large cluster, a single peak analysis may provide an estimated radius with unacceptable errors. To have an accurate prediction of the cluster radius, it is essential to estimate the cluster radius by averaging at least ten from the peak analysis.

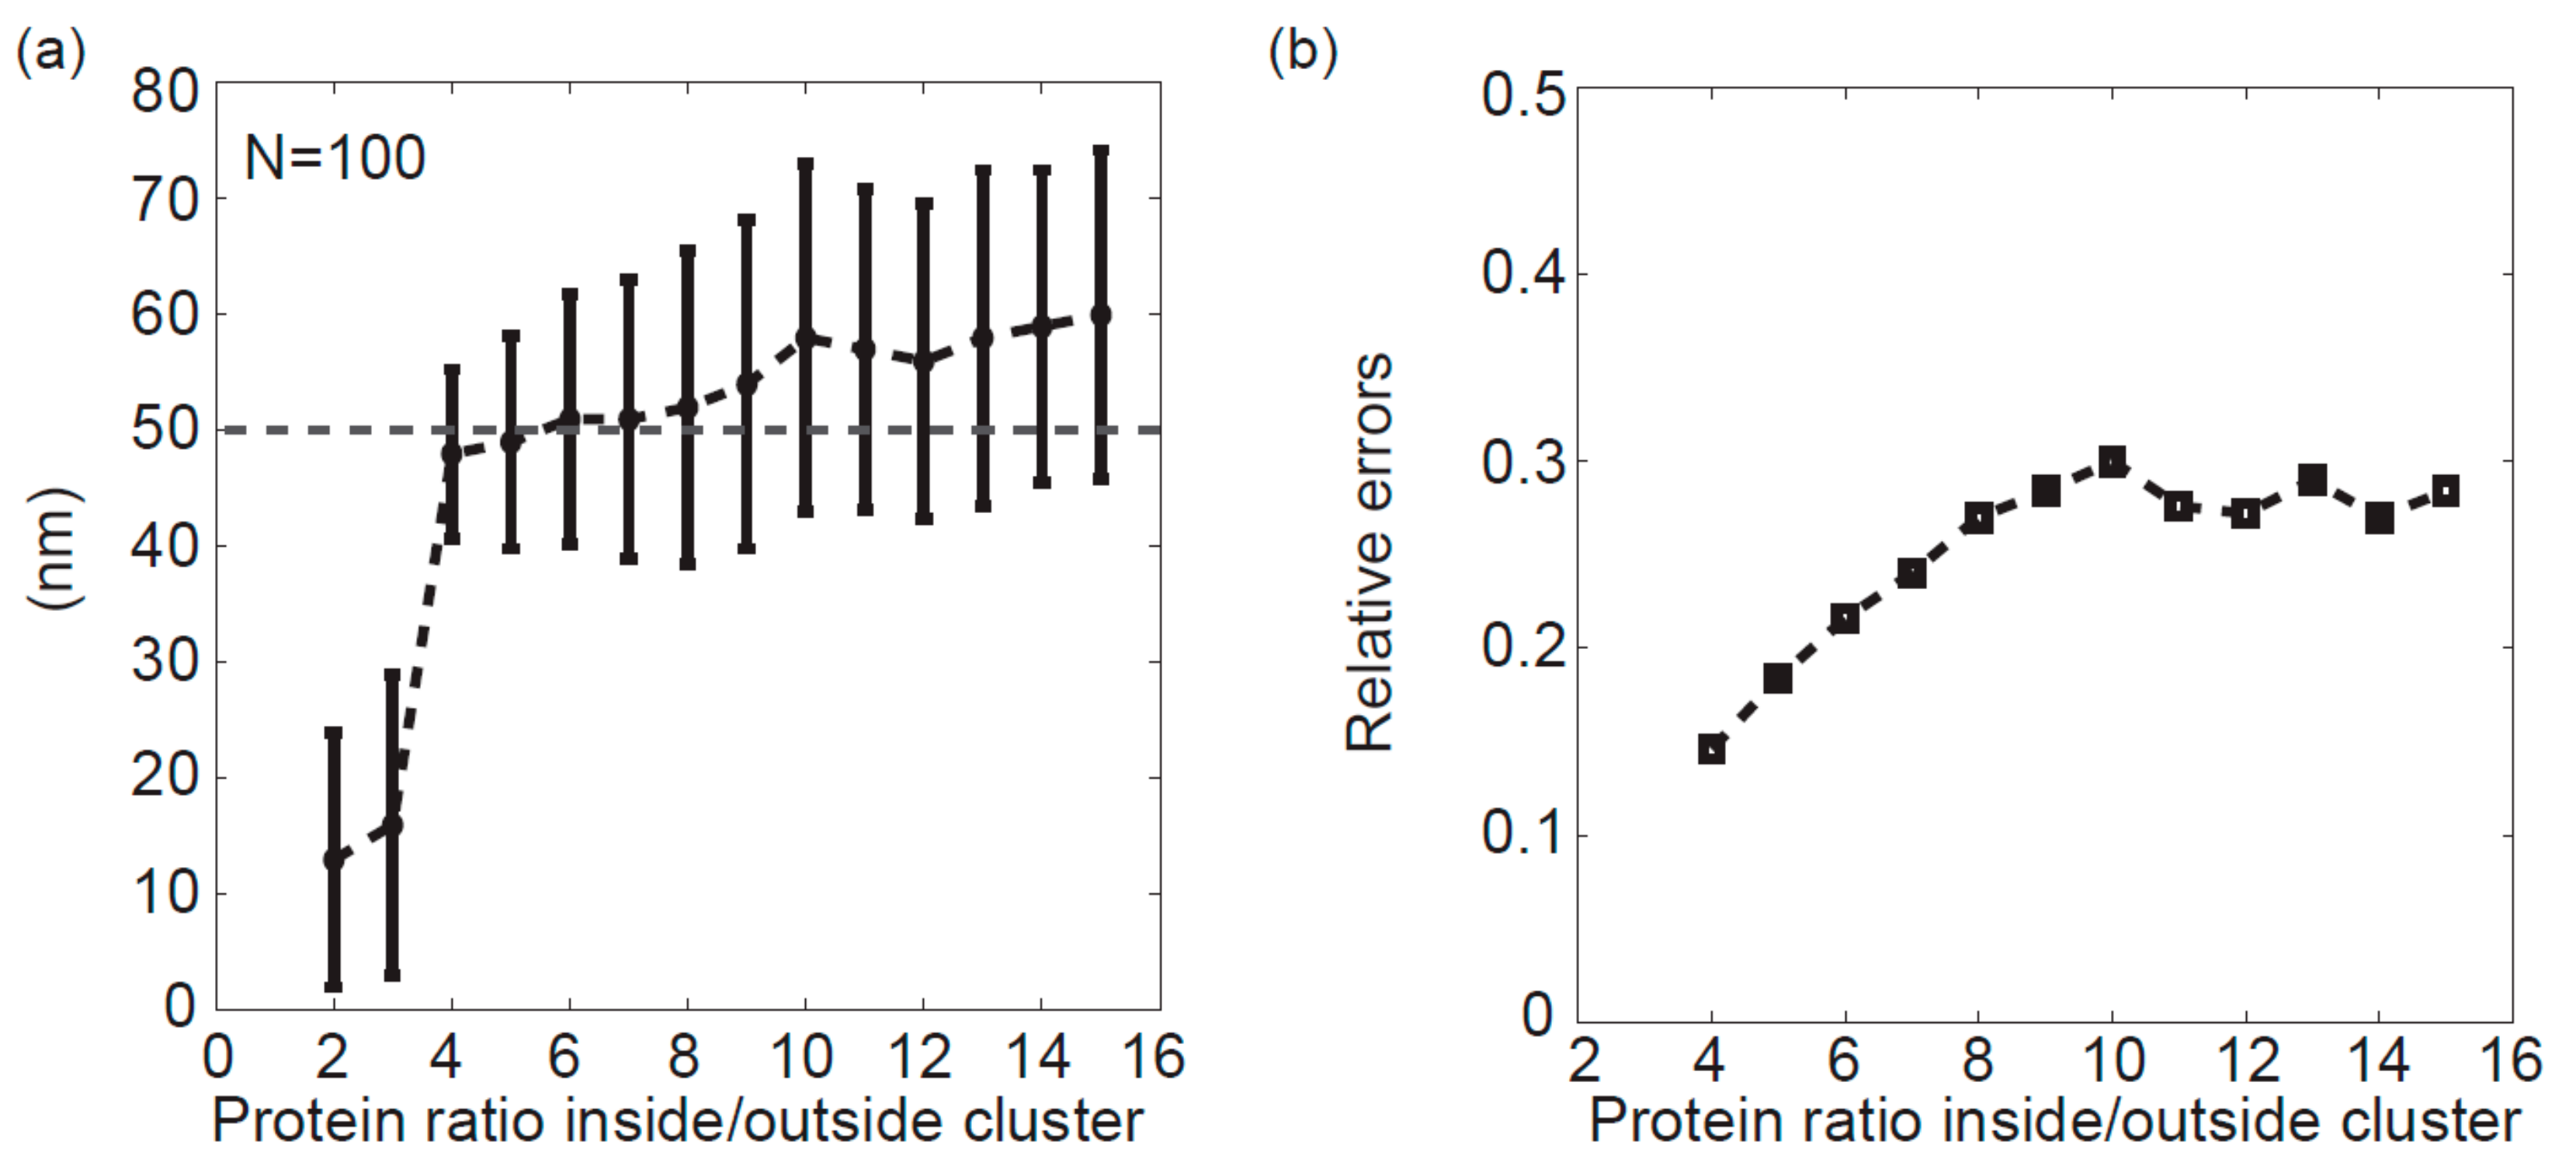
3.4. Effects of the Protein Density Ratio Inside/Outside Cluster on the Accuracy of Peak Analysis Method

Beyond cluster geometrical parameters, protein density ratio inside/outside cluster also proved to be an important factor influencing the accuracy of peak analysis [16]. To investigate the effects of protein density ratio on the estimation of cluster radius, we varied the protein ratio from 2 to 15 while holding cluster separation constant at 1000 nm and cluster radius constant at 50 nm. The selected Ripley’s H calculations for different ratios are shown in Figure S5. An interesting feature of Ripley’s H calculation is that the maximum of L ( r )     r increases as the protein density ratio increases. This phenomenon shows that high degree of protein aggregation inside a cluster is helpful to predict the radius of a cluster. To evaluate the effects statistically, we again counted 100 simulations for each case in Figure 4a. We found that a protein ratio threshold of four is essential to validate the cluster analysis by peak analysis. Under this value, it is difficult for the peak analysis method to identify the protein clustering. Moreover, as the protein ratio value varies from 5 to 11, the SD monotonically increases, yet after the value of 12, the peak analysis method predicts the cluster radius with nearly stable errors [29].

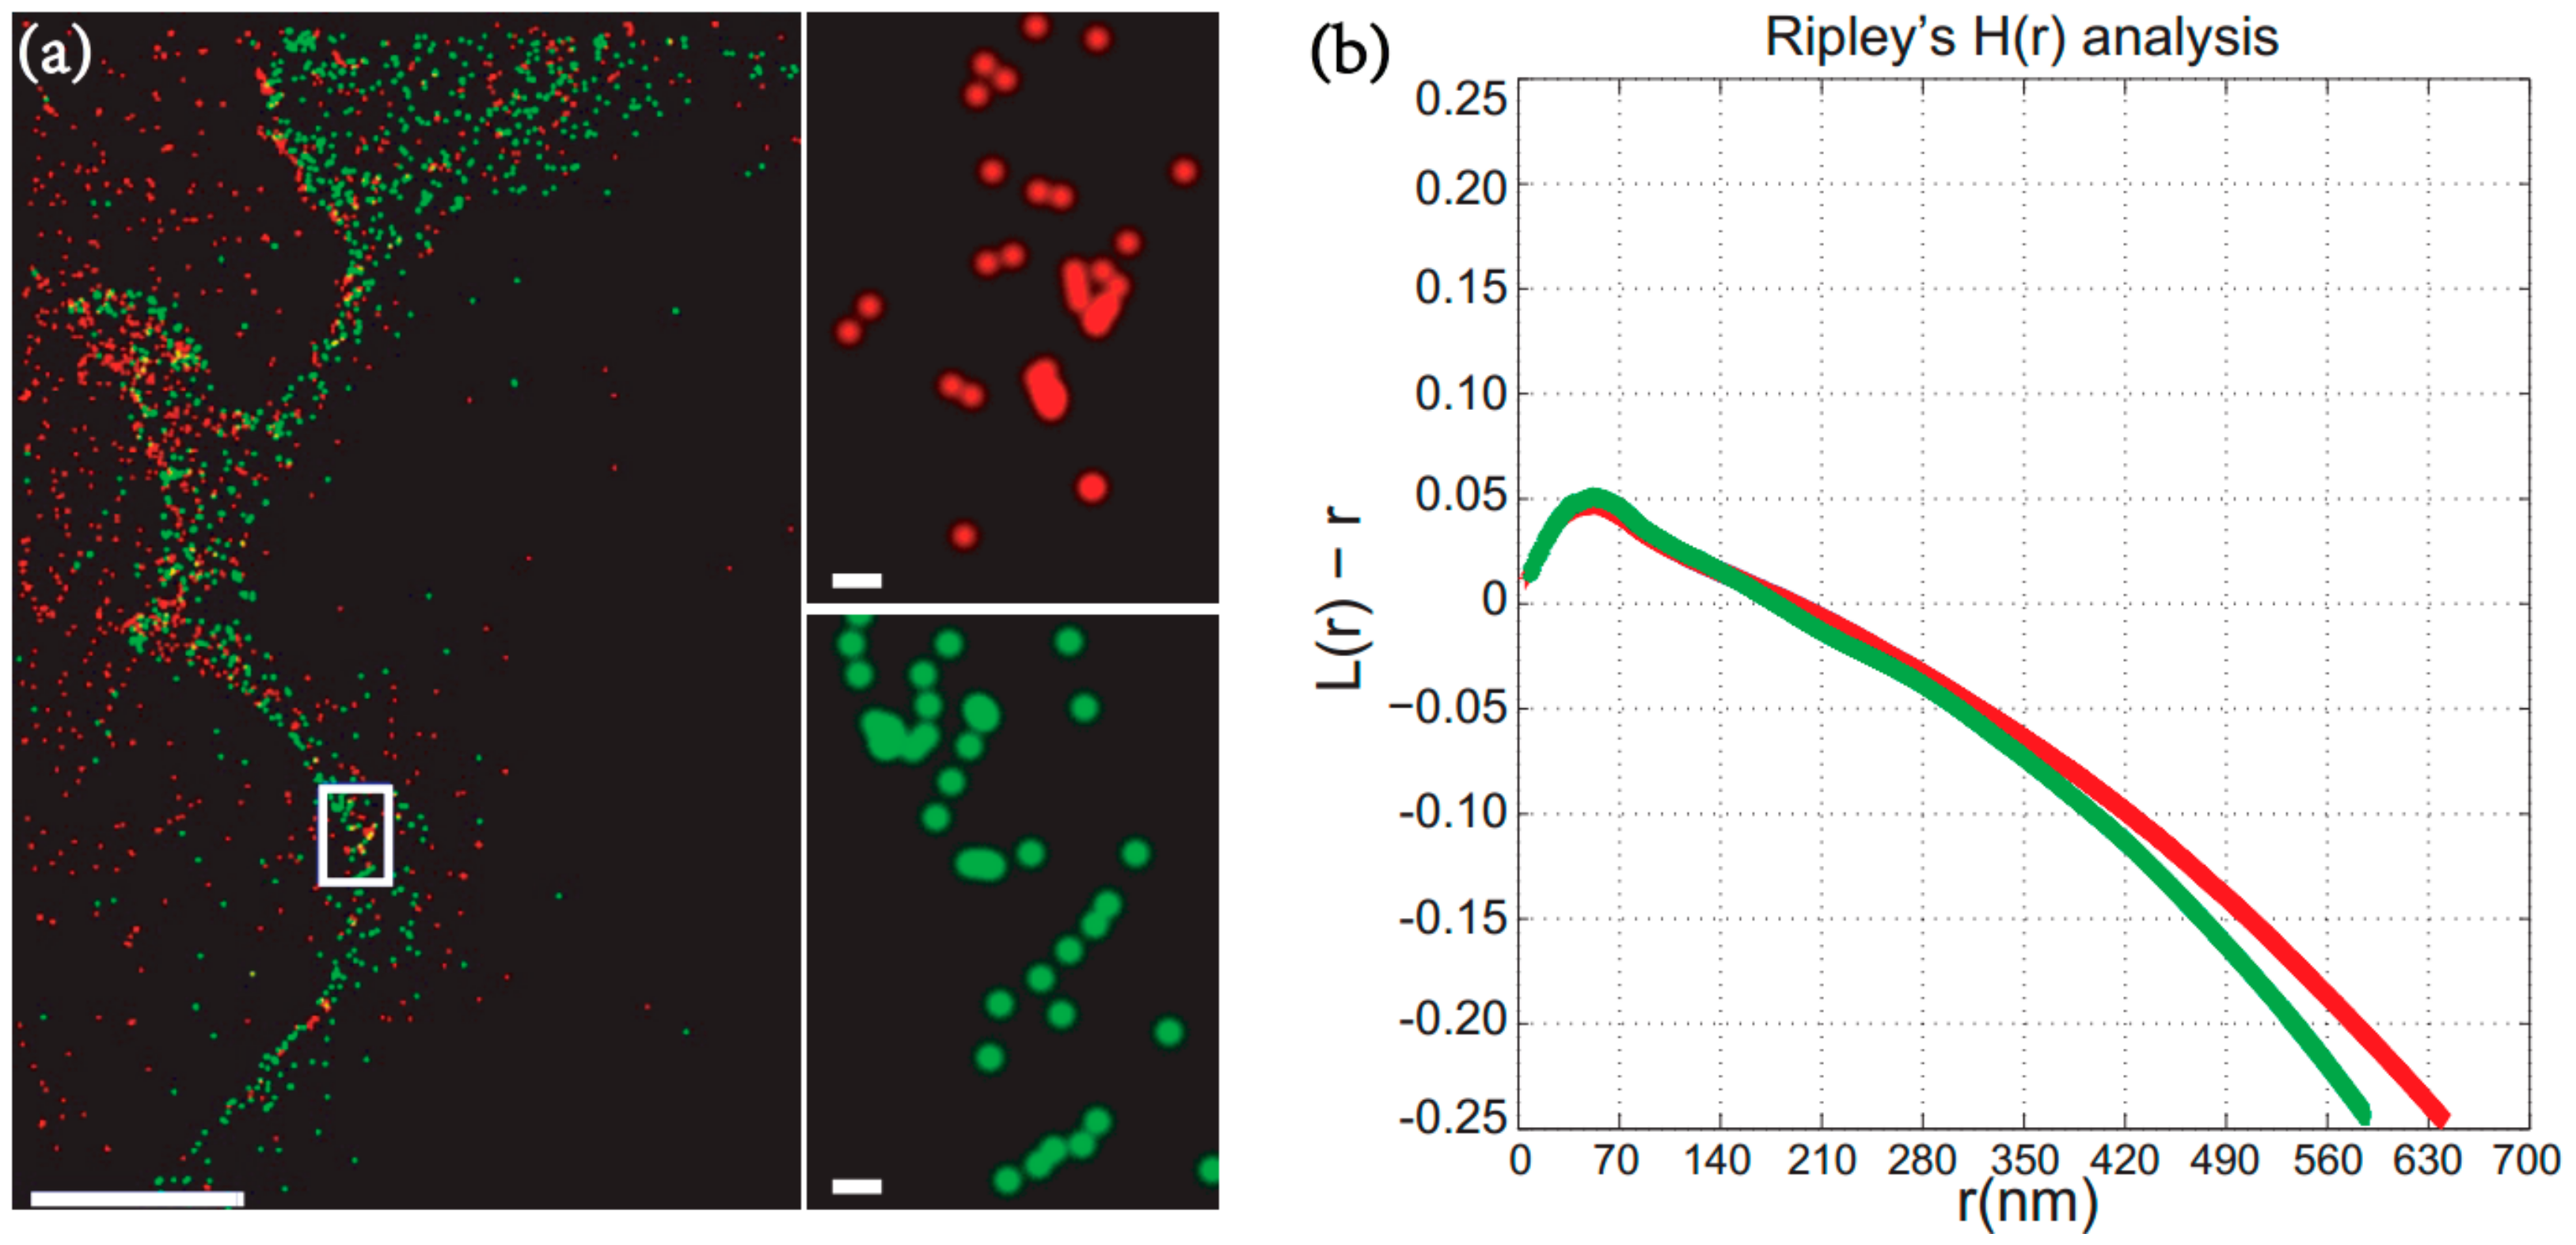
3.5. A Quantitative Analysis of EGFR (Epidermal Growth Factor Receptor) Cluster at COS7 Cell Surface

Using the uPAINT method (see in Materials and Methods), we measured the EGFR (epidermal growth factor receptor) cluster at COS7 cell surface. Superposed super-resolution images were then reconstructed based on 1000 successive images with a frame rate of 50 ms (Figure 5a). The expanded 1.5 × 2.5 µm2 area observed in different channels is displayed in Figure 5a, separately. The average Ripley’s H(r) plot for the two colored fluorescent detections is displayed in Figure 5b.
Together with ImageJ analysis and molecule localization detection, the cluster parameters were extracted in Table 1. The uniform results obtained by two different channels proved again the validation of the peak analysis method. In uPAINT experiments, two different fluorescent ligands are competitive in the buffer so that there is a tiny discrepancy between the red and green channels. However, the discrepancy of two different channels, such as radius/distance estimations and density predictions, are less than 20%. Together with the accuracy analysis, we show results in detail, for this COS7 measurement: (1) the cluster has a circularity of about 0.7, (2) the average radius is 50 ± 12 nm, (3) about 20% of molecule is found in these clusters, (4) the protein density inside the cluster is about 10× higher than that outside.

4. Conclusions

In this paper, we studied the accuracy of the peak analysis method by analyzing Ripley’s K function for protein cluster analysis in single molecule localization microscopy. The effects of different parameters of clusters, such as cluster separation, cluster size, and protein density inside/outside cluster, on the accuracy of peak analysis were evaluated. We have proposed that a small region of interest (ROI) area or high-density protein inside cluster is helpful to have an accurate estimation of the cluster radius. More importantly, although the predicted radius of clusters by peak analysis does not exactly correspond to the actual domain radius, by applying a random distribution of proteins, the cluster radius could be estimated within a factor of 1.3. Finally, we have imaged the EGFR distributions at COS7 cell membrane surfaces using the uPAINT method. Benefitting from the advantage of two simultaneous observations, we have not only experimentally employed peak analysis method to the cluster’s analysis, but also provided an accurate quantitative analysis of EGFR clusters. In conclusion, our results could improve the accuracy of cluster analysis using the peak analysis method and enhance understanding of cluster properties in the biological domain.

Supplementary Materials

Author Contributions

Y.R. and K.L. designed experiments; Y.R., P.Y., and F.L. performed simulation; Y.R., F.L., K.L. and D.L. analyzed data; Y.R., K.L. and Q.L. wrote the paper.

Funding

This work was funded by National Nature Science Foundation of China Grants NSFC [61805213] (Y.R.), NSFC [61605171] (K.L.) and the Fundamental Research Funds for the Provincial Universities of Zhejiang.

Acknowledgments

The authors thank Charankumar Godavarthi for language help.

Conflicts of Interest

The authors declare no conflicts of interest.

References

  1. Betzig, E.; Patterson, G.H.; Sougrat, R.; Lindwasser, O.W.; Olenych, S.; Bonifacino, J.S.; Davidson, M.W.; Lippincott-Schwartz, J.; Hess, H.F. Imaging intracellular fluorescent proteins at nanometer resolution. Science 2006, 313, 1642–1645. [Google Scholar] [CrossRef] [PubMed]
  2. Hess, S.T.; Gould, T.J.; Gunewardene, M.; Bewersdorf, J.; Mason, M.D. Ultrahigh Resolution Imaging of Biomolecules by Fluorescence Photoactivation Localization Microscopy; Humana Press, Springer: Totowa, NJ, USA, 2009; pp. 483–522. [Google Scholar]
  3. Rust, M.J.; Bates, M.; Zhuang, X. Sub-diffraction-limit imaging by stochastic optical reconstruction microscopy (STORM). Nat. Methods 2010, 3, 793. [Google Scholar] [CrossRef] [PubMed]
  4. Wang, Y.; Gao, J.; Guo, X.; Tong, T.; Shi, X.; Li, L.; Qi, M.; Wang, Y.; Cai, M.; Jiang, J.; et al. Regulation of EGFR nanocluster formation by ionic protein-lipid interaction. Cell Res. 2014, 24, 959–976. [Google Scholar] [CrossRef] [PubMed]
  5. Zhang, P.; Zhai, J.; Gao, X.Y.; Zhao, H.K.; Su, W.Y.; Zhao, L.N. Targeted peptide-Au cluster binds to epidermal growth factor receptor (EGFR) in both active and inactive states: A clue for cancer inhibition through dual pathways. Sci. Bull. 2018, 63, 349–355. [Google Scholar] [CrossRef]
  6. Park, K.; Han, S.; Shin, E.; Kim, H.J.; Kim, J.Y. EGFR gene and protein expression in breast cancers. Eur. J. Surg. Oncol. 2007, 33, 956–960. [Google Scholar] [CrossRef] [PubMed]
  7. Ramarao, M.K.; Cohen, J.B. Mechanism of nicotinic acetylcholine receptor cluster formation by rapsyn. Proc. Natl. Acad. Sci. USA 1998, 95, 4007–4012. [Google Scholar] [CrossRef] [PubMed] [Green Version]
  8. Wu, J.; Lukas, R.J. Naturally-expressed nicotinic acetylcholine receptor subtypes. Biochem. Pharm. 2011, 82, 800–807. [Google Scholar] [CrossRef] [PubMed] [Green Version]
  9. Hartman, N.C.; Groves, J.T. Signaling clusters in the cell membrane. Curr. Opin. Cell Biol. 2011, 23, 370–376. [Google Scholar] [CrossRef] [Green Version]
  10. Yang, S.H.; Armson, P.F.; Cha, J.; Phillips, W.D. Clustering of GABAA receptors by rapsyn/43kD protein in vitro. Mol. Cell. Neurosci. 1997, 8, 430–438. [Google Scholar] [CrossRef]
  11. Waard, M.D.; Pragnell, M.; Campbell, K.P. Ca2+ channel regulation by a conserved β subunit domain. Neuron 1994, 13, 495–503. [Google Scholar] [CrossRef]
  12. Kazachenko, V.N.; Geletiuk, V.I. Blocking of the counter-K+ fluxes through the single Ca2+-activated K+-channel. Cluster organization of ion channels. Dokl. Akad. Nauk SSSR 1987, 293, 990. [Google Scholar] [PubMed]
  13. Ripley, B.D. Modelling spatial patterns. J. R. Stat. Soc. Ser. B Stat. Methodol. 1977, 39, 172–212. [Google Scholar] [CrossRef]
  14. Owen, D.M.; Rentero, C.; Rossy, J.; Magenau, A.; Williamson, D.; Rodriguez, M.; Gaus, K. Palm imaging and cluster analysis of protein heterogeneity at the cell surface. J. Biophotonics 2010, 3, 446–454. [Google Scholar] [CrossRef] [PubMed]
  15. Shivanandan, A.; Unnikrishnan, J.; Radenovic, A. Accounting for limited detection efficiency and localization precision in cluster analysis in single molecule localization microscopy. PLoS ONE 2015, 10, e0118767. [Google Scholar] [CrossRef] [PubMed]
  16. Kiskowski, M.A.; Hancock, J.F.; Kenworthy, A.K. On the Use of Ripley’s K-Function and Its Derivatives to Analyze Domain Size. Biophys. J. 2009, 97, 1095–1103. [Google Scholar] [CrossRef] [PubMed]
  17. Haase, P. Spatial pattern analysis in ecology based on Ripley’s K-function: Introduction and methods of edge correction. J. Veg. Sci. 1995, 6, 575–582. [Google Scholar] [CrossRef]
  18. Perry, G.L.W. SpPack: Spatial point pattern analysis in Excel using Visual Basic for Applications (VBA). Environ. Model. Softw. 2004, 19, 559–569. [Google Scholar] [CrossRef]
  19. Malkusch, S.; Heilemann, M. Extracting quantitative information from single-molecule super-resolution imaging data with LAMA—LocAlization Microscopy Analyzer. Sci. Rep. 2016, 6, 34486. [Google Scholar] [CrossRef]
  20. Malkusch, S.; Muranyi, W.; Müller, B.; Kräusslich, H.-G.; Heilemann, M. Single-molecule coordinate-based analysis of the morphology of HIV-1 assembly sites with near-molecular spatial resolution. Histochem. Cell Biol. 2013, 139, 173–179. [Google Scholar] [CrossRef]
  21. Winckler, P.; Lartigue, L.; Giannone, G.; De Giorgi, F.; Ichas, F.; Sibarita, J.B.; Lounis, B.; Cognet, L. Identification and super-resolution imaging of ligand-activated receptor dimers in live cells. Sci. Rep. 2013, 3, 2387. [Google Scholar] [CrossRef]
  22. Giannone, G.; Hosy, E.; Levet, F.; Constals, A.; Schulze, K.; Sobolevsky, A.I.; Rosconi, M.P.; Gouaux, E.; Tampe, R.; Choquet, D.; et al. Dynamic Superresolution Imaging of Endogenous Proteins on Living Cells at Ultra-High Density. Biophys. J. 2010, 99, 1303–1310. [Google Scholar] [CrossRef] [PubMed] [Green Version]
  23. Henriques, R.; Lelek, M.; Fornasiero, E.F.; Valtorta, F.; Zimmer, C.; Mhlanga, M.M. QuickPALM: 3D real-time photoactivation nanoscopy image processing in ImageJ. Nat. Methods 2010, 7, 339–340. [Google Scholar] [CrossRef] [PubMed]
  24. Levet, F.; Hosy, E.; Kechkar, A.; Butler, C.; Beghin, A.; Choquet, D.; Sibarita, J.-B. SR-Tesseler: A method to segment and quantify localization-based super-resolution microscopy data. Nat. Methods 2015, 12, 1065. [Google Scholar] [CrossRef] [PubMed]
  25. Ester, M.; Kriegel, H.-P.; Sander, J.; Xu, X. A density-based algorithm for discovering clusters a density-based algorithm for discovering clusters in large spatial databases with noise. In Proceedings of the Second International Conference on Knowledge Discovery and Data Mining, Portland, OR, USA, 2–4 August 1996; pp. 226–231. [Google Scholar]
  26. Zessin, P.J.; Krüger, C.L.; Malkusch, S.; Endesfelder, U.; Heilemann, M. A hydrophilic gel matrix for single-molecule super-resolution microscopy. Opt. Nanoscopy 2013, 2, 4. [Google Scholar] [CrossRef] [Green Version]
  27. Endesfelder, U.; Malkusch, S.; Fricke, F.; Heilemann, M. A simple method to estimate the average localization precision of a single-molecule localization microscopy experiment. Histochem. Cell Biol. 2014, 141, 629–638. [Google Scholar] [CrossRef] [PubMed]
  28. De, D.C.; Schmidt, T.H.; Schloetel, J.G.; Lang, T. Packing Density of the Amyloid Precursor Protein in the Cell Membrane. Biophys. J. 2018, 114, 1128–1141. [Google Scholar]
  29. Amgad, M.; Itoh, A.; Tsui, M.M. Extending Ripley’s K-Function to Quantify Aggregation in 2-D Grayscale Images. PLoS ONE 2015, 10, e0144404. [Google Scholar] [CrossRef] [PubMed]
Figure 1. (a) Spatial point patterns with 10 clusters present, protein density for outside and inside clusters was D out   =   1000 molecules/μm2 and D in   =   10,000 molecules/μm2, respectively. (b) Disk-shaped cluster domains in (a); the radius of the cluster is R cluster set   =   50 nm . (c) Simulated image produced by Gaussian convolution of points in (a) using 30 nm resolution. (d) Peak analysis results, the peak value of H is r = 63 nm.
Applsci 09 03271 g001
Figure 2. (a) Peak analysis results for three modeled single molecule localization microscopy (SMLM) images containing 10 randomly distributed clusters of set radius R cluster set   =   50 nm with different average distances of cluster separations (100 nm, 400 nm and 800 nm). (b) The cluster radius predicted by peak analysis as a function of the cluster separation, the ±SD represents the standard derivation of peak analysis for 100 independent point distributions for each cluster separation.
Applsci 09 03271 g002
Figure 3. (a) Peak analysis results for nine modeled SMLM images containing 10 randomly distributed clusters with different cluster radius (20 nm to 100 nm). (b) The relative errors of cluster radius predicted by peak analysis versus the cluster radius.
Applsci 09 03271 g003
Figure 4. (a) Peak analysis results for 14 types of modeled SMLM images containing 10 randomly distributed clusters with different protein ratios inside/outside clusters (2 to 15). (b) The relative errors of cluster radius predicted by peak analysis versus the protein ratio.
Applsci 09 03271 g004
Figure 5. (a) The EGFR distributions at fibroblast-like cell lines derived from monkey kidney tissue - COS7 membrane surface observed by universal point accumulation imaging in nanoscale topography (uPAINT)method (left), scale bar 5 µm. Zoomed region (right), scale bar 200 nm. (b) Ripley’s H plot showing peak clustering scales at 50 nm for both colors and clustering above the level expected for a random distribution on the length scales up to ~180 nm.
Applsci 09 03271 g005
Table 1. A detailed analysis of two-color detections of EGFR clusters at COS7 cell membrane surface.
NclusterSarea (μm2)Scluster (μm2)Average Rcluster (nm)Average Separation of Cluster (μm)% of Molecule inside ClusterDin (Molecule/μm2)Dout (Molecule/μm2)
EGFR
(Panitumumab + Atto647)
33.750.0079
(0.21%)
49.8279 ± 3.16520.9462 ± 0.112820.79% ± 0.05%8410 ± 208836 ± 16
EGFR
(Panitumumab + Atto532)
43.750.0082
(0.22%)
50.7771 ± 3.26571.1321 ± 0.095218.11% ± 0.04%8172 ± 172971 ± 27

