1. Introduction
For gilding, that is the decoration of ancient works of art (wooden panels, wall paintings, metallic objects), pure gold, gold alloys (with copper or silver) as well as composite laminae of gold and silver (the so called “oro di metà”) were used [
1,
2,
3,
4,
5,
6]. In some cases, the gold leaves were laid on a thicker tin lamina [
1,
2]. Gold leaves were prepared by hammering gold coins until extremely thin foils (typical thickness: 1 to 5 microns) were obtained [
7]. The most commonly used methods for applying gold decorations on wall paintings were the “a guazzo” (water gilding) or the “a missione” (mordant gilding) techniques. In the “a guazzo” technique, the gold or composite metallic leaves were stuck to the surface by means of a protein-based binder mixed with “bole”, a mixture of clays, iron oxides and hydroxides. In the “a missione” technique, siccative oils (typically linseed oil), mixed with lead compounds as drying agents, were used to glue the metal foils [
1,
4]. The chemical characterization of the gilding layers (pure gold, alloys or composite laminae) and of the adhesives used to glue the metallic leaves are essential in order to get information about the materials and techniques employed by the artist. The chemical investigation of the gilding decorations, in walls as well as in wooden panel paintings, is challenging since both the inorganic and the organic components must be analyzed. For this purpose, a combination of several microscopy and spectroscopy techniques is needed. In the present work, we investigated by optical microscopy (OM), field emission scanning electron microscopy (FESEM) coupled with energy dispersive X-ray analysis (EDX), micro X-ray diffraction (XRD) and time of flight secondary ion mass spectrometry (ToF-SIMS) microsamples of the gilding decorations from the wall painting of the beginning of the 14th century, “La Maestà” by Simone Martini (
Figure 1). ToF-SIMS is a particularly suitable tool to investigate samples from works of art [
8,
9,
10,
11]. This mass spectrometry, surface sensitive technique allows one to analyze simultaneously, on the same sample, both the inorganic and organic components. Moreover, images of the distribution of secondary ions over the analyzed surface (chemical maps) can be obtained. The aim of this study was to determine the composition of the gilding leaves and of the materials used to glue the metallic laminae to the wall painting and the preparation layer over which the gilding leaves were laid. The combined use of these techniques permitted us to determine the stratigraphy and composition of the various layers of the microsamples. In particular, the high sensitivity and lateral resolution of ToF-SIMS were exploited to detect metal impurities in the gilding decorations. The detection of trace elements offers the possibility to identify the provenance of materials and the techniques used to make a work of art.
2. Materials and Methods
2.1. OM Observations
Thin sections of microfragments cut perpendicularly to the surface were observed with a polarized light microscope (LEICA DMRXP) equipped with HP PL Fluotar objective lenses, a digital reflex camera and relative software for image acquisition, transmitted and reflected light sources.
2.2. FESEM-EDX Measurements
A field emission scanning electron microscope (FESEM) SIGMA VP Zeiss, Germany equipped with a system for EDX spectroscopy (Oxford Instruments, INCA x-sight 7378, Abington, UK) was used. Images were recorded by collecting backscattered electrons. EDX spectra were measured with an energy of the primary electron beam of 20 keV. Samples were coated with graphite (Balt-tec SCD 050 sputter-coater, Scotia, NY, USA) in order to prevent sample charging.
2.3. Micro XRD Measurements
A powder X-ray diffractometer with Bragg–Brentano geometry (Philips X’Pert PRO PW 3040/60 with X’Celerator PW 3015 detector, Almelo, The Netherlands) equipped with a multiple purpose sample stage (MPSS) for massive specimens and mono-capillary collimator tube was used. This instrument allows investigating very small samples and/or elliptical areas on thin sections with minor axis length of 100 µm. Diffractograms were collected with the Cu Kα radiation, in a 3–70° 2θ range and a step of 0.017°.
2.4. ToF-SIMS Measurements
A TRIFT III instrument (Physical Electronics, Chanhassen, MN, USA) with a gold liquid metal ion gun as the primary ion source was used for the ToF-SIMS measurements. The primary ion beam energy was 22 keV and a typical ion current of 600 pA, respectively. ToF-SIMS spectra were collected selecting Au+ primary ions. The spectra were measured in bounced mode with a typical mass resolution, m/Δm, around 2000. The spectra were recorded within static conditions keeping the dose of primary ions below 1012 ions/cm2. An electron gun was used to neutralize the positive charging of the samples. The m/z scale was calibrated using the mass peaks of CH3+, Na+, C2H3+ and C3H5+.
2.5. Sampling Points and Sample Preparation
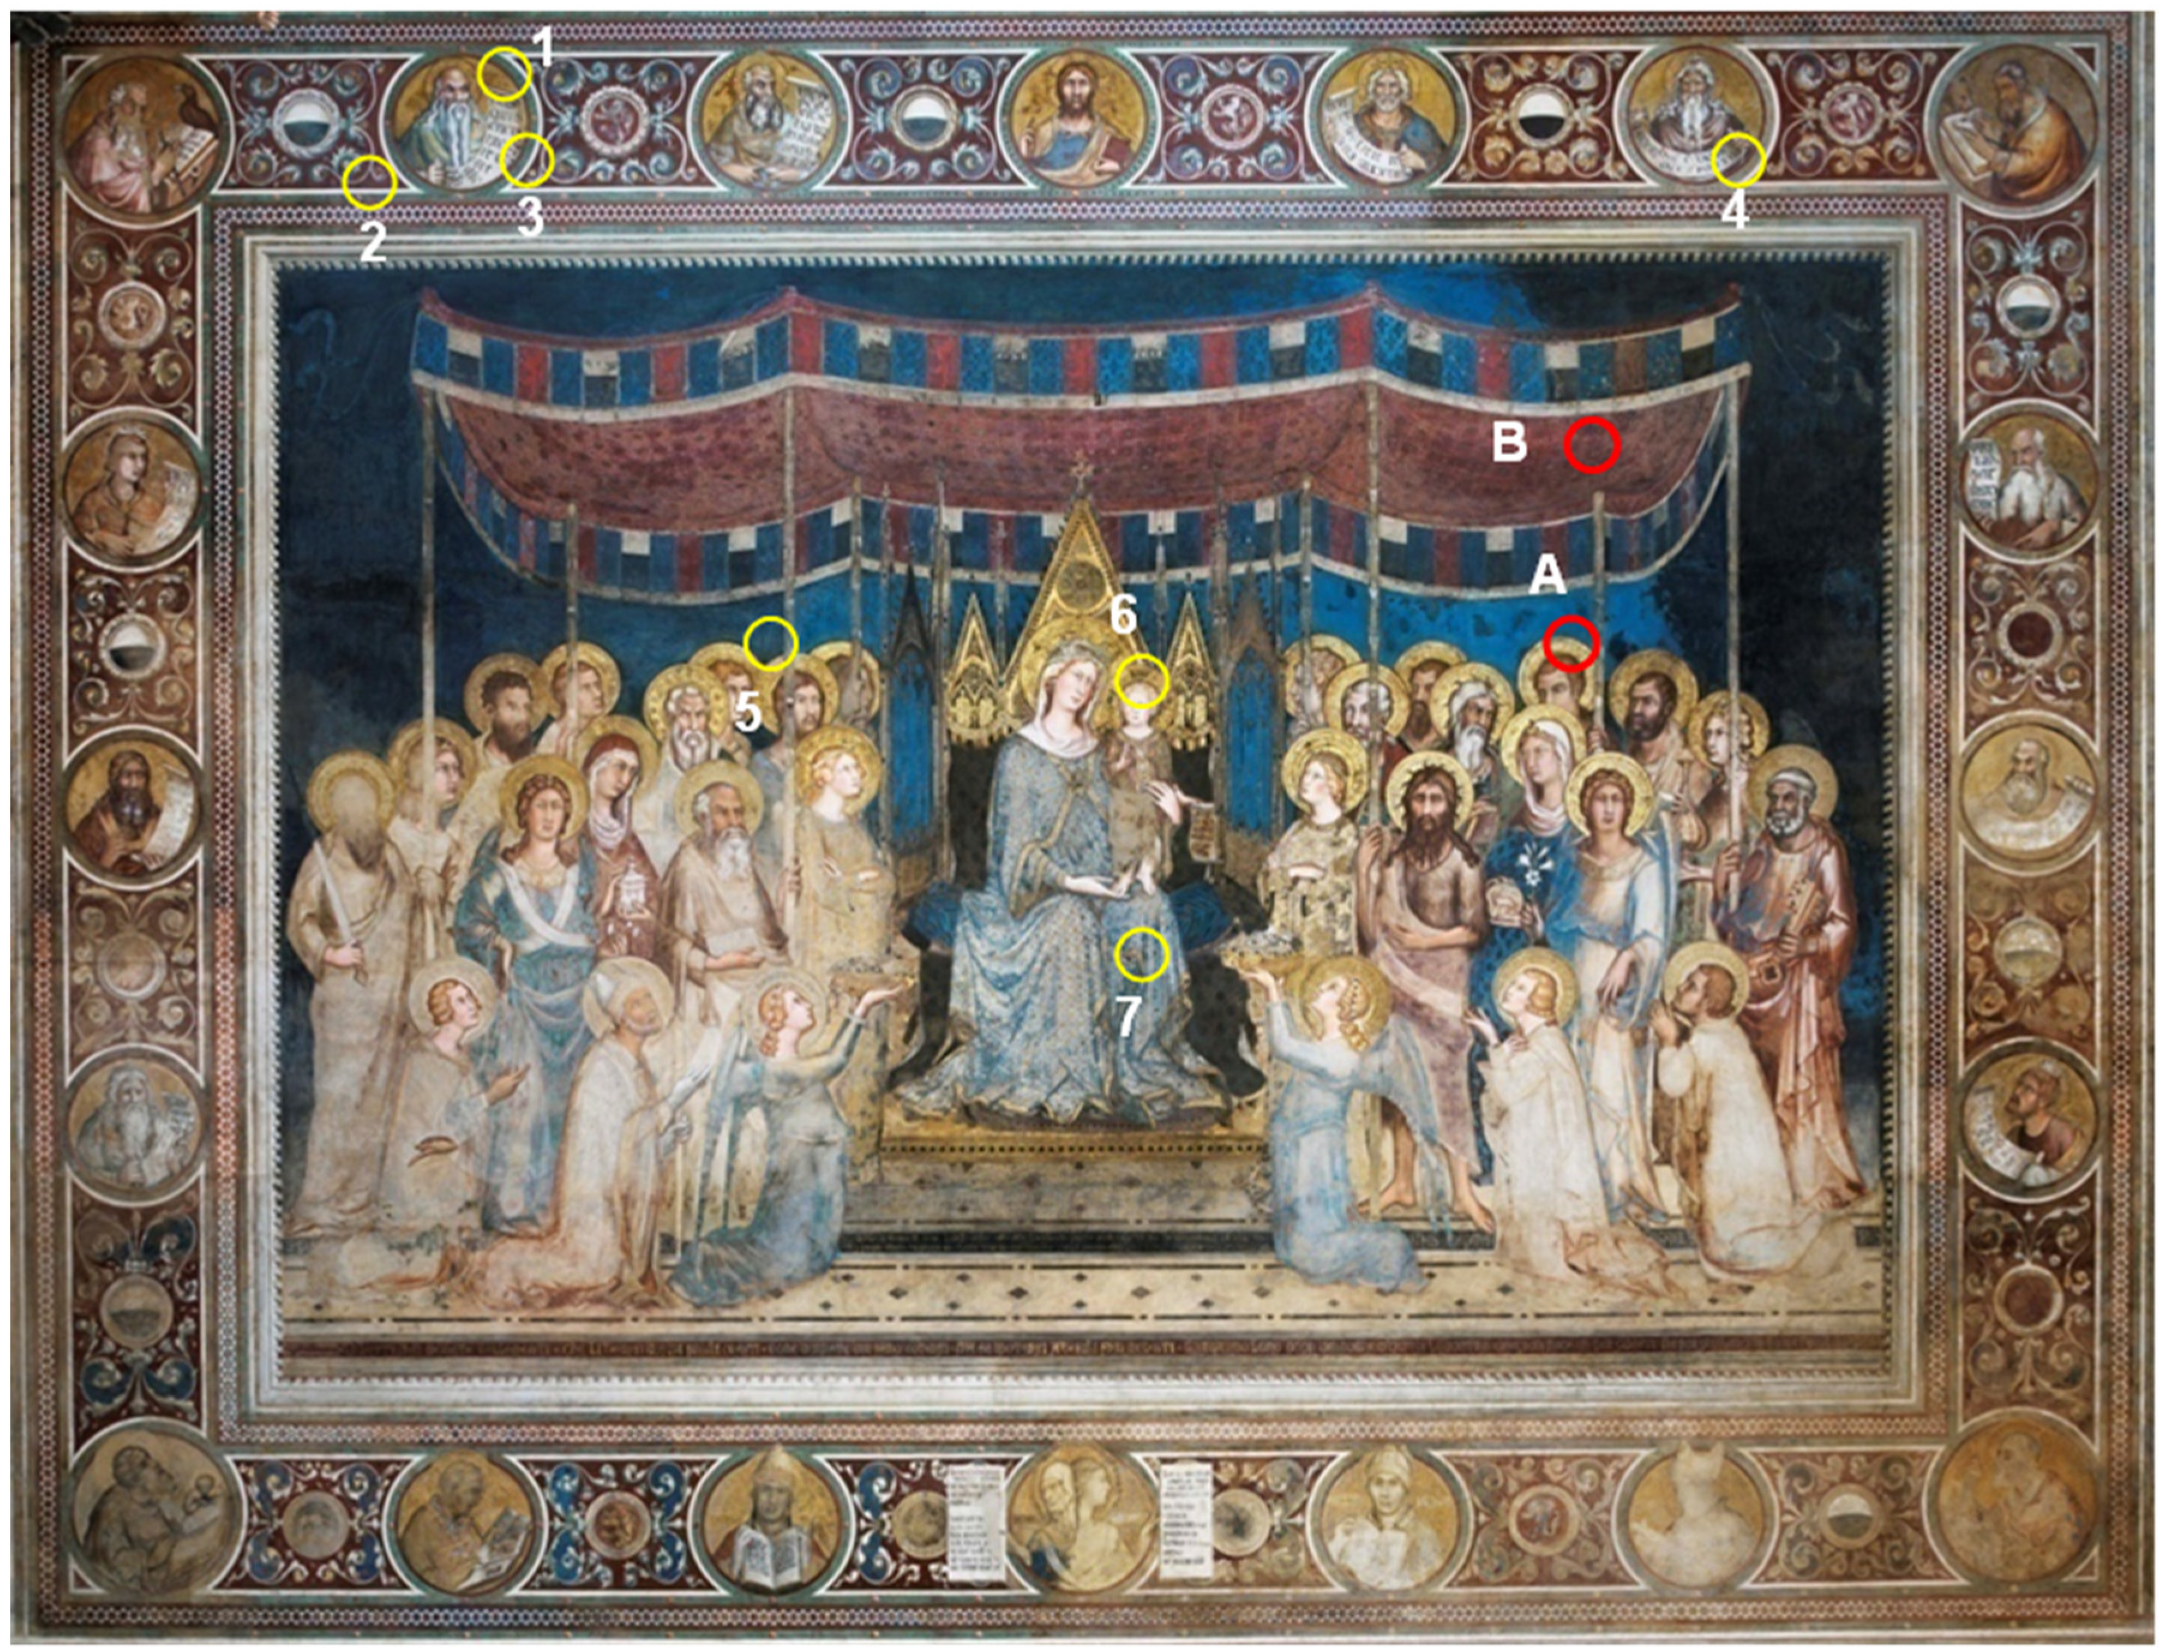
“La Maestà” by Simone Martini is a wall painting, covering an area of ca. 110 m
2, on the northern east wall of the “Sala del Mappamondo” in the city hall in Siena. This artwork, completed in 1315, was subsequently modified by Simone Martini in 1321. The “Maestà”, the masterpiece of Simone Martini, has been studied by art historians ever since for the style, chronology, commissioning and political meanings [
12,
13].
Samples were collected in the points marked by circles in
Figure 1 during the cleaning campaign of the wall painting in 2017, in agreement with the superintendency and the restorer. The results shown here are for the samples of type A and B, taken from the regions marked with red circles in
Figure 1. The samples are representative of two types of gilding: gold leaf on the preparation layer (sample A) and gold leaf laid on a thicker tin lamina (sample B). The gold leaf directly applied on the preparation layer was used for the finer details, like the halos of saints, whereas decorations with larger thickness, like the canopy on the top right part of the painting, were made by using gold leaf on a tin lamina.
The samples embedded in epoxy resin (Epofix) were cut perpendicularly to the sequence of layers to obtain two specular parts of each sample. One part was glued on a glass slide and polished until a thickness of 30 µm was reached for the OM observation as thin section. The OM of thin sections allows to get information about the thickness and colours of the layers as well as the mineralogical characterization of the phases presents [
14]. The other part of the sample was polished and cut by means of a microtome (Ultratome, LKB, Bromma, Sweden) to obtain as much as possible flat and free of contamination surfaces for the ToF-SIMS measurements [
15].
3. Results
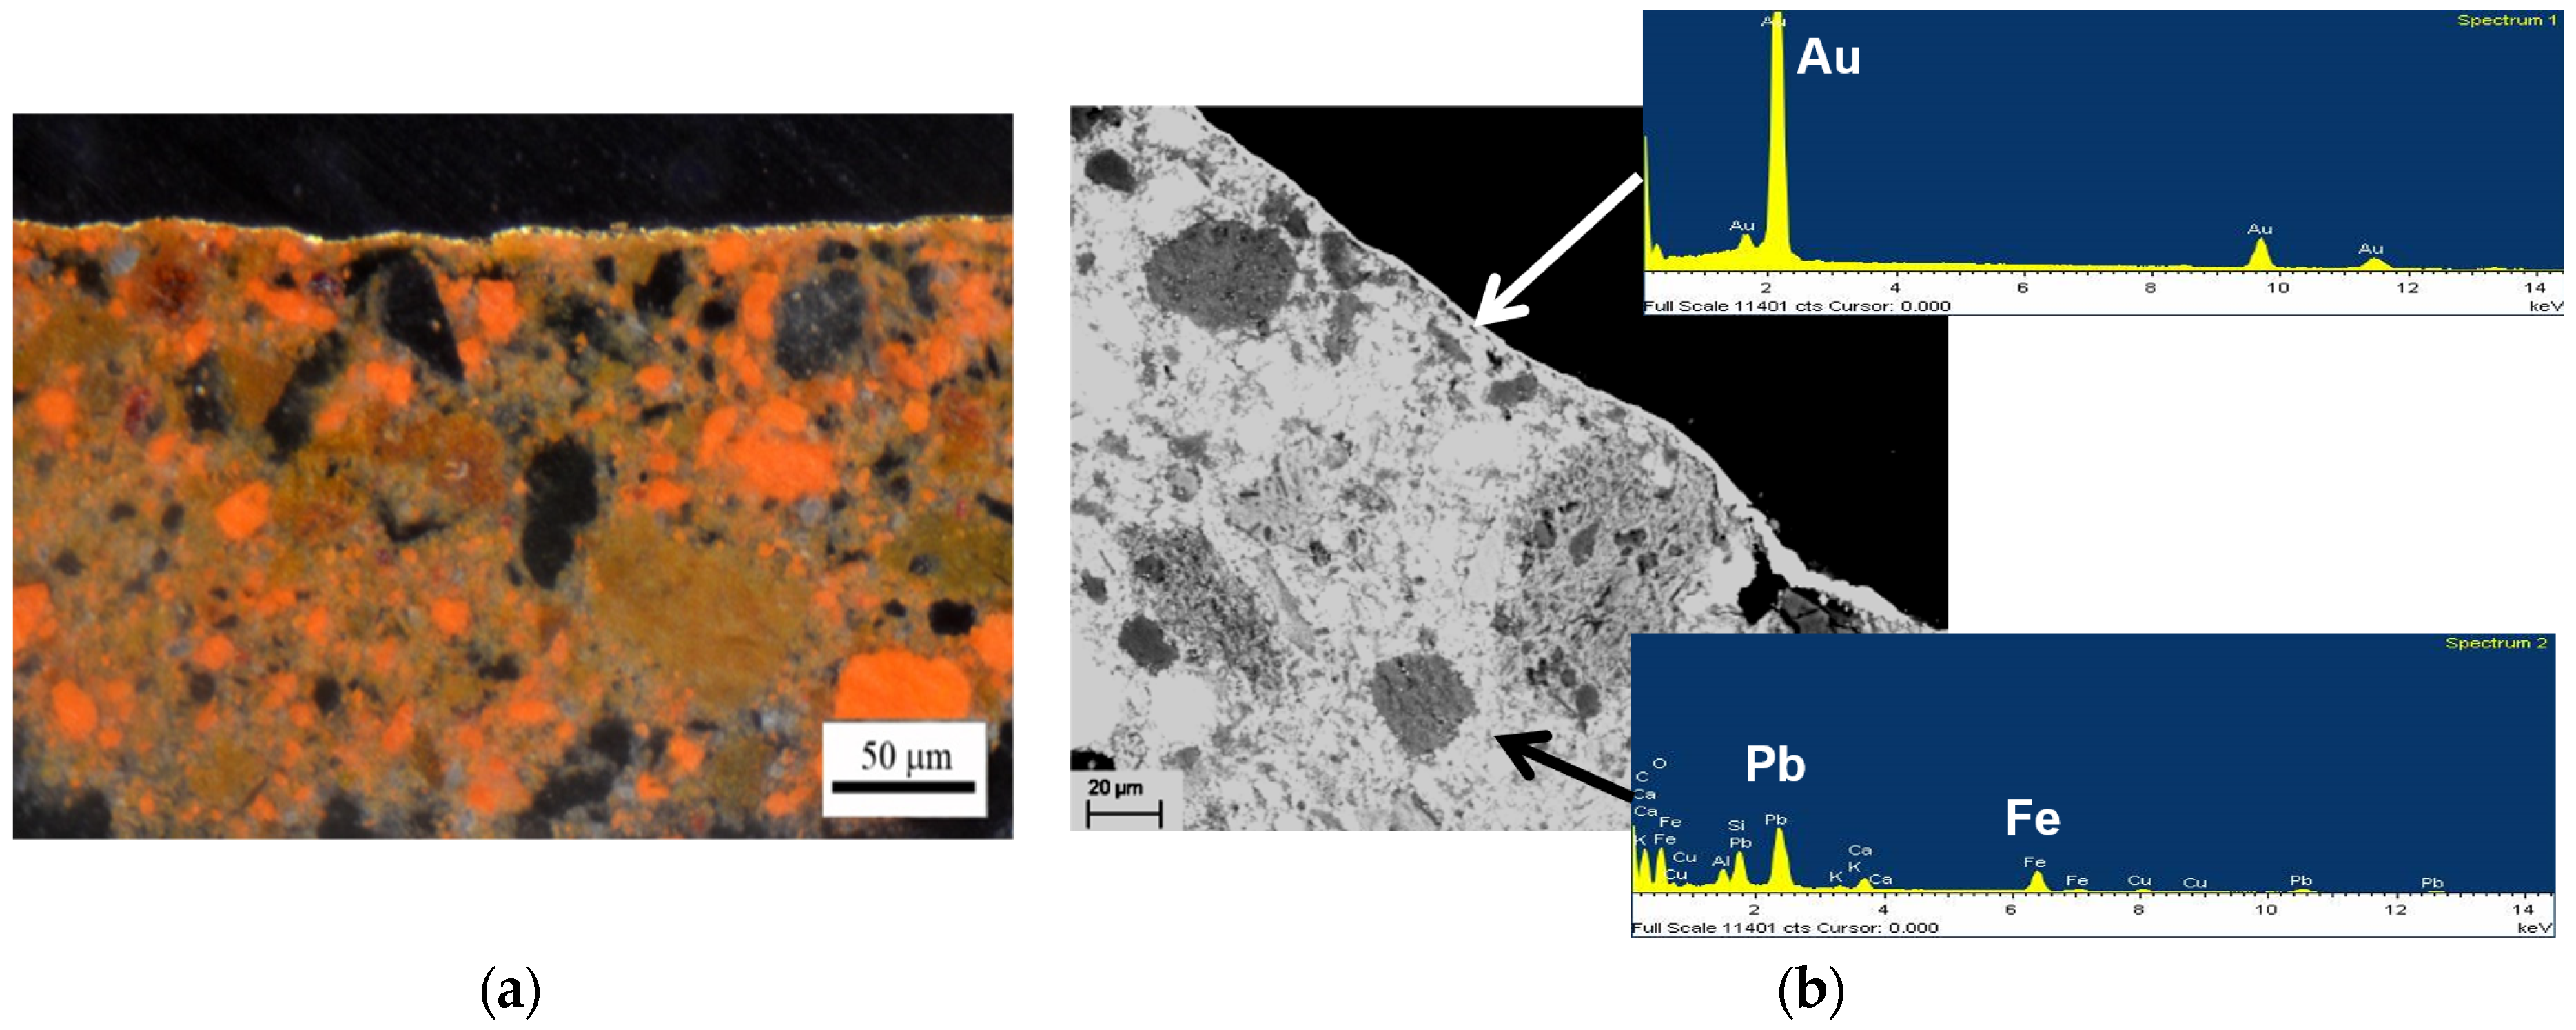
The OM and FESEM images of the sample A are shown in
Figure 2a. The OM image of the thin section shows a preparation layer with an average thickness of ca. 150 µm. The grains in this layer were identified as minium (Pb
3O
4) and yellow ochres on the basis of their appearance with transmitted polarized light. The results of the OM observations were confirmed by the EDX results. On top of this layer, which works as the “bole” layer in the typical “a guazzo” technique, the gold lamina (with an average thickness below 5 µm) can been seen. This lamina is visible as a bright strip at one edge of the sample in the FESEM image (
Figure 2b). The thickness of the metallic lamina ranges from 2 to 5 µm. For other samples of this type (i.e., a gold leaf on a preparation layer), FESEM images show that only some residues of the gold leaf are present. The signals of other metals, such as copper or silver, were not detectable above the noise level in the EDX spectra measured on the gold leaf (
Figure 2b). Hence, the EDX analysis rules out that the gilding leaf is a copper-gold or copper-silver alloy or a composite lamina of gold and silver foils as recently found in other gilding decorations [
6]. The composition of the preparation layer as determined by EDX (
Table 1) is similar to that of the preparation layer for the metal decorations in the wall paintings by Giotto in the Scrovegni Chapel [
2].
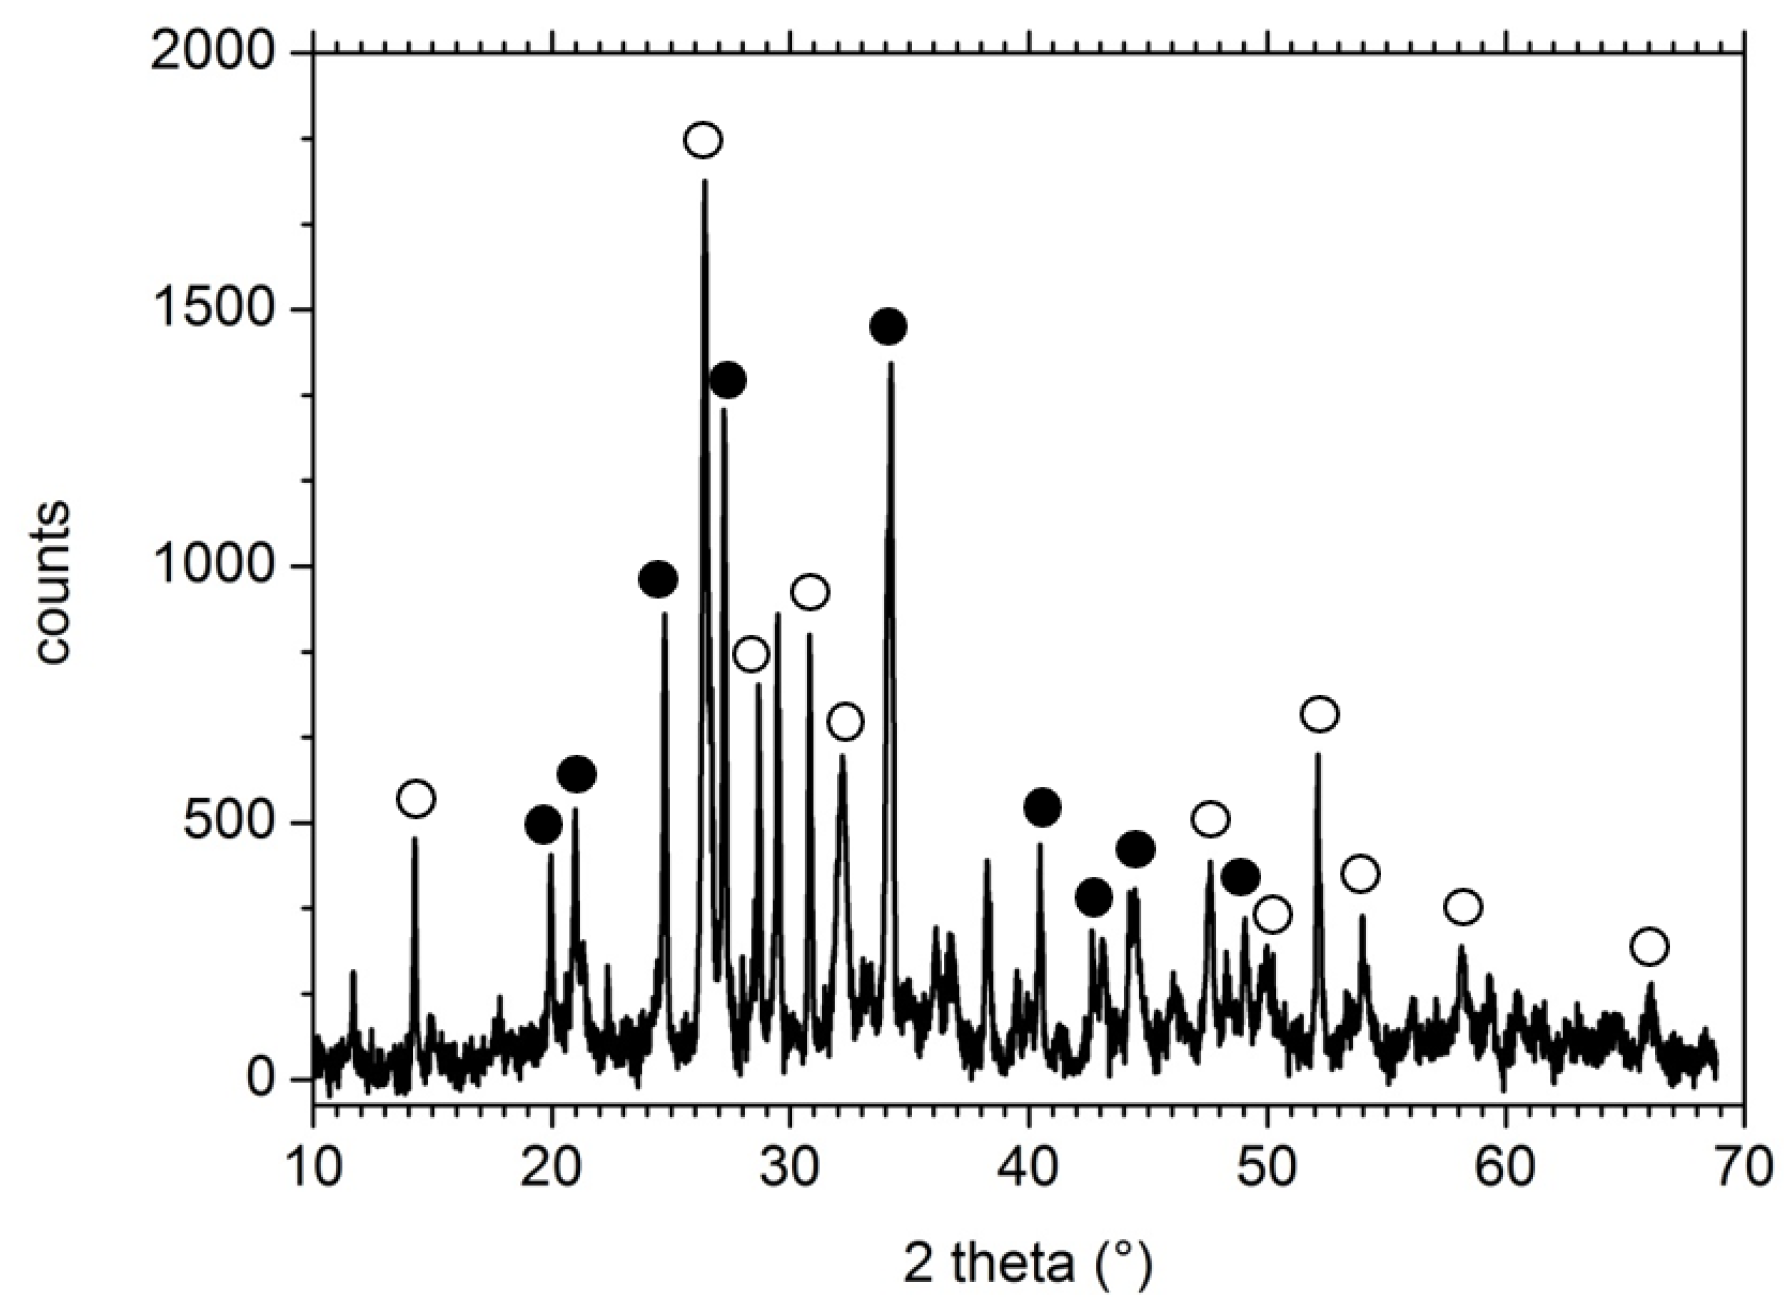
In the preparation layer relatively high concentrations of iron and lead were found. These results are consistent with the micro XRD measurements which show the presence of minium (Pb
3O
4) and white lead (2 PbCO
3 Pb(OH)
2) (
Figure 3). The peaks of yellow ochres are too weak to be detectable in the diffractogram. Copper, which was detected by EDX, is probably present as copper resin, a drying agent used in the “a missione” technique [
1].
The whole ToF-SIMS spectrum of sample A (not shown), measured on a 500 × 500 µm
2 area, including both the gold leaf and the preparation layer, exhibits peaks of hydrocarbon fragments having
m/
z values close to those of the elements detected by EDX. For instance, C
2H
3+ (
m/
z 27.02) and Al
+ (
m/
z 26.98), C
3H
3+ (
m/
z 39.02) and K
+ (
m/
z 38.96), C
3H
4+ (
m/
z 40.03) and Ca
+ (
m/
z 39.96). These peaks of hydrocarbon ion fragments are mainly due to surface contamination of the sample during cutting and handling. ToF-SIMS is a surface sensitive technique, thus even relatively small amounts of impurities in the outermost region of a sample are detectable. The peaks of the isotopes of Cu
+ (
m/
z 62.9 and 64.9) and of Pb
+ (
m/
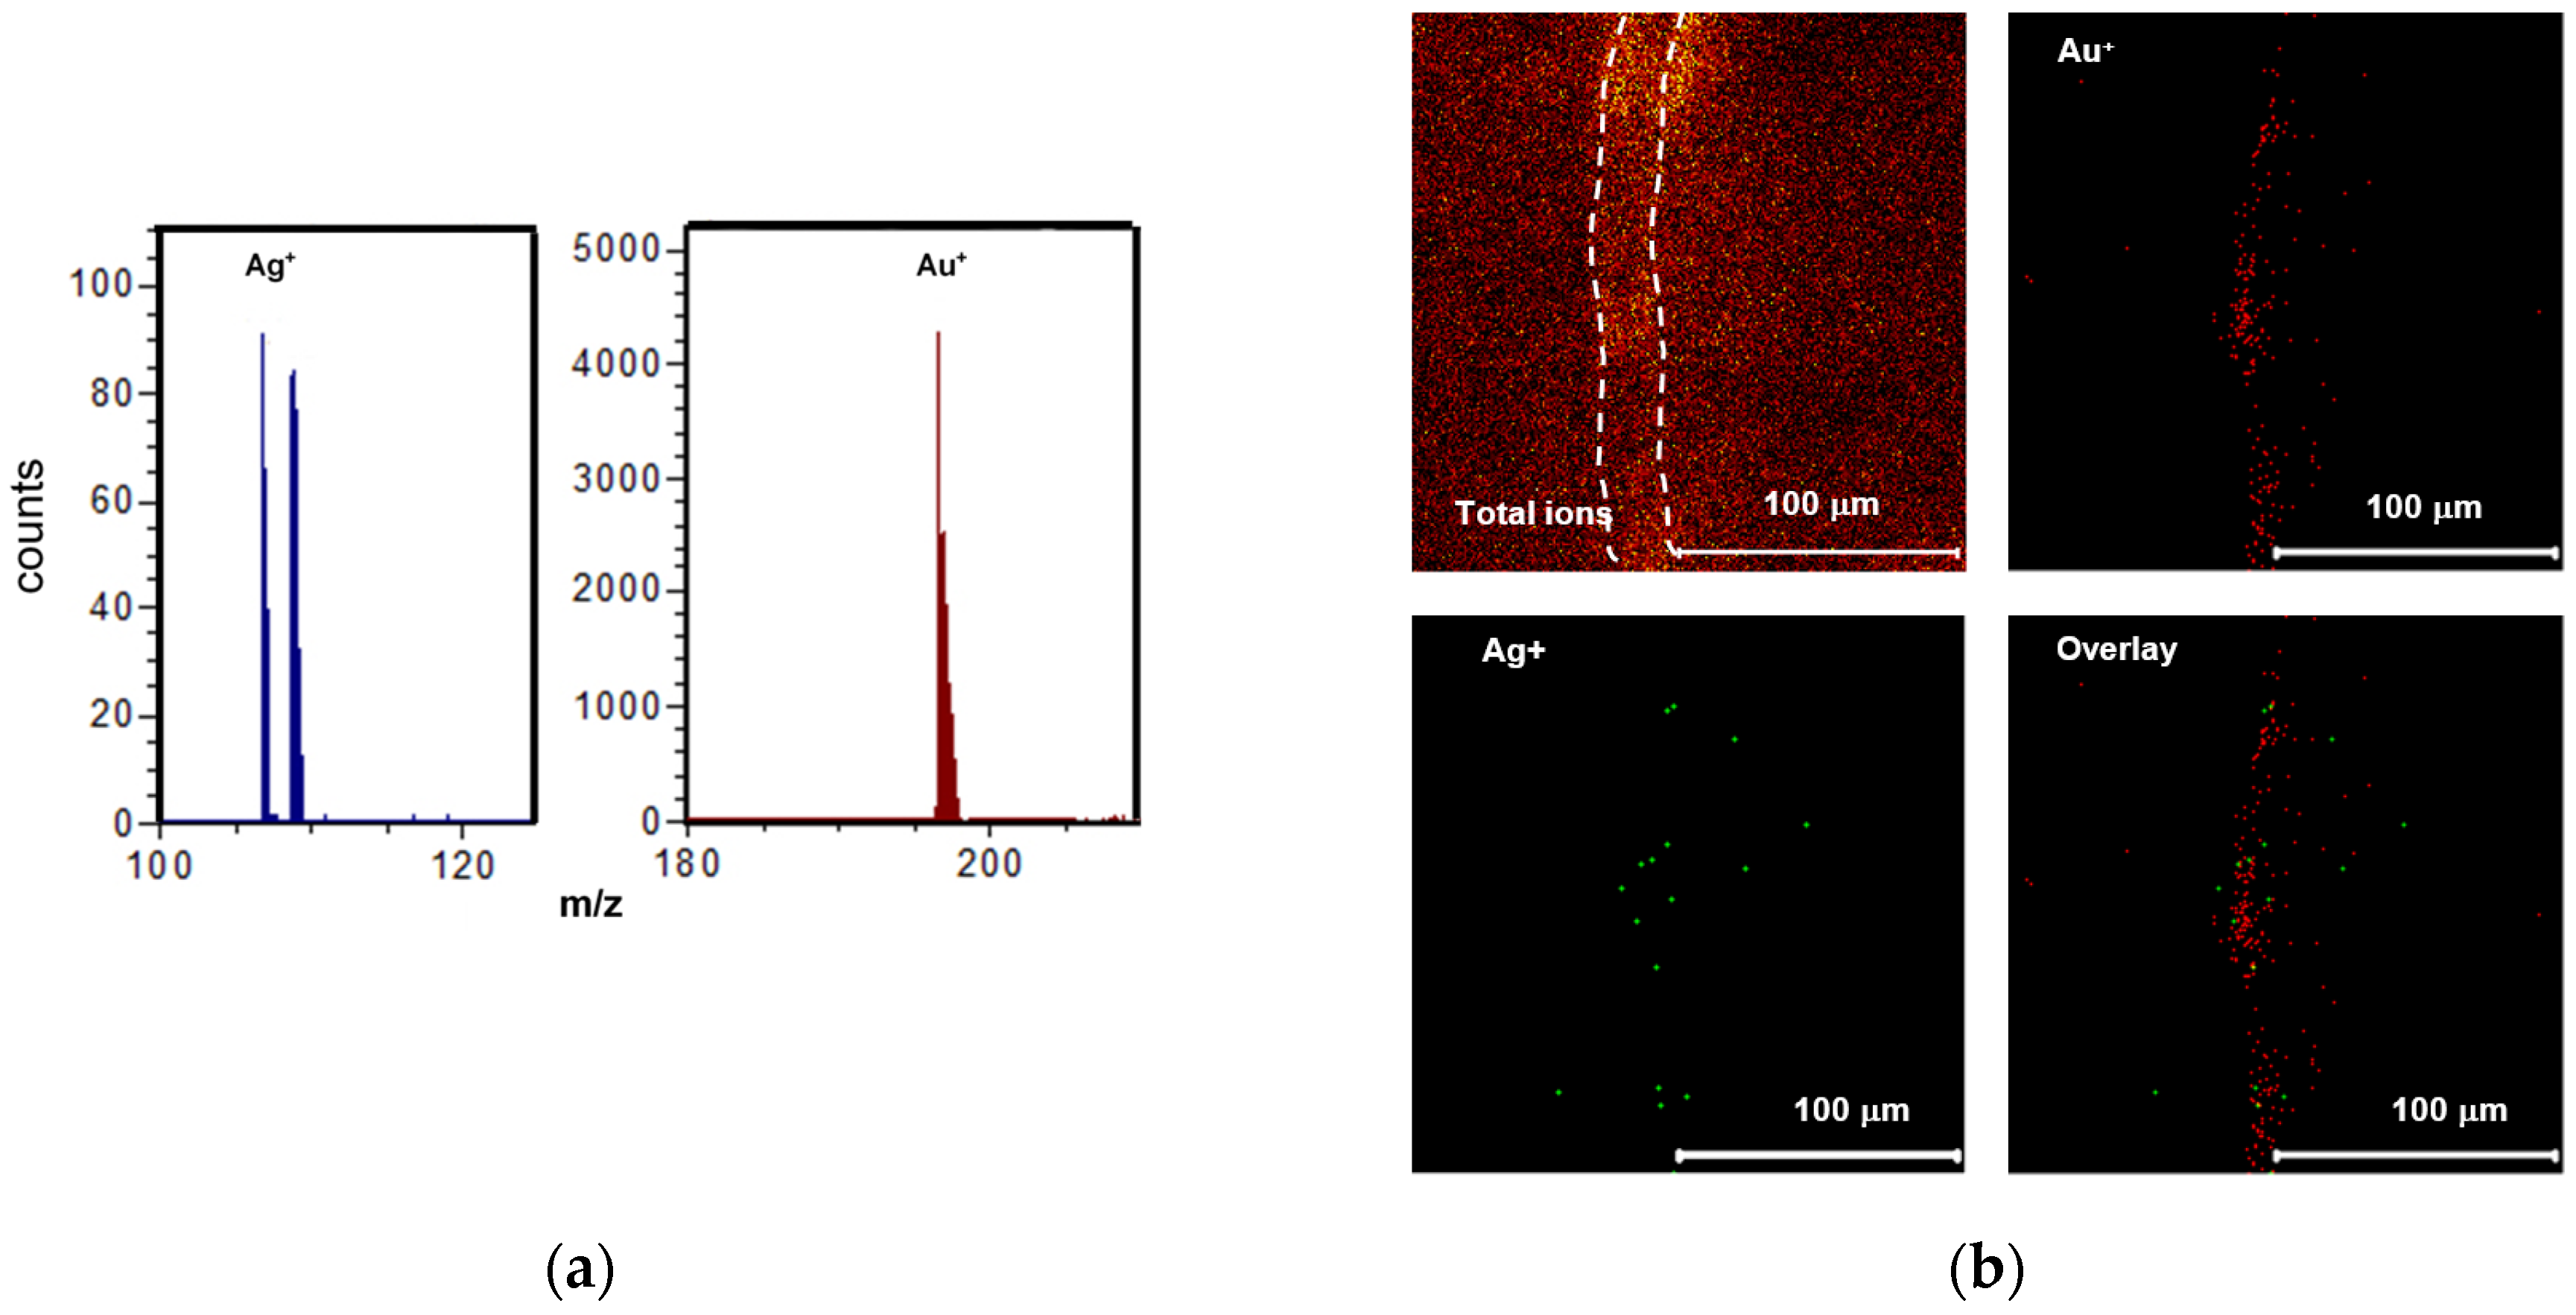
z 206.0, 207.0 and 298.0) are observed, in agreement with the EDX results. The peak of Au
+ (
m/
z 196.9) is also detectable in the spectra (
Figure 4a). The location of the gold lamina over the sample cross section was found by acquiring maps of the lateral distribution of the gold signal. The peaks of Ag (
m/
z 106.9 and 108.9) were observed when the analyzed area was reduced and localized over the gold lamina (
Figure 4a). Despite the weak signal of silver, the overlay of the Au and Ag maps indicates that the silver is localized mostly within the zone of the gold lamina (
Figure 4b). It is not possible to quantify the concentration of silver in the gold leaf. However, an upper limit of ca. 1 at% to the silver concentration is a reasonable estimation since the signal of silver was not detectable by EDX [
16].
Hence, ToF-SIMS measurements confirm that the gilding layer consists essentially of pure gold with traces of silver. Golden leaves were typically obtained by hammering coins which were made of pure gold [
1,
7] and the use of leaves of pure gold is not surprising taking into account the importance and the wealth commissioning of this wall painting.
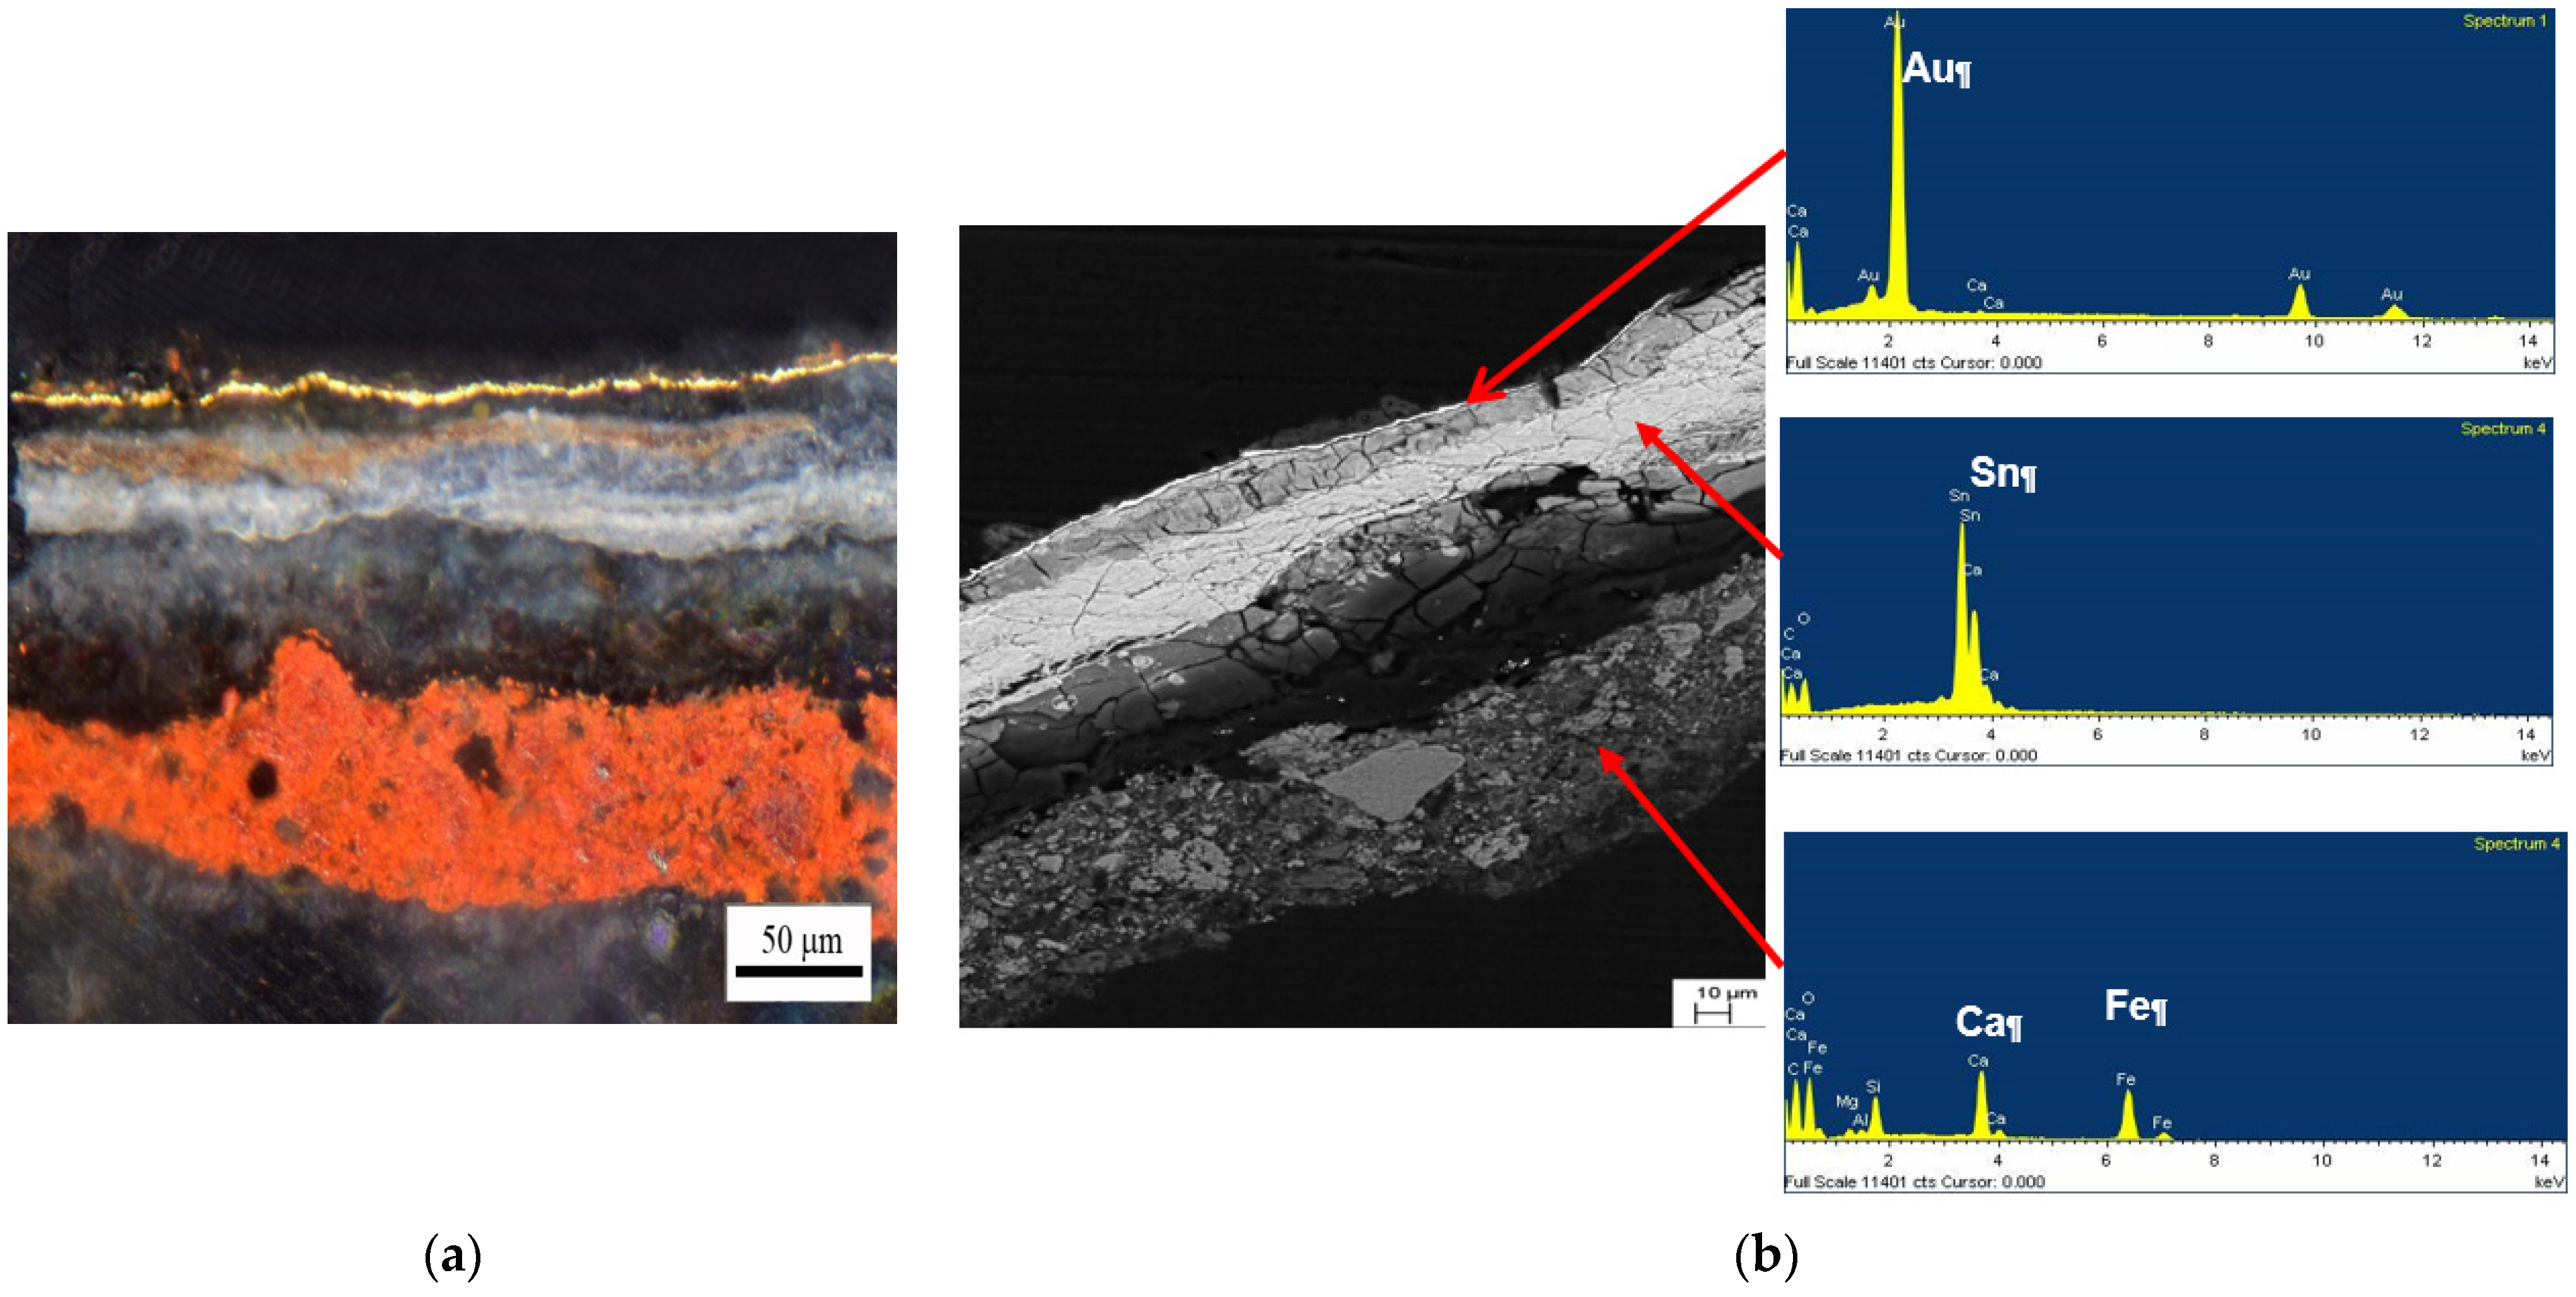
In the OM and FESEM images of sample B several layers are discernable (
Figure 5a,b). The FESEM images and EDX analysis show that in sample B, the gold leaf was laid on a thicker (10–20 µm) tin foil (
Figure 5b). The EDX analysis reveals that the gold leaf consists of pure gold, within the detection limit of the method (
Figure 5b). The layer below the metallic lamina, which contains mainly Fe and Ca, is the preparation layer. Layers, which appear dark both in the OM and FESEM images, are visible between the gold leaf and the tin lamina and the tin lamina and the preparation layer. The EDX spectra measured over these regions did not reveal the presence of other elements, besides carbon and oxygen. Thus, they probably correspond to the glue used for the adhesion of the metallic foils between them and to the preparation layer.
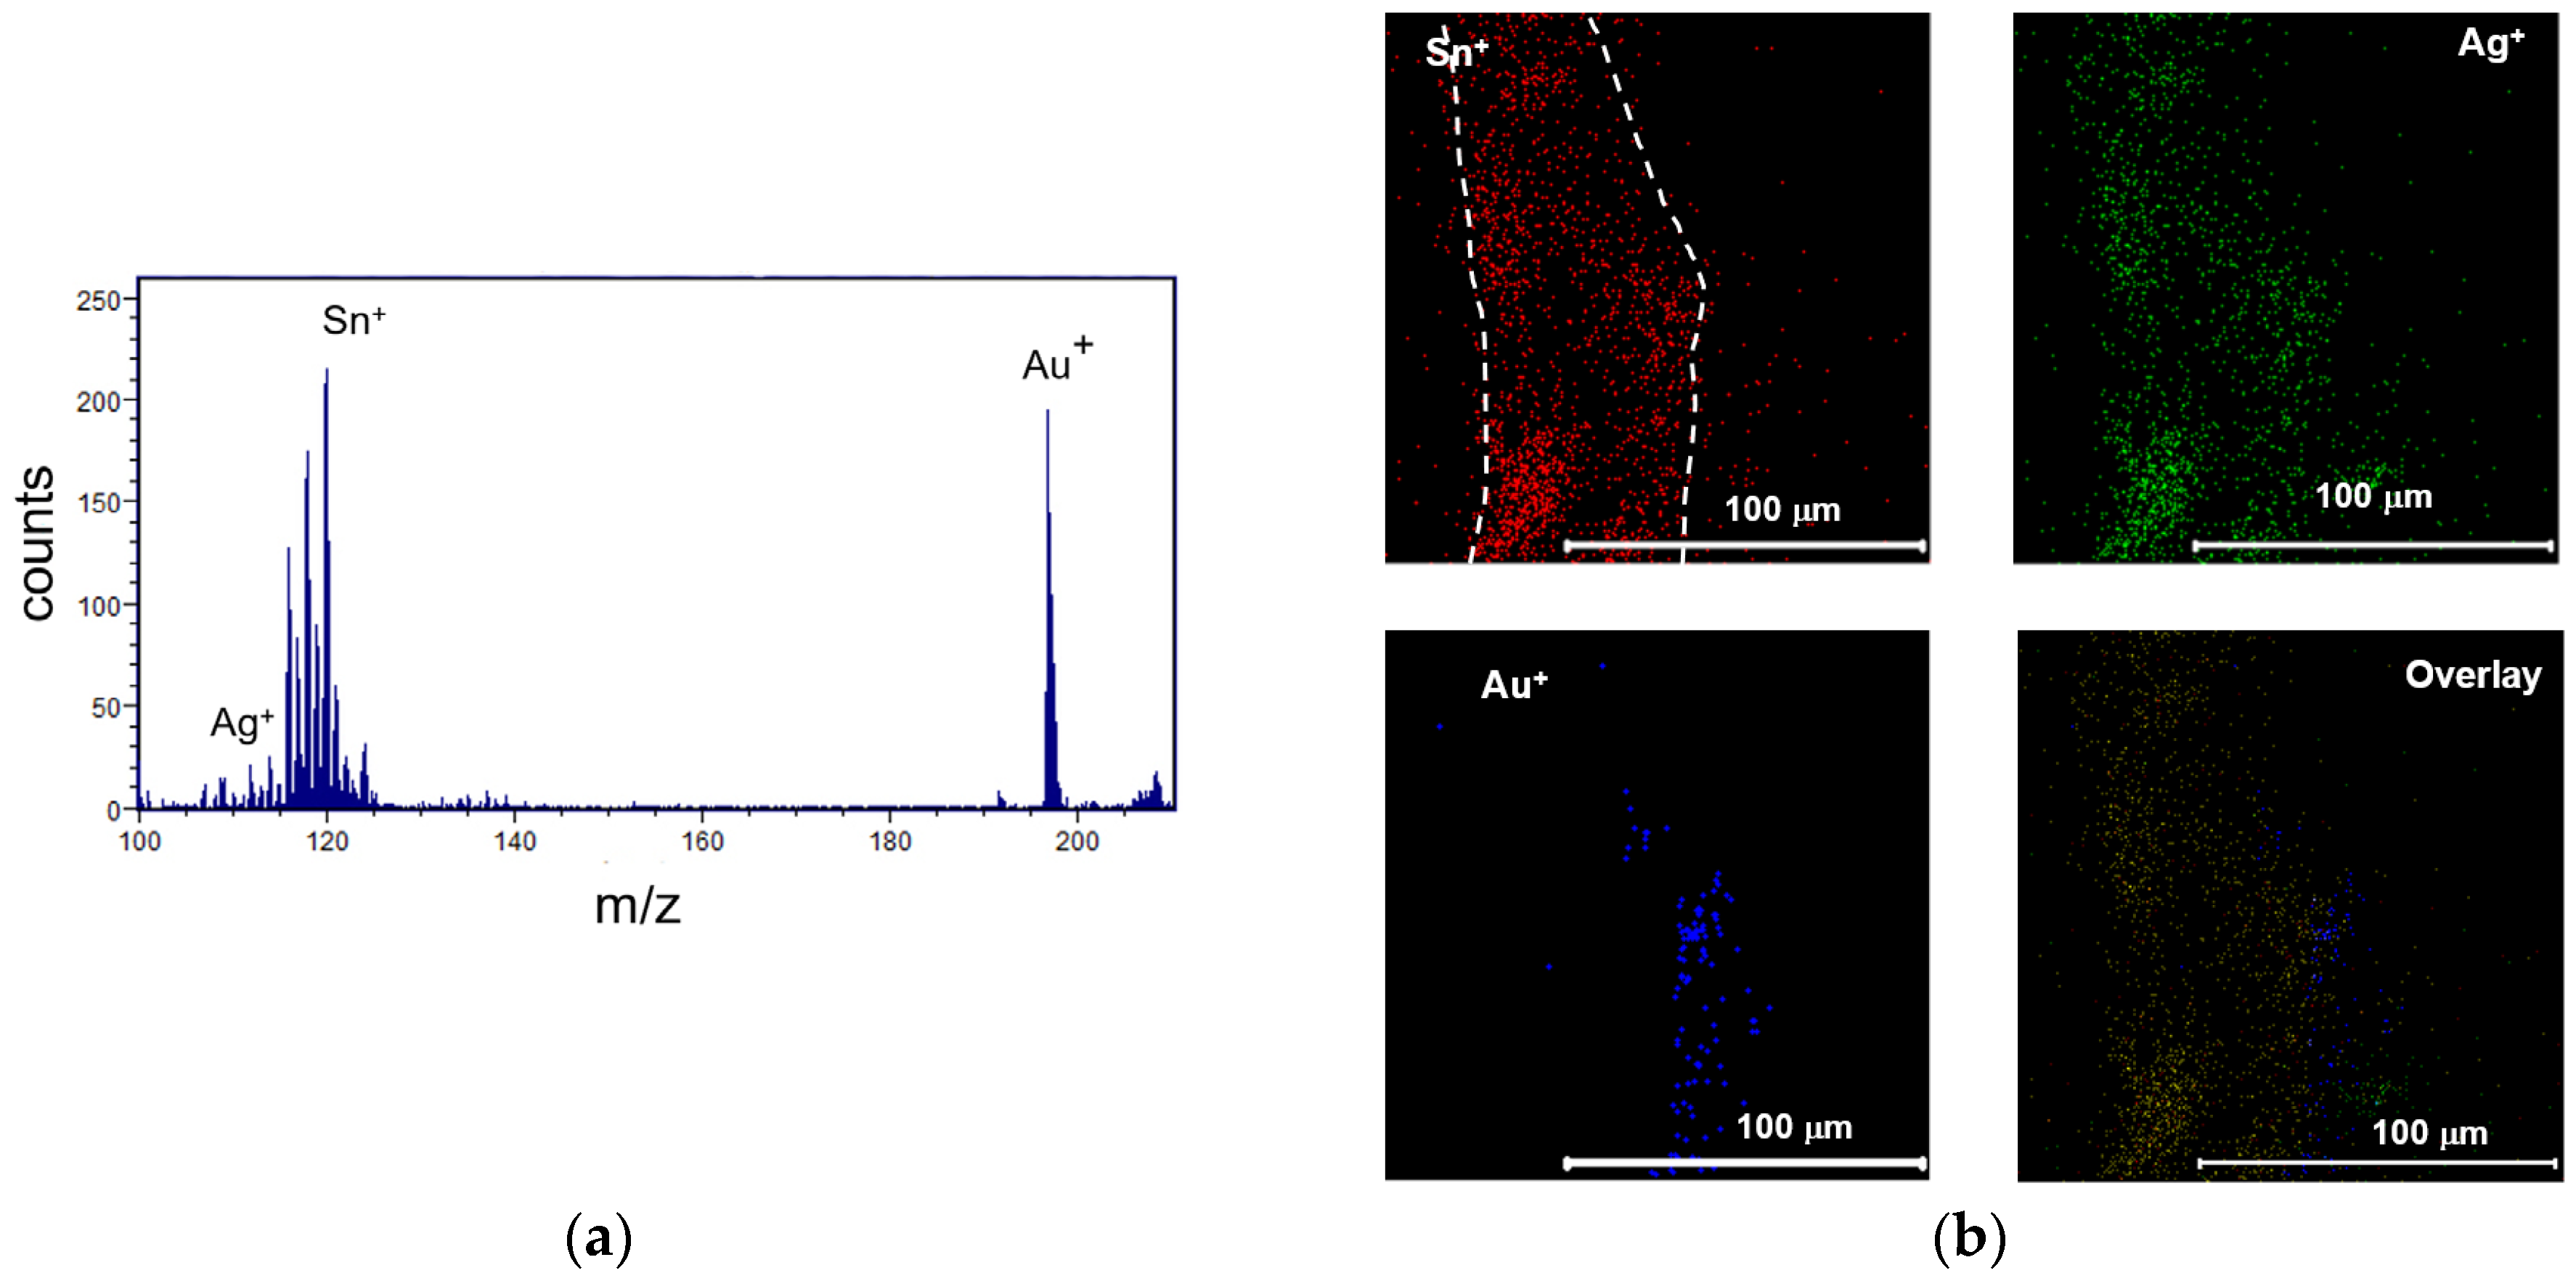
The results of the ToF-SIMS analysis of sample B are similar to those of sample A, besides the presence of the peaks of the isotopes of tin (
m/
z 116.9, 117.9, 118.9 and 119.9) (
Figure 6a). The chemical maps of tin, silver and gold and their overlay are shown in
Figure 6b. From the overlay map, it turns out that the signal of silver is localized mainly on the tin lamina. In addition, in this case silver is present in traces since it was not detected by EDX analysis. Although the analysis is limited to just one sample it should be noted that presence of silver impurities in the tin lamina could be used to derive information about the provenance of the material.
The analysis of samples A and B reveals residues of the last restoration carried out between 1989 and 1992. Barium, detected by EDX and ToF-SIMS (m/z 138), comes from consolidation treatments of the wall painting to transform calcium sulphate into barium sulphate. The ion fragments of fluorinated hydrocarbons (m/z 50 CF2+, m/z 69 CF3+, m/z 119 C2F5+ etc.) observed in the ToF-SIMS spectra probably originate from previous restorations.
As far as the organic components are concerned, ToF-SIMS spectra measured for sample A in the region close to the gilding leaf show peaks which could be attributed to the acylium ions of palmitic (C
16H
31O
+,
m/
z 239) and stearic (C
18H
35O
+ m/
z 267) acids and to the ion fragments of monoglycerolester of palmitic (C
19H
37O
3+ m/
z 313) and stearic (C
21H
41O
3+ m/
z 341) acids. The peaks corresponding to the ion fragments of lead palmitate and stearate were also detected. Peaks ascribable to deprotonated palmitic and stearic acids were observed in the negative ion ToF-SIMS spectra. Palmitic and stearic acids are the oxidation and hydrolysis products of linseed and other unsaturated oils during ageing of the original materials, as shown in many studies on oil painting ageing [
17]. On the other hand, linseed and other oils are not the only source of fatty acids, which are contained also in waxes and egg. Moreover, the presence of several contaminants and the altered state of the samples did not allow us to derive any firm conclusion about the nature of the adhesive materials.
For sample B, in the ToF-SIMS spectra we did not observe peaks attributable to linseed oil or to protein-based materials. This is probably due to the alteration (mineralization) of the organic materials which occurs faster when they are directly in contact with air and light as a result of the partial detachment of the gold leaf from the oxidized tin foil.

 ,
, 


