Article

Fabrication of Agglomerates from Secondary Raw Materials Reinforced with Paper Fibres by Stamp Pressing Process

1
Department for Industrial Furnaces and Heat Engineering, RWTH Aachen University, Kopernikusstr. 10, 52074 Aachen, Germany
2
MFG Metall-und Ferrolegierungsgesellschaft mbH Hafner, Blondin & Tidou, Rudolf-Diesel-Str. 9, 40670 Meerbusch, Germany
3
Process Metallurgy Group, University of Oulu, P.O. Box 8000, 90014 Oulu, Finland
4
Dipartimento di Meccanica, Politecnico di Milano, Via La Masa 1, 20156 Milano, Italy
5
Chair of Nonferrous Metallurgy, Montanuniversitaet Leoben, Franz-Josef-Str. 18, 8700 Leoben, Austria
6
Sidenor Investigacion Y Desarrollo SA, Barrio Ugarte s/n, 48970 Basauri, Spain
*
Author to whom correspondence should be addressed.
Submission received: 9 August 2019 / Revised: 9 September 2019 / Accepted: 17 September 2019 / Published: 20 September 2019
(This article belongs to the Special Issue Extractive Metallurgy from Metallurgical Waste or by-Products)

Abstract

:
The use of secondary raw materials in metallurgical processes such as steelmaking is an important contribution to the circular economy aspired to by EU members and many other countries. The agglomeration of dusts, fines and sludges is an important pretreatment step to enable the use of these materials in subsequent melting processes, such as steelmaking in electric arc furnaces (EAFs). It also reduces the amount of by-products and waste materials that are currently waste for disposal and are landfilled. The presented research is part of the Fines2EAF project, which aims to increase the value of steelmaking residues by internal recycling and use or reuse in the form of agglomerates. The approach followed in this project is the use of a hydraulic stamp press and alternative binder systems to produce cement-free agglomerates. The first results of lab-scale agglomeration tests of six different recipes with varying pressing forces are presented in this paper. It is shown that the addition of fibres from paper recycling has a strong effect on the cold compression stability of the agglomerates, by far exceeding other effects such as increased pressing force. Overall, the agglomerates produced in the lab show promising characteristics, for example, cold compression stability and abrasion resistance, which should allow for use in EAF steelmaking.

1. Introduction

The experiments presented here for the agglomeration of secondary raw materials of the electric arc furnace (EAF) process are part of the research project Fines2EAF, which is funded by the European Research Fund for Coal and Steel. The aim of the project is to find an easy and flexible on-site solution for the agglomeration of fine materials, which accrue in low quantities in steel plants. Beyond the technical challenges of agglomerate fine materials, the solution has to be low cost to fulfil the requirement of economic efficiency. Therefore, the stamp press is the central element of the investigated process chain.
The stamp press has the ability to be easily adapted to different materials compared with the pelletising process, which is also quite common for the recovery of metallurgical waste materials. A benefit compared with pelletising is the lower amount of binding agent and the lack of a drying process, which is necessary after pelletising, thus making the stamp press a more economical solution. Furthermore, the variation of the pressing force and mould size as well as the independence of the grain size are benefits which are important for the diversity of materials found in a steel plant [1,2].
The EAF is the main component of the secondary (electric) steelmaking route, which consists of the furnace, a casting plant and a hot rolling mill. In 2017, global crude steel production via the electric steel route was 28.0%, accounting for 472 million tons of crude steel [3]. During the production and processing of steel, a variety of by-products accrue, such as slags, dusts, sludges and scales. These by-products have the potential to be recycled on site but at the moment are not because it is not suitable due to the lack of low-cost methods. Therefore, they are disposed of in landfills or reused outside the steel plant, for example, as construction material. Due to the changes in worldwide environmental policies towards integrated pollution prevention, the regulations for applications outside of steel plants and landfills have become more restrictive [4,5].
However, the reuse of these substances is limited both by their particle size and their sometimes poor quality. Heavy metals and hydrocarbons make direct landfilling or recycling difficult [6]. Nevertheless, today, around 10%–67% are landfilled [7,8]. Therefore, research on other methods for reuse, especially the recycling of residues into EAFs, remains useful:
  • The residues contain a high content of metal oxides, which are an important source for iron production. Other major components of the residues, such as magnesium oxide, can also bring benefits to the process [9].
  • The use of residual materials outside the steelworks or their landfills is restricted, more expensive or prohibited due to stricter environmental laws [10,11].
  • There are also opportunities to reduce the cost of required scrap, alloying elements or slag formers, as well as the cost of landfilling, so that even profits can be made.
Driven by political pressure and the goal of reducing waste and saving primary raw materials by substitution with secondary raw materials, a favourable and flexible agglomeration method must be found. The main aim of the presented work was to produce agglomerates with sufficient physical properties (abrasion resistance and cold strength) to be used in EAFs without material loss during handling. The following section presents a selection of residual materials from a steel mill that were successfully formed into agglomerates using a stamp press.

2. Materials and Methods

The residues collected by SIDENOR were characterised by an EVO 50 Zeiss W filament SEM, equipped with an Inca Oxford energy-dispersive X-ray spectroscopy (EDS) probe. Fine samples were analysed in as-received condition using carbon adhesive on aluminium stubs to handle the material. Coarse samples were moulded in a bicomponent cold araldite-based resin, grinded by abrasive papers and polished by 1 μm diamond paste on metallurgical velvet.
General chemical composition measurement by EDS was performed on an area of 5 mm2.
Heat treatments for measurement of moisture, loss of ignition (LOI) and carbonate content were performed according to the following standards:
  • EN 14346:2006: Characterisation of waste—Calculation of dry matter by determination of dry residue or water content
  • EN 15169:2007: Characterisation of waste—Determination of loss on ignition in waste, sludge and sediments
  • EN 459-25:2010: Building lime—Test methods
For each temperature test, absolute mass variation was expressed as
mass   loss [ % ] = m i m f m i m c
where mi is the initial mass of the sample, mf is the mass of the sample after heat treatment and mc is the mass of the empty crucible.
Water content measurement was performed at 105 °C, dwelling the samples overnight in the furnace; LOI was measured at 550 °C, dwelling the samples for 2 h; and carbonates concentration was measured at 1050 °C, dwelling the samples for 2 h.
Dry mass and water content were expressed as indicated in the EN 14346 standard as
m D R = m c m a m b m a · 100
m W = 100 m D R
where mDR is the dry residue of the sample, mc is the mass of the crucible containing the dried sample, mb is the mass of the crucible containing the undried sample, ma is the mass of the empty crucible and mW is the water content of the sample.
LOI, associated with the hydroxide within the samples, was expressed as indicated in the EN 15169 standard as
m L O I = ( m b m c m d m a · 100 ( 100 m D R ) ) · 100 m D R
where mLOI is the loss of ignition of the sample.
Carbonate content was expressed as indicated in the EN 459-2 standard as
m C = ( ( m 11 m 12 m 11 · 100 ) ( m b m c m d m a · 100 ) ) · 100 100 ( m b m c m d m a · 100 )
where m11 is the mass of the sample before ignition at 1050 °C; m12 is the mass of the sample after ignition at 1050 °C; and ma, mb, mc and md are the masses referring to the LOI determination.
Thermal gravimetric–differential scanning calorimetry (TG-DSC) simultaneous thermal analysis was performed on 25 mg of sample in a Labsys Setaram machine, with a heating ramp of 30 °C/min from room temperature to 1200 °C under Ar atmosphere and using Al2O3 pans of 100 μL.
The identification of the transformation highlighted by TG-DSC analysis was performed according to the “Handbook of thermogravimetric system of minerals and its use in geological practice” [12].
XRD on as-received fines (grinding sludge (GS), oxy-cutting fines and combustion chamber dusts) was carried out by means of a Rigaku Smartlab SE diffractometer in θ-θ Bragg–Brentano configuration and employing Cu Kα radiation (λ = 1.54 Å). Two grams of dried material (105 °C overnight), manually homogenised in an agate mortar, were scanned from 5° to 80° 2θ at 0.5°/min with a step size of 0.02°, with a fixed divergence slit size 0.5° and a 120 rpm rotating sample stage. The diffracted beam was collected by means of a 1D D/teX Ultra 250 detector with an XRF suppressor filter. Phase identification was performed with Smartlab Studio II software employing the Crystallographic Open Database (COD).

2.1. Grinding Sludge

The grinding sludge came from a local bearing manufacturer close to the SIDENOR works, which generates it at a rate of about 1000 t/y. Figure 1 shows the sample analysed and Table 1 shows the results of the chemical analysis. Due to the high content of iron in the sample, it was analysed specifically for its iron oxide and metallic iron content.
Table 2 shows the results of the physical analysis regarding moisture and density. These sludges were characterised by a high moisture content (25%) and a small amount of carbonates (0.7%).
Grinding sludge is mainly formed by metallic iron and residual abrasive material (i.e., silicon carbide (SiC)) (Figure 2).
Grinding sludge samples were in the form of a matt-grey, smelly powder with some friable coarse blocks (Figure 1a). At high magnification, the appearance of a metallic compound was detected on the surface (Figure 1b). By SEM observation, a typical morphology of iron chips was detected (Figure 3a_B, Figure 3b_B and Figure 3b_C) with some residual abrasive particles, which probably were SiC (Figure 3a_A, Figure 3b_A and Table 3). After thermal treatment at 550 and 1050 °C, most of the surface was oxidised (Figure 3c–d and Table 3), as confirmed by the mass increase after the thermal treatment at 550 °C (Table 2).
TG-DSC analysis of grinding sludges did not show any significant transformation, and for this reason, results are not reported.

2.2. Oxy-Cutting Fines

Pursuant to its name, these fines originated from the cutting of billets by an oxygen lance. At SIDENOR, the oxy-cutting fines were collected in a filter house and stored in big bags. Figure 4 shows the sample and Table 4 gives the chemical analysis of the oxy-cutting fines. Due to the high content of iron in the sample, it was analysed specifically for the iron oxide and metallic iron content. Table 5 gives the results of the physical analysis regarding moisture and density. The physical analysis was in good agreement with the iron forms within the samples. For instance, practically no mass variations were registered during the heat treatment for moisture and LOI evaluation. This was due to the fact that most of the sample was in oxide form and thus remained unaltered during roasting. The particle size distribution of the oxy-cutting fines sample is shown in Figure 5.
From the crystallographic point of view, the oxy-cutting fines were composed of magnetite (Fe3O4), as determined by the titration analysis shown in Table 4 (Figure 6).
Oxy-cutting fines appeared dusty, easily compactable and brown. No coarse particles were detected (Figure 4). At high magnification, the fines appeared to be formed by slightly oxidised spherical metallic particles, ranging from 1 to 10 μm, with some coarse particles reaching 100 μm (Figure 5) and blocky compounds of 20–30 mm length (Figure 7). Metallic spheres were mainly composed of iron with traces of copper. The blocky compounds were magnesite residues (Table 6).
TG-DSC analysis of the grinding sludges did not show any significant transformation, and for this reason, the results are not reported.

2.3. Combustion Chamber Dust

The samples of combustion chamber dust were taken from the exhaust gas abatement system installed in the SIDENOR steel shop. The material was chosen for briquetting tests because it currently is not utilised like, for example, EAF dust, which undergoes the Waelz process due to its high zinc content [13]. The combustion chamber residues appeared like a moist, dense, dark brown powder with some rusty stains (Figure 8). The chemical analysis of the SIDENOR combustion chamber dust samples is given in Table 7. Due to the high content of iron in the combustion chamber dust sample, it was analysed specifically for the iron oxide and metallic iron content. Table 8 gives the results of the physical analysis regarding moisture and density. The combustion chamber dust contained a considerable amount of moisture and a negligible concentration of hydrated and carbonated compounds. Combustion chamber dust was characterised by a coarse morphology and the size distribution was not homogenous. For instance, two different subgroups were identified: the coarse fraction and the fine fraction. Thus, both fractions were analysed by SEM.

2.3.1. Coarse Fraction of Combustion Chamber Residues

A coarser (15–30 mm), friable fraction was detected. This coarse fraction was characterised by enough compactness to allow moulding and polishing. The rusty stains present on the surface suggests a residual content of metallic iron that oxidised after the cleaning of the combustion chamber (Figure 9).
From a crystallographic point of view, the combustion chamber dust was a complex material, mainly formed by different ferrite compounds (franklinite (ZnFe2O4), brownmillerite (Ca2Fe2O5) and plumboferrite (PbFe12O19)). Traces of zincite (ZnO), wustite (FeO) and goethite (FeO(OH)) were also found (Figure 10).
These residues were rich in Fe, Ca and Zn. In some areas, Pb was detected (Table 9). They can be considered to be a multiphase material, mainly composed of a phase rich in Fe and Zn (clear grey in the micrographs) and a phase rich in Ca, Fe and Al, with a composition close to brownmillerite (dark grey) (Figure 11).

2.3.2. Fine Fraction

Unlike the coarse fraction, the fine fraction appeared like a spherical agglomerated material (Figure 8), with some coarser agglomerated lumps. The spheres had a size distribution ranging from 25 to 250 μm in diameter, whereas the coarser agglomerates ranged from 0.5 to 1 mm in length. The spheres had different compositions: some were rich in Fe (B in Figure 12a) and others were richer in Zn and Ca (A in Figure 12a). On the agglomerate blocks, some prismatic crystals rich in Ca and Zn were detected (A in Figure 12b). After thermal treatment at 550 °C, a weak depletion in Zn content was observed (Figure 12c–d and Table 10).
The TG-DSC analysis is reported in Figure 13 and Table 11. Heat flow (HF) and dTG curves showed two endothermic transformations at 170 and 690 °C related to the dehydroxylation of a zeolite-like compound and the calcining of calcite. In the dTG curve, the melting of the dusts is also visible and is associated with a high mass loss, probably due to the partial evaporation of Zn. The abovementioned transformations correspond with the specific mass losses, as depicted in the TG curve. These results are in good agreement with the evaluation of LOI and carbonates by thermal treatment (Table 8).

2.4. Laboratory Agglomeration Tests and Recipes

For the agglomeration tests in the laboratories of RWTH Aachen University and the University of Oulu (UOulu), two different presses were used (Figure 14). The Gabbrielli L-4 stamp press located at RWTH and the vibrating stamp press located at UOulu were used to produce full-sized bricks with different agglomeration parameters.
In the pretests, a number of binders were tested, including sodium silicate, polyethylenglycol (PEG), carboxymethylcellulose (CMC), different types of starch, molasses, copolymer binders and superabsorbers. In addition to these different binding systems and agglomeration parameters, such as pressing force, pressing time, aging condition and so forth, additives were also investigated. CaCO3, bentonite, SiO2 and sodium silicate hardener were used with a sodium silicate binder. Fibres from paper recycling were also tested to increase the strength of the produced agglomerates.
Based on these pretests, starch was selected as the binder for the agglomerates and fibres from paper recycling were chosen as the additive to increase the strength of the agglomerates. Table 12 shows the recipes used for the laboratory production of the agglomerates. The press parameters SC and BC denote the use of two different upper stamps in the Gabbrielli stamp press at RWTH resulting in a clearance between mould and upper stamp of 50 (SC) and 500 (BC) µm, respectively. The mould itself was of round geometry and 73 mm in diameter.
After the mixing of the components, the pressing procedure was carried out. Since the manufacturing pressure (MP) is the most important parameter of the pressing process, it was varied for each of the first four recipes at RWTH, except MA604B SC, between 10 and 40 N/mm2 in steps of 10 N/mm2. MA604B SC was produced with only two MPs of 10 and 40 N/mm2. For each step, four briquettes were pressed and subsequently tested.
The samples manufactured at RWTH showed sufficient green strength for further handling. In order to allow for further hardening, the samples were placed on wooden pallets in ambient atmosphere and ambient temperature for a minimum of 10 days in order to imitate a possible later industrial production (curing) process without further drying/heat treatment.
The recipe UO was used to produce a total of 10 briquettes with a Carver vibrating press. The maximum vibration was 50 Hz and the MP was 20 N/mm2. The produced briquettes were used to carry out drop and compression tests after 2 and 7 days of curing in ambient conditions. Since the grinding sludge contained a high water content, recipes that incorporated GS did not require more water during mixing. Throughout the curing time, the dimensions and mass of the produced briquettes were measured on a daily basis. On average, briquette size remained virtually unchanged and exhibited less than 1.5% mass loss. Mass loss was likely due water evaporation from briquettes during curing.

3. Results and Discussion

Figure 15 shows an example of the shape of the samples after pressing, labelling and curing at RWTH. The height of each manufactured sample varied with the different recipes and the different MPs of the press. The height showed values between 24 and 52 mm, depending on the filling factor of the mould.
Cold compression strength (CCS) tests were carried out using an INSTRON multifunctional breaking strength testing machine with a 500 kN load cell. Samples were placed in between the load cell (upper position) and the moving bar (lower position). The moving bar subsequently was driven up just before the sample touched the load cell. Thus, the testing procedure started by basically following ISO BS 4700:2015 with a moving speed of the lower bar of 15 mm/min. The test was aborted manually at the point when (1) max. resistance was reached and (2) visual disintegration of the sample itself noticeably started. Figure 16 shows an MA604 sample after the CCS testing procedure placed in between the load cell and reversed moving bar.
Results of the compression strength dependent on different MPs and recipes are given in Table 13 and illustrated by the following diagrams. For every MP and recipe, the average of four CCS tested briquettes is reported.
Results of the CCS test of the briquettes based on grinding sludge and oxy-cutting fines (MA604 series) are shown in Figure 17. The figure depicts the dependency of compression strength on MP, the parameter “clearance” between upper stamp and mould as well as the compression strength dependency on the use of fibres as reinforcement in the mixture. For the MA604B recipes, it can be derived that the increasing MP leads to a higher compression strength. For MA604B SC, the increase in compression strength (10 vs 40 N/mm2) was in the range of about 60%, and for MA604B BC, the increase was in the range of about 15%. However, it seems that there exists a threshold for the MP, at least for MA604B BC, at approximately 30 N/mm2, where an increase in MP does not lead to a higher compression strength.
Based on the results of MA604B SC versus BC, it seems that the clearance between the mould and the stamp only has an influence on the compression strength for lower manufacturing pressures, while the resulting compression strength for a higher MP seems to be independent of the clearance.
What can clearly be stated from the results obtained is that the use of fibres in the recipe increased the compression strength by approx. 70%–100% depending on the MP.
Figure 18 compares two different recipes having combustion chamber dust and oxy-cutting fines as base raw materials. Between the recipes, a number of parameters were altered at the same time, so it is not so easy to draw clear conclusions. However, it is remarkable that, again, the samples using fibres as a reinforcement showed an increase in compression strength. The increase was up to 150%, even though more than double the amount of starch compensated for the omission of the fibres in recipe CC03. At the same time, the results indicate that the use of BS (500 µm clearance) did not lead to reduced compression strength in comparison to the use of SC (50 µm clearance), at least for the higher MP.
The results obtained with the RWTH stamp press were verified with the bricks produced by the UOulu vibrating press. Compression strength tests at UOulu were performed after 2 and 7 days of curing at room temperature. The results are shown in Table 14 below. After 28 days of curing, cold-bonded briquettes having around 11% Portland cement (the same as the starch content used in our briquettes) are reported to have a compression strength of 54 kN for fine raw material and 25 kN for coarser raw material [14]. The compression strength of UO recipe was comparable to CC03 briquettes. However, it was lower than that of MA604B BC. This could have been due to the shorter curing time but could also indicate that increasing the paper fibre content over 0.9% may have a negative influence on the compression strength. The geometry of produced briquettes might also be a factor that influences that final strength [15].
A drop test was performed after 2 days of curing from a height of 1 m and after 7 days of curing from a height of 5 m. Briquettes were able to survive 50 drops without falling below 50% of their original mass, which means the bricks had adequate mechanical strength for material handling (Figure 19). Furthermore, the 7-day drop test from 5 m showed that the bricks can withstand the high drop distance associated with charging the bricks to raw material silos. Mass measurements and mass loss percentage are shown in Table 15.
SEM observations were carried for the fracture surface of the briquettes on a Zeiss ULTRA plus field emission scanning electron microscope (FESEM), using a secondary electron detector at 5–15 kV. Figure 20a shows clearly how the starch formed a film that surrounded smaller spherical particles originating from oxy-cutting fines and interconnected smaller and bigger particles together. Figure 20b captures the local influence of the fibrous reinforcement on the briquette. Fibres appeared to be well dispersed, while starch and smaller particles appeared to be adhering to the fibre body, indicating that the fibres and the starch matrix were well bonded. The fibre bridging action was likely one of the factors contributing to the enhanced mechanical properties of the produced briquettes.
LECO analysis was performed to obtain the total amount of carbon and sulphur in the bricks. The results of the analysis are presented in Table 16. The analysis showed some variance between different bricks of the same batch, but the average carbon content was on average 15.0 wt %. Most of the carbon in the material was introduced by adding 10.2 wt % of injection carbon in the brick recipe. The analysis suggests that the amount of carbon introduced to the bricks via paper fibre and starch additions was approximately 4.8 wt %, which significantly contributed to the total carbon in the bricks.

4. Conclusions

Based on the results presented in this paper, it seems feasible to create agglomerates with sufficient physical properties to withstand handling in a steel plant by the innovative approach of using paper fibres as reinforcement and the stamp press with its high manufacturing pressures. This way, and in contrast to the current state of the art, an agglomerate can be produced that will only include secondary raw materials as well as binders and fibres, which will contribute to a reduction of oxides by the increased carbon content. A cement- or water-glass-based binding system, which would introduce materials without use for the metallurgical melting process, can be avoided while still achieving sufficient compression strength of the agglomerates.
Future research for this project will focus on the melting and reduction behaviour of the investigated recipes. Subsequently, pilot-scale production of selected recipes, as well as industrial-scale testing in electric arc furnaces for steelmaking, is planned. To make the conclusions regarding the influence of fibre addition and manufacturing pressure on compression strength more robust, additional tests with different recipes and an extended range of manufacturing pressures would be useful.
The results achieved so far can already be applied by research institutes and companies trying to develop new ways to agglomerate and recycle especially fine metallurgical residues and waste materials.

Author Contributions

Conceptualisation, T.E., M.A., D.M. and S.S.; validation, T.E. and M.A.; investigation, T.W., S.P., M.A. and A.A.; resources, I.U.; writing—original draft preparation, T.E., T.W., M.A. and S.P.; writing—review and editing, T.E., M.A., D.M. and S.S.; visualisation, T.E., S.P., M.A., D.M. and S.S.; supervision, T.E, C.M. and T.F.
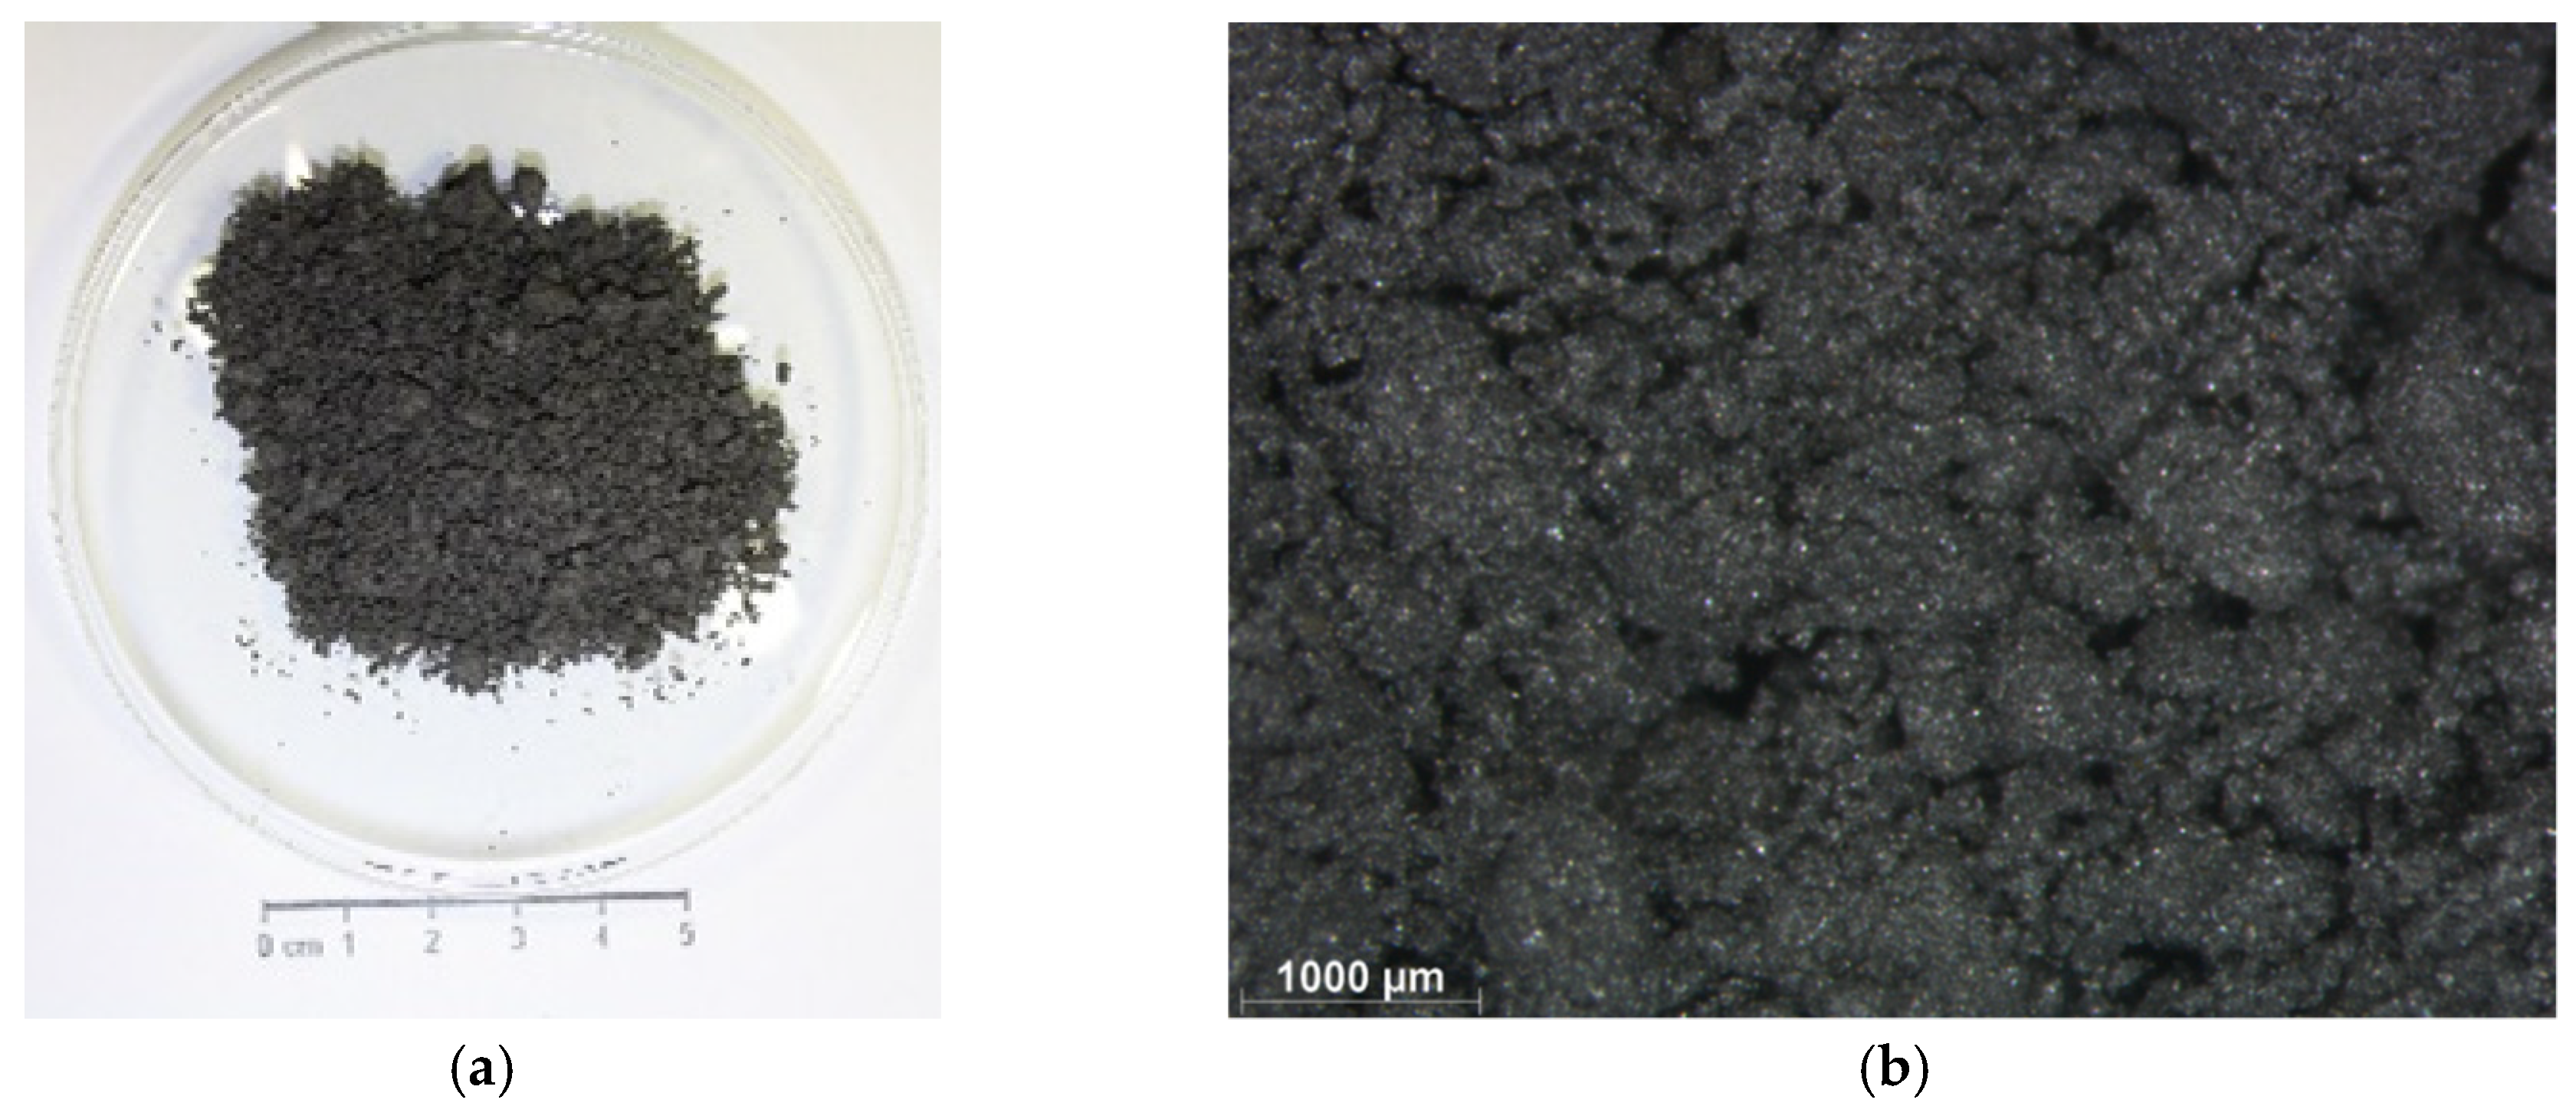
Funding

This project received funding from the European Commission from the Research Fund for Coal and Steel under grant agreement no. 754197. This paper reflects only the authors’ view and the Commission is not responsible for any use that may be made of the information it contains.

Conflicts of Interest

The authors declare no conflict of interest. The funders had no role in the design of the study; in the collection, analyses or interpretation of data; in the writing of the manuscript; or in the decision to publish the results.

Abbreviations

The following abbreviations are used in this manuscript:
CCDCombustion chamber dust
CCSCold compression strength
CMCCarboxymethylcellulose
CODCrystallographic Open Database
EAFElectric arc furnace
EDSEnergy-dispersive X-ray spectroscopy
ENEuropean Standard
FESEMField emission scanning electron microscope
GSGrinding sludge
ISOInternational Organization for Standardization
LOILoss of ignition
MPManufacturing pressure
OCFOxy-cutting fines
PEGPolyethylenglycol
PPPress parameter
RWTHRWTH Aachen University
SEMScanning electron microscopy
SEM-BSEScanning electron microscopy–back-scattered electrons
SEM-SEScanning electron microscopy–secondary electrons
TG-DSCThermal gravimetric–differential scanning calorimetry
UOuluUniversity of Oulu
WD-XRFWavelength-dispersive X-ray fluorescence
XRDX-ray diffraction

References

  1. Steele, R.B.; Bizhanov, A.P. Stiff extrusion agglomeration of arc furnace dust and ore fines for recovery at a ferro alloy smelter. In Proceedings of the 32nd Biennial Conference of the Institute of Briquetting and Agglomeration 2011, New Orleans, LA, USA, 25–28 September 2011; Curran: Red Hook, NY, USA, 2013; pp. 41–53. [Google Scholar]
  2. Pietsch, W.B. Agglomeration Processes: Phenomena, Technologies, Equipment; Wiley-VCH Verlag GmbH: Weinheim, Germany, 2002. [Google Scholar]
  3. World Steel Association. Steel Statistical Yearbook; World Steel Committee on Economic Studies: Brussels, Belgium, 2018. [Google Scholar]
  4. Algermissen, D.; Morillon, A.; Wendler, B.; Kozariszczuk, M.; Cirilli, F.; Miceli, P.; Unamuno, I.; Baragiola, S.; Marquardt, R. Control of Slag Quality for Utilisation in the Construction Industry (SLACON): Final Report; Publications Office of the European Union: Luxembourg, 2017; Volume 28460. [Google Scholar]
  5. Stubbe, G.; Harp, G.; Marx, K.; Ebner, M.; Mirabile, D.; Pistelli, M.I. Upgrading and Utilisation of Residual Iron Oxide Materials for Hot Metal Production (URIOM): Final Report; Publications Office of the European Union: Luxembourg, 2013; Volume 25081. [Google Scholar]
  6. Barella, S.; Gruttadauria, A.; Magni, F.; Mapelli, C.; Mombelli, D. Survey about Safe and Reliable Use of EAF Slag. ISIJ Int. 2012, 52, 2295–2302. [Google Scholar] [CrossRef]
  7. Merkel, T. Erzeugung und Nutzung von Eisenhüttenschlacken 2016; Institut für Baustoff-Forschung FehS: Duisburg, Germany, 2017. [Google Scholar]
  8. Rütten, J.; Frias, S.; Diaz, G.; Martin, D.; Sanchez, F. Processing EAF Dust Through Waelz Kiln and ZINCEXTM Solvent Etraction, The Optimum Solution. In Proceedings of the European Metallurgical Conference (EMC 2011), Düsseldorf, Germany, 26–29 June 2011; GDMB: Clausthal-Zellerfeld, Germany, 2011. [Google Scholar]
  9. Matino, I.; Colla, V.; Baragiola, S. Evaluation of Internal Slag Reuse in an Electric Steelmaking Route: Simulation Analyses through the EIRES Monitoring Tool. In Proceedings of the 5th International Conference on Sustainable Solid Waste Management, Athens, Greece, 21–24 June 2017. [Google Scholar]
  10. Merkel, T. Eisenhüttenschlacken im Jahr 2014—Erhebungen zu Produktion und Nutzen; Institut für Baustoff-Forschung e.V.: Duisburg, Germany, 2015. [Google Scholar]
  11. Algermissen, D.; Dettmer, B.; Rekersdrees, T.; Schliephake, H.; Zehn, T. NoWaste Strategie im Stahlwerksbereich am Beispiel der Georgsmarienhütte. In Recycling und Rohstoffe; Thomé-Kozmiensky, K.J., Goldmann, D., Eds.; TK Verlag: Neuruppin, Germany, 2016; Volume 9, pp. 469–481. [Google Scholar]
  12. Földvári, M. Handbook of Thermogravimetric System of Minerals and its Use in Geological Practice; Occasional Papers; Geological Institute of Hungary: Budapest, Hungary, 2011; Volume 213. [Google Scholar]
  13. Busè, R.; Mombelli, D.; Mapelli, C. Metals recovery from furnaces dust: Waelz process. Metall. Ital. 2014, 106, 19–27. [Google Scholar]
  14. Singh, M.; Björkman, B. Strength of cement-bonded briquettes. Min. Metall. Explor. 2006, 23, 203–213. [Google Scholar] [CrossRef]
  15. Rahman, A.N.E.; Aziz Masood, M.; Prasad, C.S.N.; Venkatesham, M. Influence of size and shape on the strength of briquettes. Fuel Process. Technol. 1989, 23, 185–195. [Google Scholar] [CrossRef]
Figure 1. Picture (a) and stereo-micrograph (b) of grinding sludge samples.
Applsci 09 03946 g001
Figure 2. XRD pattern of as-received grinding sludges (I = metallic iron (α-Fe at 45° and 65° 2θ; γ-Fe at 43.5°, 50° and 75° 2θ), SiC = silicon carbide).
Applsci 09 03946 g002
Figure 3. SEM micrographs of (a,b) as-received, (c) 550 °C and (d) 1050 °C treated grinding sludge samples.
Applsci 09 03946 g003aApplsci 09 03946 g003b
Figure 4. Picture (a) and stereo-micrography (b) of SIDENOR oxy-cutting fines samples.
Applsci 09 03946 g004
Figure 5. Particle size distribution of SIDENOR oxy-cutting fines.
Applsci 09 03946 g005
Figure 6. XRD pattern of as-received oxy-cutting fines (M = magnetite).
Applsci 09 03946 g006
Figure 7. SEM–secondary electron (SEM-SE) (a) and SEM–back-scattered electron (SEM-BSE) (b) micrographs of as-received oxy-cutting fines.
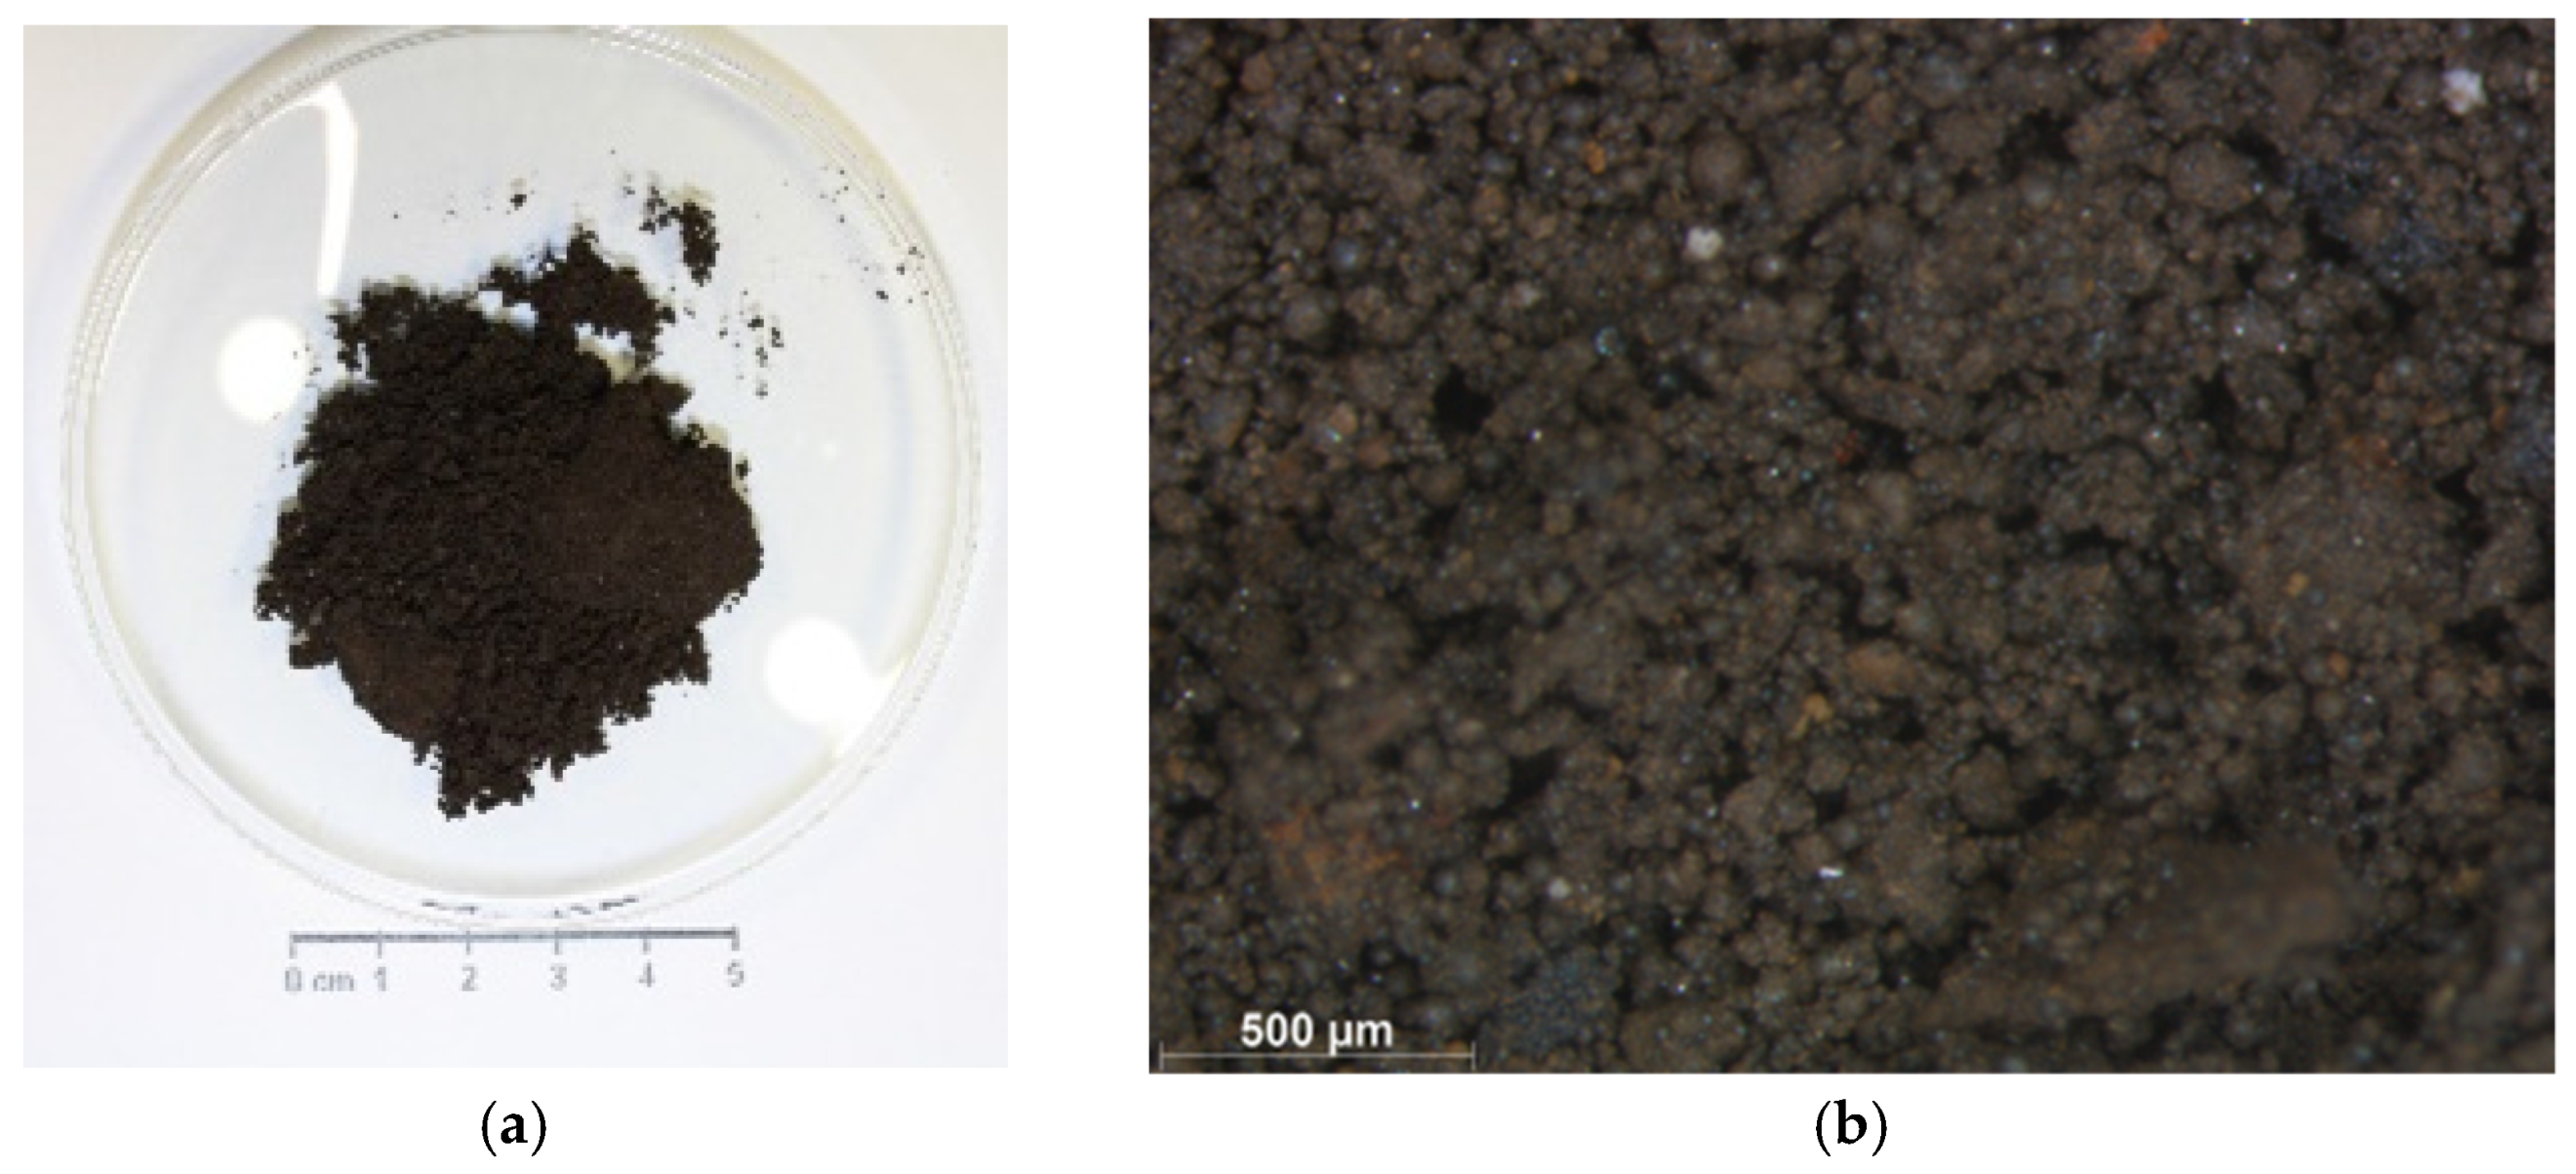
Applsci 09 03946 g007
Figure 8. Picture (a) and stereo-micrography (b) of SIDENOR combustion chamber dust sample.
Applsci 09 03946 g008
Figure 9. Stereomicrographs of as-received coarse combustion chamber residues with (a) and without (b) visible rusty stains.
Applsci 09 03946 g009
Figure 10. XRD pattern of as-received combustion chamber dusts (B = brownmillerite, F = franklinite, G = goethite, P = plumboferrite, W = wustite and Z = zincite).
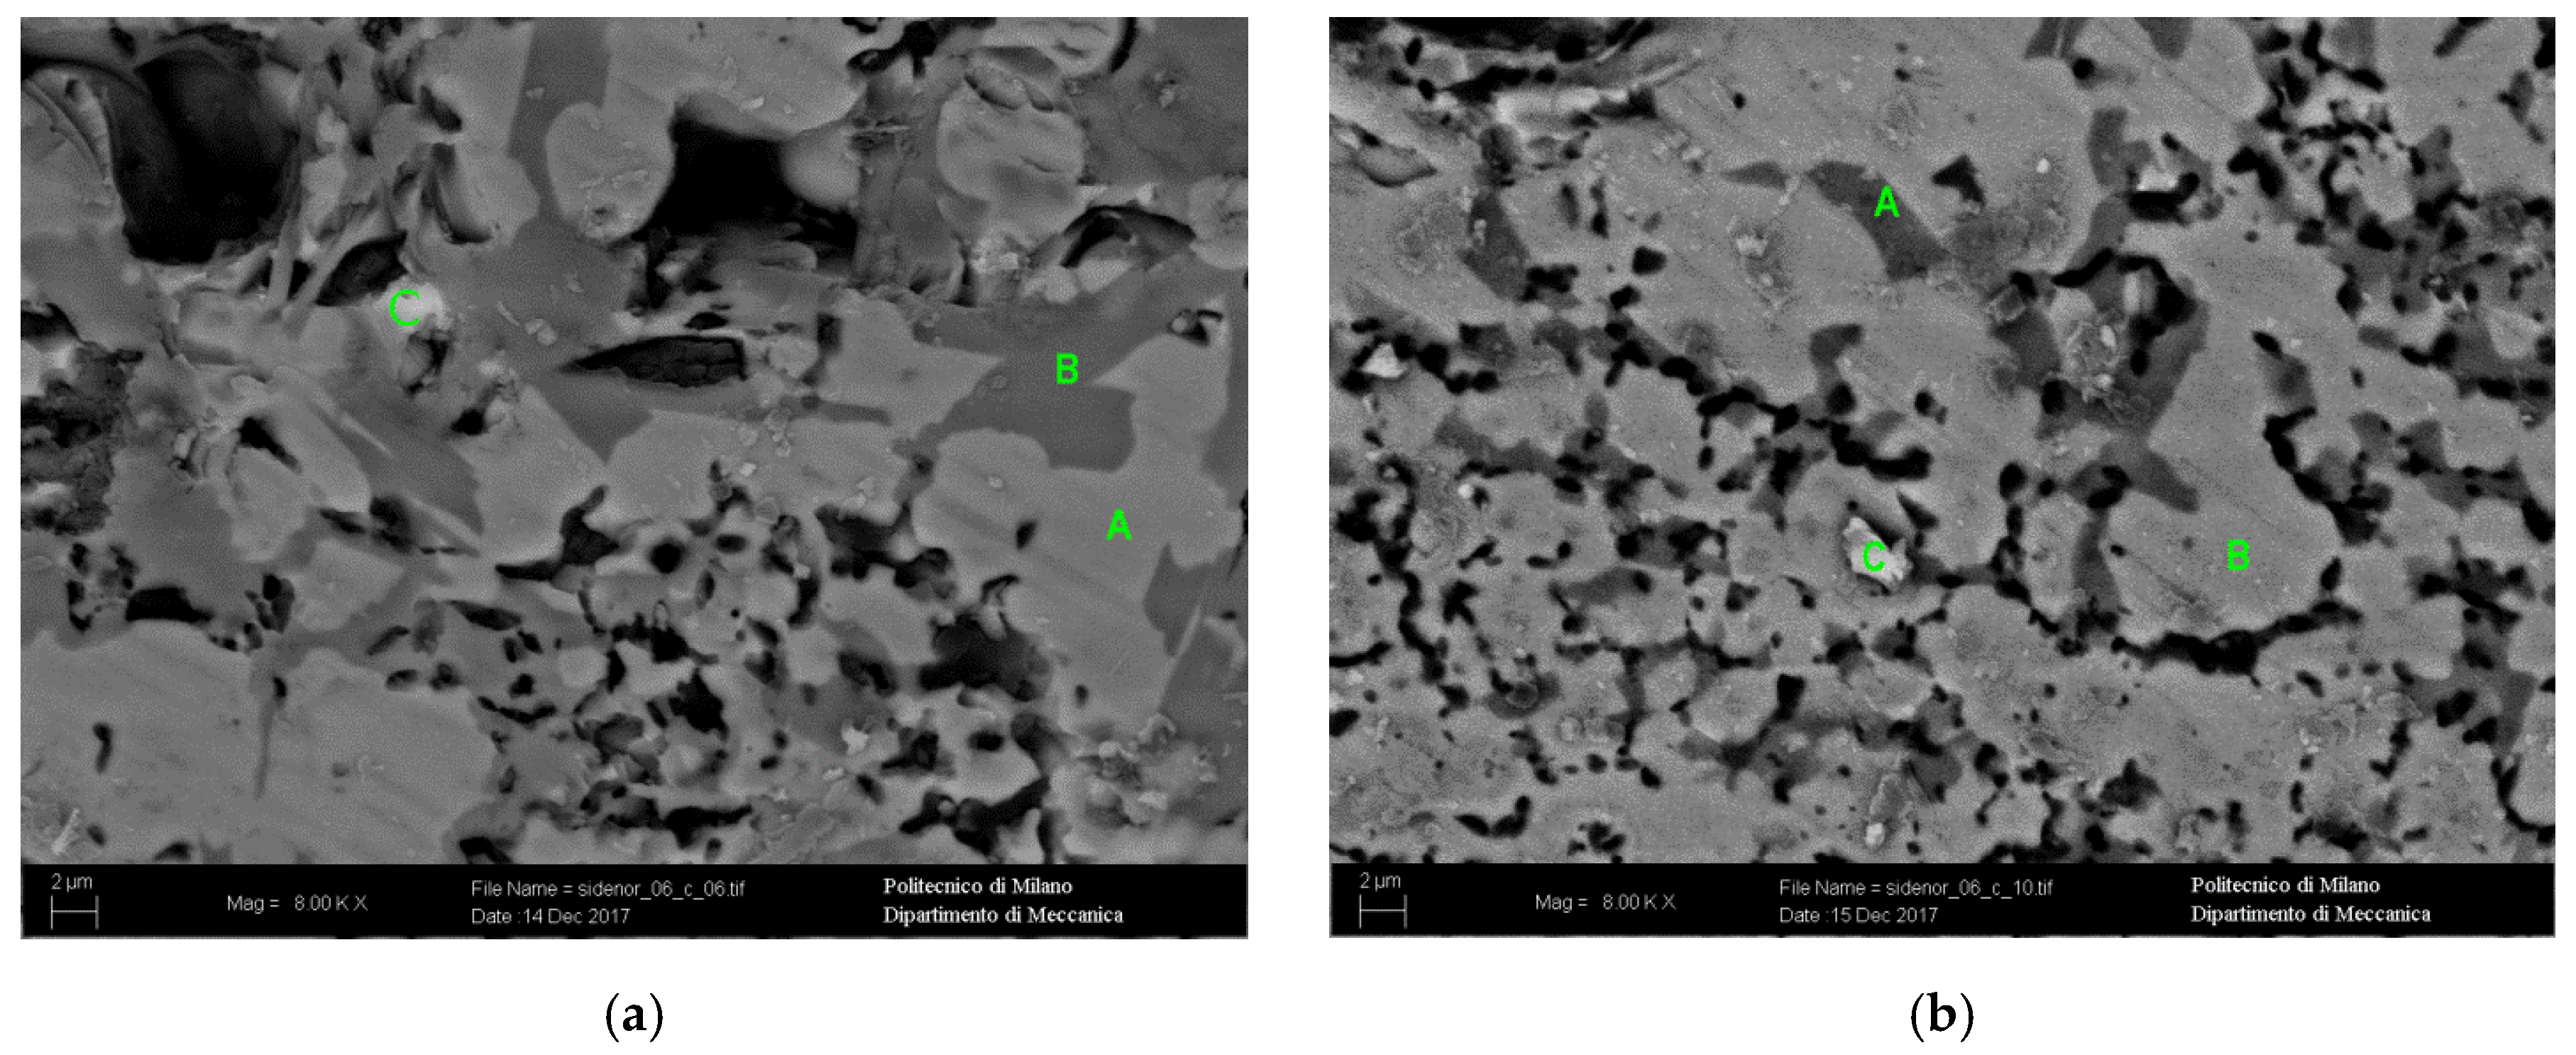
Applsci 09 03946 g010
Figure 11. SEM micrographs (a,b) of as-received coarse combustion chamber residues.
Applsci 09 03946 g011
Figure 12. SEM micrographs of as-received (a,b) and 550 °C (c,d) treated fine combustion chamber residues.
Applsci 09 03946 g012
Figure 13. Thermal gravimetric–differential scanning calorimetry (TG-DSC) results of combustion chamber residue thermal analysis.
Applsci 09 03946 g013
Figure 14. Gabbrielli L-4 stamp press (RWTH Aachen University, left) and vibrating stamp press (University of Oulu (UOulu), right).
Applsci 09 03946 g014
Figure 15. Exemplary MA604B agglomerates manufactured with a 10 N/mm2 manufacturing pressure (MP).
Applsci 09 03946 g015
Figure 16. MA604 after the cold compression strength (CCS) testing procedure.
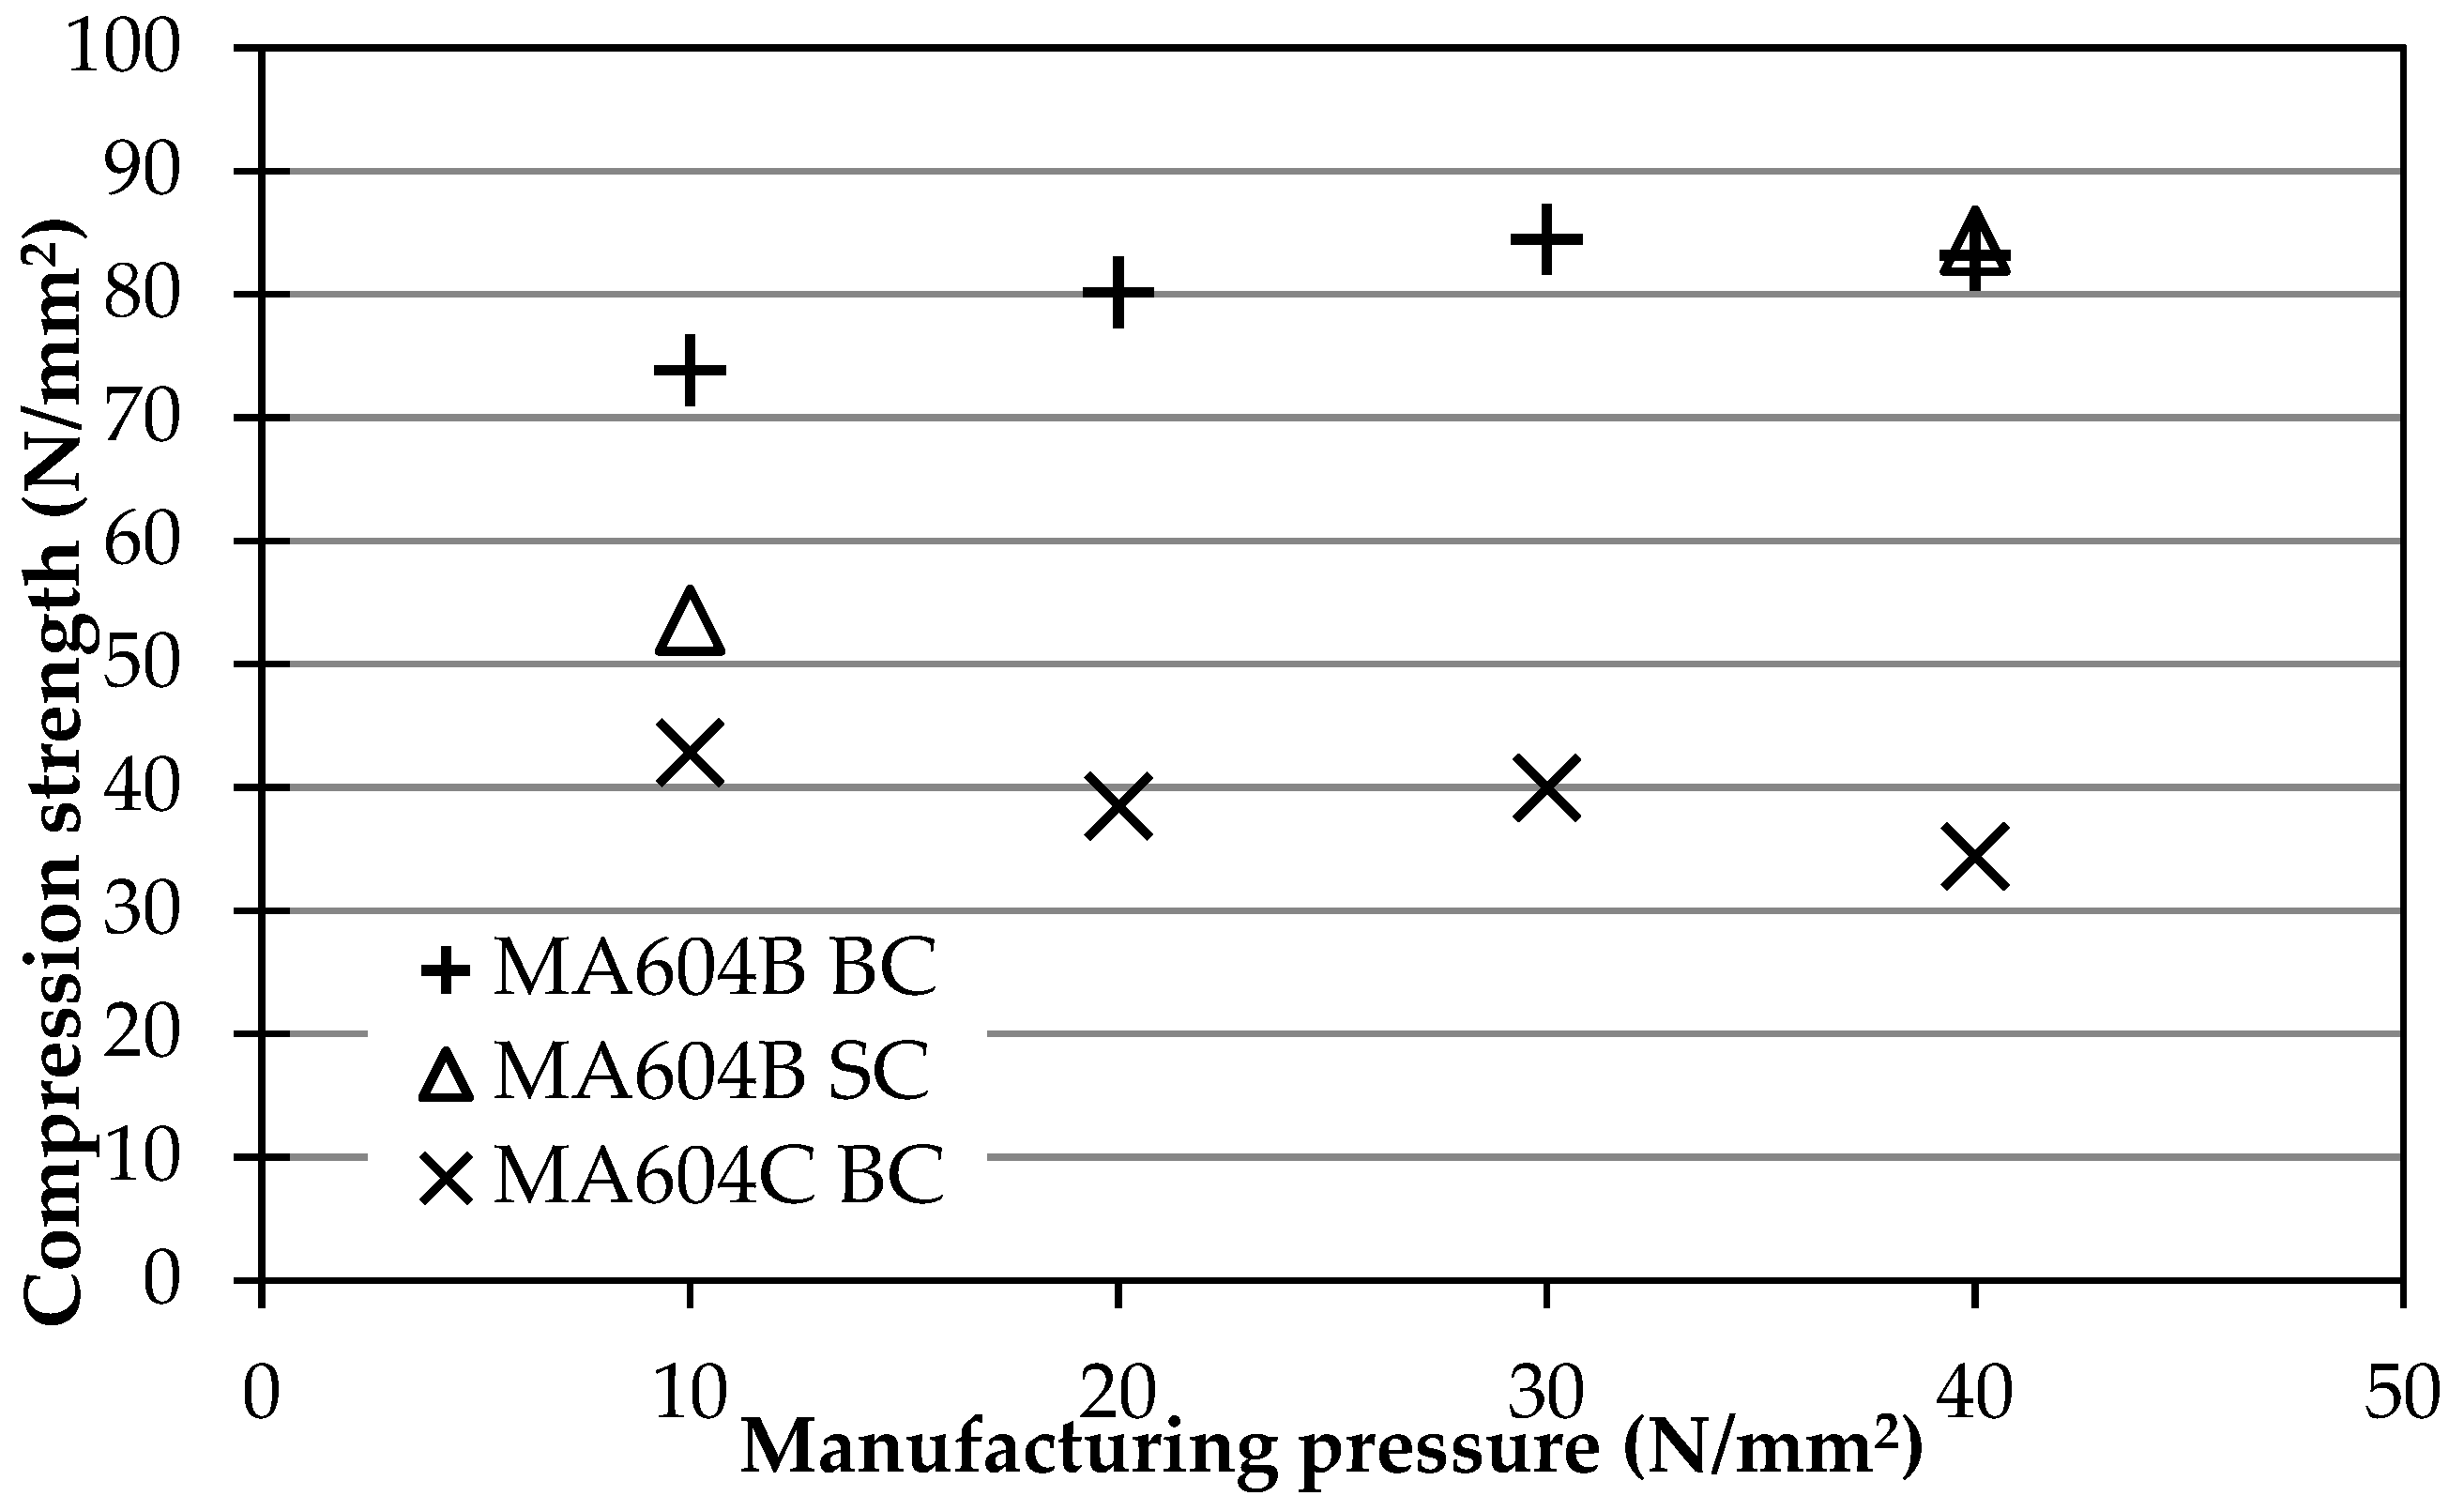
Applsci 09 03946 g016
Figure 17. Compression strength (average of four tests) of recipes based on grinding sludge and oxy-cutting fines with and without fibres.
Applsci 09 03946 g017
Figure 18. Compression strength (average of four tests) of recipes based on combustion chamber dust and oxy-cutting fines.
Applsci 09 03946 g018
Figure 19. Mass loss in drop tests conducted after 2 and 7 days of curing in ambient air.
Applsci 09 03946 g019
Figure 20. Fracture surface of produced briquettes using starch as binder (a,b).
Applsci 09 03946 g020
Table 1. Chemical analysis of grinding sludge samples.
SUBSTANCECONCENTRATION (%)METHOD
Al2O31.069WD-XRF
CaO0.157
Cr2O31.739
MgO0.102
MnO0.320
P2O50.437
S0.085
SiO23.577
C3.03Elemental analysis
Fe total83.6DIN EN ISO 11885
Fe2+24.1AM_EG.26 (Titration)
Fe3+0.3Calculated
Fe met59.2ISO 5416
Table 2. Physical analysis of grinding sludge samples.
CHARACTERISTICVALUETEST TEMPERATURE (°C)METHOD
Moisture24.787%105EN 14346:2006
Loss of ignition (LOI)−35.267%550EN 15169:2007
Carbonates0.697%1050EN 459-2_2010
Bulk density1.192 g/cm3 ÖNORM EN 1097-3: 1998 08 01
True density5.302 g/cm3 ÖNORM EN 1097-7: 2009 01 01
Table 3. SEM–energy-dispersive X-ray spectroscopy (SEM-EDS) analysis of as-received and thermal-treated grinding sludge samples.
% by WeightCONaAlSiKCaTiCrFe
General chemical composition 0.402.10 1.6795.84
Figure 2A_A44.4326.360.372.1222.931.810.23 1.75
Figure 2A_B 0.78 1.4097.82
Figure 2D_A58.600.87 39.51 1.02
Figure 2D_B 1.4998.51
Figure 2D_C 1.24 1.4097.36
General chemical composition at 550 °C 10.56 1.44 1.1386.87
Figure 2C_A 20.02 5.43 2.2114.34 58.00
Figure 2C_B 1.3698.64
General chemical composition at 1050 °C2.6711.27 0.350.85 0.261.3483.26
Figure 2D_A 8.46 4.04 87.50
Figure 2D_B12.3727.13 1.0077.17
Table 4. Chemical analysis of SIDENOR oxy-cutting fines samples.
SUBSTANCECONCENTRATION (%)METHOD
Al2O30.170WD-XRF
CaO1.295
Cr2O30.654
MgO0.368
MnO0.815
P2O50.530
S0.188
SiO21.065
C0.31Elemental analysis
Fe total68.2DIN EN ISO 11885
Fe2+16.4AM_EG.26 (Titration)
Fe3+51.5Calculated
Fe met0.3ISO 5416
Table 5. Physical analysis of SIDENOR oxy-cutting fines samples.
CHARACTERISTICVALUETEST TEMPERATURE (°C)METHOD
Moisture4.730%105EN 14346:2006
LOI0.115%550EN 15169:2007
CarbonatesN.A.1050EN 459-2_2010
Bulk density1.824 g/cm3 ÖNORM EN 1097-3: 1998 08 01
True density4.739 g/cm3 ÖNORM EN 1097-7: 2009 01 01
Table 6. SEM-EDS analysis of as-received oxy-cutting fines.
% by WeightCONaMgSiClKCaCrMnFeCu
General chemical composition4.1912.45 0.800.59 80.611.36
Figure 5A_A25.6816.221.2149.361.201.960.751.29 2.33
Figure 5A_B3.1815.27 81.55
Figure 5A_C8.3015.85 0.65 0.59 1.0071.412.20
Table 7. Chemical analysis of SIDENOR combustion chamber dust samples.
SUBSTANCECONCENTRATION (%)METHOD
Al2O31.912WD-XRF
CaO9.301
Cl0.301
Cr2O31.289
CuO0.127
K2O0.192
MgO1.950
MnO3.455
Na2O3.171
NiO0.056
P2O50.631
PbO0.161
S0.199
SiO24.389
ZnO7.779
C2.57Elemental analysis
Fe total45.1DIN EN ISO 11885
Fe2+16.4AM_EG.26 (Titration)
Fe3+26.9Calculated
Fe met1.8ISO 5416
Table 8. Physical analysis of SIDENOR combustion chamber dust samples.
CHARACTERISTICVALUETEMPERATURE (°C)METHOD
Moisture6.397%105EN 14346:2006
LOI2.482%550EN 15169:2007
Carbonates1.492%1050EN 459-2_2010
Bulk density2.193 g/cm3 ÖNORM EN 1097-3: 1998 08 01
True density4.276 g/cm3 ÖNORM EN 1097-7: 2009 01 01
Table 9. SEM-EDS analysis of as-received coarse combustion chamber dusts.
% by WeightCOMgAlSiCaTiCrMnFeZnPb
General chemical composition13.1020.071.862.652.3515.00 0.813.2236.844.09
Figure 8A_A8.5512.844.010.51 2.01 0.556.8457.776.92
Figure 8A_B7.6818.19 7.351.0933.991.18 0.6629.86
Figure 8A_C6.9816.76 2.722.2422.171.510.550.6329.351.8115.49
Figure 8B_A7.6314.77 5.590.4825.000.71 0.5941.473.77
Figure 8B_B9.7613.671.26 1.84 0.481.6560.4910.85
Figure 8B_C7.5819.562.300.78 2.31 0.682.8252.9011.07
Table 10. SEM-EDS analysis of as-received and thermal-treated fine combustion chamber residues.
% by WeightCOMgAlSiClKCaCrMnFeZn
General chemical composition17.9916.651.070.721.800.79 8.93 2.7931.2318.03
Figure 9A_A6.7616.182.951.771.65 8.811.596.5038.8814.90
Figure 9A_B5.1917.700.751.042.45 3.99 1.8660.166.86
Figure 9B_A6.4836.33 12.76 1.6942.75
Figure 9B_B8.9417.521.581.045.72 4.54 5.1147.907.65
General chemical composition at 550 °C19.2415.810.790.561.871.12 8.86 2.4632.3416.96
Figure 9D_A11.6723.501.880.531.940.550.377.420.861.8615.8933.55
Figure 9D_B 10.320.95 1.82 4.20 3.2367.1712.31
Figure 9D_C 12.97 3.671.5820.77 3.8057.22
Table 11. Transformation temperature from TG-DSC of combustion chamber thermal analysis.
PEAK TEMPERATURE (°C)MASS LOSS (%)TRANSFORMATION
1770.334Zeolite dehydroxylation
6901.551Calcite calcining
11202.759Melting
Table 12. Recipes of the agglomerates produced and tested at RWTH and UOulu (composition in wt%).
RECIPEPPGSOCFCCDCARBONFIBRESSTARCH 2301 DDSTARCH 6501 XCWATER
MA604CSC46.434.1-10.3--9.2-
MA604BSC46.033.8-10.20.9-9.2-
MA604BBC46.033.8-10.20.9-9.2-
CC03SC-34.434.114.9-9.7 7.0
CC02ABC-36.235.915.60.9 4.07.4
UO-43.133.8-10.21.9-11.0-
PP: press parameter; GS: grinding sludge; OCF: oxy-cutting fines; CCD: combustion chamber dust.
Table 13. Cold compression strength (average of four tests) of the agglomerates produced and tested at RWTH.
RECIPEPPMANUFACTURING PRESSURE (N/mm2)
10203040
MA604CSC73.980.284.583.2
MA604BSC53.6 84.4
MA604BBC42.838.540.034.4
CC03SC18.621.623.822.8
CC02ABC46.449.152.351.9
Table 14. Compression test results after 2 and 7 days.
BRIQUETTETESTCOMPRESSION TEST RESULT (N)STRENGTH (N/mm2)
21S11W02-day compression test34,156.2017.05
23S11W07-day compression test45,476.5922.70
Table 15. Two-day drop test (from 1 m height) and 7-day drop test (from 5 m height).
BRIQUETTE 22—7-DAY DROP TEST (5 M)
No of dropsOriginal mass11020304050
Mass (g)185.72185.38182.16155.49145.15122.6107.59
Mass loss (%)-0.181.9216.2821.8433.9942.07
BRIQUETTE 20—2-DAY DROP TEST (1 M)
Mass (g)193.2193.1192.8192.5192191.8191.5
Mass loss (%)-0.050.210.360.620.720.88
Table 16. LECO analysis.
BRICK 1BRICK 2BRICK 3BRICK 4
C (%)S (%)C (%)S (%)C (%)S (%)C (%)S (%)
BRICK X PIECE 115.50.17614.50.14814.90.1515.30.17
BRICK X PIECE 2150.16514.70.15515.10.15815.20.164
BRICK X PIECE 315.20.15914.80.1714.90.16315.20.16
BRICK X PIECE 4150.1414.80.161150.15150.153
BRICK X PIECE 514.90.155150.16414.80.14315.40.17
MEAN (%)15.10.1614.80.1614.90.1515.20.16
SD (%)0.20.010.20.010.10.010.10.01
RSD (%)1.47.451.14.730.74.560.93.94

