Experimental Investigation on Relations Between Impact Resistance and Tensile Properties of Cement-Based Materials Reinforced by Polyvinyl Alcohol Fibers

Abstract
:1. Introduction
2. Experimental Program
2.1. Materials
2.2. Specimen Preparation
2.3. Test Methods
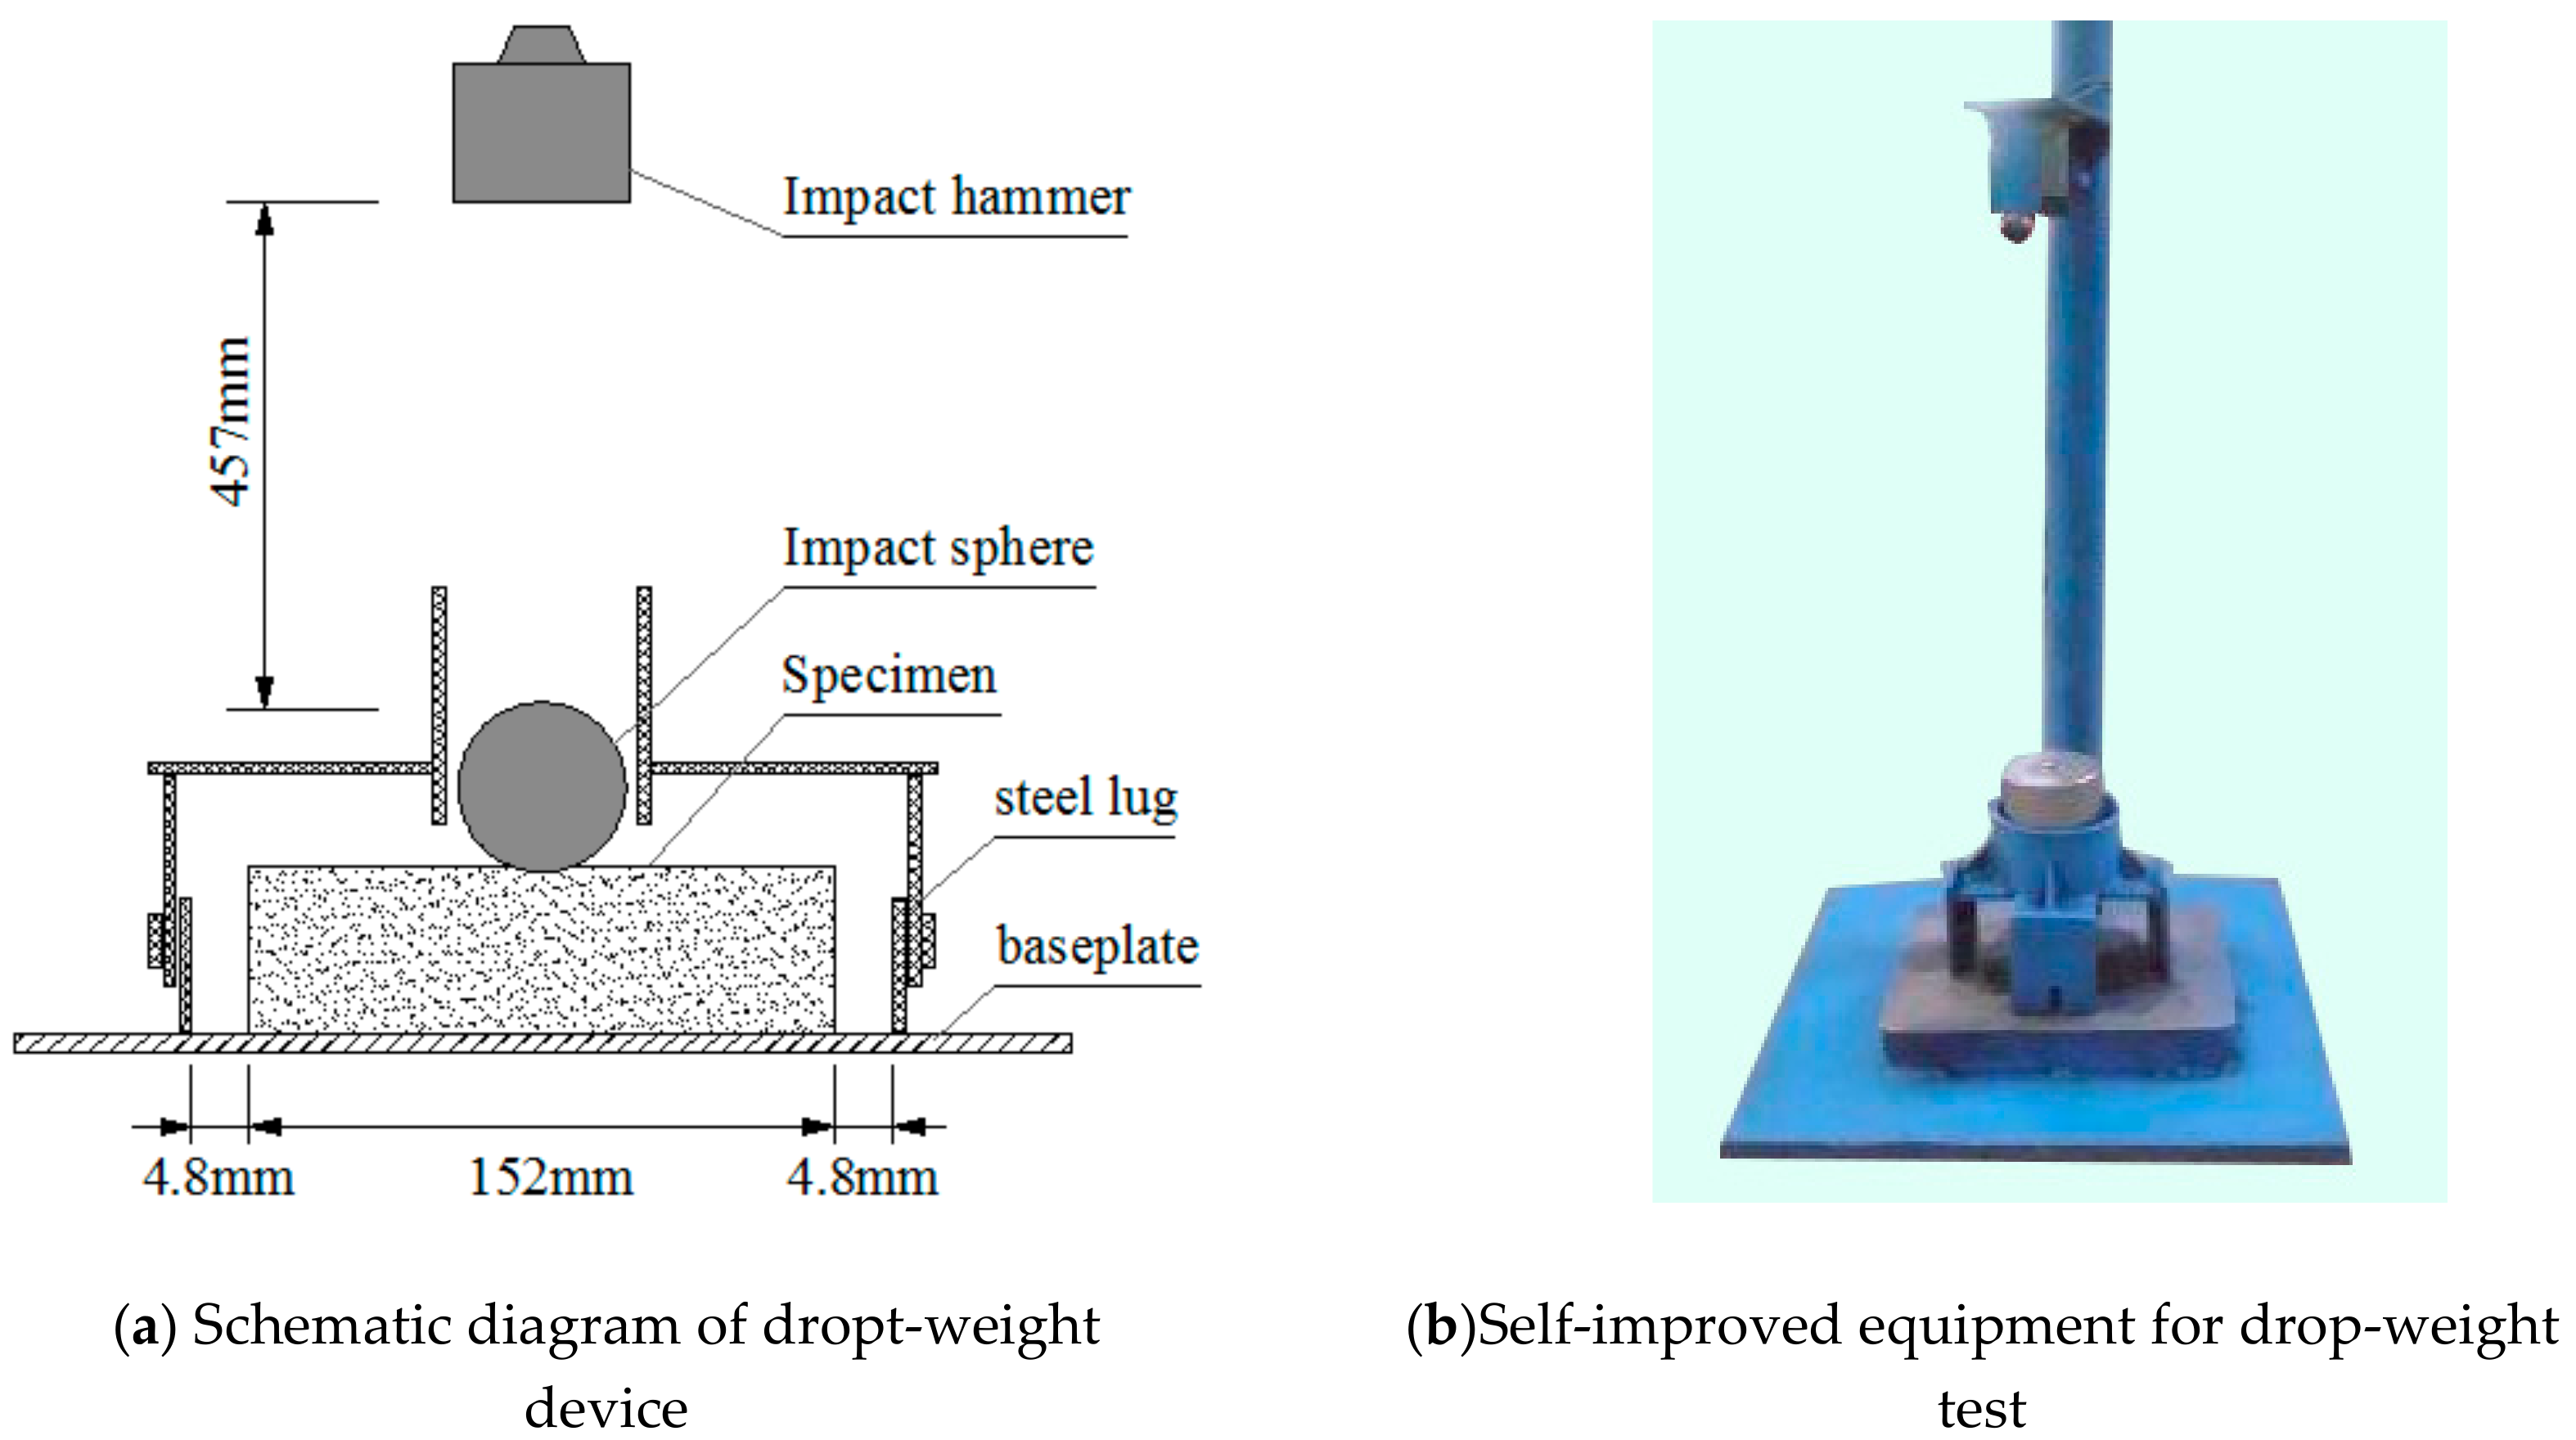
2.3.1. Drop-Weight Test
2.3.2. Uniaxial Tension Test
3. Drop-Weight Test Results and Analysis
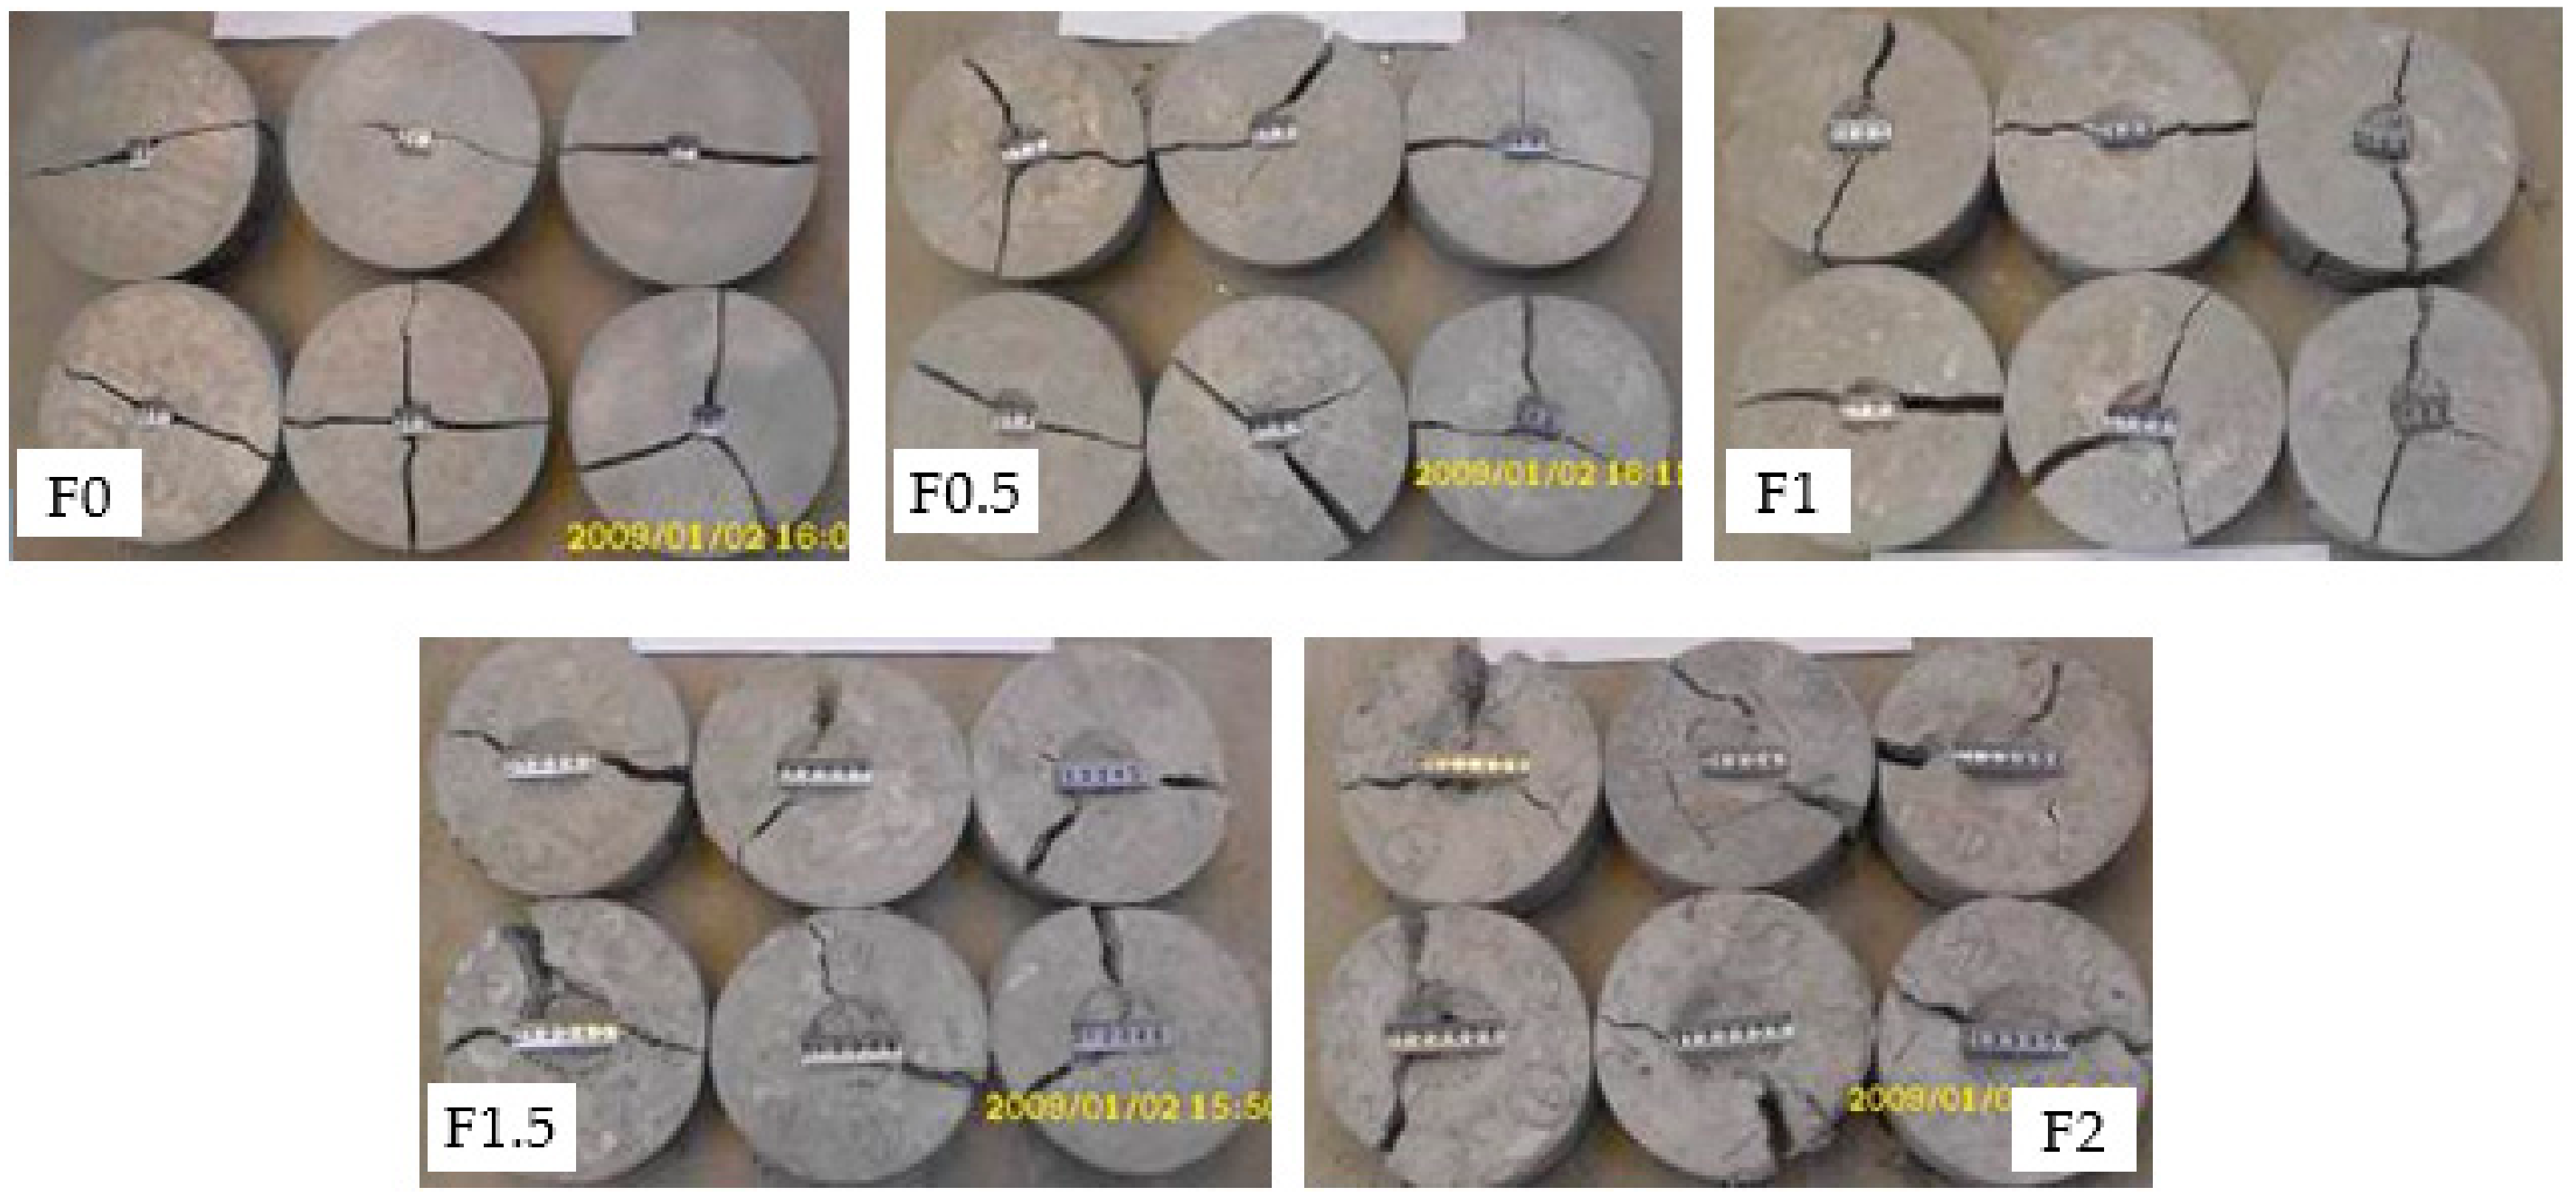
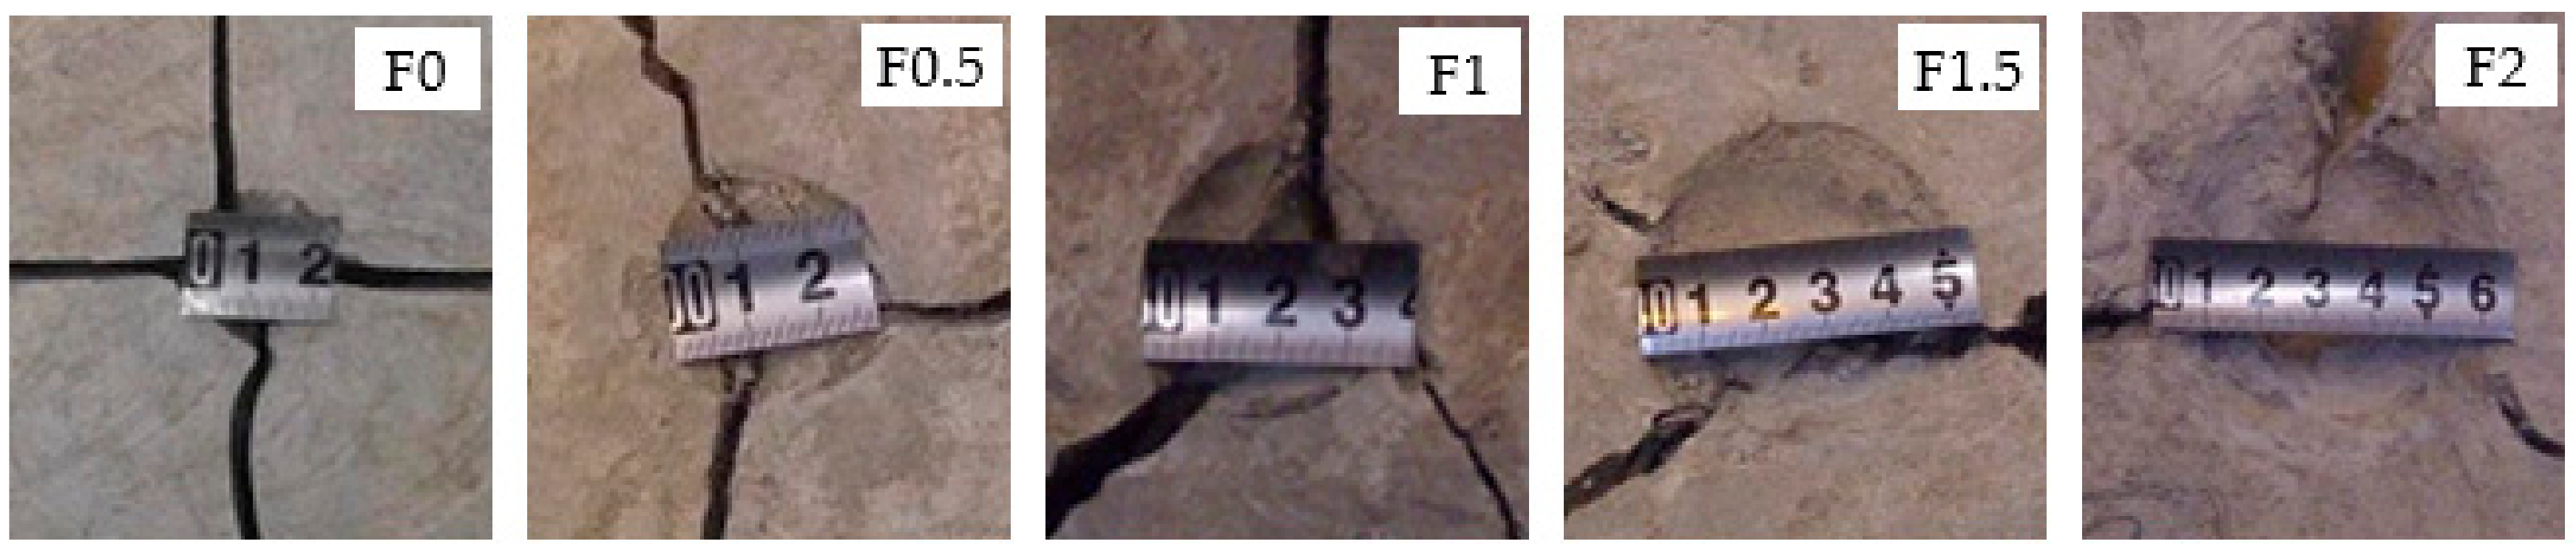
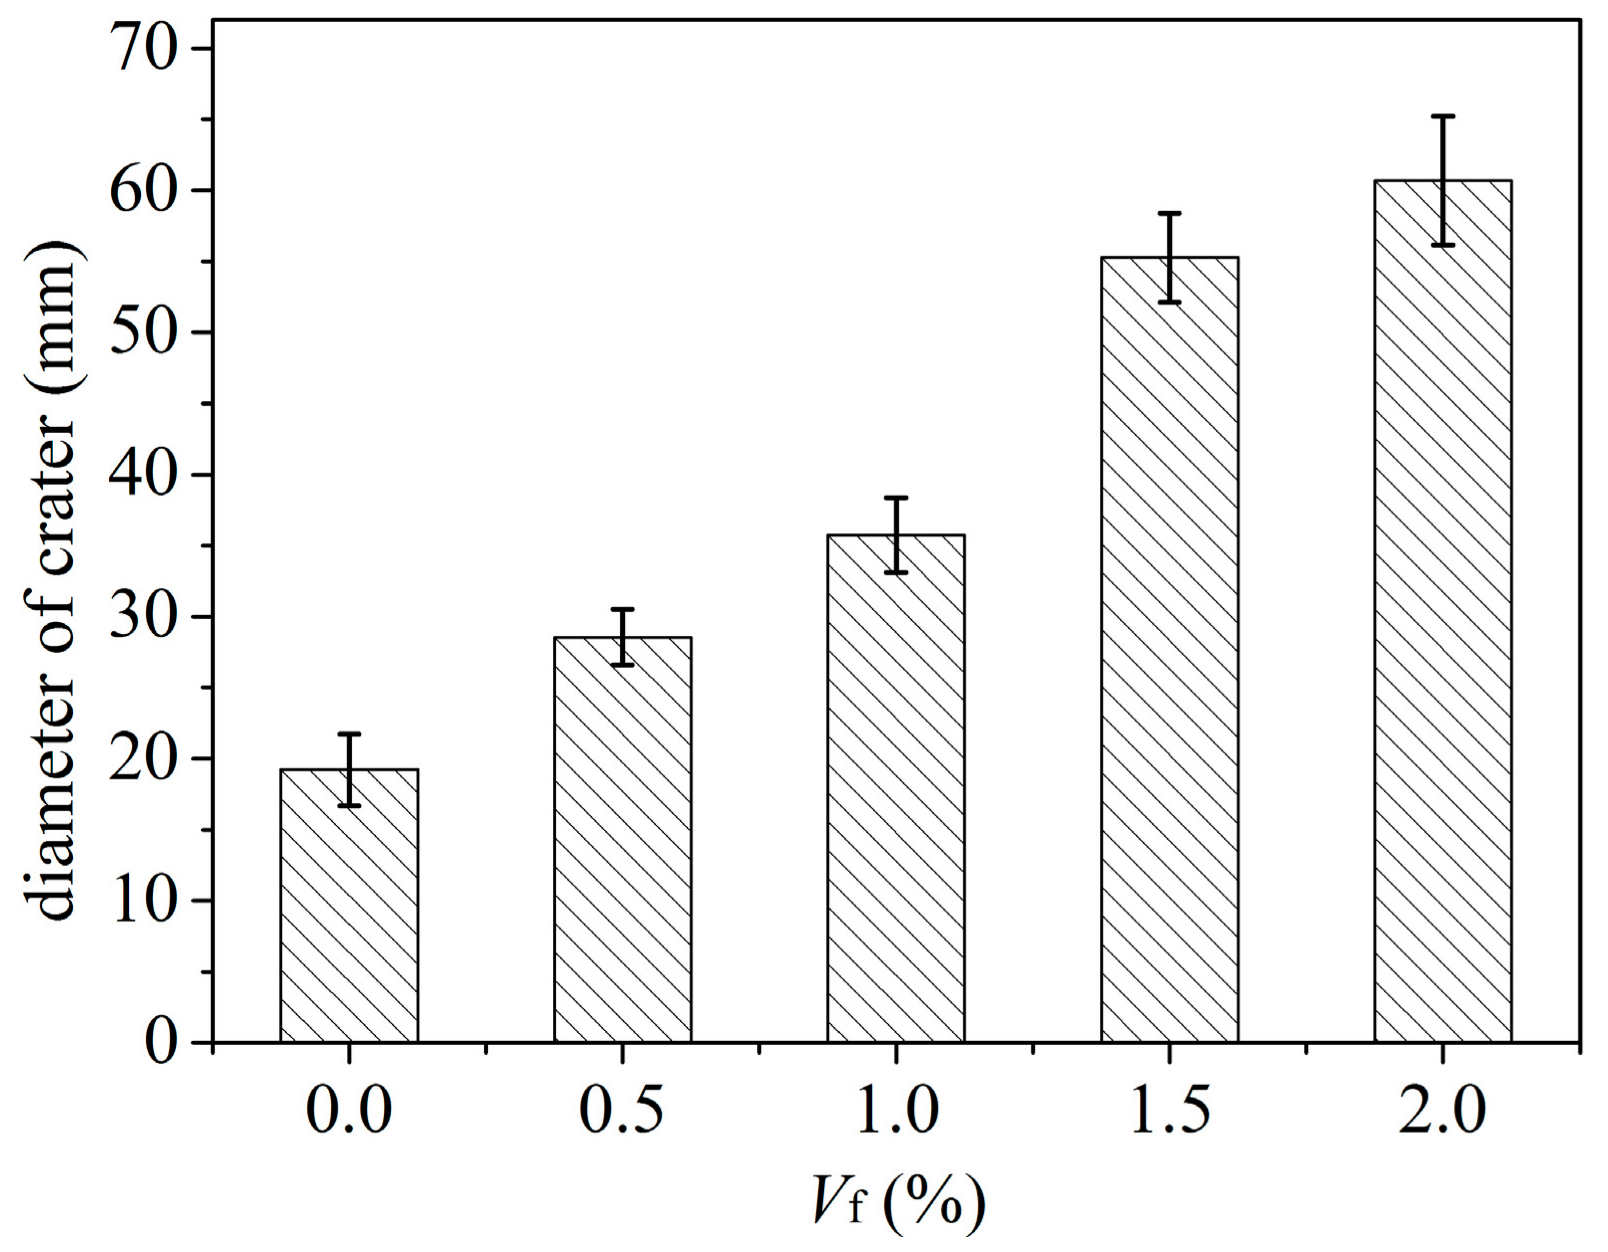
3.1. Failure Patterns
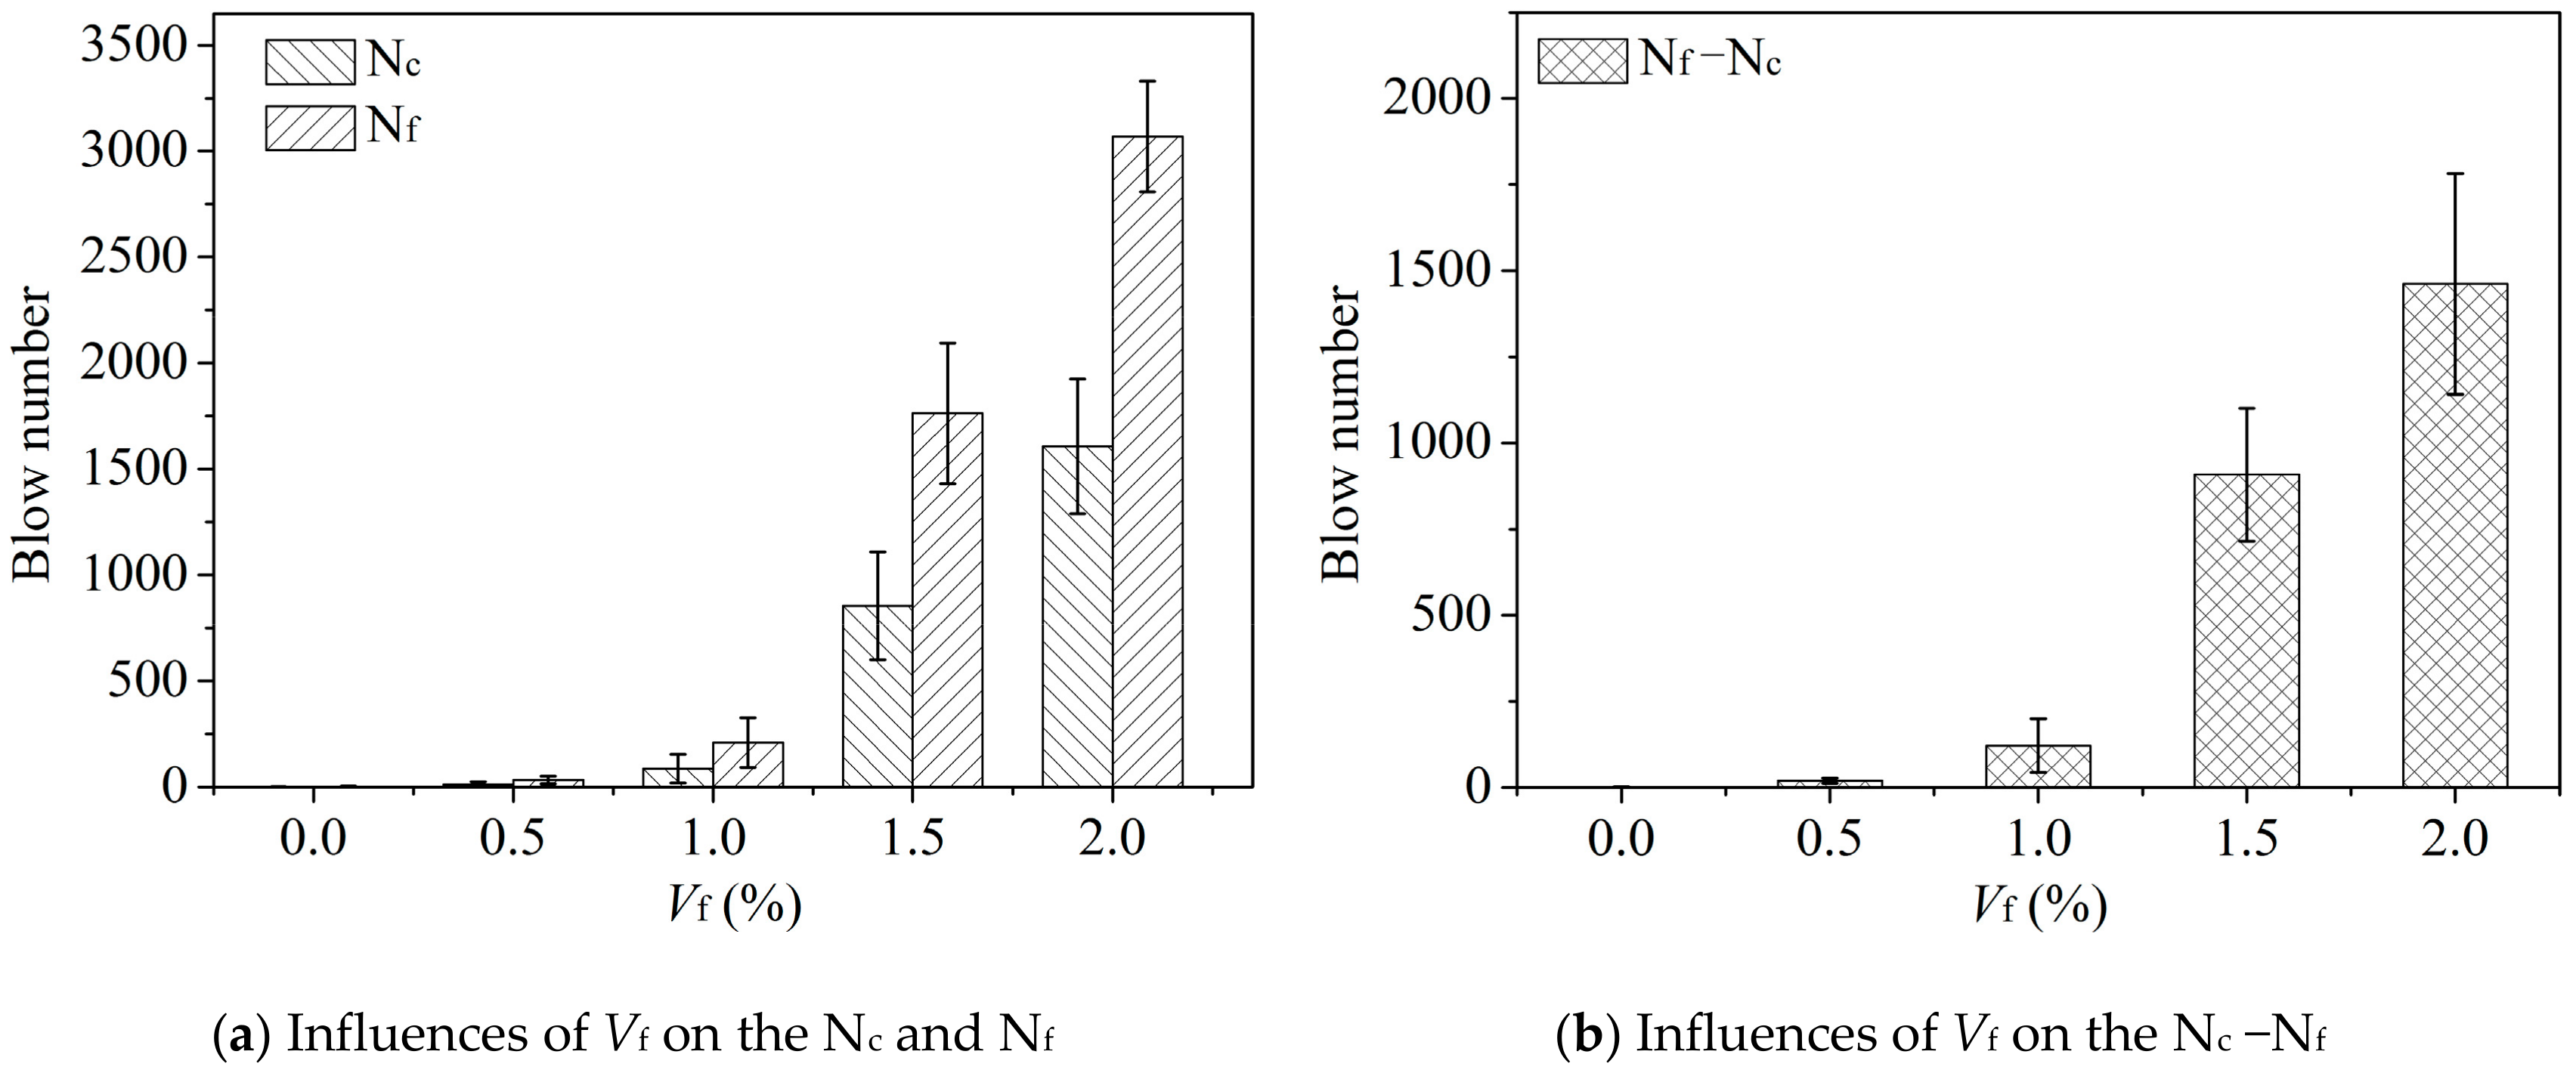
3.2. Blow Numbers
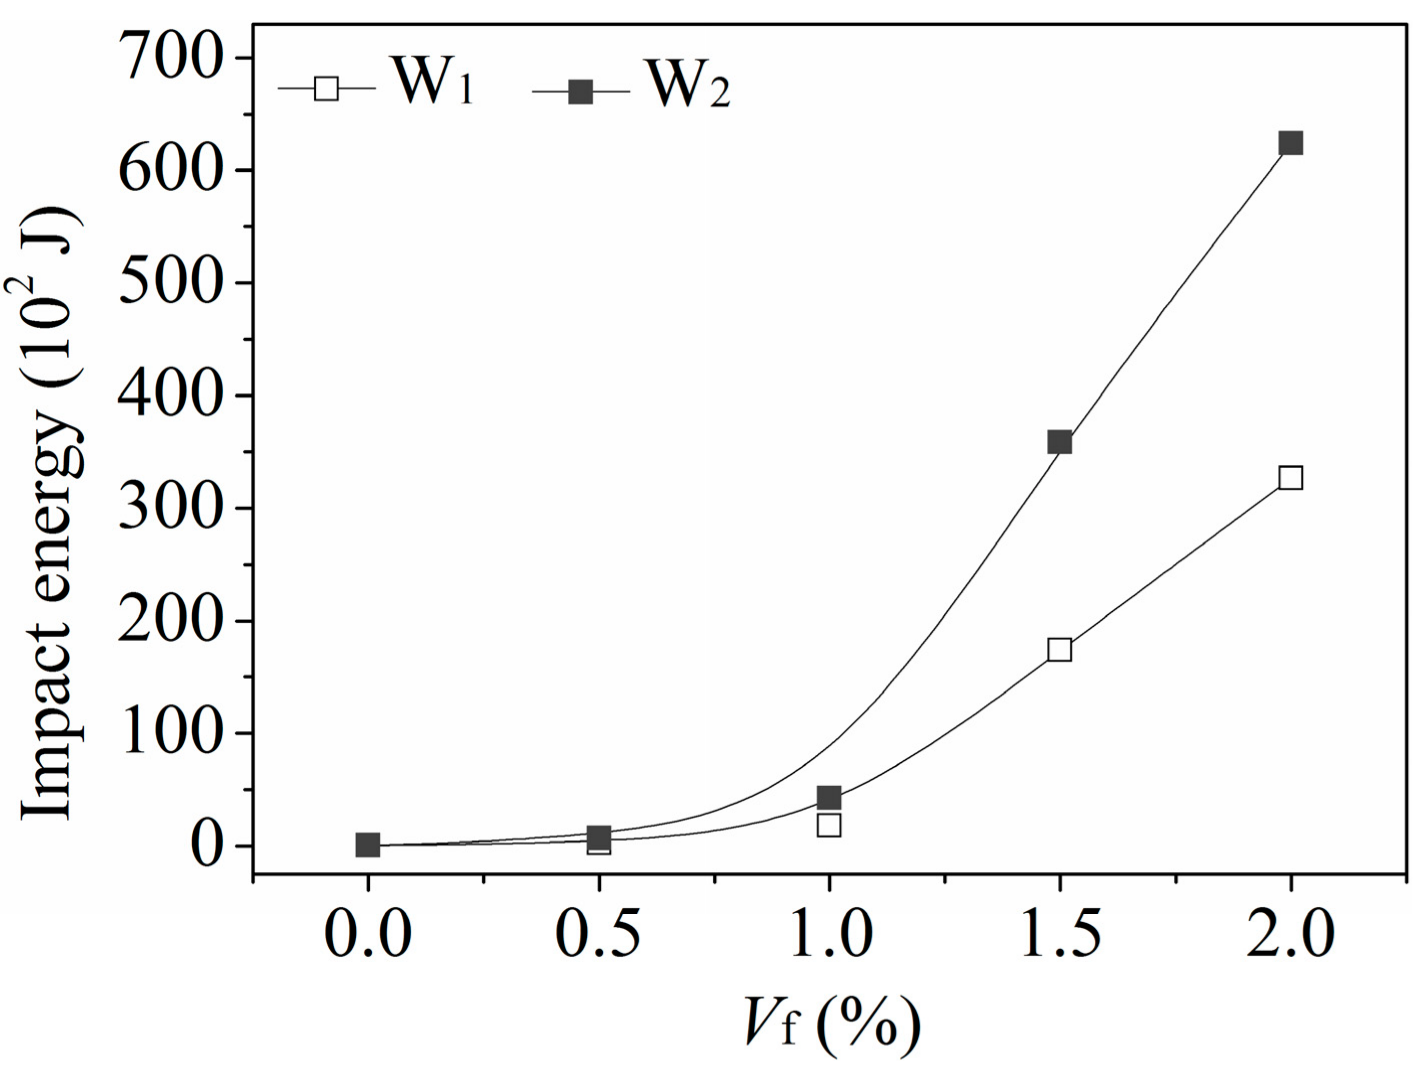
3.3. Impact Energy
4. Uniaxial Tension Test Results and Analysis
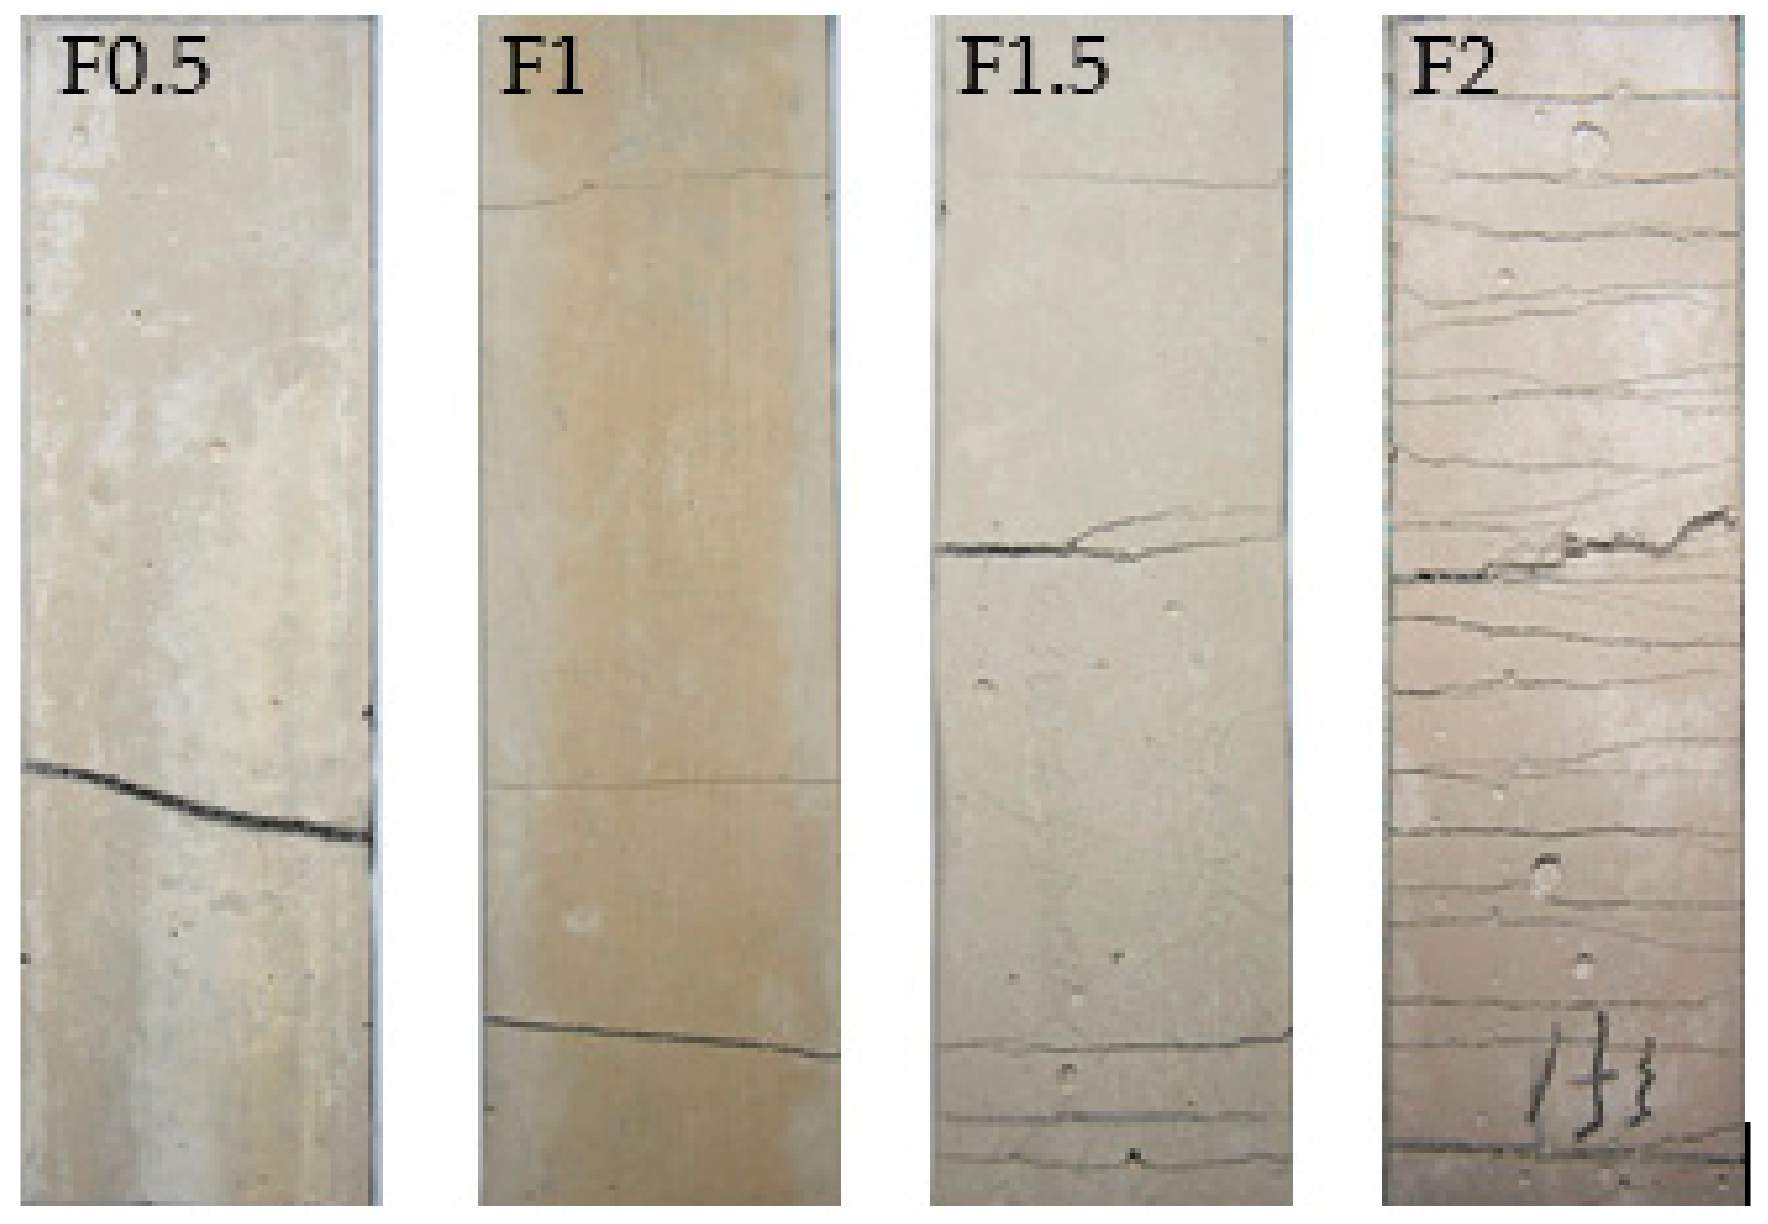
4.1. Crack Pattern under Uniaxial Tension
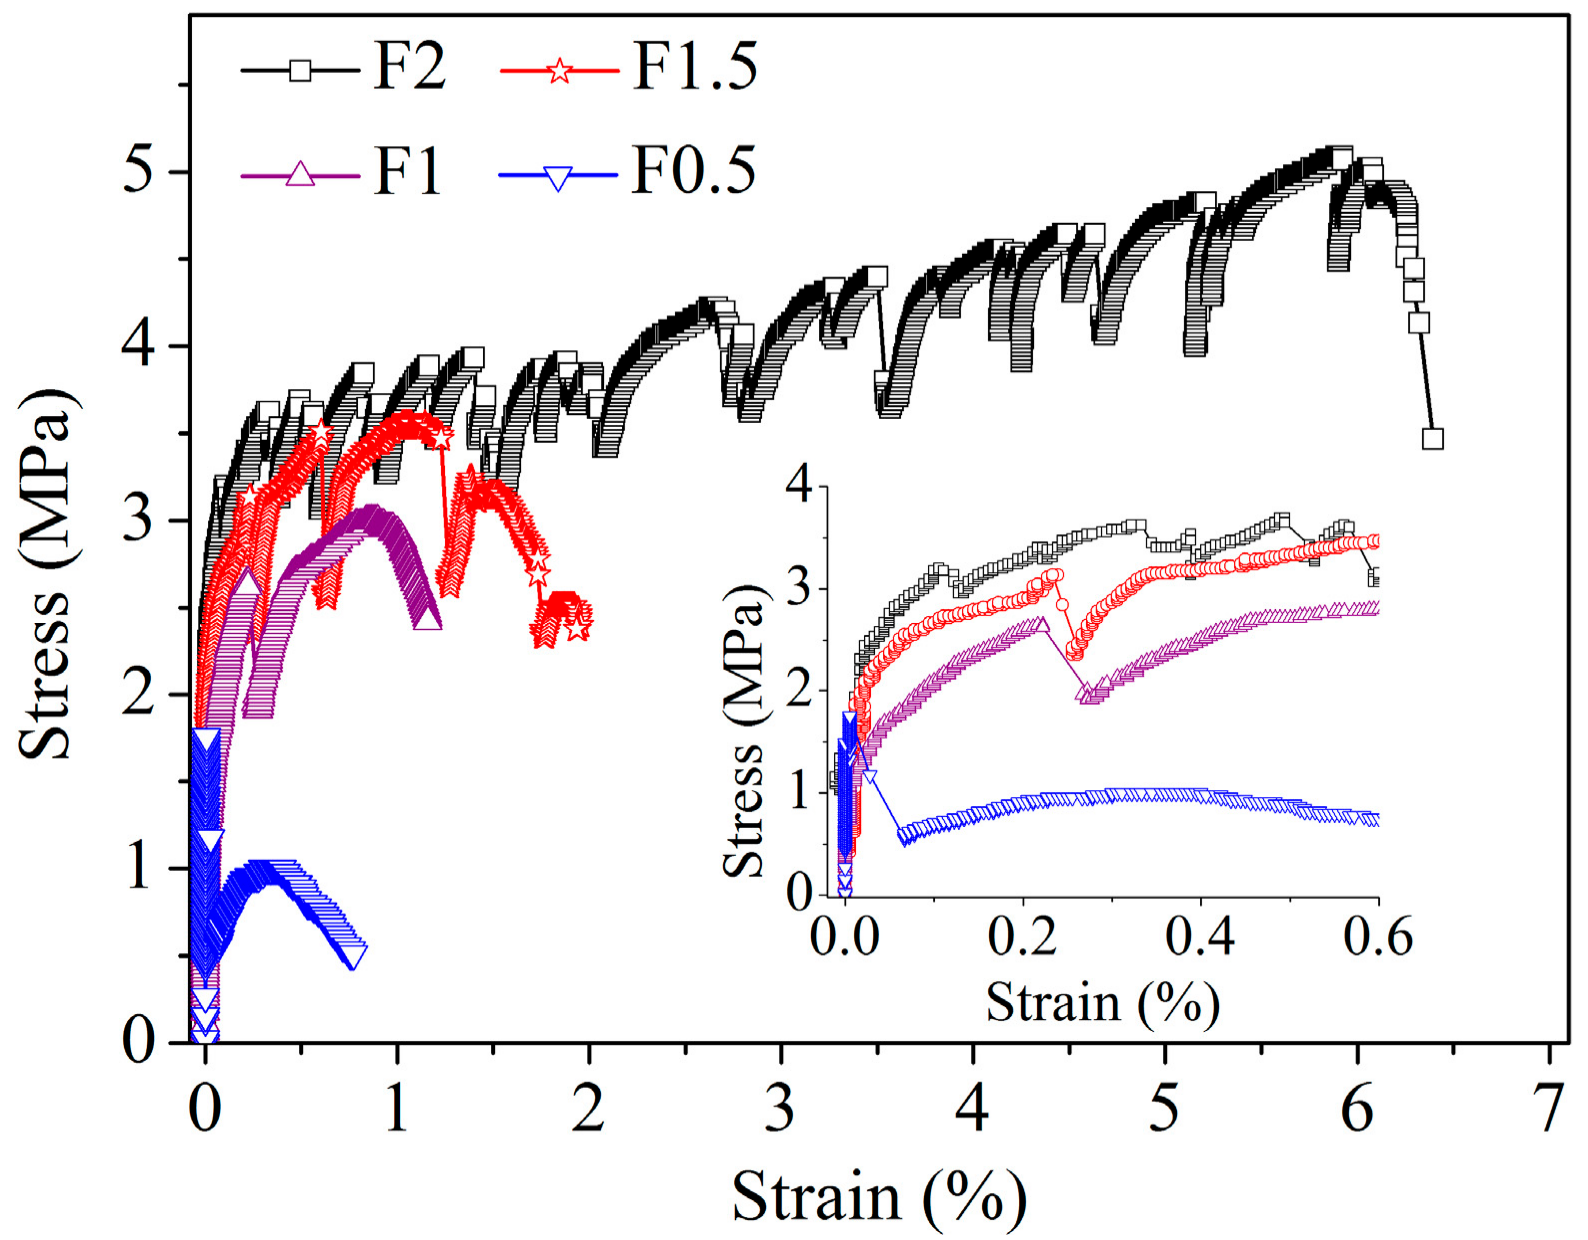
4.2. Stress–Strain Curves under Uniaxial Tension
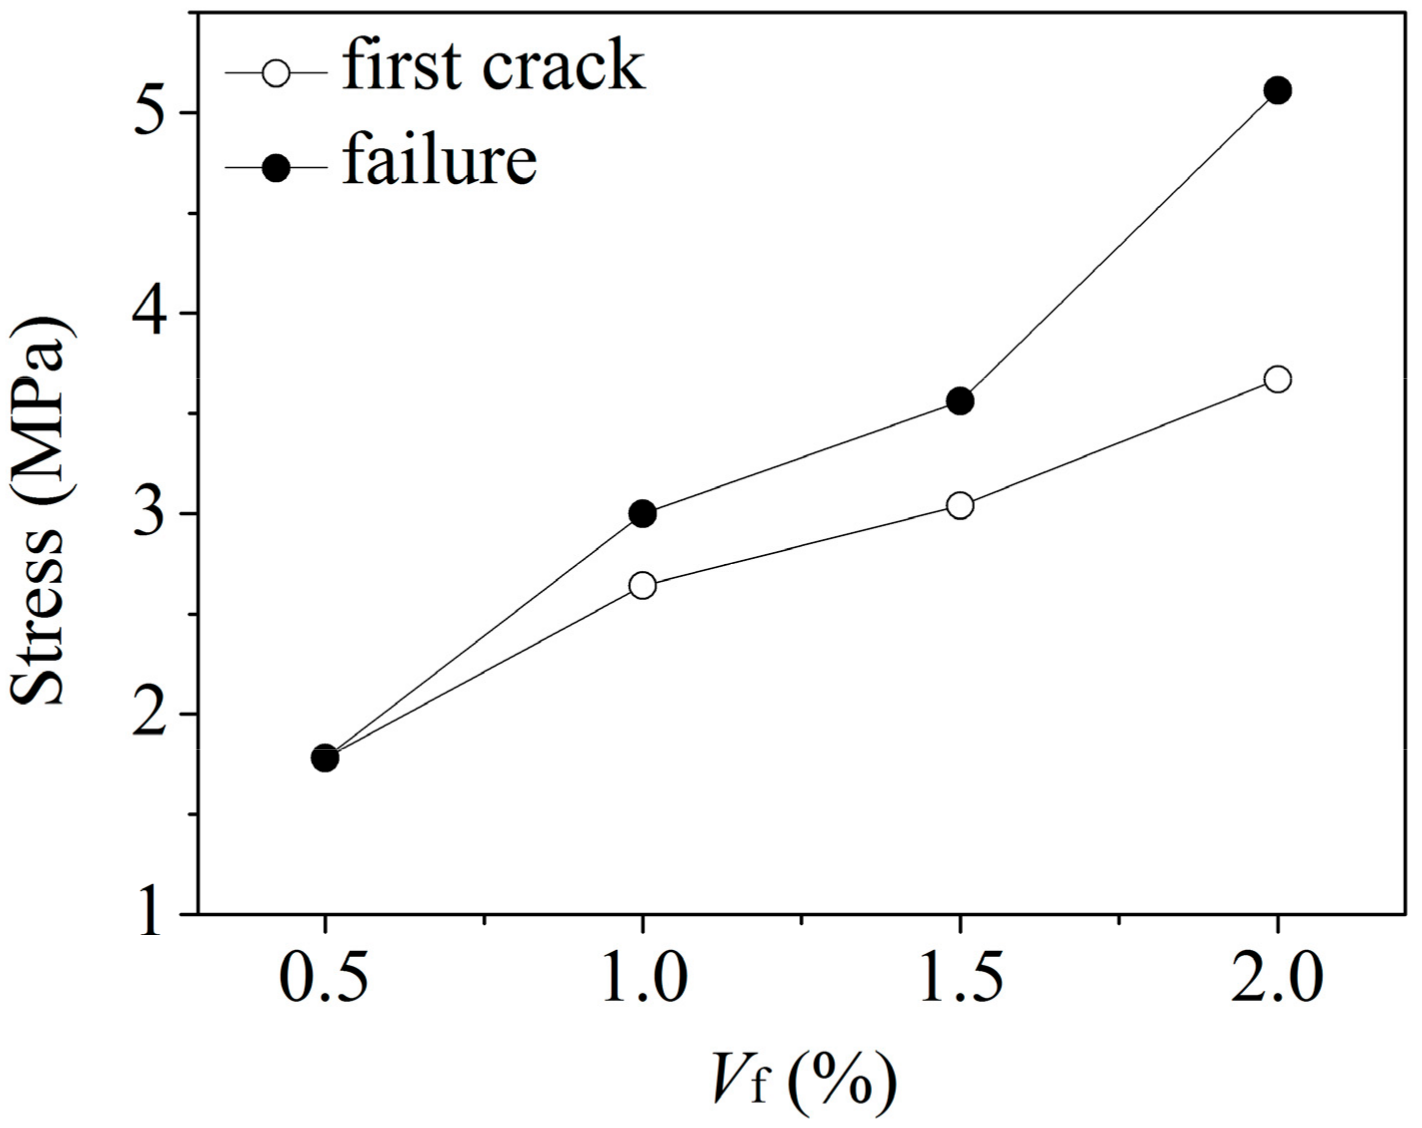
4.3. Influence of Vf on Strain and Stress
4.4. Criteria on the First Crack and Failure
5. Relations between Impact Resistance and Tensile Properties
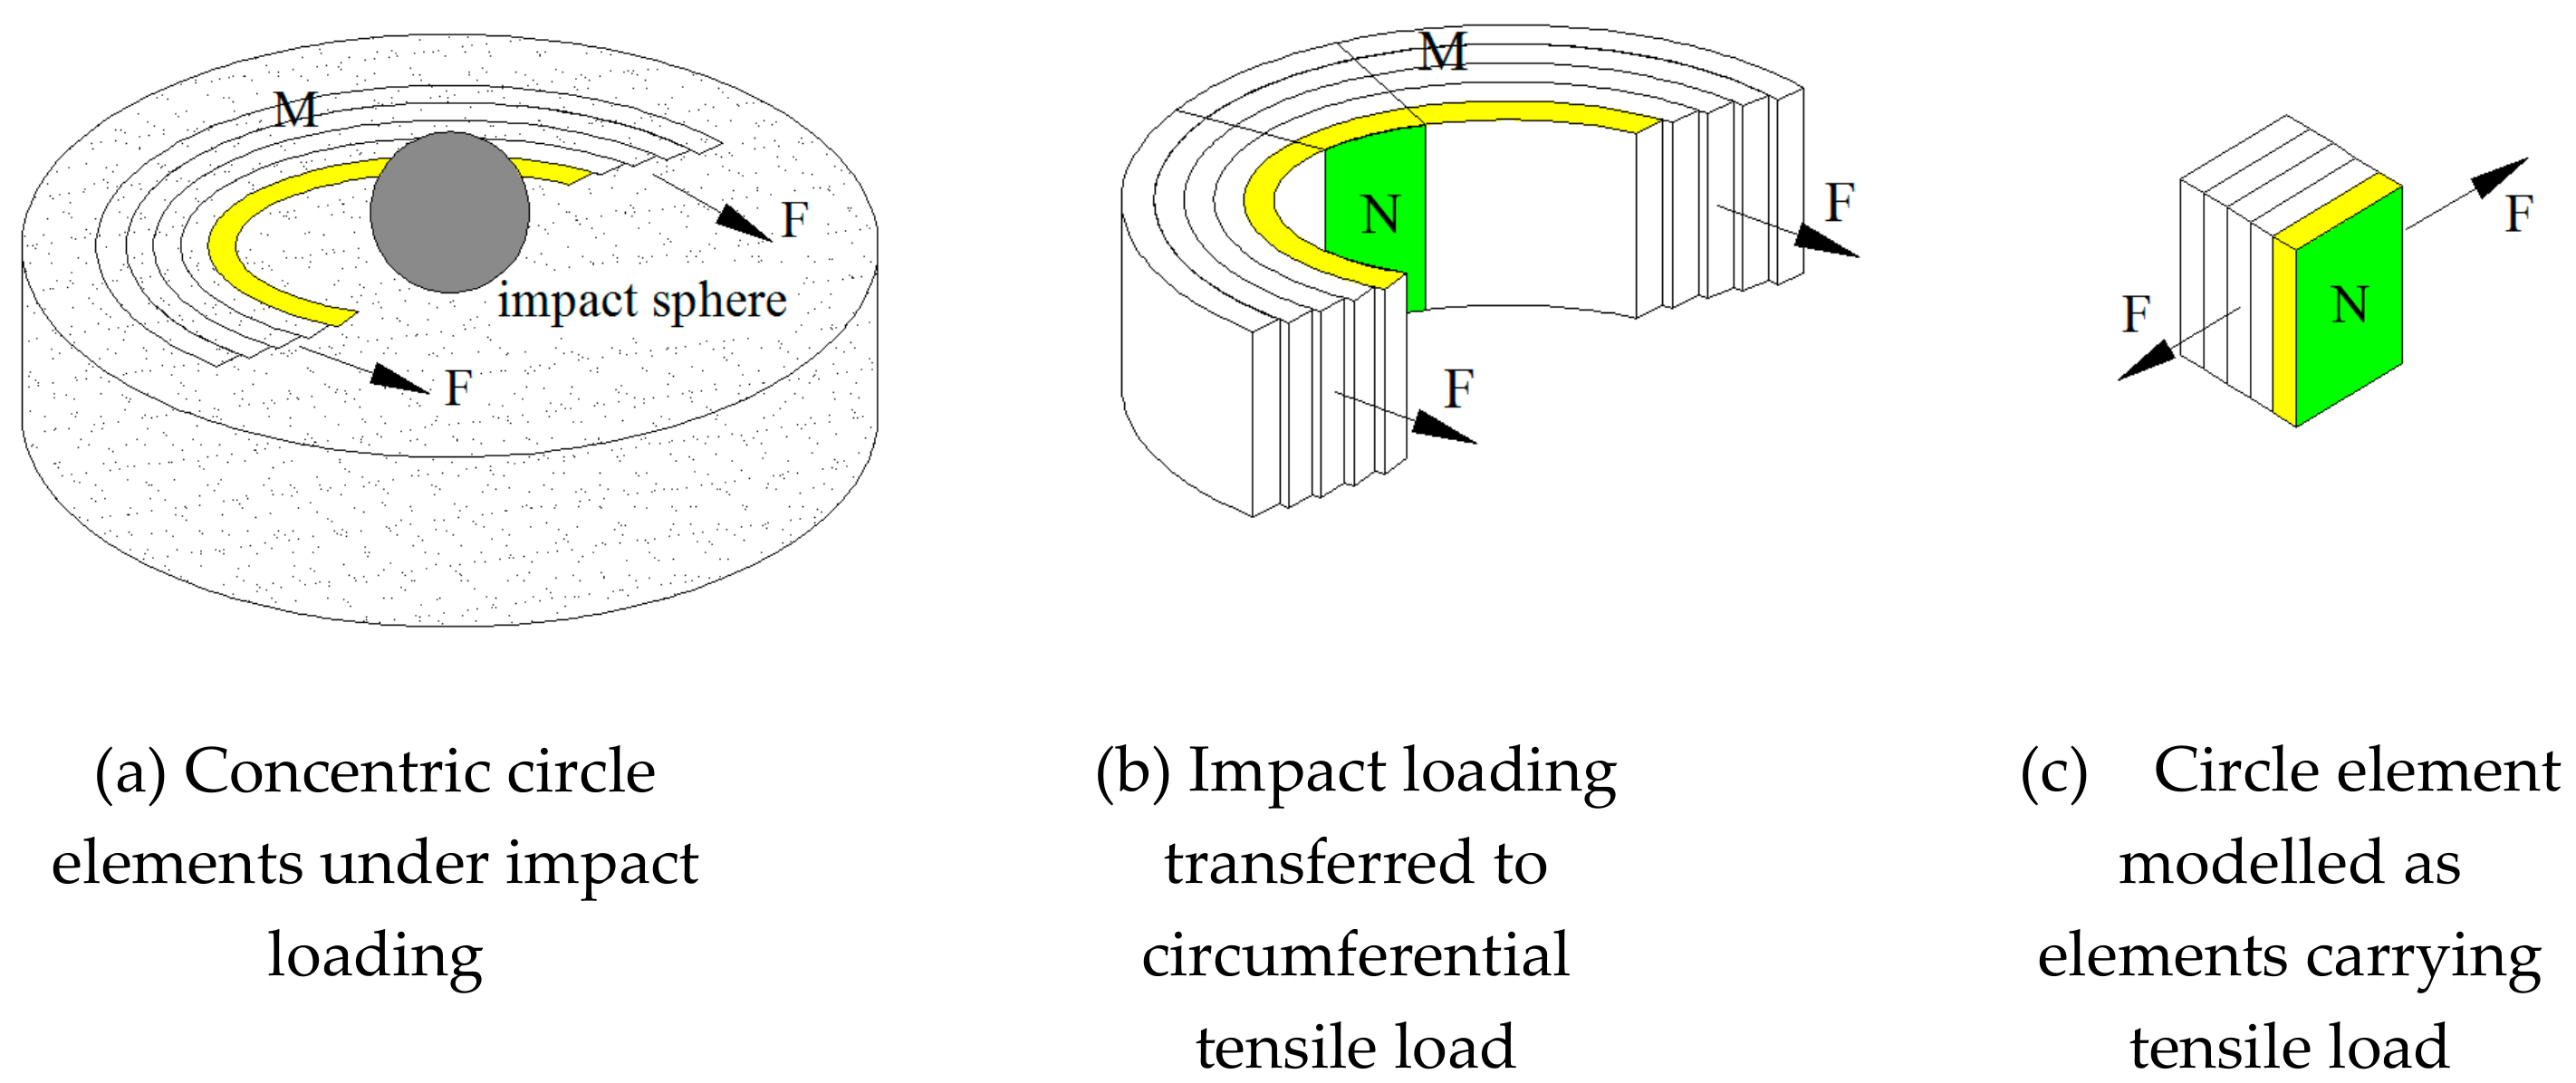
5.1. Impact Failure Analysis Based on the Tensile Properties
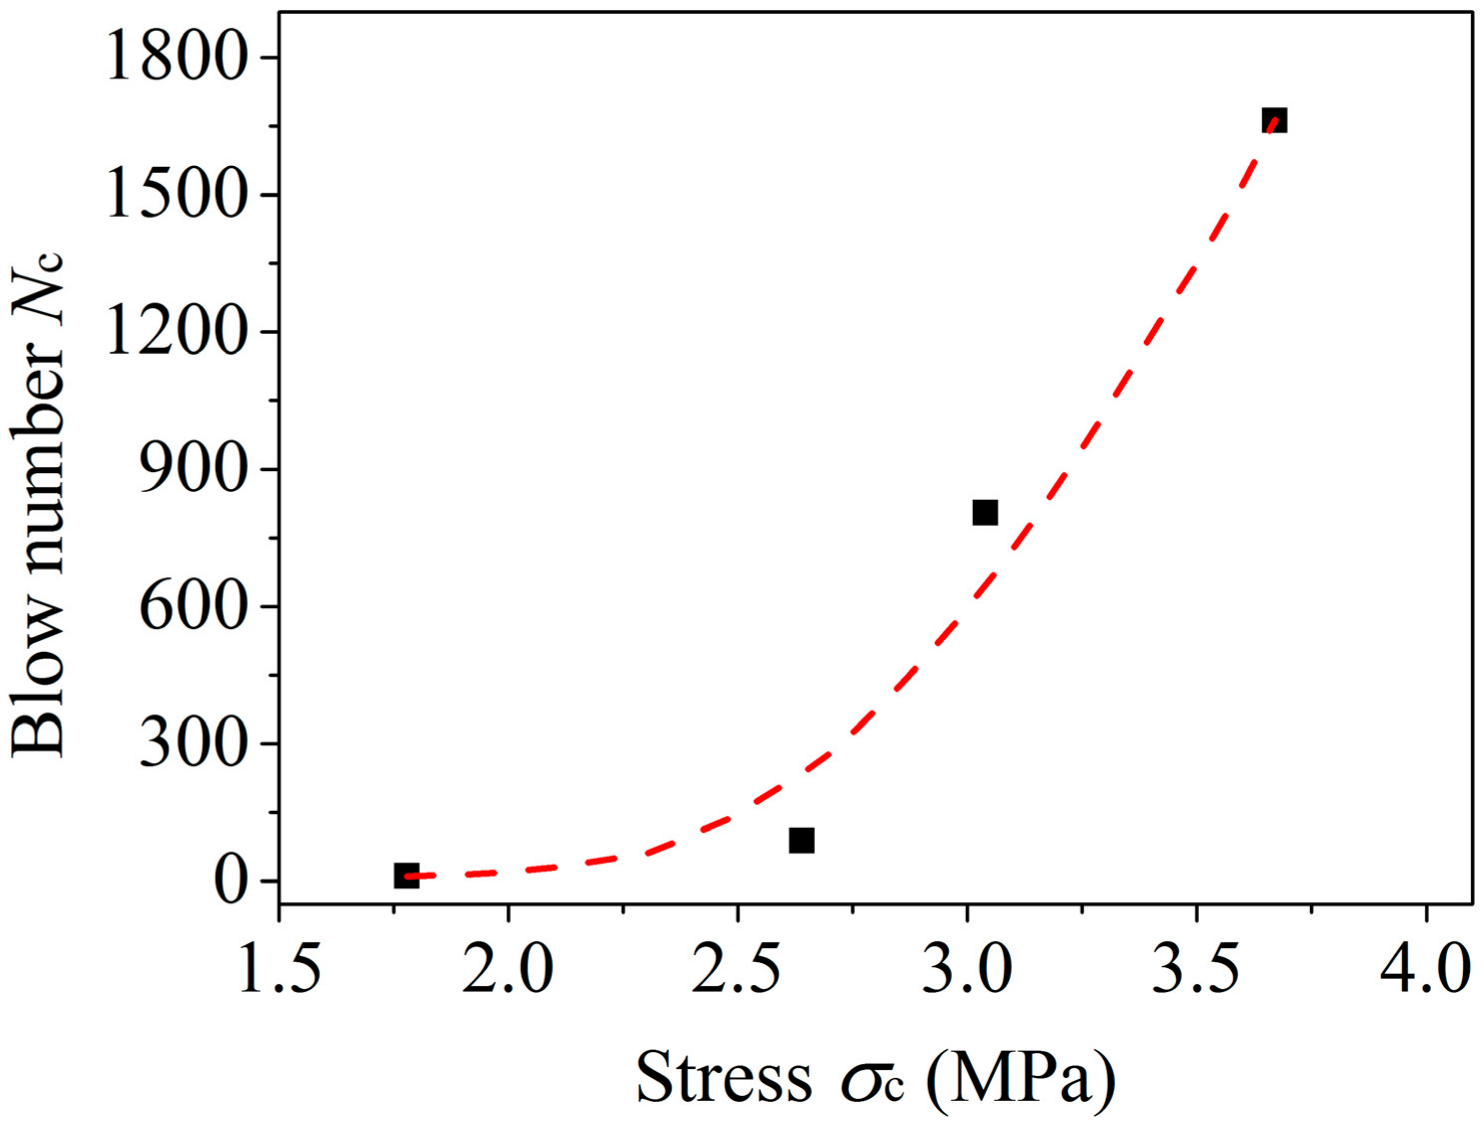
5.2. Relation between Blow Number Nc and Stress σc
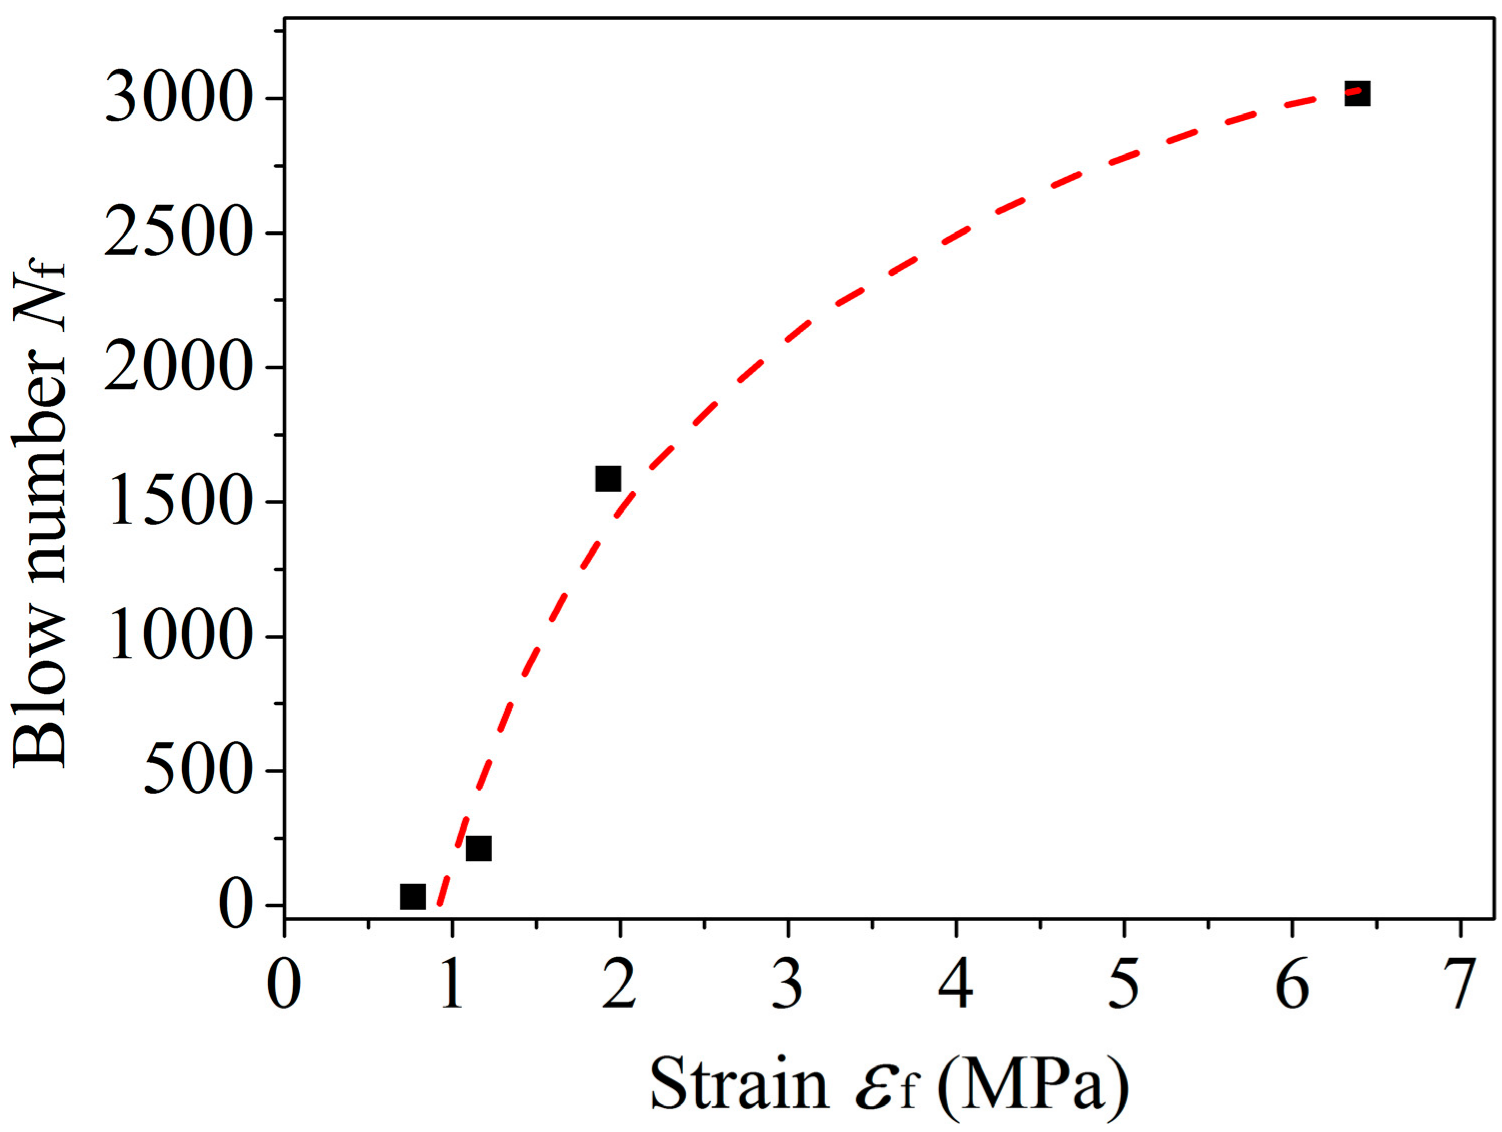
5.3. Relation between Blow Number Nf and Strain εf
6. Conclusions
Author Contributions
Funding
Acknowledgments
Conflicts of Interest
References
- Rajput, A.; Iqbal, M.A. Impact behavior of plain, reinforced and prestressed concrete targets. Mater. Des. 2017, 114, 459–474. [Google Scholar] [CrossRef]
- Gupta, T.; Sharma, R.K.; Chaudhary, S. Impact resistance of concrete containing waste rubber fiber and silica fume. Int. J. Impact Eng. 2015, 83, 76–87. [Google Scholar] [CrossRef]
- Rahmani, T.; Kiani, B.; Shekarchi, M.; Safari, A. Statistical and experimental analysis on the behavior of fiber reinforced concretes subjected to drop weight test. Constr. Build. Mater. 2012, 37, 360–369. [Google Scholar] [CrossRef]
- Nataraja, M.C.; Nagaraj, T.S.; Basavaraja, S.B. Reproportioning of steel fibre reinforced concrete mixes and their impact resistance. Cem. Concr. Res. 2005, 35, 2350–2359. [Google Scholar] [CrossRef]
- Wang, H.T.; Wang, L.C. Experimental study on static and dynamic mechanical properties of steel fiber reinforced lightweight aggregate concrete. Constr. Build. Mater. 2013, 38, 1146–1151. [Google Scholar] [CrossRef]
- Wang, L.; Wang, H.; Jia, J. Impact resistance of steel-fibre-reinforced lightweight-aggregate concrete. Mag. Concr. Res. 2009, 61, 539–547. [Google Scholar] [CrossRef]
- Mastali, M.; Dalvand, A. The impact resistance and mechanical properties of self-compacting concrete reinforced with recycled CFRP pieces. Compos. Part B Eng. 2016, 92, 360–376. [Google Scholar] [CrossRef]
- Mastali, M.; Dalvand, A.; Sattarifard, A.R. The impact resistance and mechanical properties of reinforced self-compacting concrete with recycled glass fibre reinforced polymers. J. Clean. Prod. 2016, 124, 312–324. [Google Scholar] [CrossRef]
- Kim, M.J.; Kim, S.; Lee, S.K.; Kim, J.H.; Lee, K.; Yoo, D.Y. Mechanical properties of ultra-high-performance fiber-reinforced concrete at cryogenic temperatures. Constr. Build. Mater. 2017, 157, 498–508. [Google Scholar] [CrossRef]
- Li, Z.X.; Li, C.H.; Shi, Y.D.; Zhou, X.J. Experimental investigation on mechanical properties of Hybrid Fibre Reinforced Concrete. Constr. Build. Mater. 2017, 157, 930–942. [Google Scholar] [CrossRef]
- Sorelli, L.G.; Meda, A.; Plizzari, G.A. Bending and uniaxial tensile tests on concrete reinforced with hybrid steel fibers. J. Mater. Civ. Eng. 2005, 17, 519–527. [Google Scholar] [CrossRef]
- Zhang, Y.H.; Zhang, Z.P.; Liu, Z.C. Graphite coated PVA fibers as the reinforcement for cementitious composites. Mater. Res. Express. 2018, 5, 025206. [Google Scholar] [CrossRef]
- Li, V.C.; Wang, S.X.; Wu, C. Tensile strain-hardening behavior of polyvinyl alcohol engineered cementitious composite (PVA-ECC). ACI Mater. J. 2001, 98, 483–492. [Google Scholar]
- Li, V.C.; Wu, C.; Wang, S.X.; Ogawa, A.; Saito, T. Interface tailoring for strain-hardening polyvinyl alcohol engineered cementitious composite (PVA-ECC). ACI Mater. J. 2002, 99, 463–472. [Google Scholar]
- Nematollahi, B.; Sanjayan, J.; Shaikh, F.U.A. Tensile strain hardening behavior of PVA fiber-reinforced engineered geopolymer composite. J. Mater. Civ. Eng. 2015, 27, 04015001. [Google Scholar] [CrossRef]
- Li, H.D.; Xu, S.L.; Leung, C.K.Y. Tensile and flexural properties of ultra high toughness cemontious composite. J. Wuhan Univ. Technol. Mater. Sci. Ed. 2009, 24, 483–492. [Google Scholar] [CrossRef]
- Yang, E.H.; Li, V.C. Tailoring engineered cementitious composites for impact resistance. Cem. Concr. Res. 2012, 42, 1066–1071. [Google Scholar] [CrossRef]
- Toutanji, H.; Xu, B.; Gilbert, J.; Lavin, T. Properties of poly(vinyl alcohol) fiber reinforced high-performance organic aggregate cementitious material: Converting brittle to plastic. Constr. Build. Mater. 2010, 24, 1–10. [Google Scholar] [CrossRef]
- Xu, B.; Toutanji, H.A.; Gilbert, J. Impact resistance of poly(vinyl alcohol) fiber reinforced high-performance organic aggregate cementitious material. Cem. Concr. Res. 2010, 40, 347–351. [Google Scholar] [CrossRef]
- Mechtcherine, V.; Millon, O.; Butler, M.; Thoma, K. Mechanical behaviour of strain hardening cement-based composites under impact loading. Cem. Concr. Compos. 2011, 33, 1–11. [Google Scholar] [CrossRef]
- Curosu, I.; Mechtcherine, V.; Millon, O. Effect of fiber properties and matrix composition on the tensile behavior of strain-hardening cement-based composites (SHCCs) subject to impact loading. Cem. Concr. Res. 2016, 82, 23–35. [Google Scholar] [CrossRef]
- Atahan, H.N.; Pekmezci, B.Y.; Tuncel, E.Y. Behavior of PVA fiber-reinforced cementitious composites under static and impact flexural effects. J. Mater. Civ. Eng. 2013, 25, 1438–1445. [Google Scholar] [CrossRef]
- Batista, R.P.; Trindade, A.C.C.; Borges, P.H.R.; Silva, F.D. Silica Fume as Precursor in the Development of Sustainable and High-Performance MK-Based Alkali-Activated Materials Reinforced with Short PVA Fibers. Front. Mater. 2019, 6. [Google Scholar] [CrossRef]
- Arain, M.F.; Wang, M.X.; Chen, J.Y.; Zhang, H.P. Study on PVA fiber surface modification for strain-hardening cementitious composites (PVA-SHCC). Constr. Build. Mater. 2019, 197, 107–116. [Google Scholar] [CrossRef]
- Du, Q.; Wei, J.; Lv, J. Effects of High Temperature on Mechanical Properties of Polyvinyl Alcohol Engineered Cementitious Composites (PVA-ECC). Int. J. Civ. Eng. 2018, 16, 965–972. [Google Scholar] [CrossRef]
- Bao, W.B.; Wang, C.H.; Zhang, S.F.; Huang, Z.Q. Experimental study on mechanical properties of PVA fiber reinforced tailings cementitious composites. Architect. Urb. Develop. 2012, 598, 618–621. [Google Scholar] [CrossRef]
- Salami, B.A.; Johari, M.A.M.; Ahmad, Z.A.; Maslehuddin, M. Durability performance of Palm Oil Fuel Ash-based Engineered Alkaline-Activated Cementitious Composite (POFA-EACC) mortar in sulfate environment. Constr. Build. Mater. 2017, 131, 229–244. [Google Scholar] [CrossRef]
- Sherir, M.A.A.; Hossain, K.M.A.; Lachemi, M. Fresh state, mechanical & durability properties of strain hardening cementitious composite produced with locally available aggregates and high volume of fly ash. Constr. Build. Mater. 2018, 189, 253–264. [Google Scholar] [CrossRef]
- Baral, K.; Tatar, J.; Zhang, Q. High-Performance Impact-Resistant Concrete Mixture for Transportation Infrastructure Applications. Transp. Res. Rec. 2019. [Google Scholar] [CrossRef]
- Halvaei, M.; Jamshidi, M.; Latifi, M.; Behdooj, Z. Application of Low Modulus Polymeric Fibers as Reinforcement in Engineered Cementitious Composite (ECC). In Proceedings of the 7th Asian Symposium on Polymers in Concrete, Istanbul, Turkey, 3–5 October 2012; pp. 787–794. [Google Scholar]


| Type | Diameter (mm) | Length (mm) | Nominal Strength (MPa) | Elongation (%) | Young’s Modulus (GPa) | Density (g/cm3) |
|---|---|---|---|---|---|---|
| KII-REC15 | 0.04 | 12 | 1600 | 6 | 40 | 1.3 |
| Index | Al2O3 | SiO2 | CaO | Fe2O3 | MgO | SO3 | Loss on Ignition |
|---|---|---|---|---|---|---|---|
| Content (%) | 7.19 | 23.44 | 55.01 | 2.96 | 2.24 | 2.87 | 2.86 |
| SiO2 | Al2O3 | CaO | Fe2O3 | CO2 | MgO | SO3 | K2O | Na2O | TiO2 | SrO | Others |
|---|---|---|---|---|---|---|---|---|---|---|---|
| 40.28 | 18.15 | 18.08 | 8.56 | 5.18 | 2.34 | 2.08 | 1.76 | 1.31 | 0.95 | 0.73 | 0.58 |
| Material | Cement | Fly Ash | Water | Quartz Sand | HPMC | Superplasticizer |
|---|---|---|---|---|---|---|
| PVA-FRCM | 943 | 283 | 245 | 566 | 0.27 | 18.87 |
| No. | Vf (%) | Diameter of Crater (mm) | Nc | Nf | Δ = Nf − Nc | W1 (J) | W2 (J) |
|---|---|---|---|---|---|---|---|
| 1 | 0 | 16.7 | 1 | 2 | 1 | 20.33 | 40.67 |
| 2 | 0 | 20.2 | 1 | 2 | 1 | 20.33 | 40.67 |
| 3 | 0 | 17.8 | 2 | 4 | 2 | 40.67 | 81.33 |
| 4 | 0 | 21.1 | 1 | 2 | 1 | 20.33 | 40.67 |
| 5 | 0 | 22.8 | 1 | 2 | 1 | 20.33 | 40.67 |
| 6 | 0 | 16.7 | 2 | 5 | 3 | 40.67 | 101.66 |
| average | 18.95 | 1 | 2 | 1 | 27.11 | 57.61 | |
| 1 | 0.5 | 28.1 | 3 | 18 | 15 | 61.00 | 365.99 |
| 2 | 0.5 | 27.4 | 33 | 58 | 25 | 670.98 | 1179.30 |
| 3 | 0.5 | 30.6 | 15 | 42 | 27 | 304.99 | 853.98 |
| 4 | 0.5 | 25.8 | 3 | 12 | 9 | 61.00 | 243.99 |
| 5 | 0.5 | 31.0 | 5 | 22 | 17 | 101.66 | 447.32 |
| 6 | 0.5 | 28.4 | 20 | 47 | 27 | 406.66 | 955.64 |
| average | 29.53 | 11 | 32 | 21 | 267.72 | 674.37 | |
| 1 | 1.0 | 34.8 | 160 | 370 | 210 | 3253.26 | 7523.15 |
| 2 | 1.0 | 35.2 | 155 | 245 | 90 | 3151.59 | 4981.55 |
| 3 | 1.0 | 36.3 | 32 | 255 | 223 | 650.65 | 5184.88 |
| 4 | 1.0 | 32.1 | 36 | 109 | 73 | 731.98 | 2216.28 |
| 5 | 1.0 | 40.2 | 128 | 236 | 108 | 2602.60 | 4798.55 |
| 6 | 1.0 | 35.7 | 11 | 39 | 28 | 223.66 | 792.98 |
| average | 35.95 | 88 | 211 | 123 | 1768.96 | 4249.56 | |
| 1 | 1.5 | 52.8 | 437 | 975 | 538 | 8885.45 | 19824.52 |
| 2 | 1.5 | 52.6 | 543 | 1133 | 590 | 11040.73 | 23037.11 |
| 3 | 1.5 | 53.4 | 200 | 1710 | 1510 | 4066.57 | 34769.16 |
| 4 | 1.5 | 60.6 | 590 | 1857 | 1267 | 11996.38 | 37758.09 |
| 5 | 1.5 | 54.9 | 1712 | 2538 | 826 | 34809.83 | 51604.76 |
| 6 | 1.5 | 57.2 | 1650 | 2370 | 720 | 33549.19 | 48188.84 |
| average | 55.8 | 805 | 1584 | 779 | 17391.36 | 35863.75 | |
| 1 | 2.0 | 63.5 | 215 | 2261 | 2046 | 4371.56 | 45972.56 |
| 2 | 2.0 | 51.8 | 750 | 2226 | 1476 | 15249.63 | 45260.91 |
| 3 | 2.0 | 61.2 | 1394 | 3251 | 1857 | 28343.98 | 66102.08 |
| 4 | 2.0 | 63.5 | 2603 | 3727 | 1124 | 52926.39 | 75780.51 |
| 5 | 2.0 | 63.5 | 2782 | 4084 | 1302 | 56565.97 | 83039.33 |
| 6 | 2.0 | 60.6 | 1900 | 2866 | 966 | 38632.40 | 58273.93 |
| average | 59.28 | 1662 | 3018 | 1456 | 32681.66 | 62404.89 | |
| Vf (%) | Strain (%) | Stress (MPa) | ||||||
|---|---|---|---|---|---|---|---|---|
| εc | εf | εΔ = εf − εc | εΔ/εf | σc | σf | σΔ = σf − σc | σΔ/σf | |
| 0.5 | 0.01 | 0.77 | 0.76 | 0.99 | 1.78 | 1.78 | 0.00 | 0.00 |
| 1.0 | 0.01 | 1.16 | 1.15 | 0.99 | 2.64 | 3.00 | 0.36 | 0.12 |
| 1.5 | 0.02 | 1.93 | 1.91 | 0.99 | 3.04 | 3.56 | 0.52 | 0.15 |
| 2.0 | 0.09 | 6.39 | 6.30 | 0.99 | 3.67 | 5.11 | 1.44 | 0.28 |
| Vf (%) | First Crack | Ultimate Failure | |||
|---|---|---|---|---|---|
| σc (MPa) | Nc | εf (%) | Nf | (mm) | |
| 0.5 | 1.78 | 11 | 0.77 | 32 | 29.53 |
| 1.0 | 2.64 | 88 | 1.16 | 211 | 35.95 |
| 1.5 | 3.04 | 805 | 1.93 | 1584 | 55.80 |
| 2.0 | 3.67 | 1662 | 6.39 | 3018 | 59.28 |
© 2019 by the authors. Licensee MDPI, Basel, Switzerland. This article is an open access article distributed under the terms and conditions of the Creative Commons Attribution (CC BY) license (http://creativecommons.org/licenses/by/4.0/).
Share and Cite
Zhang, J.; Bai, P.; Yan, C.; Liu, S.; Wang, X. Experimental Investigation on Relations Between Impact Resistance and Tensile Properties of Cement-Based Materials Reinforced by Polyvinyl Alcohol Fibers. Appl. Sci. 2019, 9, 4434. https://0-doi-org.brum.beds.ac.uk/10.3390/app9204434
Zhang J, Bai P, Yan C, Liu S, Wang X. Experimental Investigation on Relations Between Impact Resistance and Tensile Properties of Cement-Based Materials Reinforced by Polyvinyl Alcohol Fibers. Applied Sciences. 2019; 9(20):4434. https://0-doi-org.brum.beds.ac.uk/10.3390/app9204434
Chicago/Turabian StyleZhang, Ju, Pucun Bai, Changwang Yan, Shuguang Liu, and Xiaoxiao Wang. 2019. "Experimental Investigation on Relations Between Impact Resistance and Tensile Properties of Cement-Based Materials Reinforced by Polyvinyl Alcohol Fibers" Applied Sciences 9, no. 20: 4434. https://0-doi-org.brum.beds.ac.uk/10.3390/app9204434