Self-Injection Locking of a Distributed Feedback Laser Diode Using a High-Finesse Fabry-Perot Microcavity


1
National Laboratory of Solid State Microstructures, School of Physics, and Collaborative Innovation Center of Advanced Microstructures, Nanjing University, Nanjing 210093, China
2
School of Electronic Science and Engineering, Nanjing University, Nanjing 210093, China
*
Author to whom correspondence should be addressed.
Appl. Sci. 2019, 9(21), 4616; https://0-doi-org.brum.beds.ac.uk/10.3390/app9214616
Submission received: 24 September 2019
/
Revised: 24 October 2019
/
Accepted: 25 October 2019
/
Published: 30 October 2019
(This article belongs to the Collection Optical Design and Engineering)
Abstract
:Optical microcavities have been widely used in nonlinear optics, quantum optics, and laser technologies. Here we demonstrate the self-injection locking of a distributed feedback diode laser using home-made high-finesse Fabry-Perot microcavity. The Fabry-Perot microcavity is fabricated from an x-cut lithium niobate crystal with highly reflective coatings. Frequency pulling effect can be observed for a successful locking, and results in a single-longitudinal mode lasing with narrow linewidth. The lasing wavelength and output power are found robust to the laser-diode current and temperature variations, in comparison to the free-running case. We further characterize the laser linewidth with beat note measurement with a high-performance external cavity diode laser, with beat-note linewidth of 601.85 kHz. This results shows a new method for laser frequency stabilization in a simple setup, and may find applications in telecommunication and spectroscopy.
1. Introduction
Optical microcavities are important for optical integration in practical applications [1,2,3,4,5,6,7,8,9]. Among them, Fabry-Perot microcavities (FPMC) are relatively simple to fabricate with high finesse [10,11,12], which is important for nonlinear optics applications, e.g., second-harmonic generation [12,13,14,15,16], parametric amplification [17,18,19], frequency-comb generation [20], and entangled photon generation [21]. Efficient nonlinear processes can be achieved due the cavity enhancements, with high-reflective coatings over nonlinear optical material like LiNbO3 (LN) and KTiOPO4 (KTP) [22,23,24,25].
On the other hand, semiconductor lasers are key components in coherent telecommunication and dense wavelength-multiplexing transmission systems, due to their convenience and low cost. However, the above applications require narrow linewidth and high wavelength stability, which can be challenging for normal diode lasers. Even with narrow-linewidth designs, as in distributed feedback lasers or distributed Bragg reflector laser, their output wavelength can be easily affected by the current and temperature fluctuations, and relatively high sidebands, which exist in their spectra. Several approaches have been developed to stabilize the diode lasers [26,27,28,29,30], including the external feedback from the high-finisse cavity.
In this work, we fabricate a FPMC, with high-finesse of up to 55.5. This FPMC is used for the self-injection locking of a semiconductor distributed feedback (DFB) laser. The locked DFB laser shows low wavelength drift, which is free from current and temperature variation. A 402 kHz beat-note linewidth can be observed, showing a good and stable locking.
2. The Fabry-Perot Microcavity
The FPMC we used is made from an x-cut lithium niobate crystal sheet, and high-reflection coated on both facets. The lithium niobate crystal is, first, finely-polished down to the thickness of ~100 μm, with sub-micron surface roughness. The thickness of each coating layer is optimized for the desired reflectivity, which is 94.5% at 1550 nm wavelength. The total thickness of Ta2O5 and SiO2 layers were 1179.9 nm, and 1801.2 nm, respectively for both surfaces, and 15 periods are used to guarantee a sufficient reflection [31]. The exact thickness of each layer is listed in the Appendix A (Table A1).
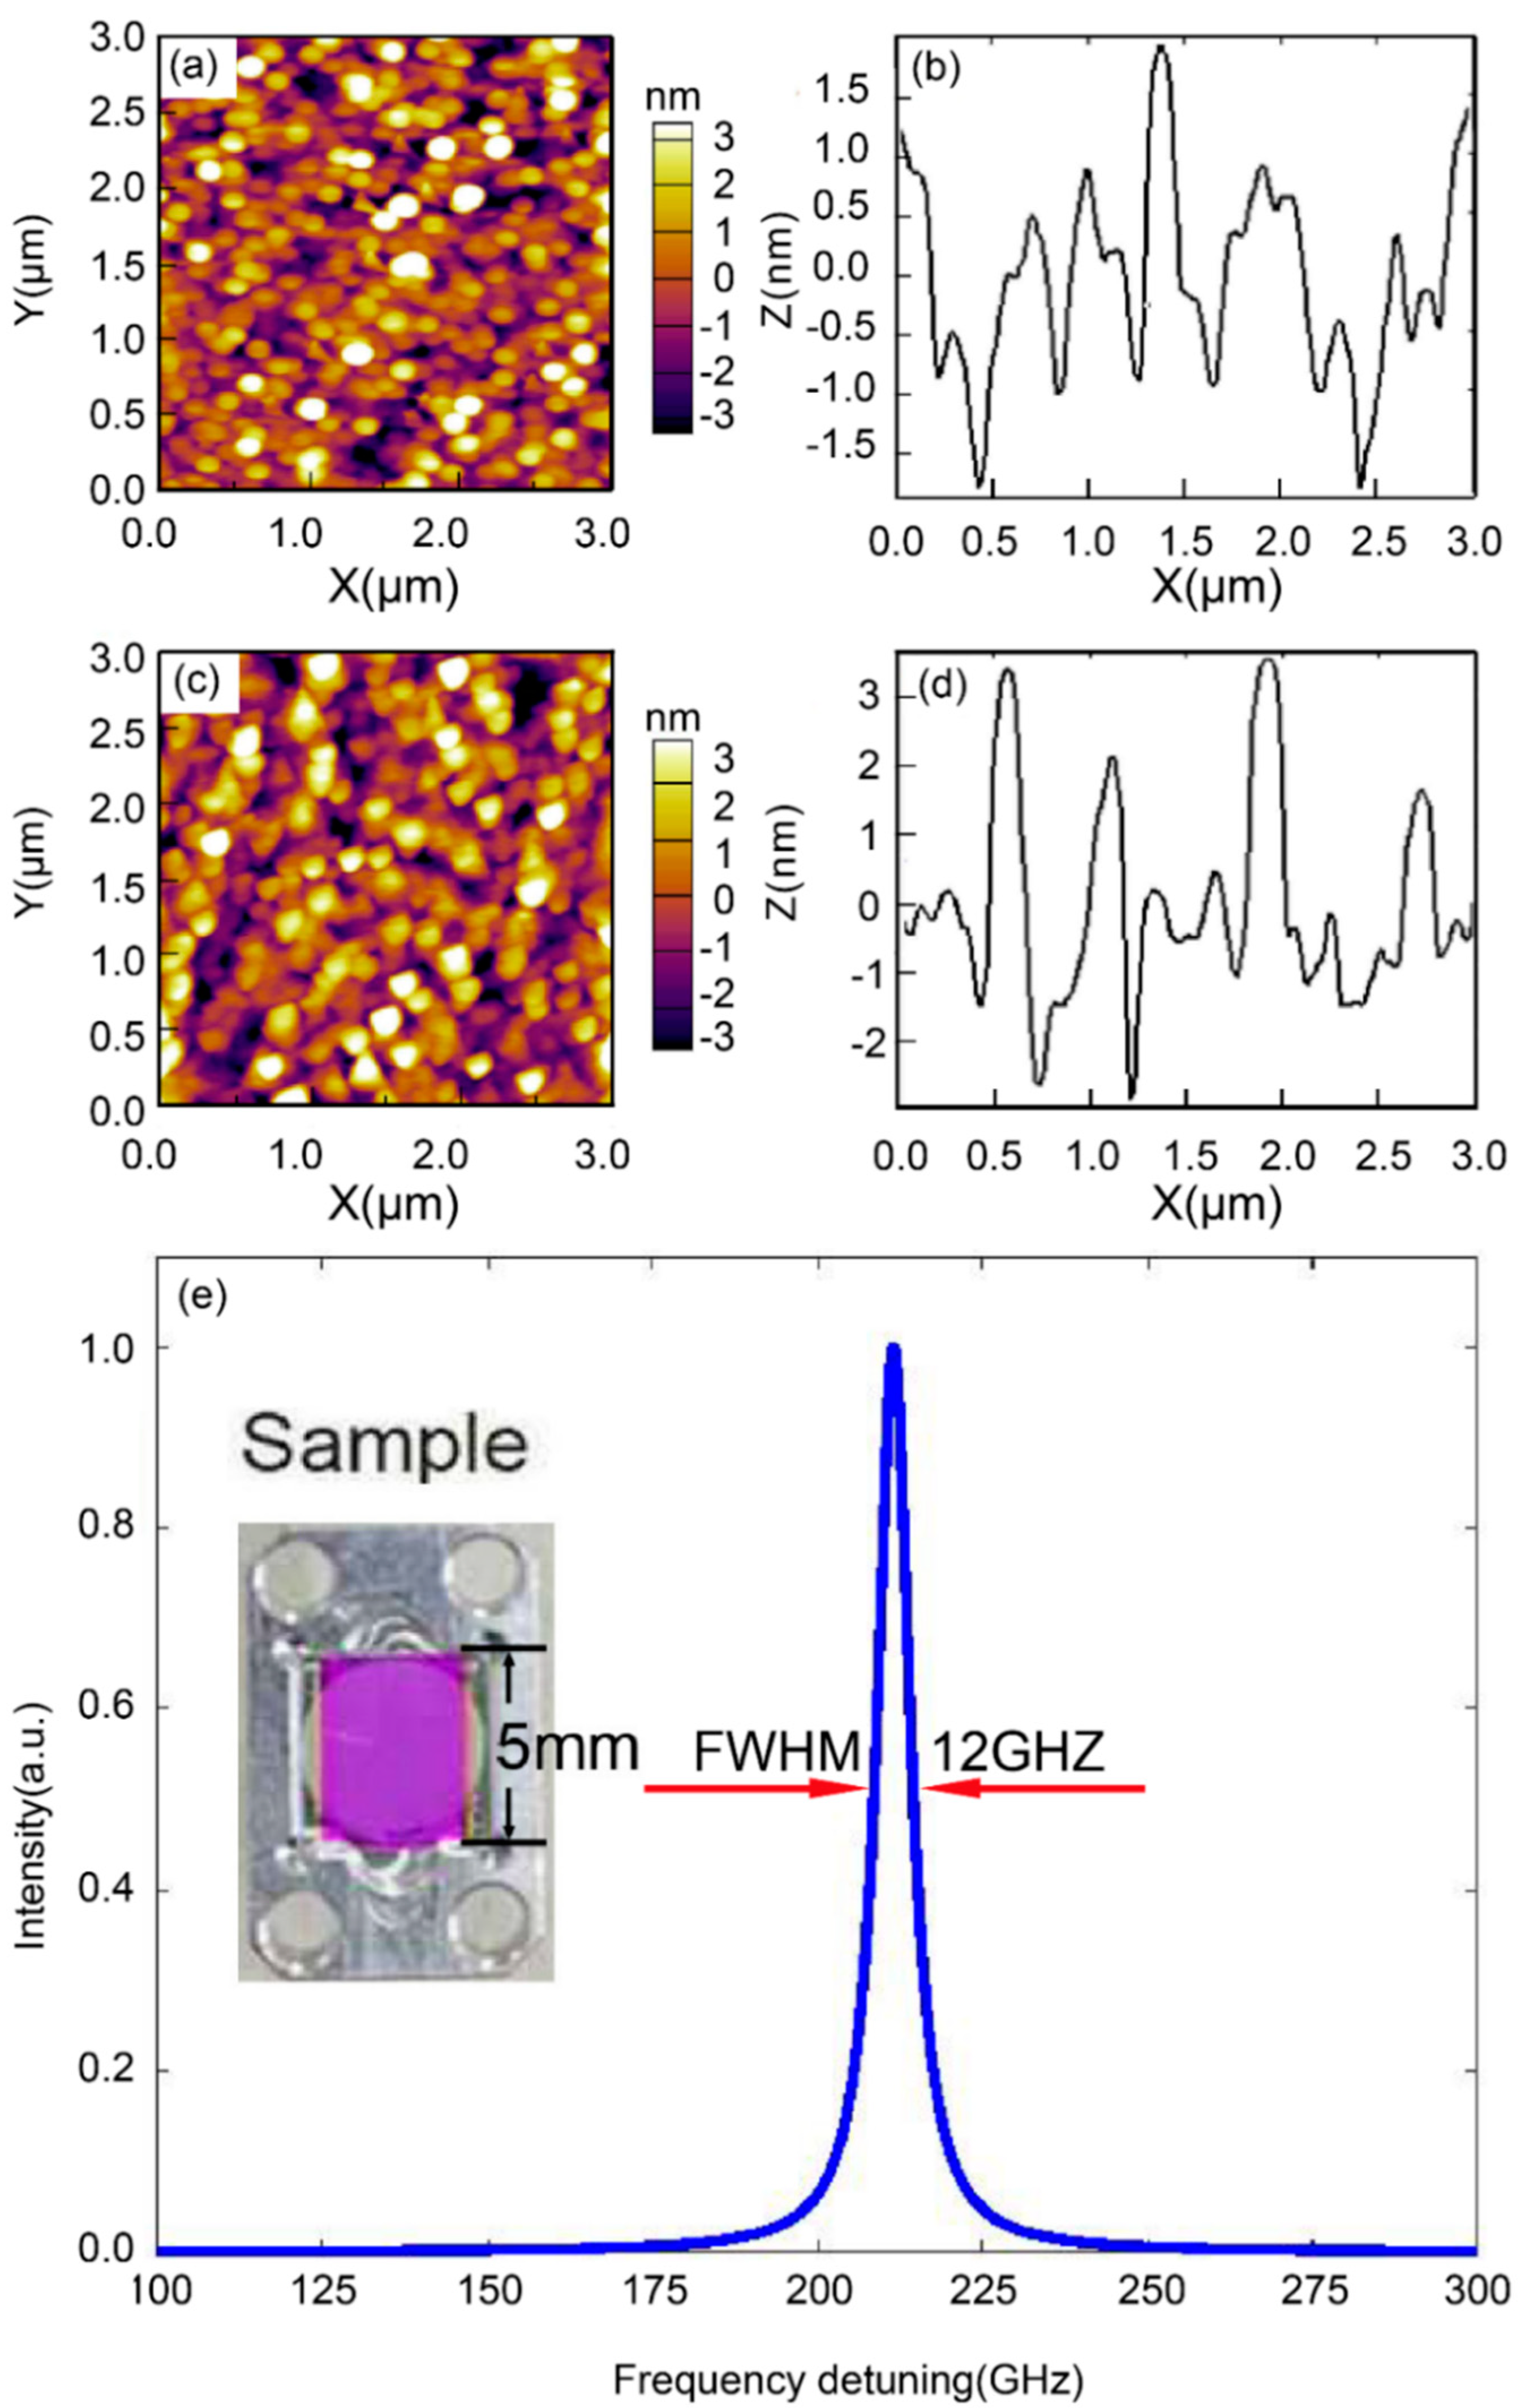
The surface roughness of the Ta2O5 and SiO2 coating (via evaporation) is essential in achieving a high finesse for FPMC. Figure 1a,c show the atomic-force microscope (AFM) image of the front, and rear surfaces of the coated crystal, respectively. Figure 1b,d shows zoom-in of the central parts in Figure 1a,c. It can be seen that for both surfaces, the roughness fluctuates within 3 nm, which is key to suppressing the light scattering and to achieve the high finesse. Figure 1e plots the measured cavity resonance by sweeping the frequency of a tunable laser, indicating the full-width half-maxima (FWHM) linewidth of ~12 GHz. The theoretical linewidth of FPMC is estimated as , where n is refractive index, d is cavity length, r is surface reflectivity and c is vacuum speed of light. This gives 12.204 GHz, which is quite close to measured value. The free-spectral range (FSR) of the cavity is measured as ~678.7 GHz, giving the finesse of ~55.5 and the Q (central frequency over linewidth) of 1.62 × 10⁴. One typical sample of the FPMC is shown in Figure 1e (The inset picture).
3. Self-injection Locking of a DFB Laser
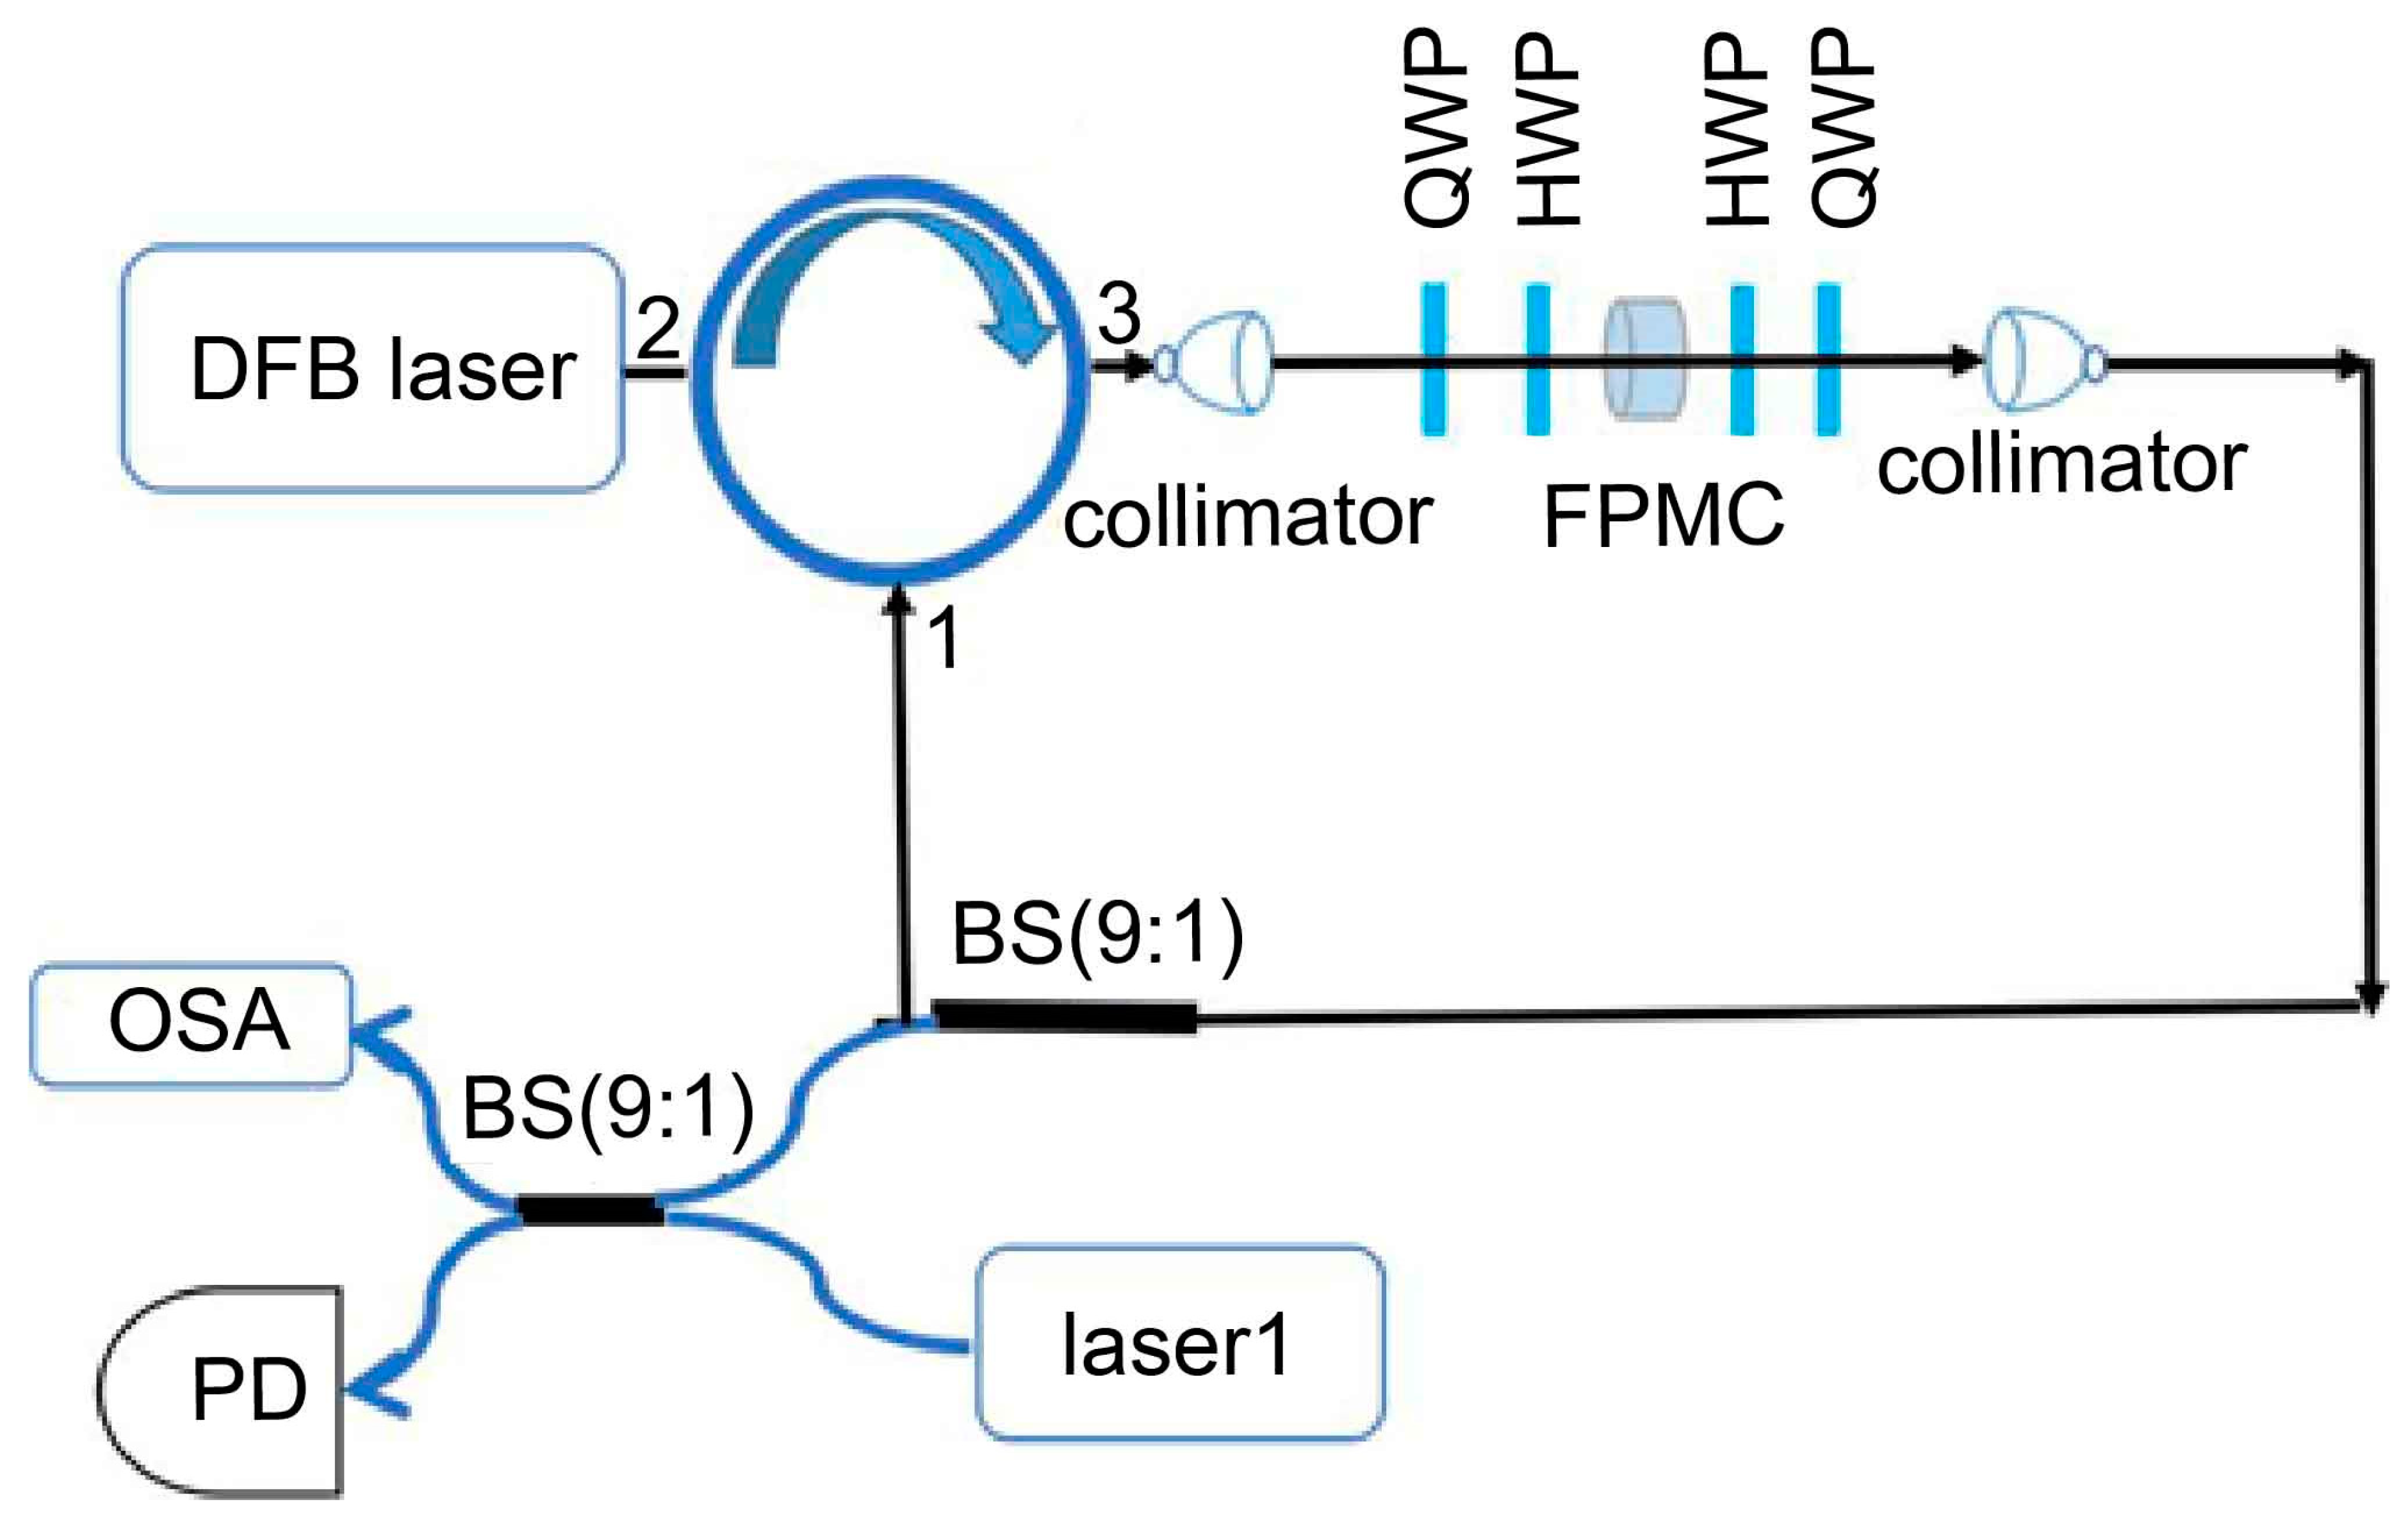
The experimental set-up for the injection locking of a DFB laser (model number LSDLD155-5-S-0-2-SMFA with current driver LDTC0520) is sketched in Figure 2. The output beam of a DFB laser passes through an optical circulator, and collimated into free-space to pass he FPMC. The transmission is then sent back into the laser via a 90:10 fiber beam splitter. The transmission into the FPMC is measured to be ~86%. A series of half-wave plates (HWP) and quarter-wave plates (QWP) are applied to ensure that the light beam is injected back to the DFB laser with the same polarization output. An optical spectrum analyzer (OSA) is used to characterize the laser spectrum.
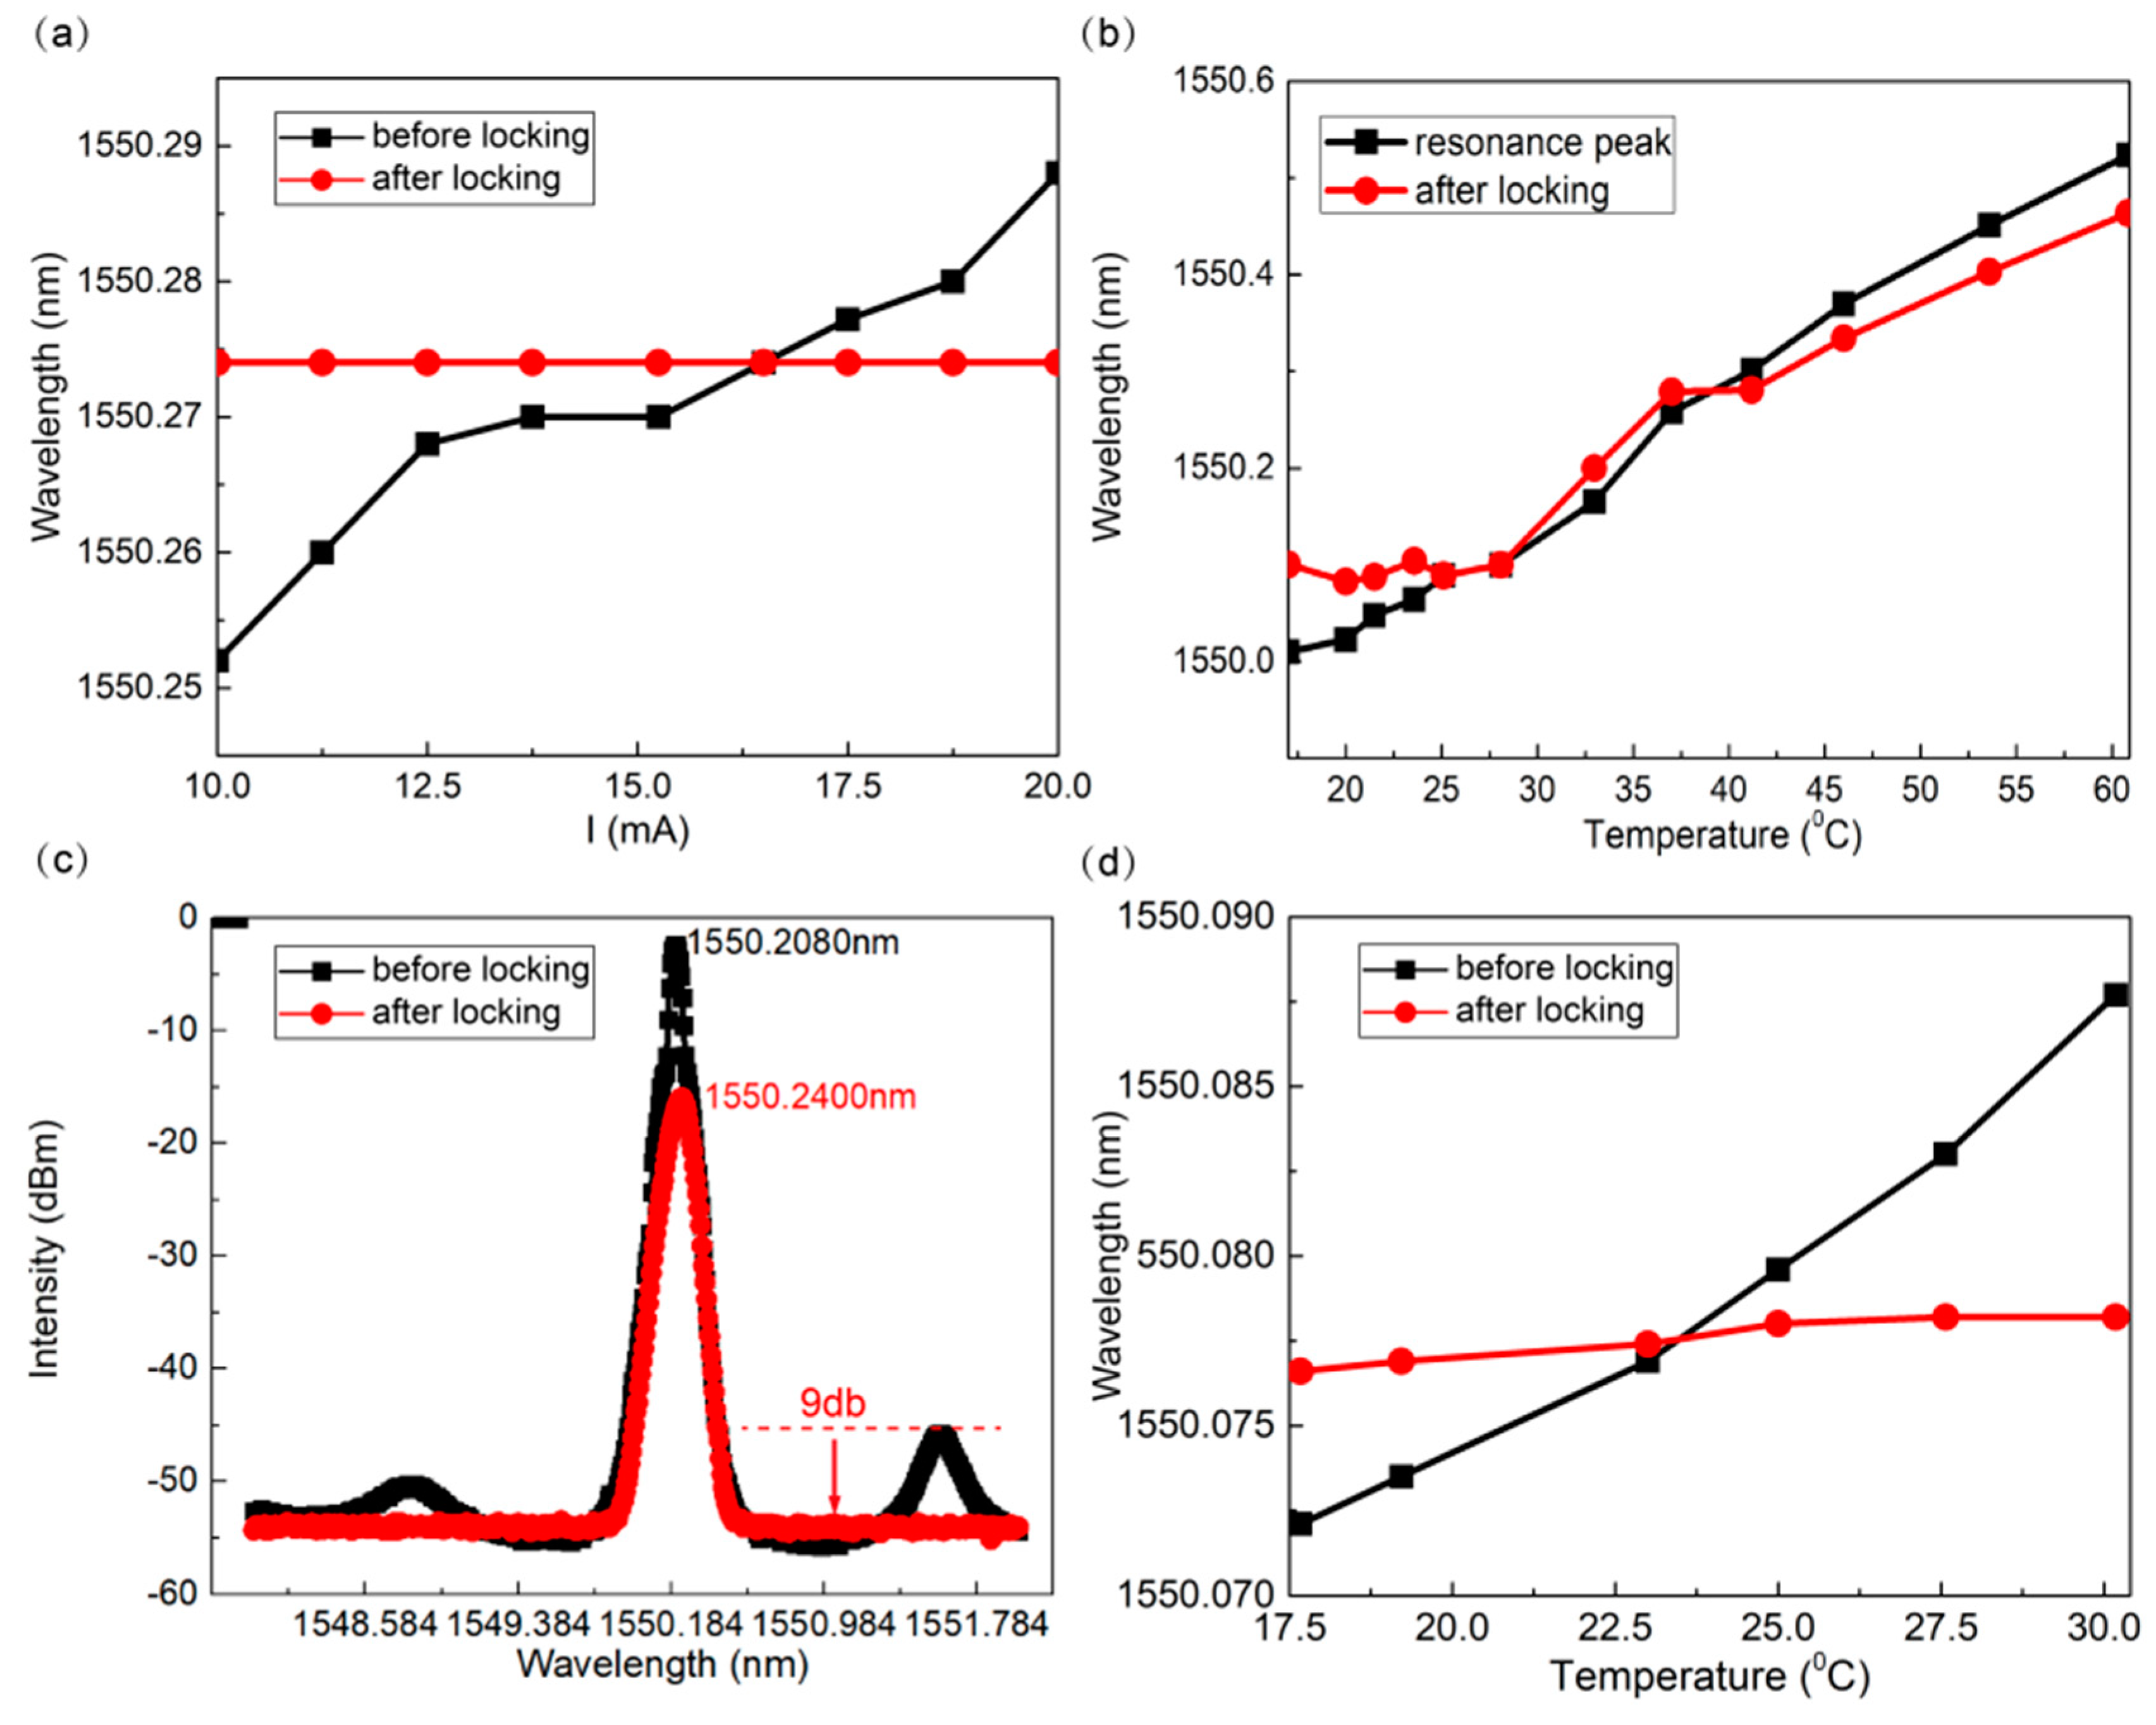
Figure 3a plots the measured laser wavelength as a function of the driving current before (black) and after (red) the injection locking. Before locking, the laser output is directed to OSA without the feedback loop. The threshold current of the free-running DFB laser is ~11.3 mA. When the laser is injection-locked, the threshold (10 mA) is lower than the free-running case, due to the extra external feedback. It can be seen that, before the injection locking, the laser wavelength increases with the driving current, while after locking, the output wavelength is stabilized to the FPMC resonance (1550.24 nm). This indicates that the output power of the locked laser can be modulated without varying its wavelength, which is beneficial for telecommunication applications. Figure 3b compares the lasing wavelength (red) and the FPMC resonance (black) at different FPMC temperature. To control the temperature of the FPMC, it is put inside an oven with temperature-control accuracy of 0.01 °C. It can be seen that, after the locking, the laser wavelength follows the variation of the change of FPMC resonance. In this measurement, the current is set 24.8 mA, which is far above the threshold (5 mA). Figure 3c compares the measured laser spectrum before and after injection locking, and the result shows that the sidebands of the free-running laser can be suppressed by ~9 dB. Figure 3d displays the laser output wavelength, measured after the 10% port of the 90:10 fiber beam splitter, as a function of laser temperature. In the free-running case, the laser wavelength increased as the temperature of the laser diode (black line), mainly due to the refractive index dependence of the temperature. However, when the laser is locked, the output wavelength is stabilized.
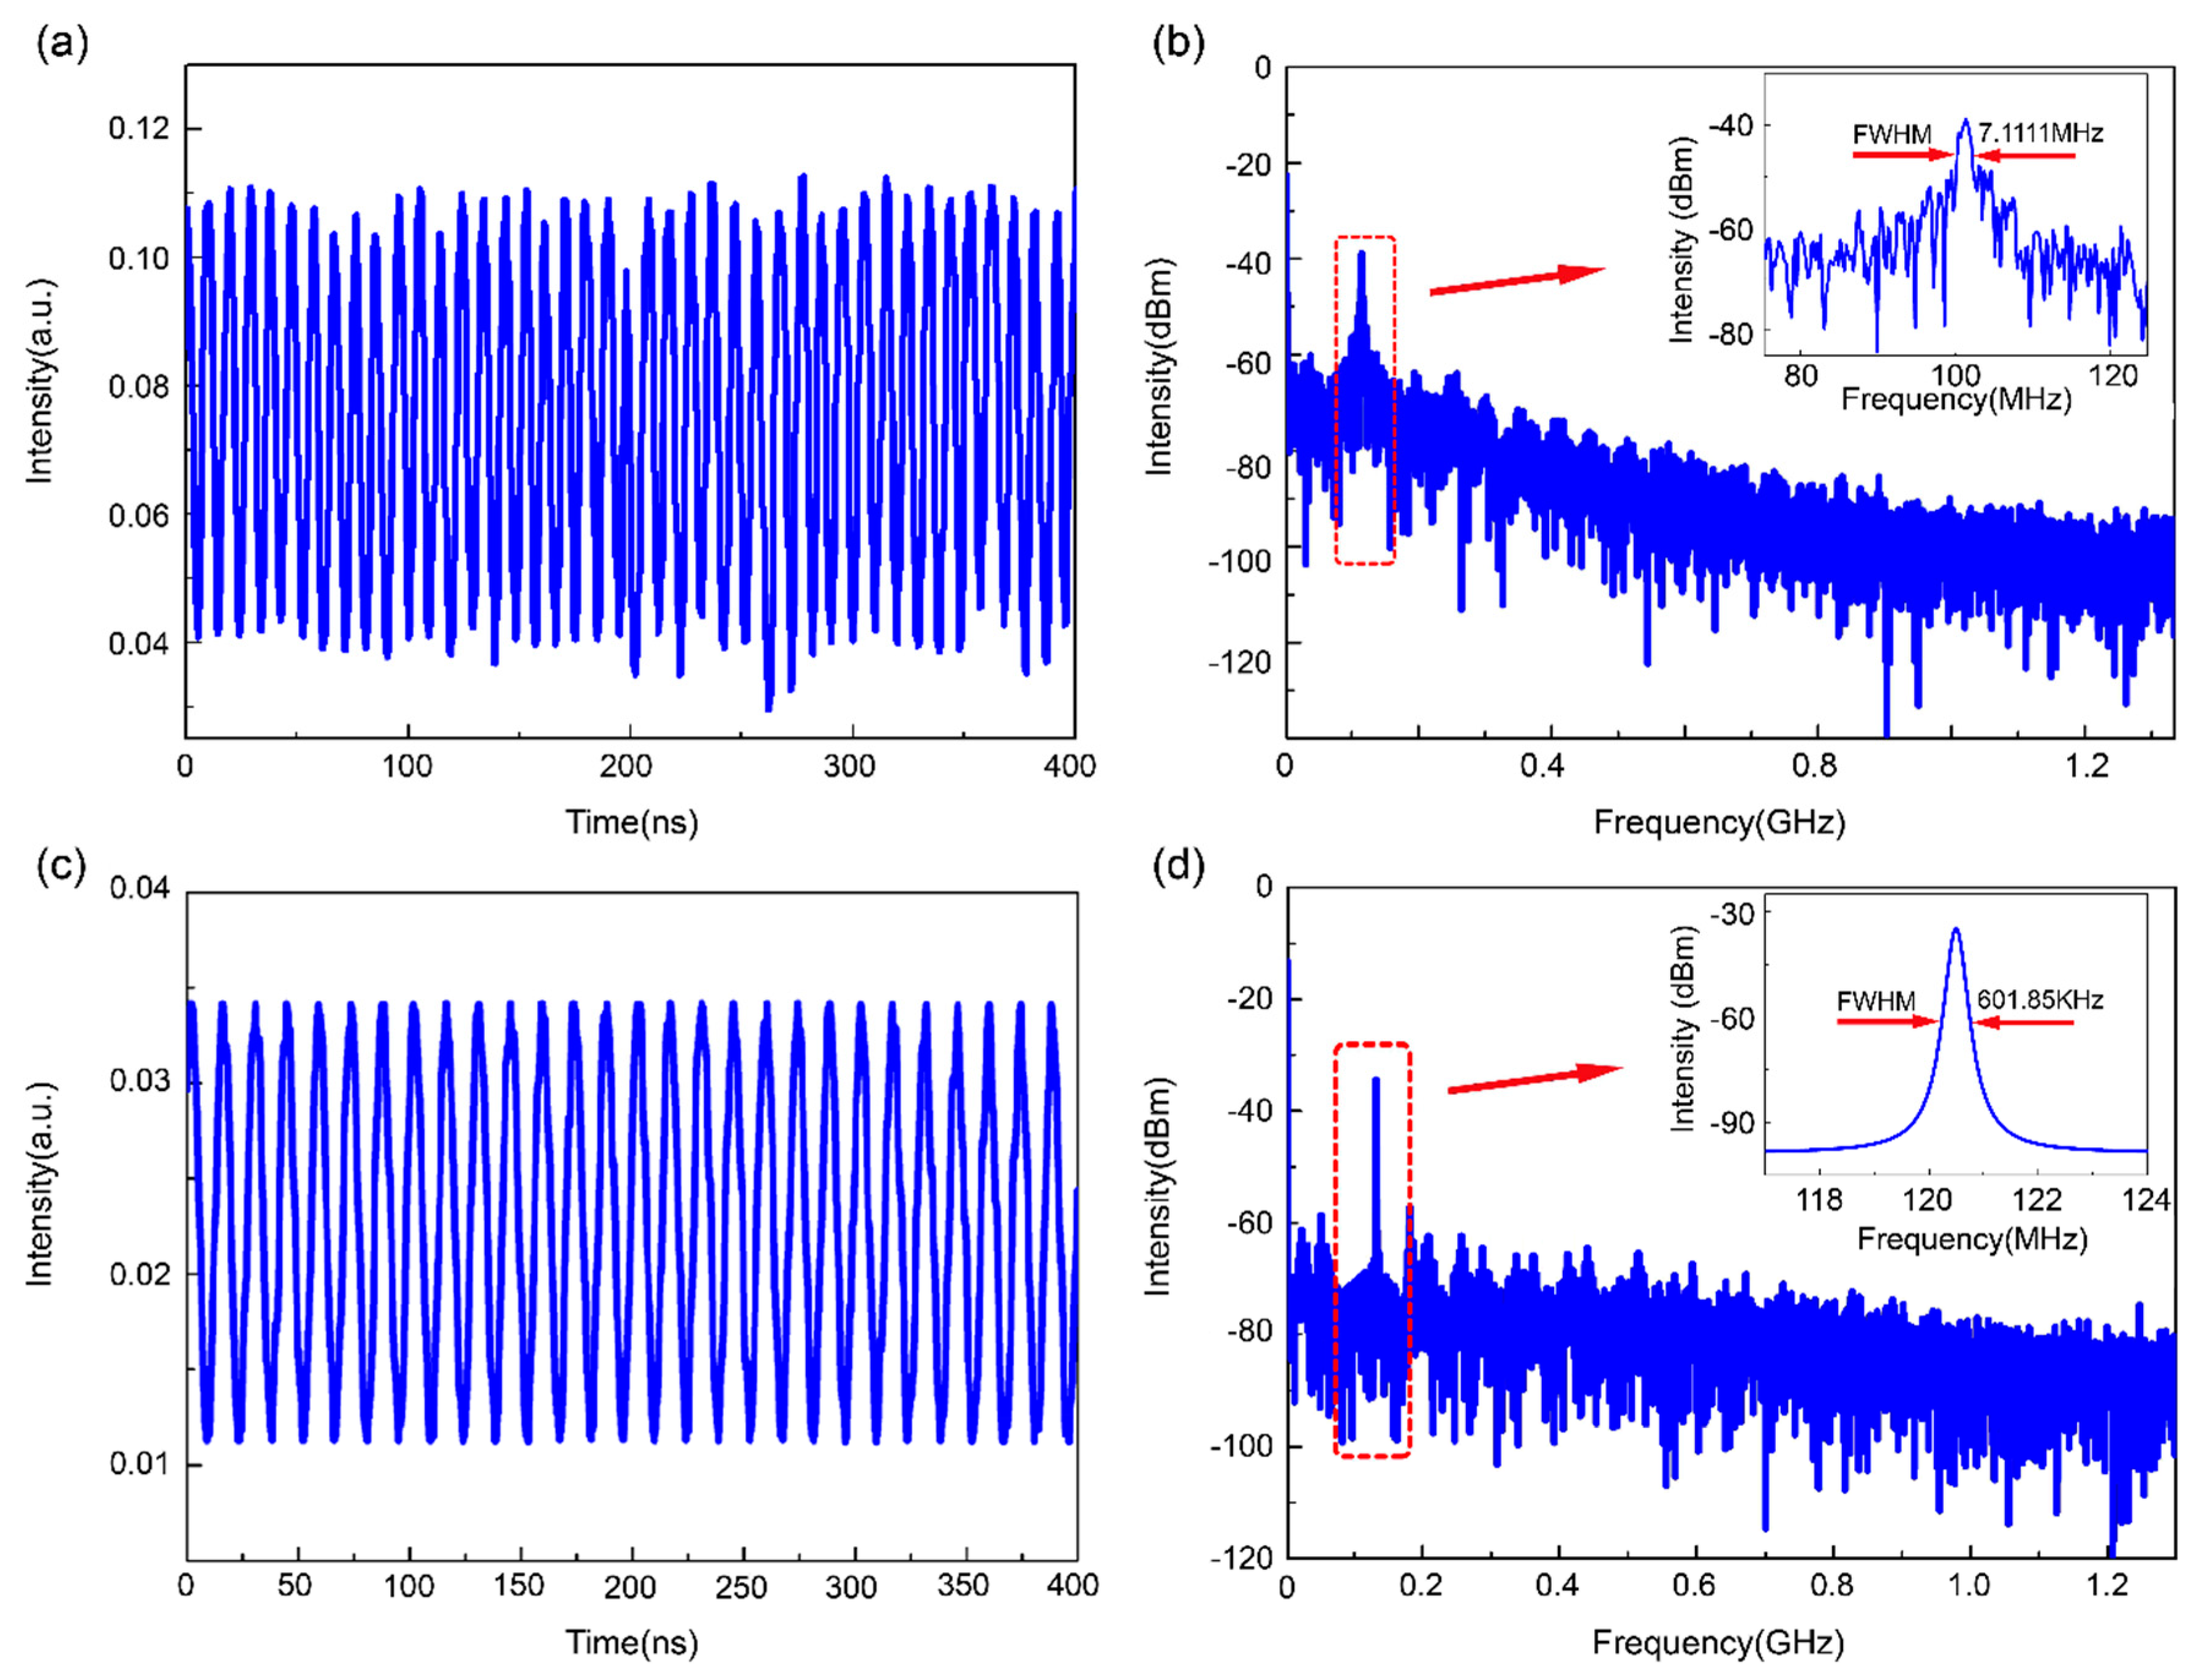
The free-running DFB laser we used has a relatively large linewidth, which can be reduced by the self-injection locking with the FPMC. We used heterodyne detection [32,33] to measure the beat note between the locked laser and the high-performance reference external cavity diode laser (Santec TSL-710, 200 kHz linewidth). For the free-running case shown in Figure 4a (blue curve), the captured oscilloscope trace of the beating signal is a distorted sinusoidal function. Figure 4b shows the measured beat spectrum using an electric spectrum analyzer (resolution bandwidth 50 Hz). A sharp peak at 102.5 MHz is clearly visible, corresponding the beat frequency between the free-running laser and Laser 1 (zoom-in of the marked regime shown in inset picture). The measured FWHM linewidth is 7.1 MHz, indicating the free-running laser linewidth at this level. When the laser is locked, the temporal waveform appears more regularly, as shown in Figure 4c. Figure 4d shows the measured beat spectrum using the same electric spectrum analyzer setting. The beat-note linewidth is fit to be 402 kHz FWHM (assuming Lorentzian shape), which is orders of magnitude narrower than the free-running case. In this measurement, the temperature was 23.997 °C and the current was 24.8 mA.
4. Conclusions
We fabricated a FPMC with high-finesse of 55.5, for the self-injection locking of a semiconductor DFB laser. High-quality injection locking has been presented in this paper with clear frequency-pulling effects, which stabilizes the laser output to the FPMX resonance. Narrow linewidth is confirmed with significantly reduced beat-note linewidth of 402 Hz FWHM, in comparison to 7.1 MHz FWHM in the free-running case. Here, we focus on the locking of a DFB laser, similar setup can be used to lock laser diodes of other types. This result may find broad application prospects in the fields of remote optical communication networks, optical sensing, and quantum information technologies, with a simple and compact setup.
Author Contributions
Conceptualization, X.W. and Z.X.; methodology, X.W.; software, X.W.; validation, X.W.; formal analysis, X.W.; investigation, X.W.; resources, X.W. and Z.X.; data curation, X.W.; writing—original draft preparation, X.W.; writing—review and editing, X.W.; visualization, X.W.; supervision, X.W., Z.X. and S.-N.Z.; project administration, X.W.; funding acquisition, Z.X.
Funding
This research was funded by National Key R&D Program of China (Grant No. 2017YFA0303700); National Natural Science Foundation of China (Grants No. 91321312, 11621091, 11674169, 11474050).
Conflicts of Interest
The authors declare no conflict of interest.
Appendix A

Table A1.
Thickness of each coated layer in FPMC.
| Layer | Material | Thickness (nm) |
|---|---|---|
| 1 | SiO2 | 84.90 |
| 2 | Ta2O5 | 79.82 |
| 3 | SiO2 | 289.63 |
| 4 | Ta2O5 | 189.36 |
| 5 | SiO2 | 269.93 |
| 6 | Ta2O5 | 187.44 |
| 7 | SiO2 | 269.10 |
| 8 | Ta2O5 | 187.15 |
| 9 | SiO2 | 268.84 |
| 10 | Ta2O5 | 187.12 |
| 11 | SiO2 | 268.80 |
| 12 | Ta2O5 | 187.11 |
| 13 | SiO2 | 268.96 |
| 14 | Ta2O5 | 161.89 |
| 15 | SiO2 | 81.04 |
References
- Foreman, M.R.; Swaim, J.D.; Vollmer, F. Whispering gallery mode sensors. Adv. Opt. Photon. 2015, 7, 168–240. [Google Scholar] [CrossRef] [PubMed]
- Pöllinger, M.; O’Shea, D.; Warken, F.; Rauschenbeutel, A. Ultrahigh-Q tunable whispering-gallery-mode microresonator. Phys. Rev. Lett. 2009, 103, 053901. [Google Scholar] [CrossRef] [PubMed]
- Hoffmann, M.; Kopka, P.; Voges, E. Low-loss fiber-matched low temperature PECVD waveguides with small-core dimensions for optical communication systems. IEEE Photon. Technol. Lett. 1997, 9, 1238–1240. [Google Scholar] [CrossRef]
- Hoffmann, M.; Kopka, P.; Voges, E. Thermo-optical digital switch arrays in silica-on-silicon with defined zerovoltage state. J. Lightwave Technol. 1998, 16, 395–400. [Google Scholar] [CrossRef]
- Pennetta, R.; Xie, S.; Russell, P.J. Tapered Glass-Fiber Microspike: High-Q Flexural Wave Resonator and Optically Driven Knudsen Pump. Phys. Rev. Lett. 2016, 117, 273901. [Google Scholar] [CrossRef]
- Xie, S.; Pennetta, R.; Russell, P.S. Self-alignment of glass fiber nanospike by optomechanical back-action in hollow-core photonic crystal fiber. Optica 2016, 3, 277–282. [Google Scholar] [CrossRef]
- Gleine, W.; Muller, J. Laser trimming of SiON components for integrated optics. J. Lightwave Technol. 1991, 9, 1626–1629. [Google Scholar] [CrossRef]
- Offrein, B.J.; Bona, G.L.; Germann, R.; Krommendijk, F.; Massarek, I.; Salemink, H.W.M. High contrast and low loss SiON optical waveguides by PECVD. In Proceedings of the IEEE/LEOS Symposium Benelux Chapter, November 1996; pp. 290–293. [Google Scholar]
- Svalgaard, M.; Kristensen, M. Directly UV written silica-on-silicon planar waveguides with low loss. Electron. Lett. 1997, 33, 861–863. [Google Scholar]
- Zeltner, R.; Pennetta, R.; Xie, S.; Russell, P.S. Flying particle microlaser and temperature sensor in hollow-core photonic crystal fiber. Opt. Lett. 2018, 43, 1479–1482. [Google Scholar] [CrossRef]
- Xie, S.; Tolstik, N.; Travers, J.C.; Sorokin, E.; Caillaud, C.; Troles, J.; Russell, P.S.; Sorokina, I.T. Coherent octave-spanning mid-infrared supercontinuum generated in As2S3-silica double-nanospike waveguide pumped by femtosecond Cr:ZnS laser. Opt. Express 2016, 24, 12406–12413. [Google Scholar] [CrossRef]
- Armstrong, J.A.; Bloembergen, N.; Ducuing, J.; Pershan, P.S. Interactions between light waves in a nonlinear dielectric. Phys. Rev. 1962, 127, 1918. [Google Scholar] [CrossRef]
- Ilchenko, V.S.; Savchenkov, A.A.; Matsko, A.B.; Maleki, L. Nonlinear Optics and Crystalline Whispering Gallery Mode Cavities. Phys. Rev. Lett. 2004, 92, 043903. [Google Scholar] [CrossRef] [PubMed]
- Fu, J.U. Naturally Phase-Matched Second-Harmonic Generation in a Whispering-Gallery-Mode Resonator. Phys. Rev. Lett. 2010, 104, 153901. [Google Scholar] [Green Version]
- Kippenberg, T.J. Viewpoint: Second-harmonic generation in microresonators through natural phase matching. Physics 2010, 3, 32. [Google Scholar] [CrossRef]
- Del’Haye, P.; Schliesser, A.; Arcizet, O.; Wilken, T.; Holzwarth, R.; Kippenberg, T.J. Optical frequency comb generation from a monolithic microresonator. Nature 2007, 450, 1214–1217. [Google Scholar] [CrossRef] [Green Version]
- Savchenkov, A.A.; Matsko, A.B.; Mohageg, M.; Strekalov, D.V.; Maleki, L. Parametric oscillations in a whispering gallery resonator. Opt. Lett. 2007, 32, 157. [Google Scholar] [CrossRef]
- Fürst, J.U.; Strekalov, D.V.; Elser, D.; Aiello, A.; Andersen, U.L.; Marquardt, C.; Leuchs, G. Low-threshold optical parametric oscillations in a whispering gallery mode resonator. Phys. Rev. Lett. 2010, 105, 263904. [Google Scholar] [CrossRef]
- Beckmann, T.; Linnenbank, H.; Steigerwald, H.; Sturman, B.; Haertle, D.; Buse, K.; Breunig, I. Highly tunable low-threshold optical parametric oscillation in radially poled whispering gallery resonators. Phys. Rev. Lett. 2011, 106, 143903. [Google Scholar] [CrossRef]
- Boes, A.; Corcoran, B.; Chang, L.; Bowers, J.; Mitchell, A. Status and potential of lithium niobate on insulator (LNOI) for photonic integrated circuits. Laser Photon. Rev. 2018, 12, 1700256. [Google Scholar] [CrossRef]
- Hong, C.K.; Ou, Z.Y.; Mandel, L. Measurement of subpicosecond time intervals between two photons by interference. Phys. Rev. Lett. 1987, 59, 2044. [Google Scholar] [CrossRef]
- Alford, W.J.; Smith, A.V. Wavelength variation of the second-order nonlinear coefficients of KNbO3, KTiOPO4, KTiOAsO4, LiNbO3, LiIO3, β-BaB2O4, KH2PO4, and LiB3O5 crystals: A test of Miller wavelength scaling. J. Opt. Soc. Am. B 2001, 18, 524–533. [Google Scholar] [CrossRef]
- Akbari, R.; Major, A. Optical, spectral and phase matching properties of BIBO, BBO and LBO crystals for optical parametric oscillation in the visible and near infrared wavelength ranges. Laser Phys. 2013, 23, 035401. [Google Scholar] [CrossRef]
- Yoshida, H.; Lu, Y.; Nakayama, H.; Hirohashi, M. Fabrication of TiO2 film by mechanical coating technique and its photocatalytic activity. J. Alloy. Compd. 2009, 475, 383–386. [Google Scholar] [CrossRef]
- Chen, Q.; Hubbard, G.; Shields, P.A.; Liu, C.; Allsopp, D.W.E.; Wang, W.N.; Abbott, S. Broadband moth-eye antireflection coatings fabricated by low-cost nanoimprinting. Appl. Phys. Lett. 2009, 94, 263118. [Google Scholar] [CrossRef]
- Liang, W.; Chenko, V.S.; Eliyahu, D.; Savchenkov, A.A.; Matsko, A.B.; Seidel, D.; Maleki, L. Ultralow noise miniature external cavity semiconductor laser. Nat. Commun. 2015, 6, 7371. [Google Scholar] [CrossRef]
- Lewoczko, A.W.; Pyrlik, C.; Häger, J.; Schwertfeger, S.; Wicht, A.; Peters, A.; Erbert, G.; Tränkle, G. Ultra-narrow linewidth DFB-laser with optical feedback from a monolithic confocal Fabry-Perot cavity. Opt. Express 2015, 23, 9705–9709. [Google Scholar] [CrossRef]
- Siciliani de Cumis, M.; Borri, S.; Insero, G.; Bartalini, S.; Pastor, P.C.; Mazzotti, D.; Galli, I.; Giusfredi, G.; Santambrogio, G.; D’Ambrosio, D.; et al. Microcavity-Stabilized Quantum Cascade Laser. Laser Photon. Rev. 2016, 10, 153–157. [Google Scholar] [CrossRef]
- Gallego, J.; Ghosh, S.; Alavi, S.K.; Alt, W.; Martinez-Dorantes, M.; Meschede, D.; Ratschbacher, L. High-finesse fiber Fabry–Perot cavities: Stabilization and mode matching analysis. Appl. Phys. B 2016, 122, 47. [Google Scholar] [CrossRef]
- Wang, K.; Zhang, M.; Duan, F.; Xie, S.; Liao, Y. Measurement of the phase shift between intensity and frequency modulations within DFB-LD and its influences on PGC demodulation in a fiber-optic sensor system. Appl. Opt. 2013, 52, 7194–7199. [Google Scholar] [CrossRef]
- Xie, Z.D.; Lv, X.J.; Liu, Y.H.; Ling, W.; Wang, Z.L.; Fan, Y.X.; Zhu, S.N. Cavity phase matching via an optical parametric oscillator consisting of a dielectric nonlinear crystal sheet. Phys. Rev. Lett. 2011, 106, 083901. [Google Scholar] [CrossRef]
- Liu, F.; Xie, S.; Qiu, X.; Wang, X.; Cao, S.; Qin, M.; He, X.; Xie, B.; Zheng, X.; Zhang, M. Efficient common-mode noise suppression for fiber-optic interferometric sensor using heterodyne demodulation. J. Lightwave Technol. 2016, 34, 5453–5461. [Google Scholar] [CrossRef]
- Xie, S.; Zhang, M.; Li, Y.; Liao, Y. Positioning error reduction technique using spectrum reshaping for distributed fiber interferometric vibration sensor. J. Lightwave Technol. 2012, 30, 3520–3524. [Google Scholar] [CrossRef]
Figure 1.
(a) Surface morphology of the front and (c) rear surface of the sample. (b,d) Surface roughness scanned at center position of (a), and (c) respectively. (e) Measurement of the Fabry-Perot microcavities (FPMC) cavity linewidth. Full-width half-maxima (FWHM), full-width half-maxima. Inset: Image of the used FPMC sample.

Figure 2.
Sketch of experimental setup. FPMC, Fabry-Perot microcavity; QWP, quarter-wave plate; HWP, half-wave plate; BS, beam-splitter; PD, photodetector. OSA, optical spectrum analyzer.
Figure 2.
Sketch of experimental setup. FPMC, Fabry-Perot microcavity; QWP, quarter-wave plate; HWP, half-wave plate; BS, beam-splitter; PD, photodetector. OSA, optical spectrum analyzer.

Figure 3.
(a) Measured laser wavelength versus driving current before (black) and after (red) the self-injection locking. (b) Laser output wavelength of as a function the FPMC temperature (red) and that of FPMC resonance (black). (c) Measured laser spectrum before (black) and after (red) locking. (d) Laser output wavelength as a function of its case temperature.

Figure 4.
(a) Time domain beat signal measured by an oscilloscope with the free-running DFB laser. (b) The beating spectrum in the free-running case. Inset: zoom-into around the peak showing the beat frequency of 7.1 MHz. (c) Time domain beat signal measured with the injection-locking. (d) Beat spectrum in the self-injection locked case. Inset: zoom-into around the beating frequency.

© 2019 by the authors. Licensee MDPI, Basel, Switzerland. This article is an open access article distributed under the terms and conditions of the Creative Commons Attribution (CC BY) license (http://creativecommons.org/licenses/by/4.0/).
Share and Cite
MDPI and ACS Style
Wei, X.; Xie, Z.; Zhu, S.-N. Self-Injection Locking of a Distributed Feedback Laser Diode Using a High-Finesse Fabry-Perot Microcavity. Appl. Sci. 2019, 9, 4616. https://0-doi-org.brum.beds.ac.uk/10.3390/app9214616
AMA Style
Wei X, Xie Z, Zhu S-N. Self-Injection Locking of a Distributed Feedback Laser Diode Using a High-Finesse Fabry-Perot Microcavity. Applied Sciences. 2019; 9(21):4616. https://0-doi-org.brum.beds.ac.uk/10.3390/app9214616
Chicago/Turabian StyleWei, Xing, ZhenDa Xie, and Shi-Ning Zhu. 2019. "Self-Injection Locking of a Distributed Feedback Laser Diode Using a High-Finesse Fabry-Perot Microcavity" Applied Sciences 9, no. 21: 4616. https://0-doi-org.brum.beds.ac.uk/10.3390/app9214616
Note that from the first issue of 2016, this journal uses article numbers instead of page numbers. See further details here.