1. Introduction
PV (Photovoltaic) systems are largely divided into PV arrays that produce DC (Direct current) power and PV inverters that convert the generated DC power into AC (Alternating current) power. An PV array is a structure in which PV modules are connected in a series, and many such strings are connected in parallel. The maximum number of PV modules in a string connected in a series is usually below the system voltage of 1500 V, depending on the PV plant capacity and the input voltage of the PV inverter. In PV plants with a large installation area, the voltage mismatch of strings is caused by various factors, which may change the performance of the PV system. The PV plant with a centralized-type inverter consists of multiple PV strings, and the performance of the PV system is determined by the sum of the performance of the multiple strings. Therefore, differences in the performance of PV arrays or strings reduce the performance of the PV system, which is referred to as a mismatch loss due to the parallel connection of PV strings. According to the research results, the mismatch factors of PV arrays, such as PV module mismatching and partial shading, reduce the output of the PV system by about 20–25% [
1]. Output mismatch causes a considerable loss for the PV system, and various studies have been conducted to remedy it. The most common factor of output mismatch is partial shading. In partial shading, the operation of bypass diodes changes the power–voltage curve of each array, reducing the output. Various studies with the aim of remedying these problems have been conducted to estimate and analyze the performance of PV arrays using a simulation tool or an experiment [
2,
3]. Research was also conducted to minimize output mismatch by improving the arrangement of PV arrays. Using the suggested arrangement of PV arrays, the efficiency of the output power improved by up to 4% under partial shading [
4]. The recent research result released an odd-even structure that improved on various array arrangement methods [
5]. PV inverters perform MPPT (Maximum Power Point Tracking) on the entire input strings to optimize the output under various environmental conditions. However, in the case of output mismatch, such as partial shading, the P&O or IncCond method, which is used as a general MPPT method, does not perform an optimal MPPT, resulting in output loss. In partial shading, the research result of applying the DMPPT (Distributed Maximum Power Point Tracking), which improved the existing MPPT, has been published [
6]. Additionally, the RMPPT (Real Maximum Power Point Tracking) method was developed with 15% less output reduction than the IncCond method [
7]. A study was conducted to confirm the effect of the output mismatch of PV modules and arrays on the PV system. A new parameter extraction model was proposed to analyze the output loss of the PV system due to output mismatch [
8]. The study also confirmed that the larger the number of PV modules, the higher the output loss due to output mismatch [
9].
Various studies have been conducted to analyze and improve the output mismatch of PV arrays, but the studies on the electrical characteristics of the system due to the output mismatch of PV arrays under the system configuration and fault condition are insufficient. In large PV plants, the system is constructed mainly by adopting a centralized-type inverter, in which multiple PV arrays are connected to a combiner box and then connected to an inverter and a grid. According to Korea’s pre-2017 PV installation standard, blocking diodes and fuses are mandatory to prevent damage to PV modules and arrays due to an overcurrent and reverse current in the design of a combiner box. However, according to IEC TS 62257-7-1: 2010, blocking diodes can be a source of the failure and power loss and are not recommended for use [
10]. In this connection, the revised combiner box standard (KS C 8567;2019) in Korea does not recommend the use of blocking diodes in grid-connected PV systems, and the use of blocking diodes is left to the discretion of the end-user [
11]. From the analysis results of the PV system failure causes, the primary failure was found to be the stop and the inverter failure [
12,
13,
14]. However, without proper monitoring systems and a proper inspection of the system, the stop and failure of an inverter cannot be readily determined. By expanding to the array level, the reverse current flow was confirmed using Matlab-Simulink (version, Manufacturer, City, US State abbrev. if applicable, Country).
In this paper, research was conducted to analyze the current flow of PV arrays, considering the system configuration and failure condition under the voltage mismatch due to output mismatch. The I–V(current–voltage) curves of PV modules, voltage, and current were measured to analyze the electrical characteristics of each voltage mismatch condition. By expanding to the array level, the reverse current flow into the voltage mismatch array was confirmed using Matlab-Simulink, taking into account the system configuration (no blocking diode) and fault condition under-voltage mismatch conditions. In the real PV system, the array’s reverse current, caused by the operation and failure of bypass diodes, was measured and verified. From the simulation and experiment, the current flow of PV arrays caused by various factors (voltage mismatch, blocking diodes, and inverter failure) was analyzed, and the resulting effect of the system was confirmed.
2. Reverse Bias Characteristic of a PV Module Due to Voltage Mismatch Conditions
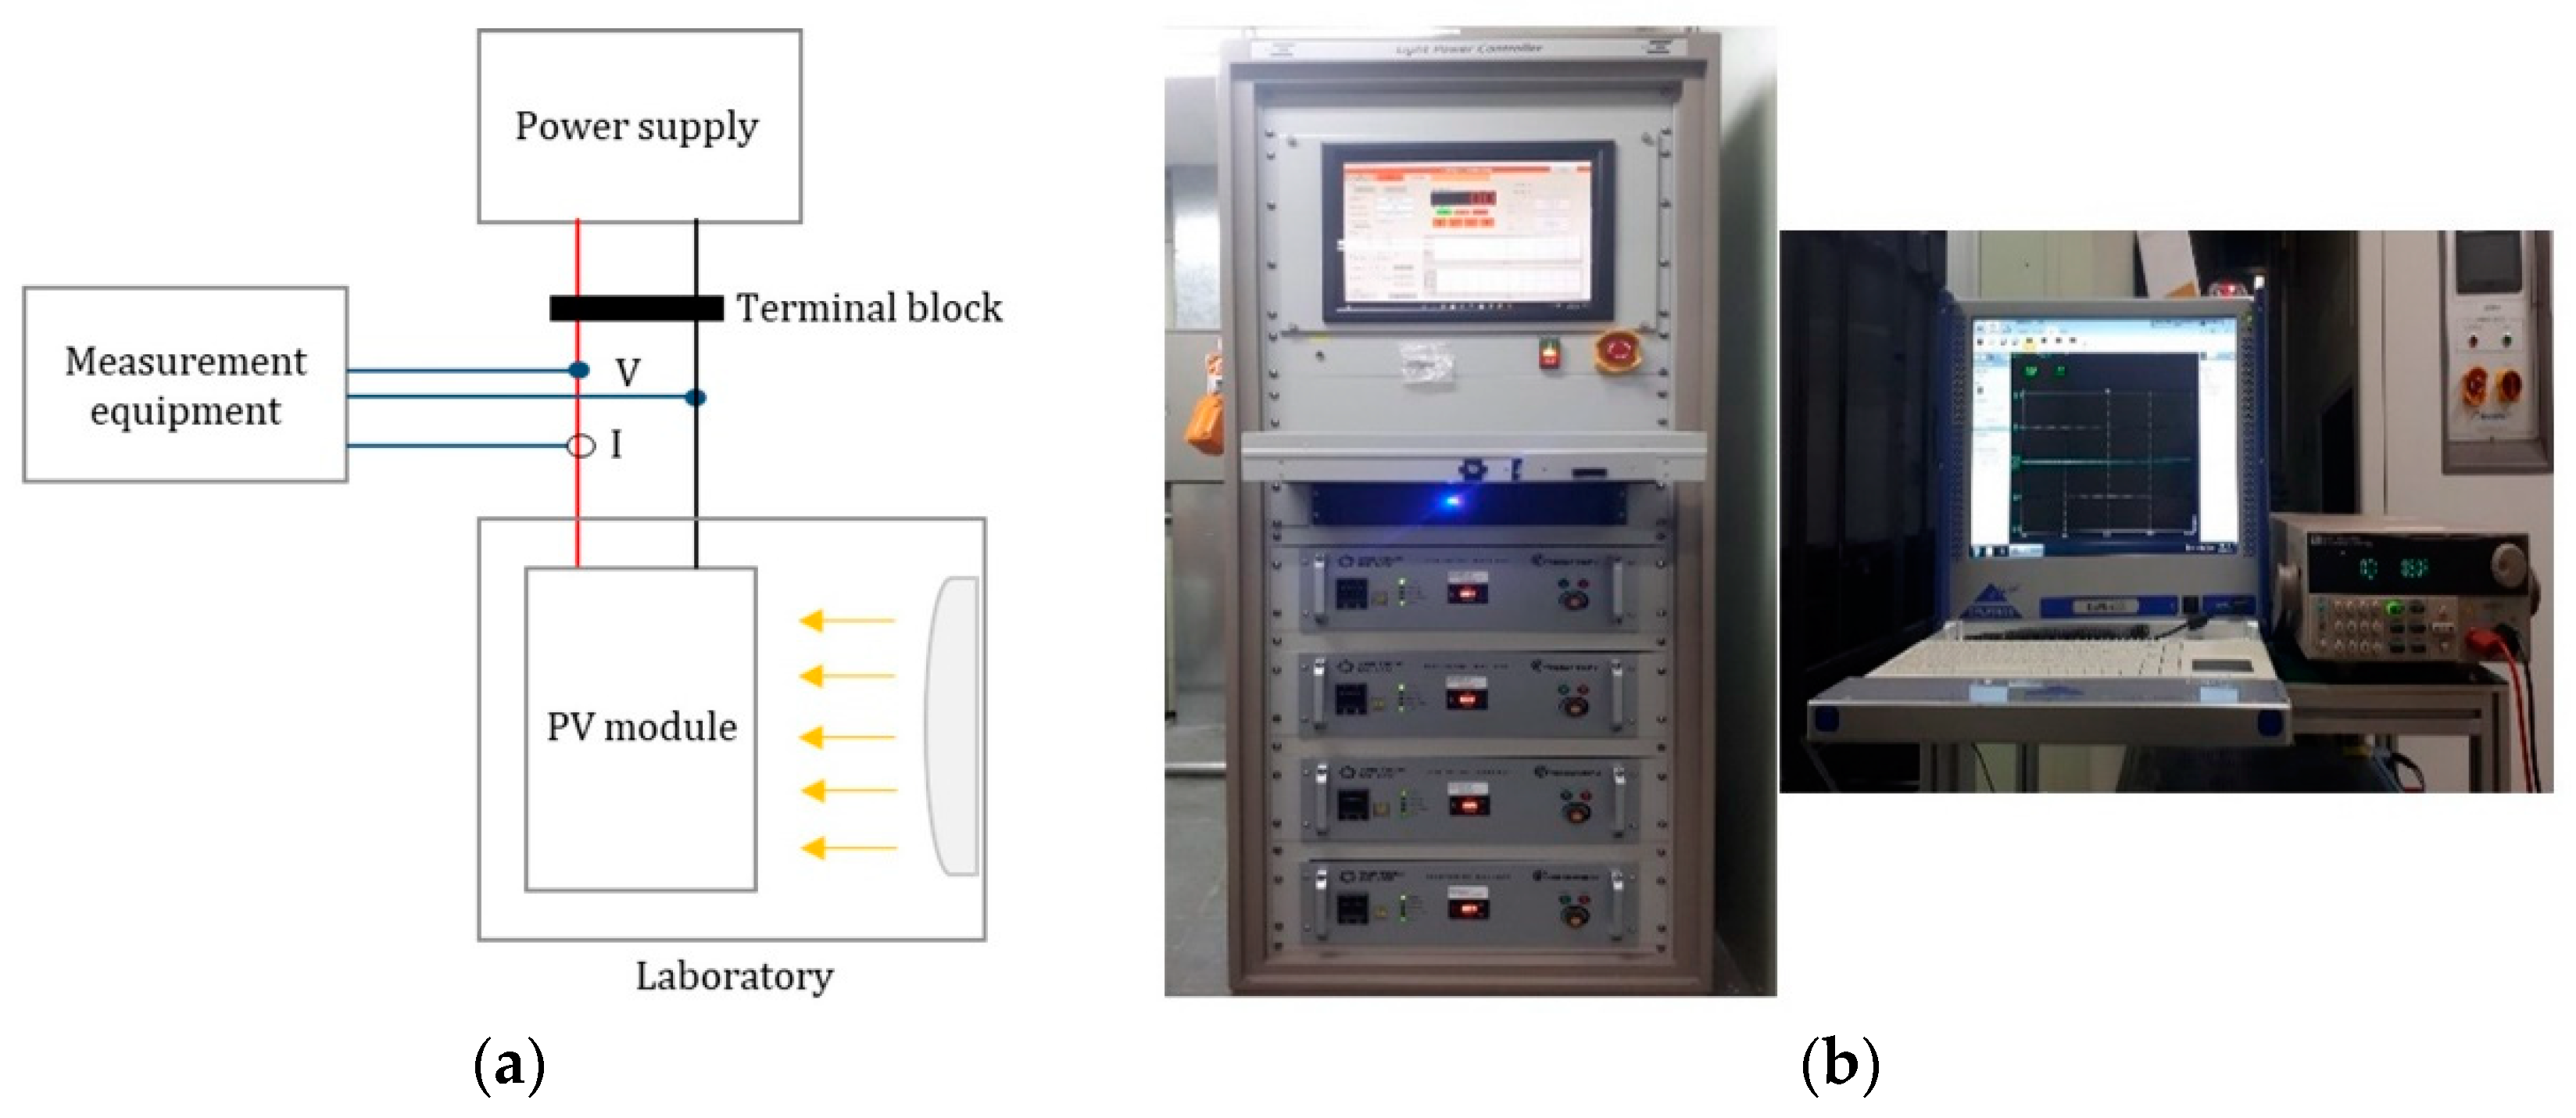
The voltage mismatch of PV arrays occurs due to the voltage drop of some PV modules in PV strings. It causes a potential difference between PV strings, which may result in a reverse current. In this chapter, an experiment was conducted to confirm the electrical characteristics of the PV module due to voltage mismatch. The voltage mismatch situations were assumed to be three-fold: non-uniformity irradiance, the operation of bypass diodes by partial shading, and the failure of bypass diodes. In each voltage mismatch condition, I–V curves were measured to analyze the electrical characteristics. The PV module used in the experiment was of a 260 W power class and consisted of 60 polycrystalline solar cells and three bypass diodes. Each experiment was conducted using the same PV module. The experimental equipment consisted of a power supply, a light source device for controlling the amount of irradiance, and a device capable of measuring voltage and current, as shown in
Figure 1b. The power supply is a device that simulates the state of applying power in the reverse direction of the PV module. That is, when the voltage mismatch occurs, the reverse voltage of the PV module is applied by a power supply, and the reverse current can flow to the PV module. The voltage and current of the power supply were set to the values of an open-circuit voltage (37.9 V) and the short-circuit current under the STC (Standard Test Condition) of the PV module used in the experiment. The reverse voltage and current of the PV module were measured in the configuration shown in
Figure 1a. As shown in
Figure 1b, the light was irradiated to the PV module using the equipment, which can control an artificial light source, and the reverse voltage and current of the PV module were measured under each voltage mismatch situation using a measuring device. The heat of the laboratory was maintained at 25 to 30 °C.
2.1. Non-Uniformity of Irradiance
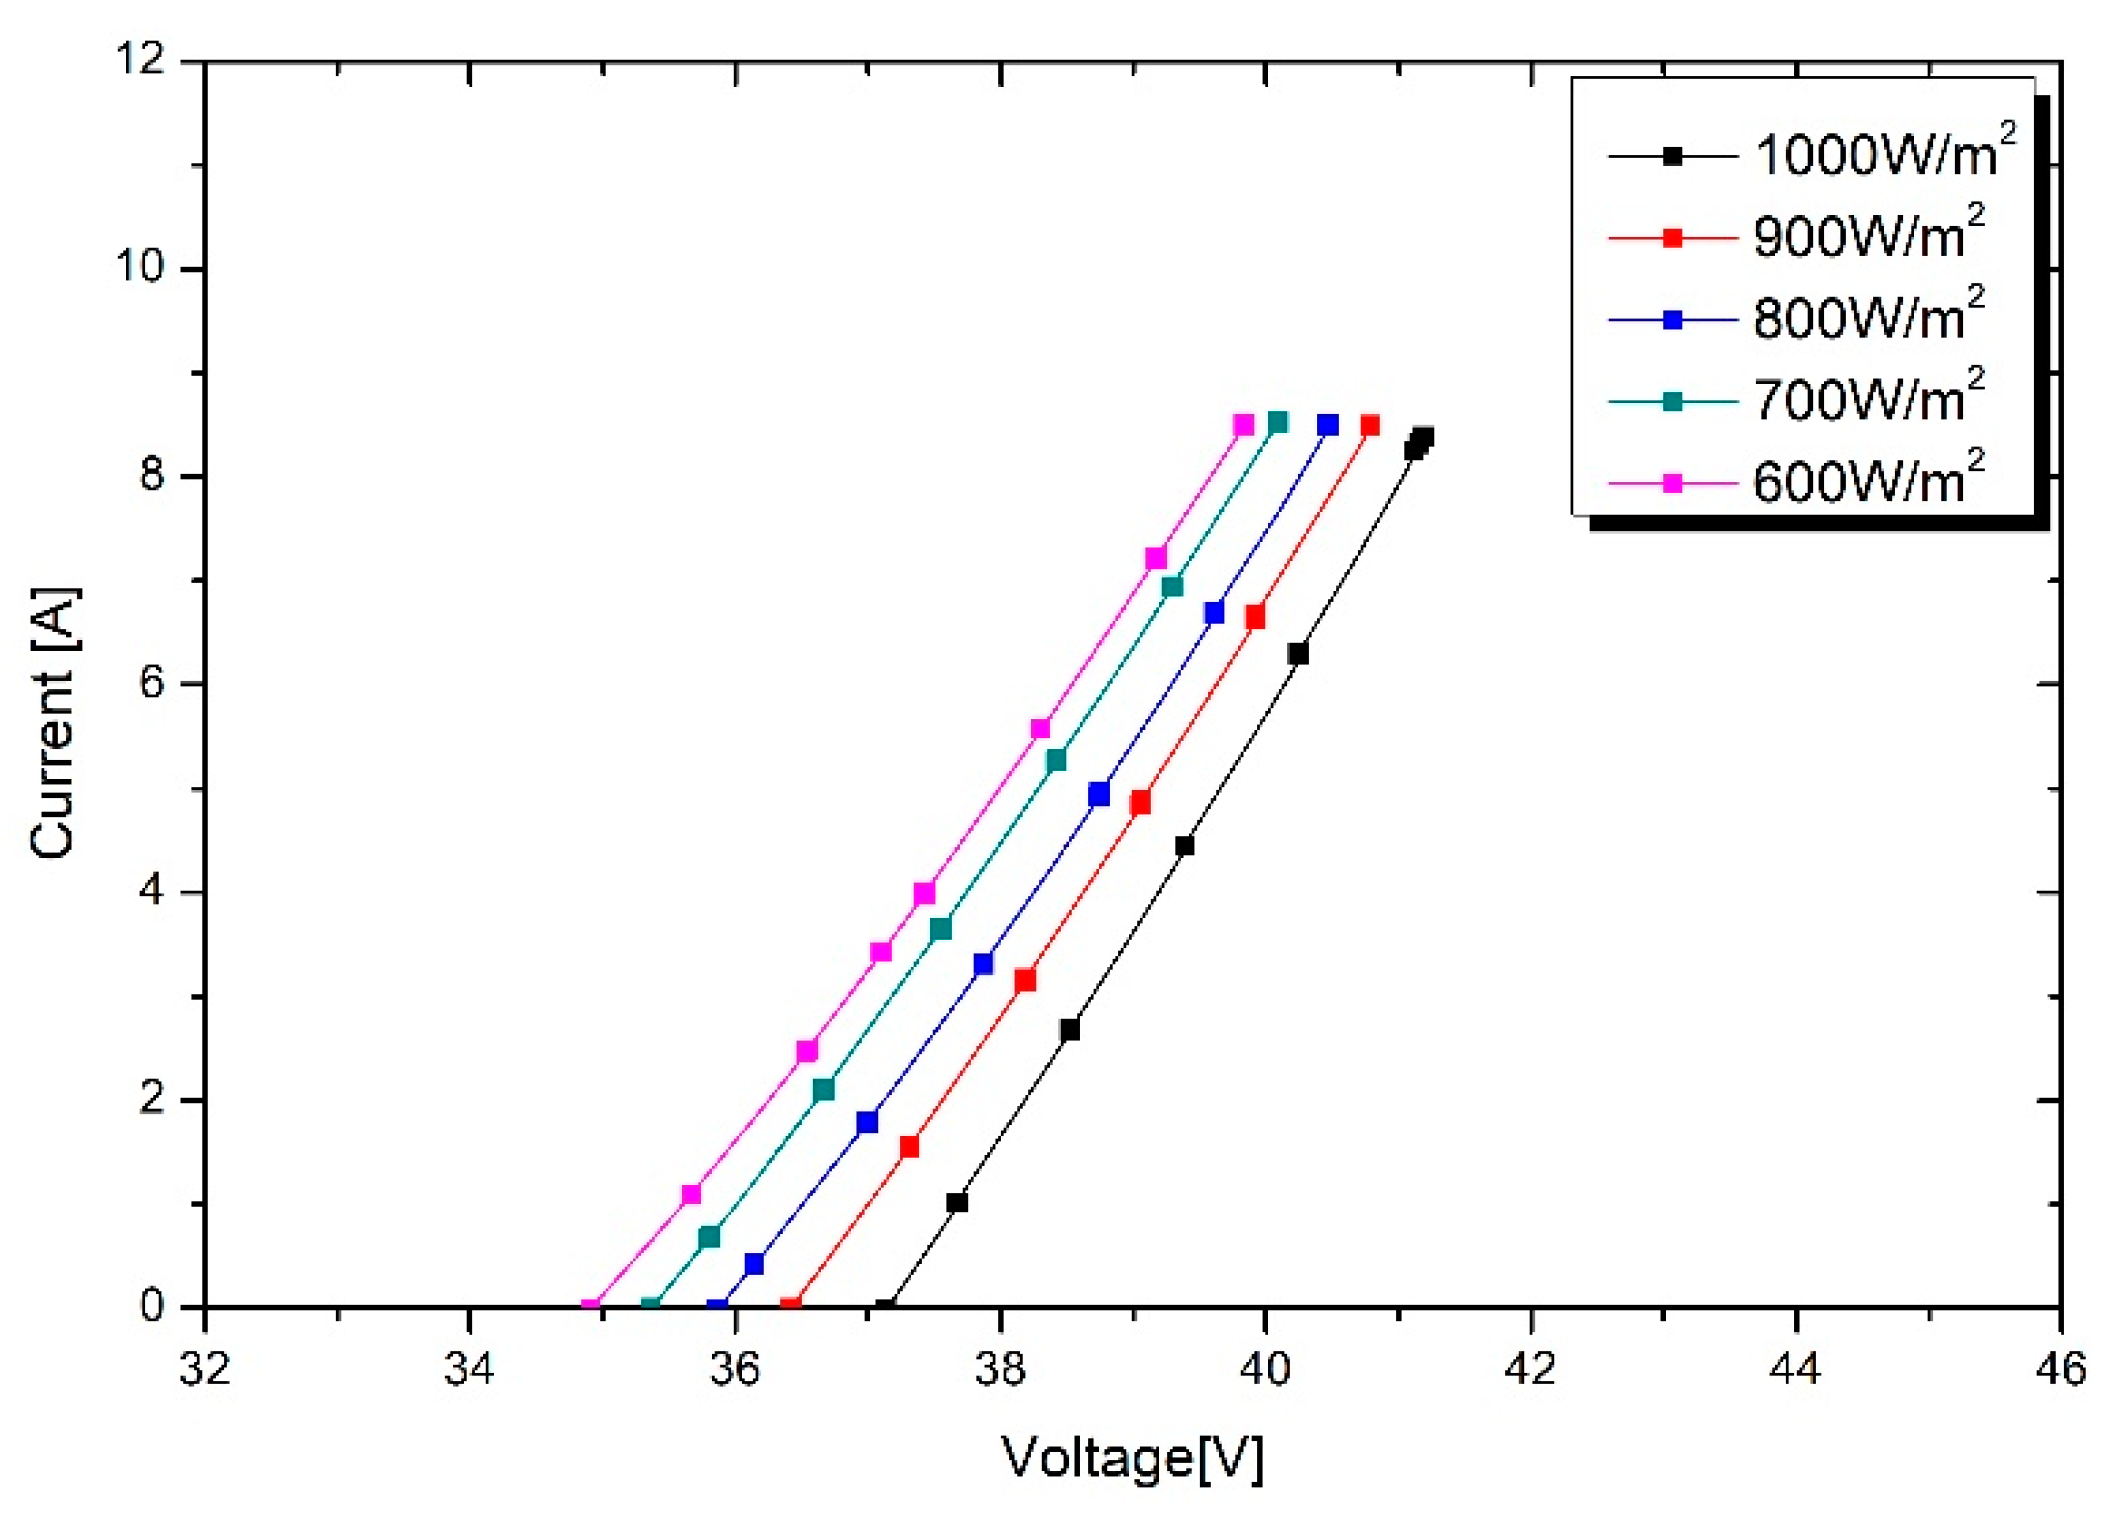
An experiment, in which a reverse current flowed to the PV module by a non-uniformity of irradiance, was conducted to confirm the open-circuit voltage and current characteristics. The amount of irradiance was reduced by 100 W/m
2 from 1000 W/m
2 to 600 W/m
2, thereby simulating a non-uniformity of irradiance. The open-circuit voltage, through which the reverse current flowed, was repeatedly measured, while gradually increasing the voltage of the power supply from 0 V at each irradiance. The open-circuit voltage and current characteristics, as the reverse current begins to flow for each irradiance, are shown in
Figure 2. At 1000 W/m
2, the reverse current began to flow from 37.14 V, which is the open-circuit voltage of the test PV module. At 900 W/m
2, which reduced the amount of irradiance by 100 W/m
2, the reverse current flowed from 36.42 V, which is 0.72 V lower than 1000 W/m
2. At 800 W/m
2, 700 W/m
2, and 600 W/m
2, the reverse currents flowed from 35.86 V, 35.36 V, and 34.91 V, respectively. From the experimental results, even if irradiance decreased to 400 W/m
2, compared to 1000 W/m
2, the open-circuit voltage difference of the PV module was 2.23 V.
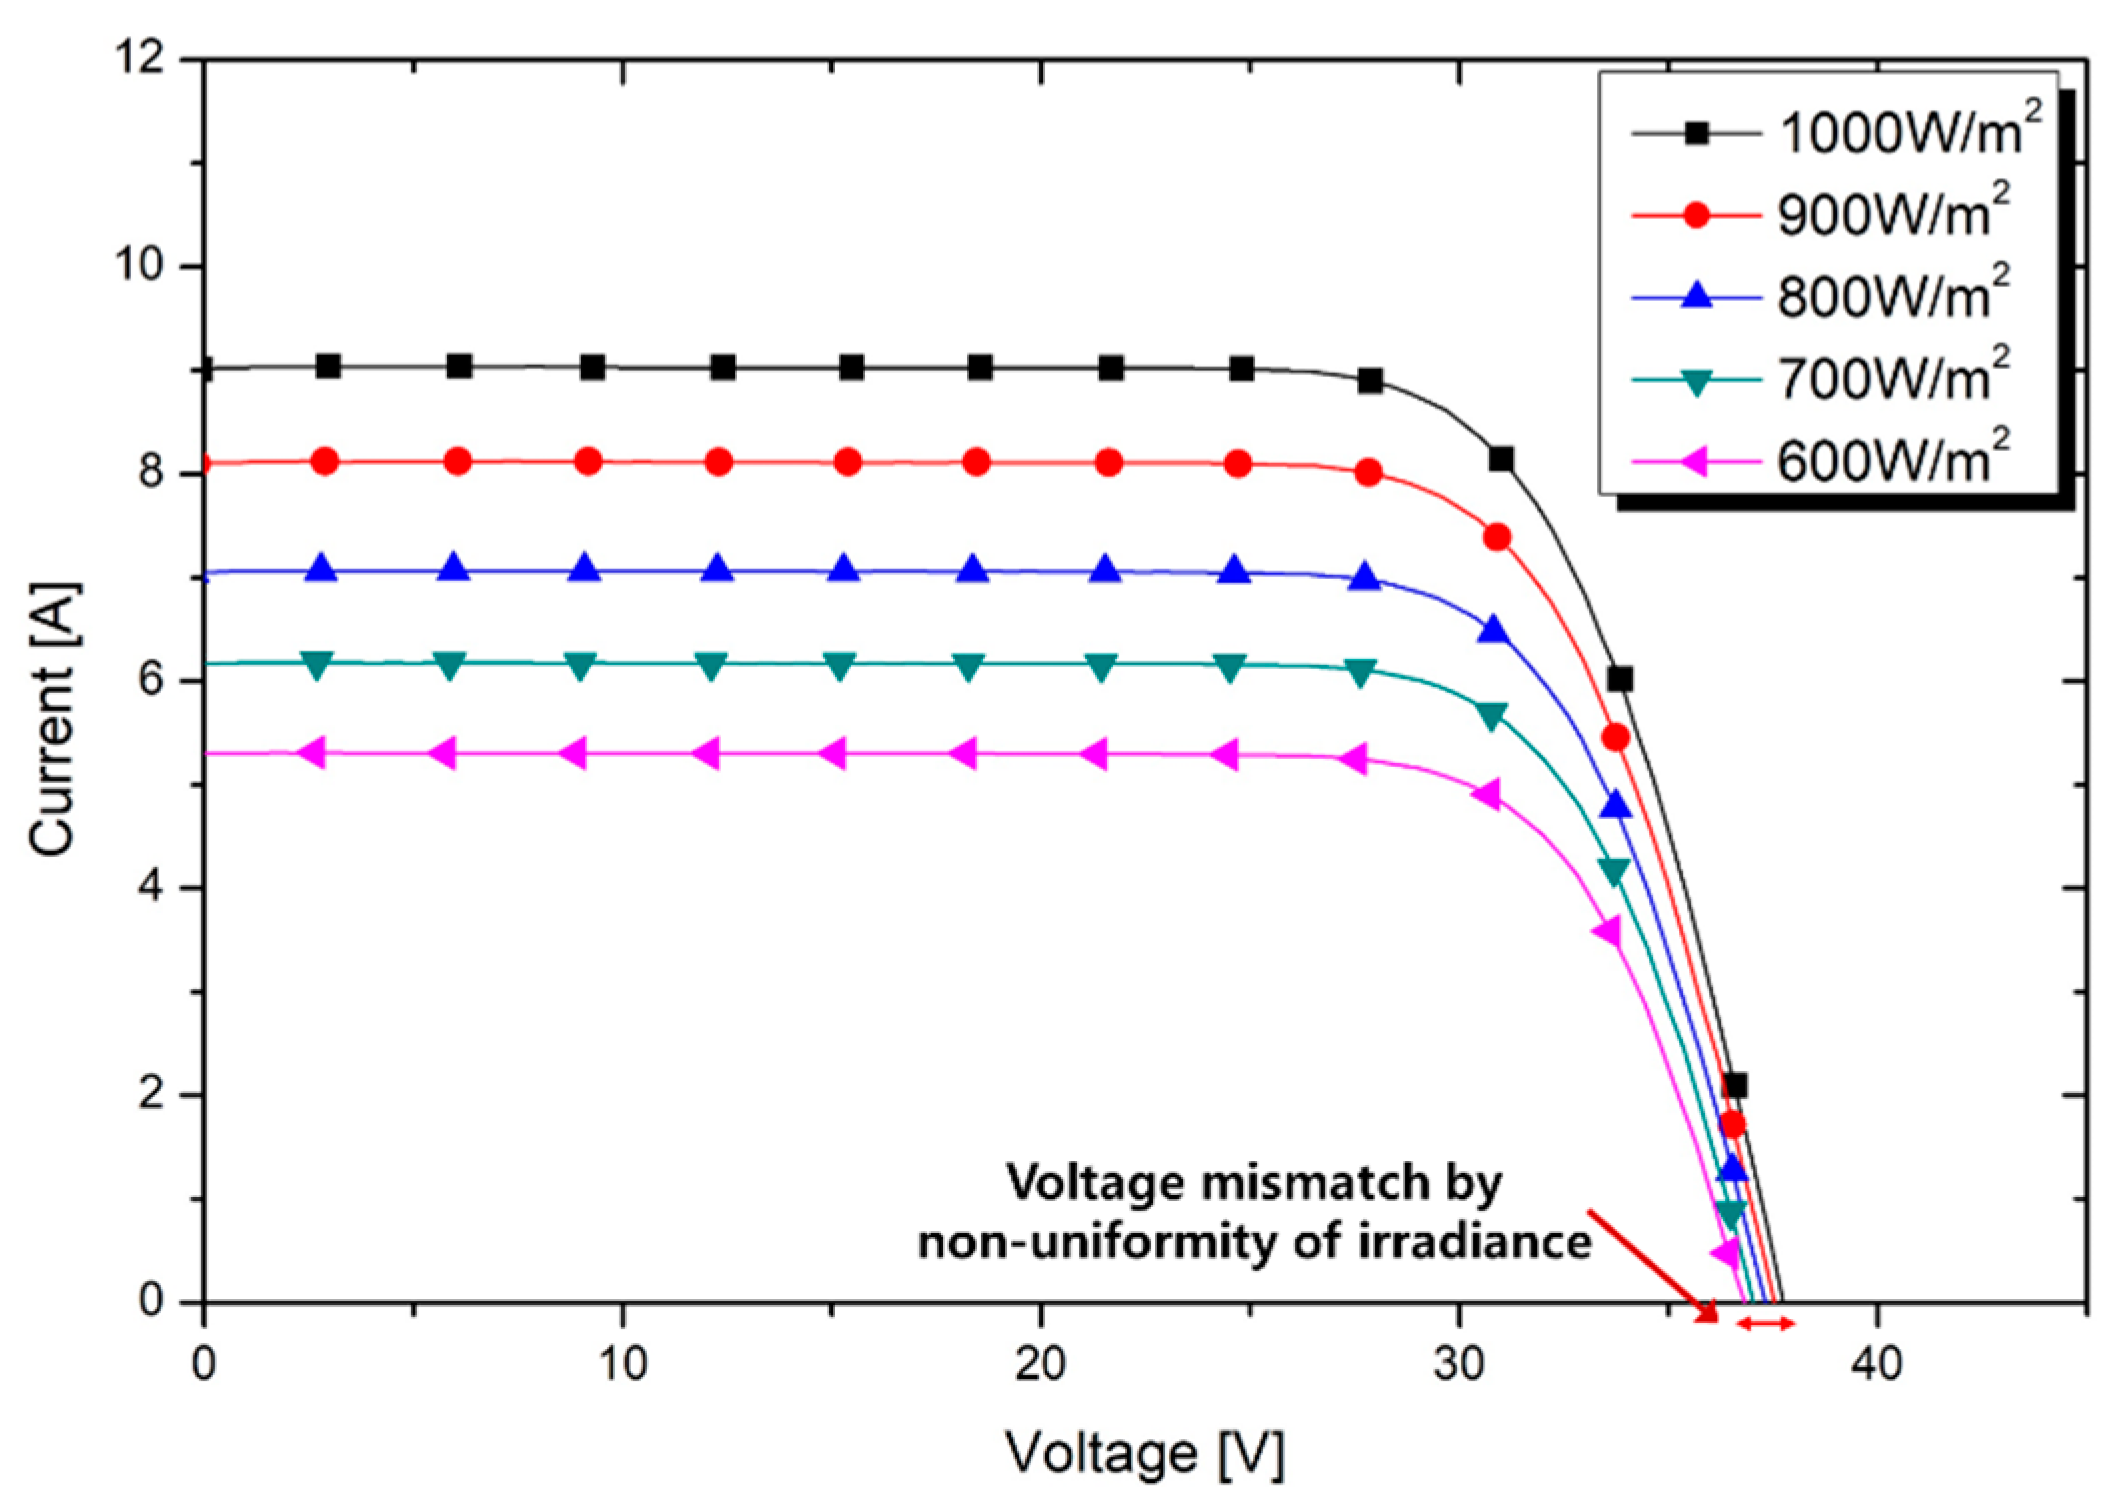
Figure 3 is the I–V curve of the PV module, measured when the irradiance was 1000 W/m
2 and 600 W/m
2. As shown in the figure, the PV module has the characteristics of the current significantly decreasing and the voltage slightly decreasing, when the irradiance is decreased. Due to these characteristics, even if the non-uniformity of irradiance occurs, the open-circuit voltage of the PV module does not decrease significantly, so the voltage mismatch between the PV modules is not significant. Therefore, even if the non-uniformity of irradiance on the PV modules occurs due to the soling of front glass or a cloud, it can be estimated that little or very little reverse current may flow to PV modules.
2.2. The Operation of Bypass Diodes by Partial Shading
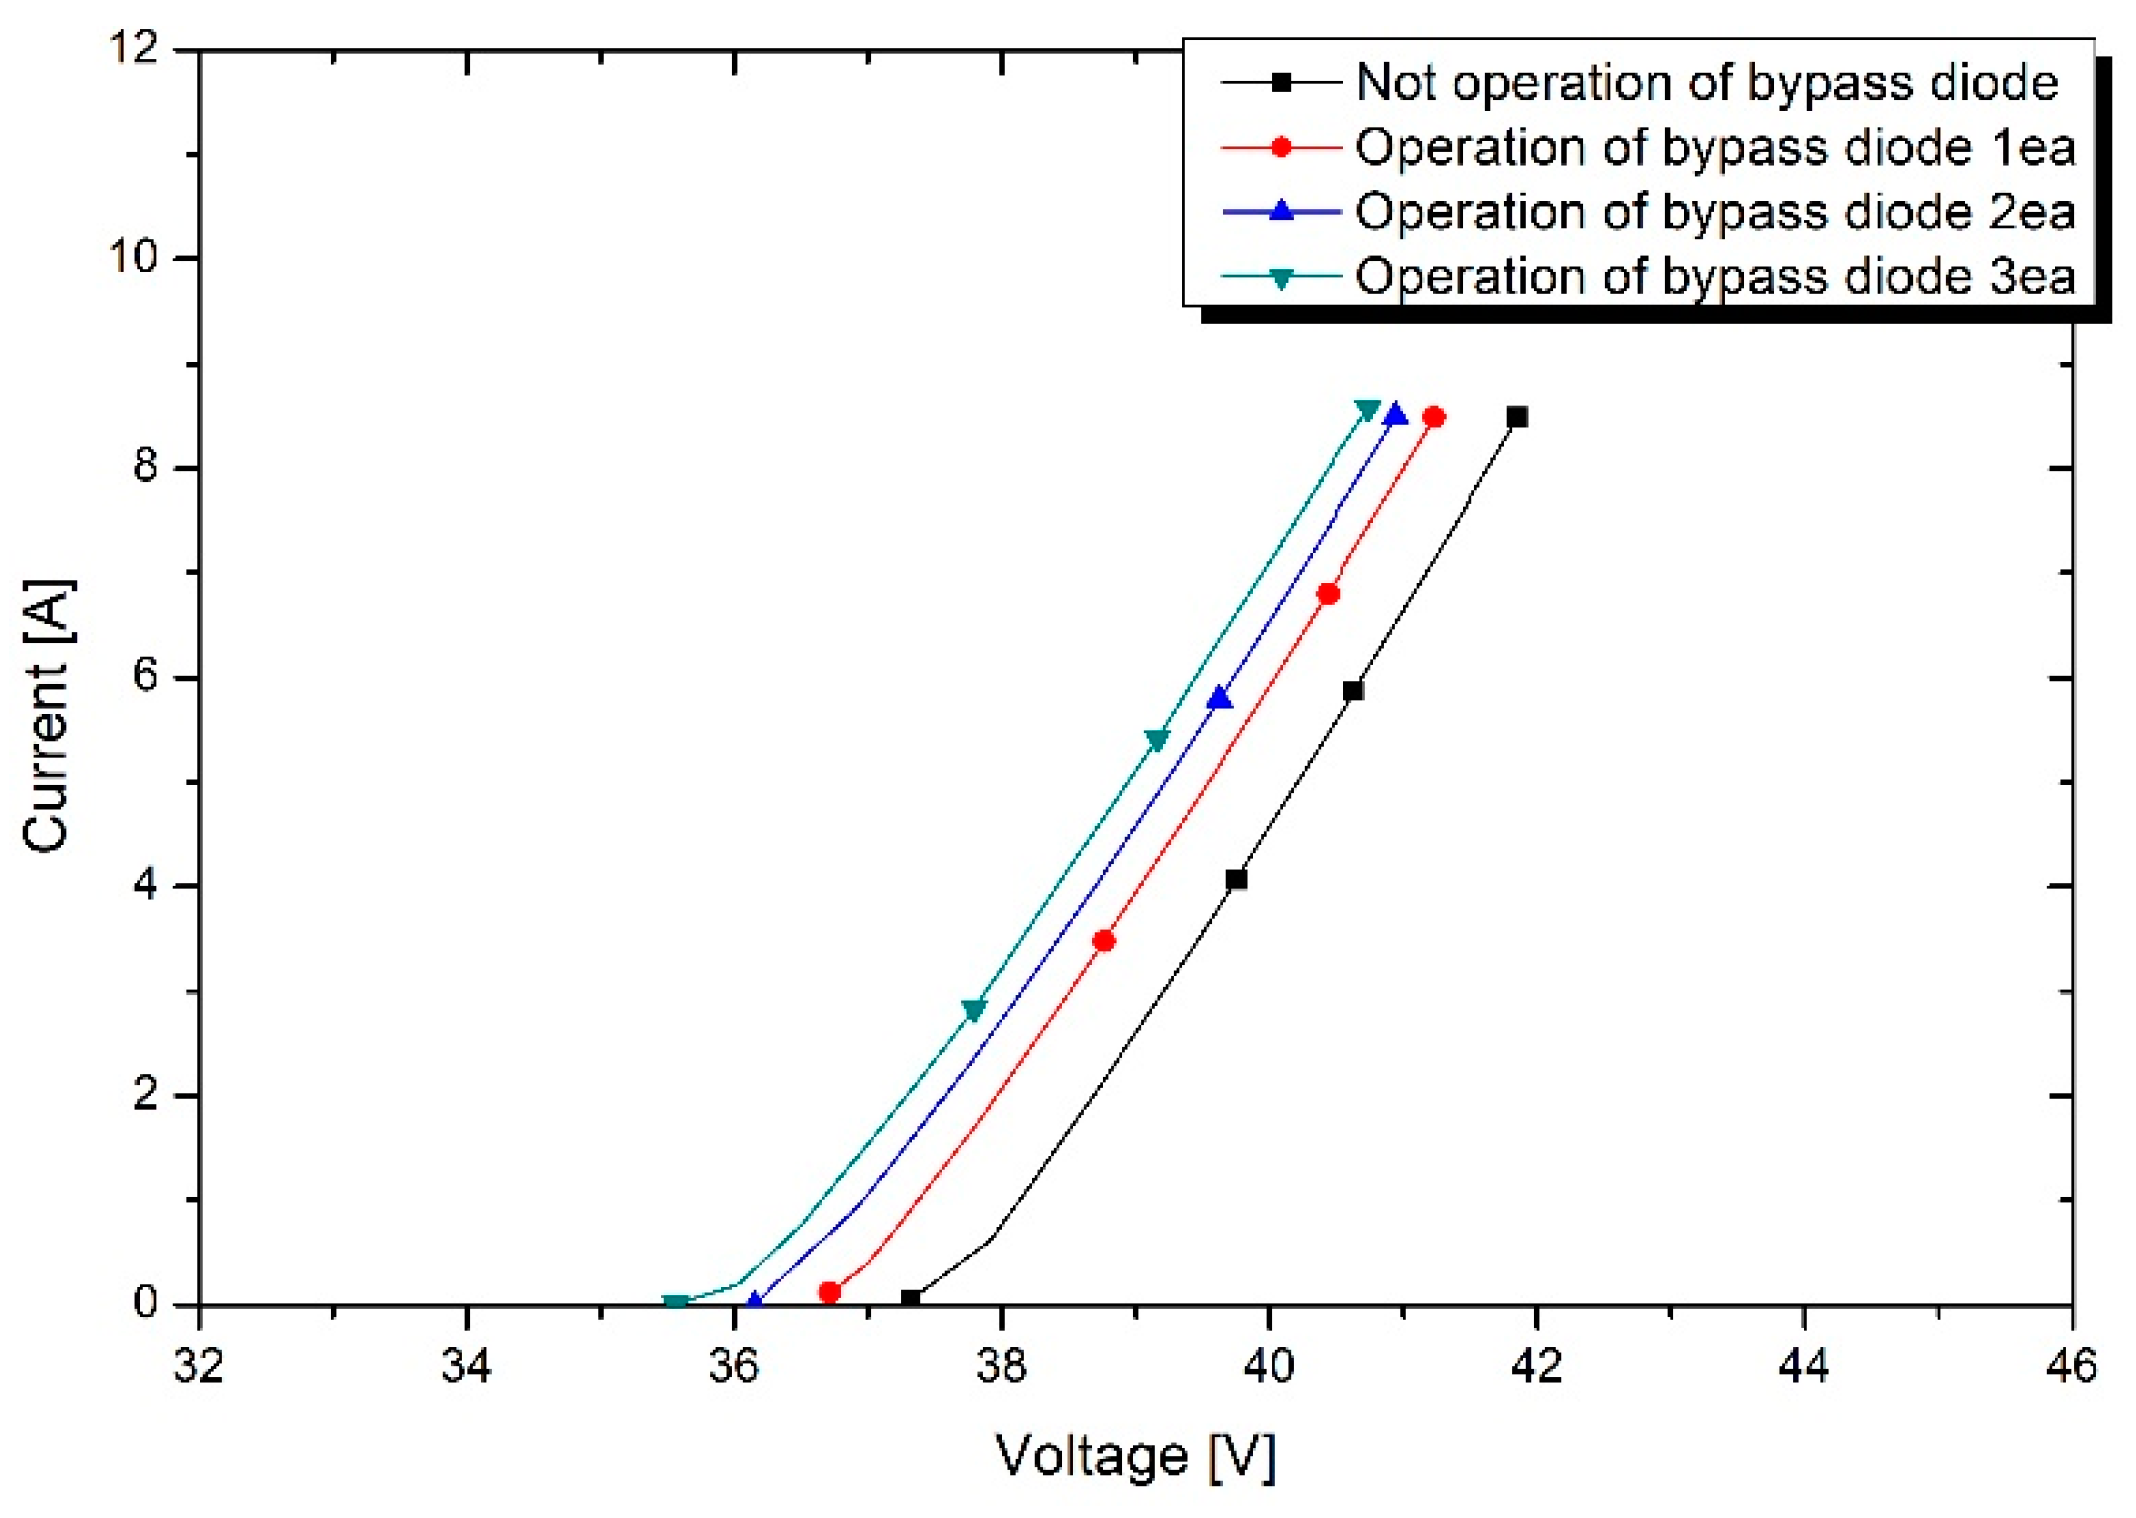
The partial shading was simulated to confirm the open-circuit voltage, through which reverse current flows by the operation of bypass diodes. In order to operate the bypass diode completely, a black sheet that does not transmit light was attached to the front glass of the PV module (solar cell area). The irradiance of the light source device was fixed at 1000 W/m
2. In addition, the number of operation of the bypass diodes was changed to confirm the electrical characteristics of the PV module according to the number of operation of the bypass diodes (three bypass diodes in the experimental PV module). The experimental results are shown in
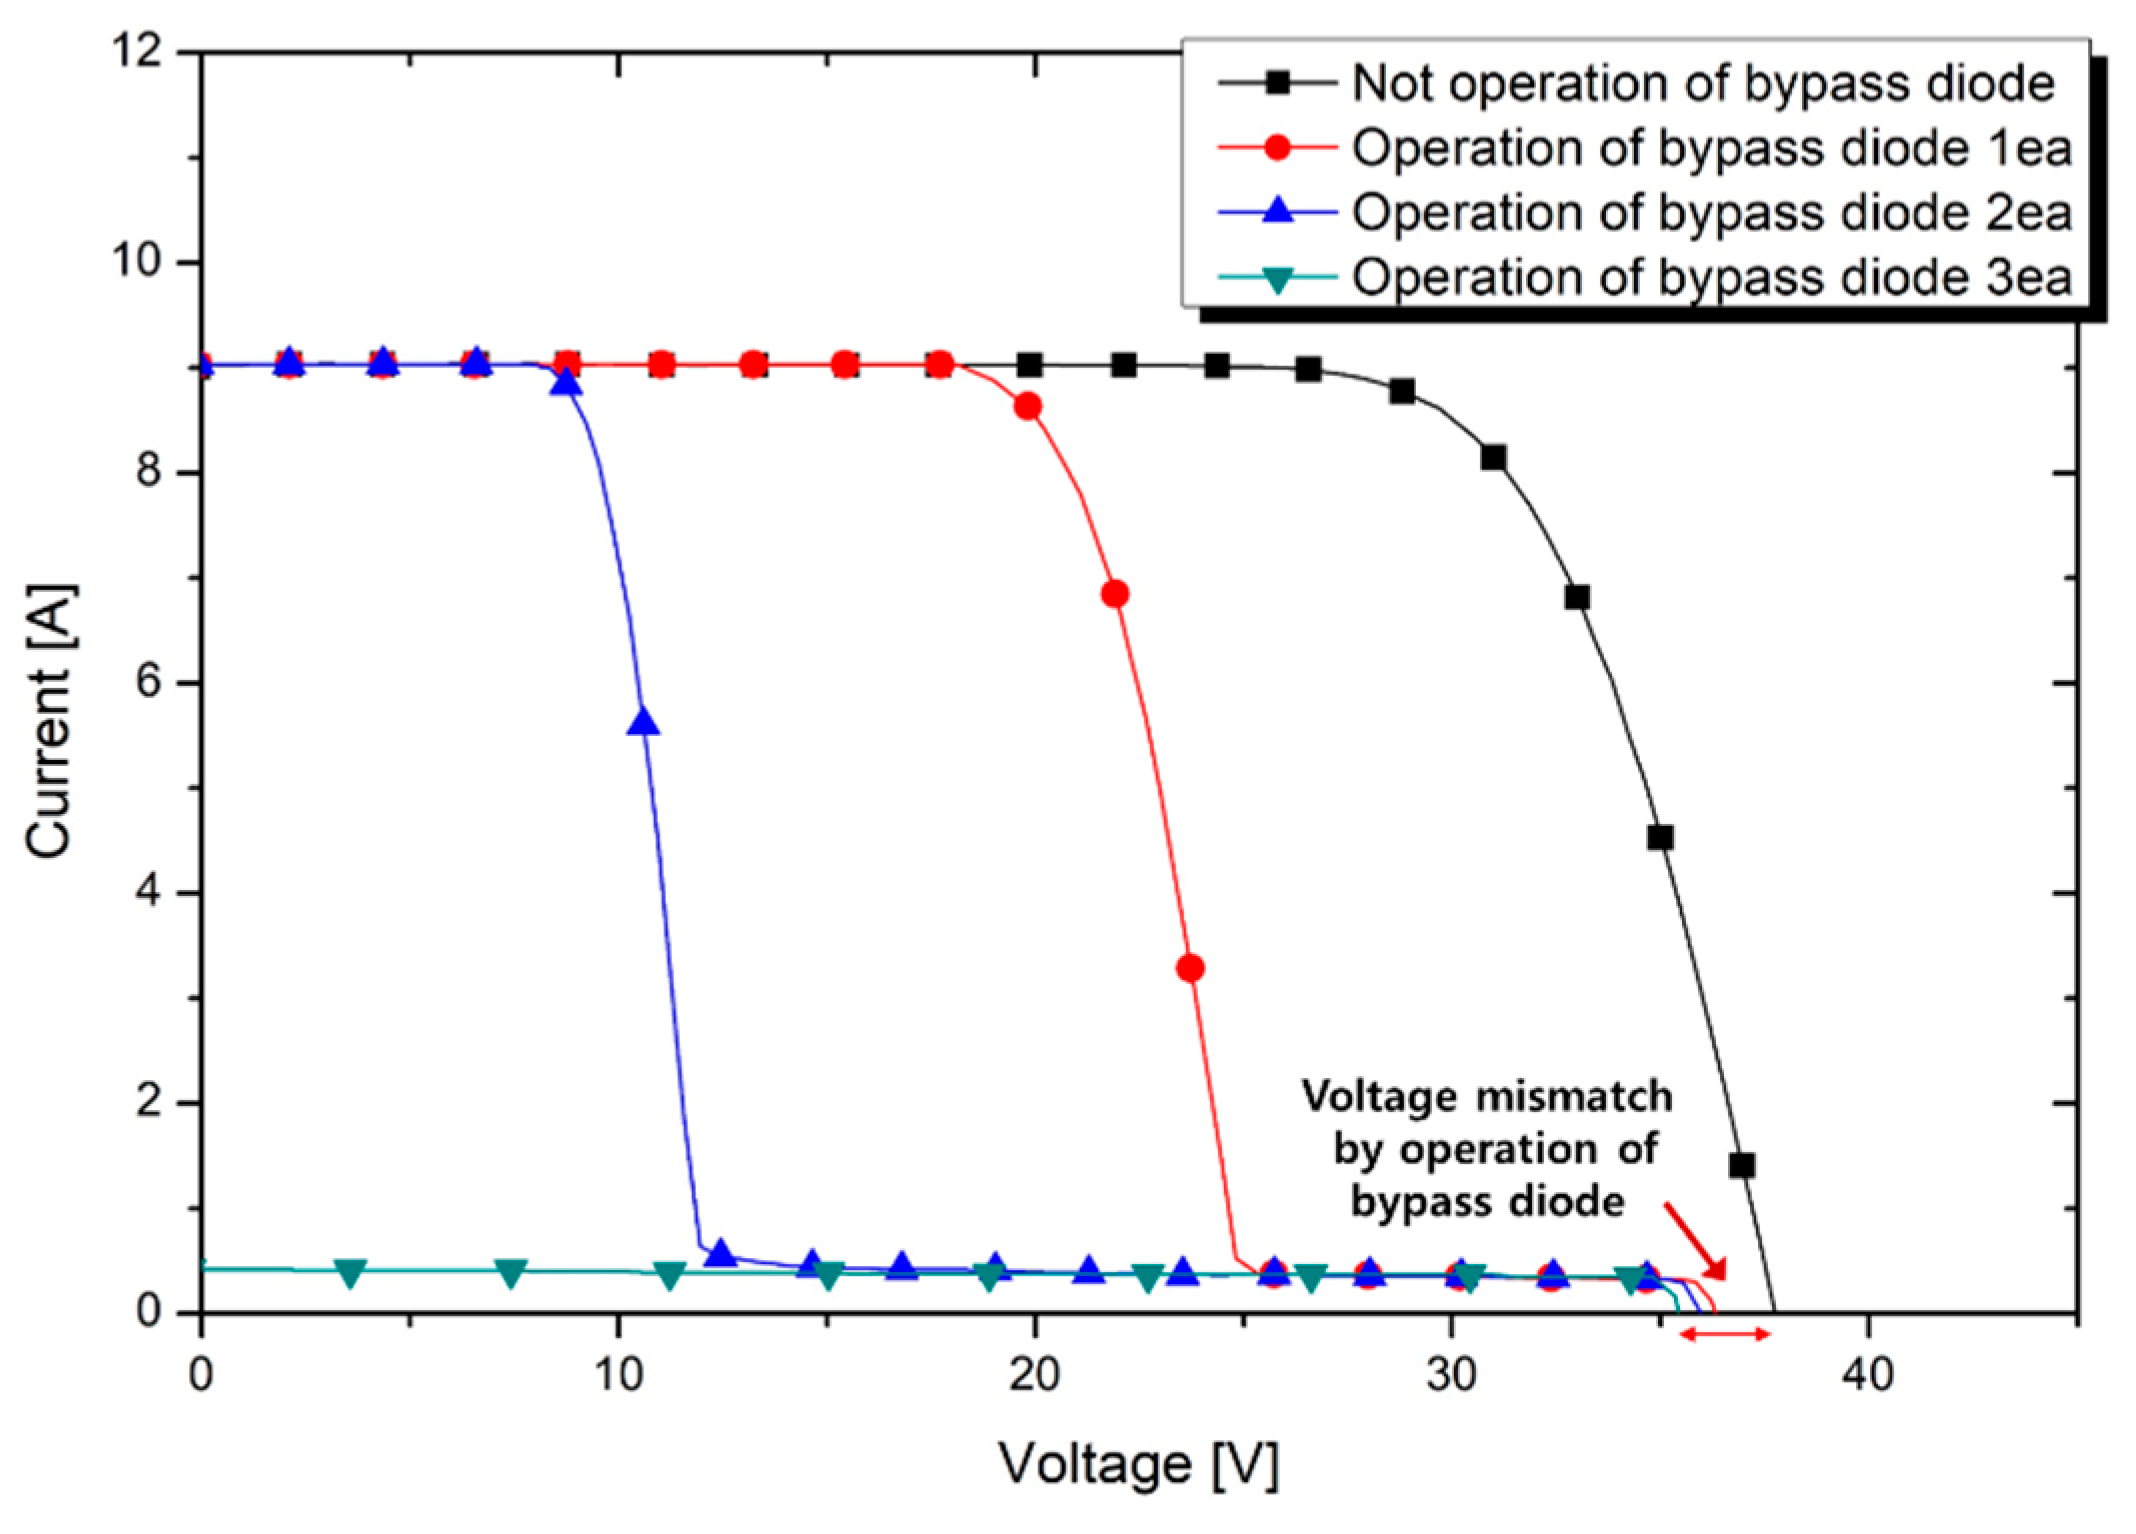
Figure 4. In the case of the normal condition (=no partial shading), the reverse current flowed to the PV module at 37.32 V. In the case of the operation of one, two, or three bypass diodes, the reverse current flowed at 36.71 V, 36.15 V, or 35.56 V, respectively. A voltage drop of 0.4–0.6 V, which is the operating voltage of a bypass diode, occurred sequentially. The voltage difference due to the operation of the bypass diodes was up to 1.76 V.
Despite the operation of the bypass diodes, the difference of open-circuit voltage, through which reverse current flows, was small. The PV module I–V curves, before and after the operation of the bypass diodes, are shown in
Figure 5. The measured module I–V curves were for the case when all bypass diodes were not operated, and bypass diode operated sequentially. Bypass diodes operate when there is shading on some solar cells in the PV module because shading causes a potential difference of solar cells. Additionally, bypass diodes are connected in parallel with dozens of solar cells that are connected in a series. Therefore, when the bypass diodes are conducted, the voltage produced by the connected solar cells decreases to about 0.4–0.6 V, which is the operating voltage of the bypass diode. Even if the maximum power voltage of the PV module is reduced to about 1/3 by the operation of one bypass diode, the open-circuit voltage difference due to the operation of a bypass diode is small, as shown in
Figure 5.
According to the I–V curve of the PV module of
Figure 5, a minute current flows into the solar cells, but no reverse current flows in the voltage range below the open-circuit voltage when bypass diodes are operated. This could be considered a state in which solar cells have a voltage, while the bypass diodes are operating. Therefore, the reverse current does not flow until the open-circuit voltage (=forward operating voltage) of solar cells and the reverse current flow beyond the open-circuit voltage of solar cells. For this reason, when the bypass diode is operating by partial shading, the voltage mismatch is within 2 V, so there is little or very little reverse current flow to PV modules.
2.3. The Failure of Bypass Diodes
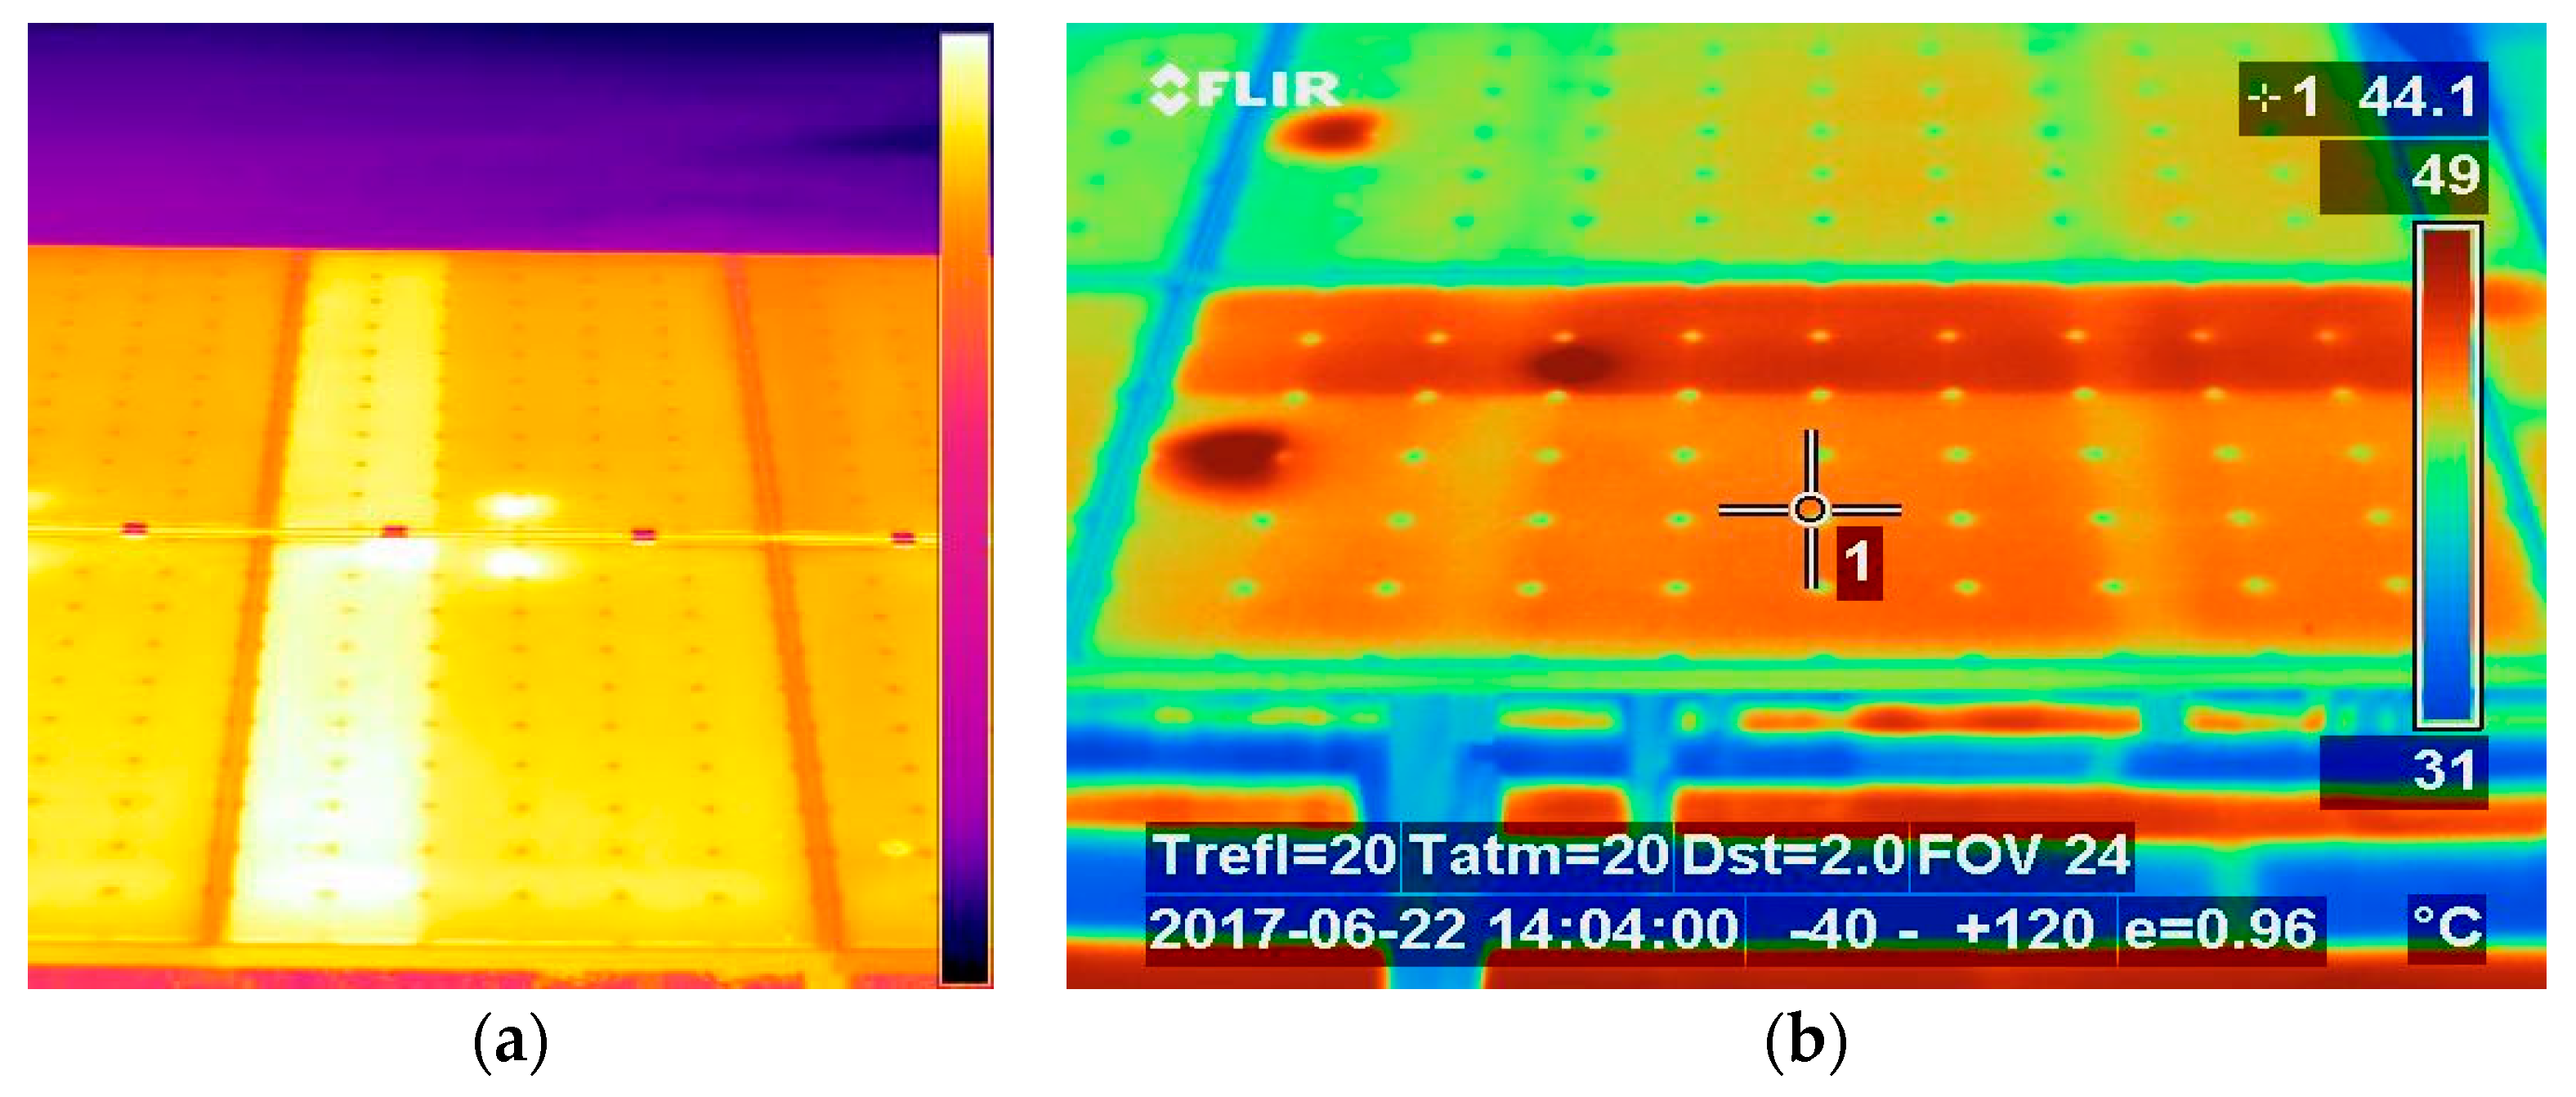
In PV plants, the case of failure of bypass diodes have been reported which causes the output loss and reliability of the PV system [
15,
16]. Moreover, the plant diagnosis results for thermal images of the short circuit fault of the bypass diode are reported as
Figure 6 [
17]. The causes of the failure of bypass diodes are Electrostatic Discharge (ESD) and thermal runaway. ESD refers to very large current flowing to bypass diodes in a flash by very high voltage pulse, and it is related to surge current by nearby lightning strikes. Thermal runaway is widely known as a cause of the failure of general diodes, and diodes are destroyed by continued heat and current [
18]. It causes the bypass diode to fail, and the junction of the bypass diode is damaged. Bypass diodes with damaged junction lose their switching characteristics and are in a short-circuit state with connected solar cells [
19].
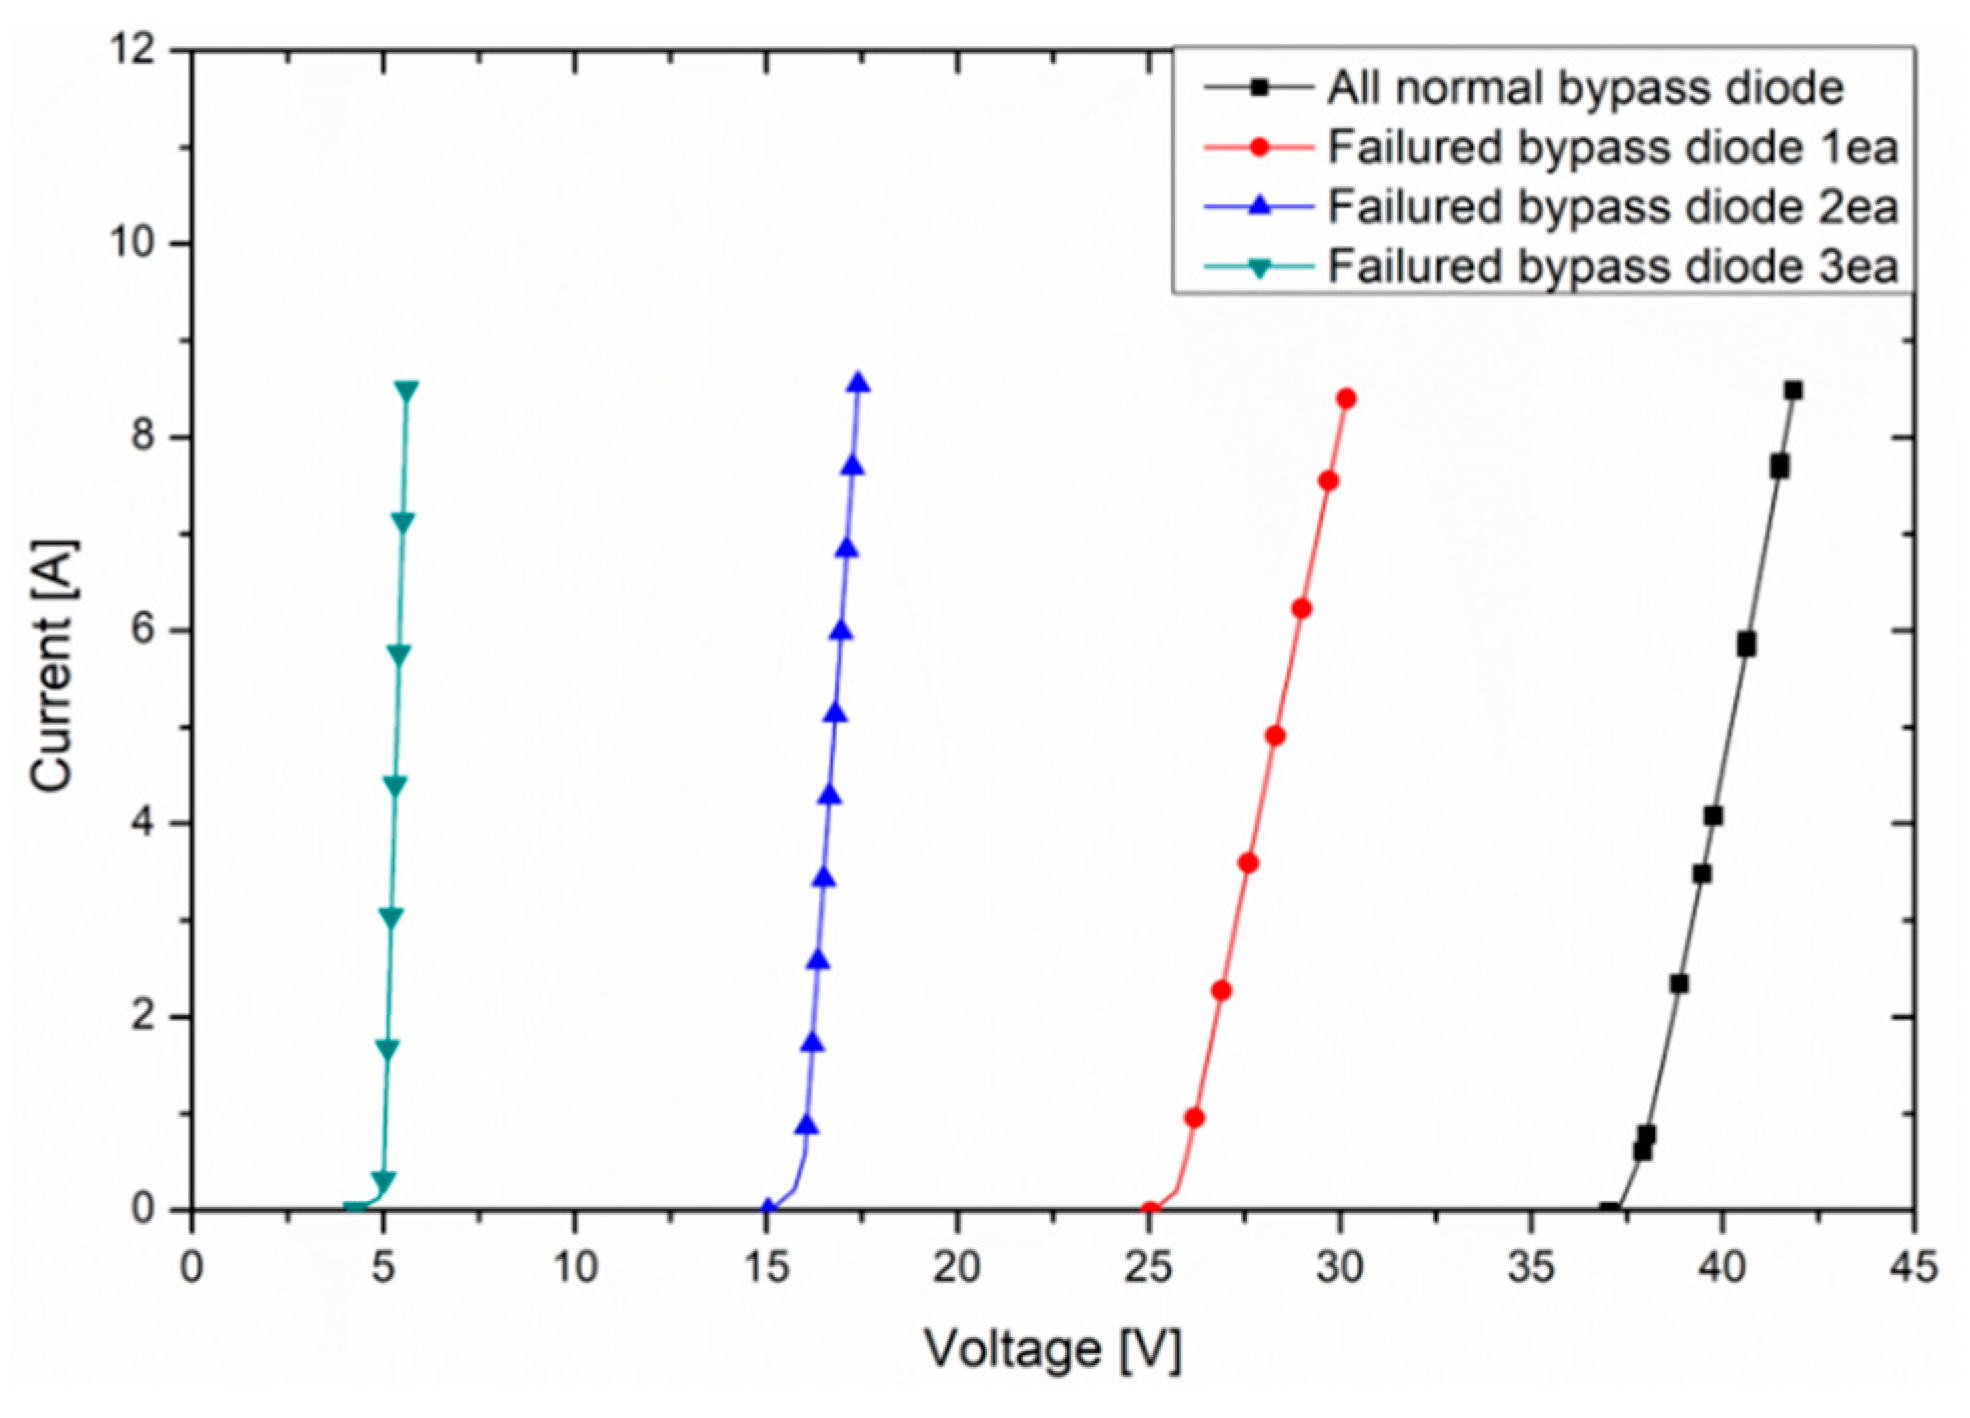
In this paragraph, an experiment was conducted to confirm the electrical characteristics, simulating the short-circuit fault of the bypass diode. The failure of the bypass diode is generally a short-circuit fault, such that the diode was artificially damaged by applying a voltage above the reverse breakdown voltage of the diode The failure of bypass diodes was inserted into the PV module to measure the open-circuit voltage, through which current flows, while changing the number of failures of the bypass diodes. During the measurement, the irradiance of the light source device was set to 1000 W/m
2, and the experimental results are shown in
Figure 7. Unlike the previous non-uniformity of irradiance and the operation of bypass diodes, it can be seen that the open-circuit voltage, through which reverse current flows, are significantly reduced. Compared to the case where all of the bypass diodes are normal, the voltage decreased by about 10–12 V, as the number of failures of the bypass diode increased. The reduced voltage is about 12 V, multiplied by the number of connected solar cells (20 ea) per bypass diode and the voltage per solar cell (0.6–0.65 V). Therefore, no output voltage occurs in the solar cells that is connected to the failure of the bypass diode. In addition, as the number of failures of the bypass diode increased, the reverse current increased linearly. This is because the current flows to the failure of the bypass diode (=conductor with a small resistance), rather than to solar cells, resulting in a resistance-shaped curve [
20].
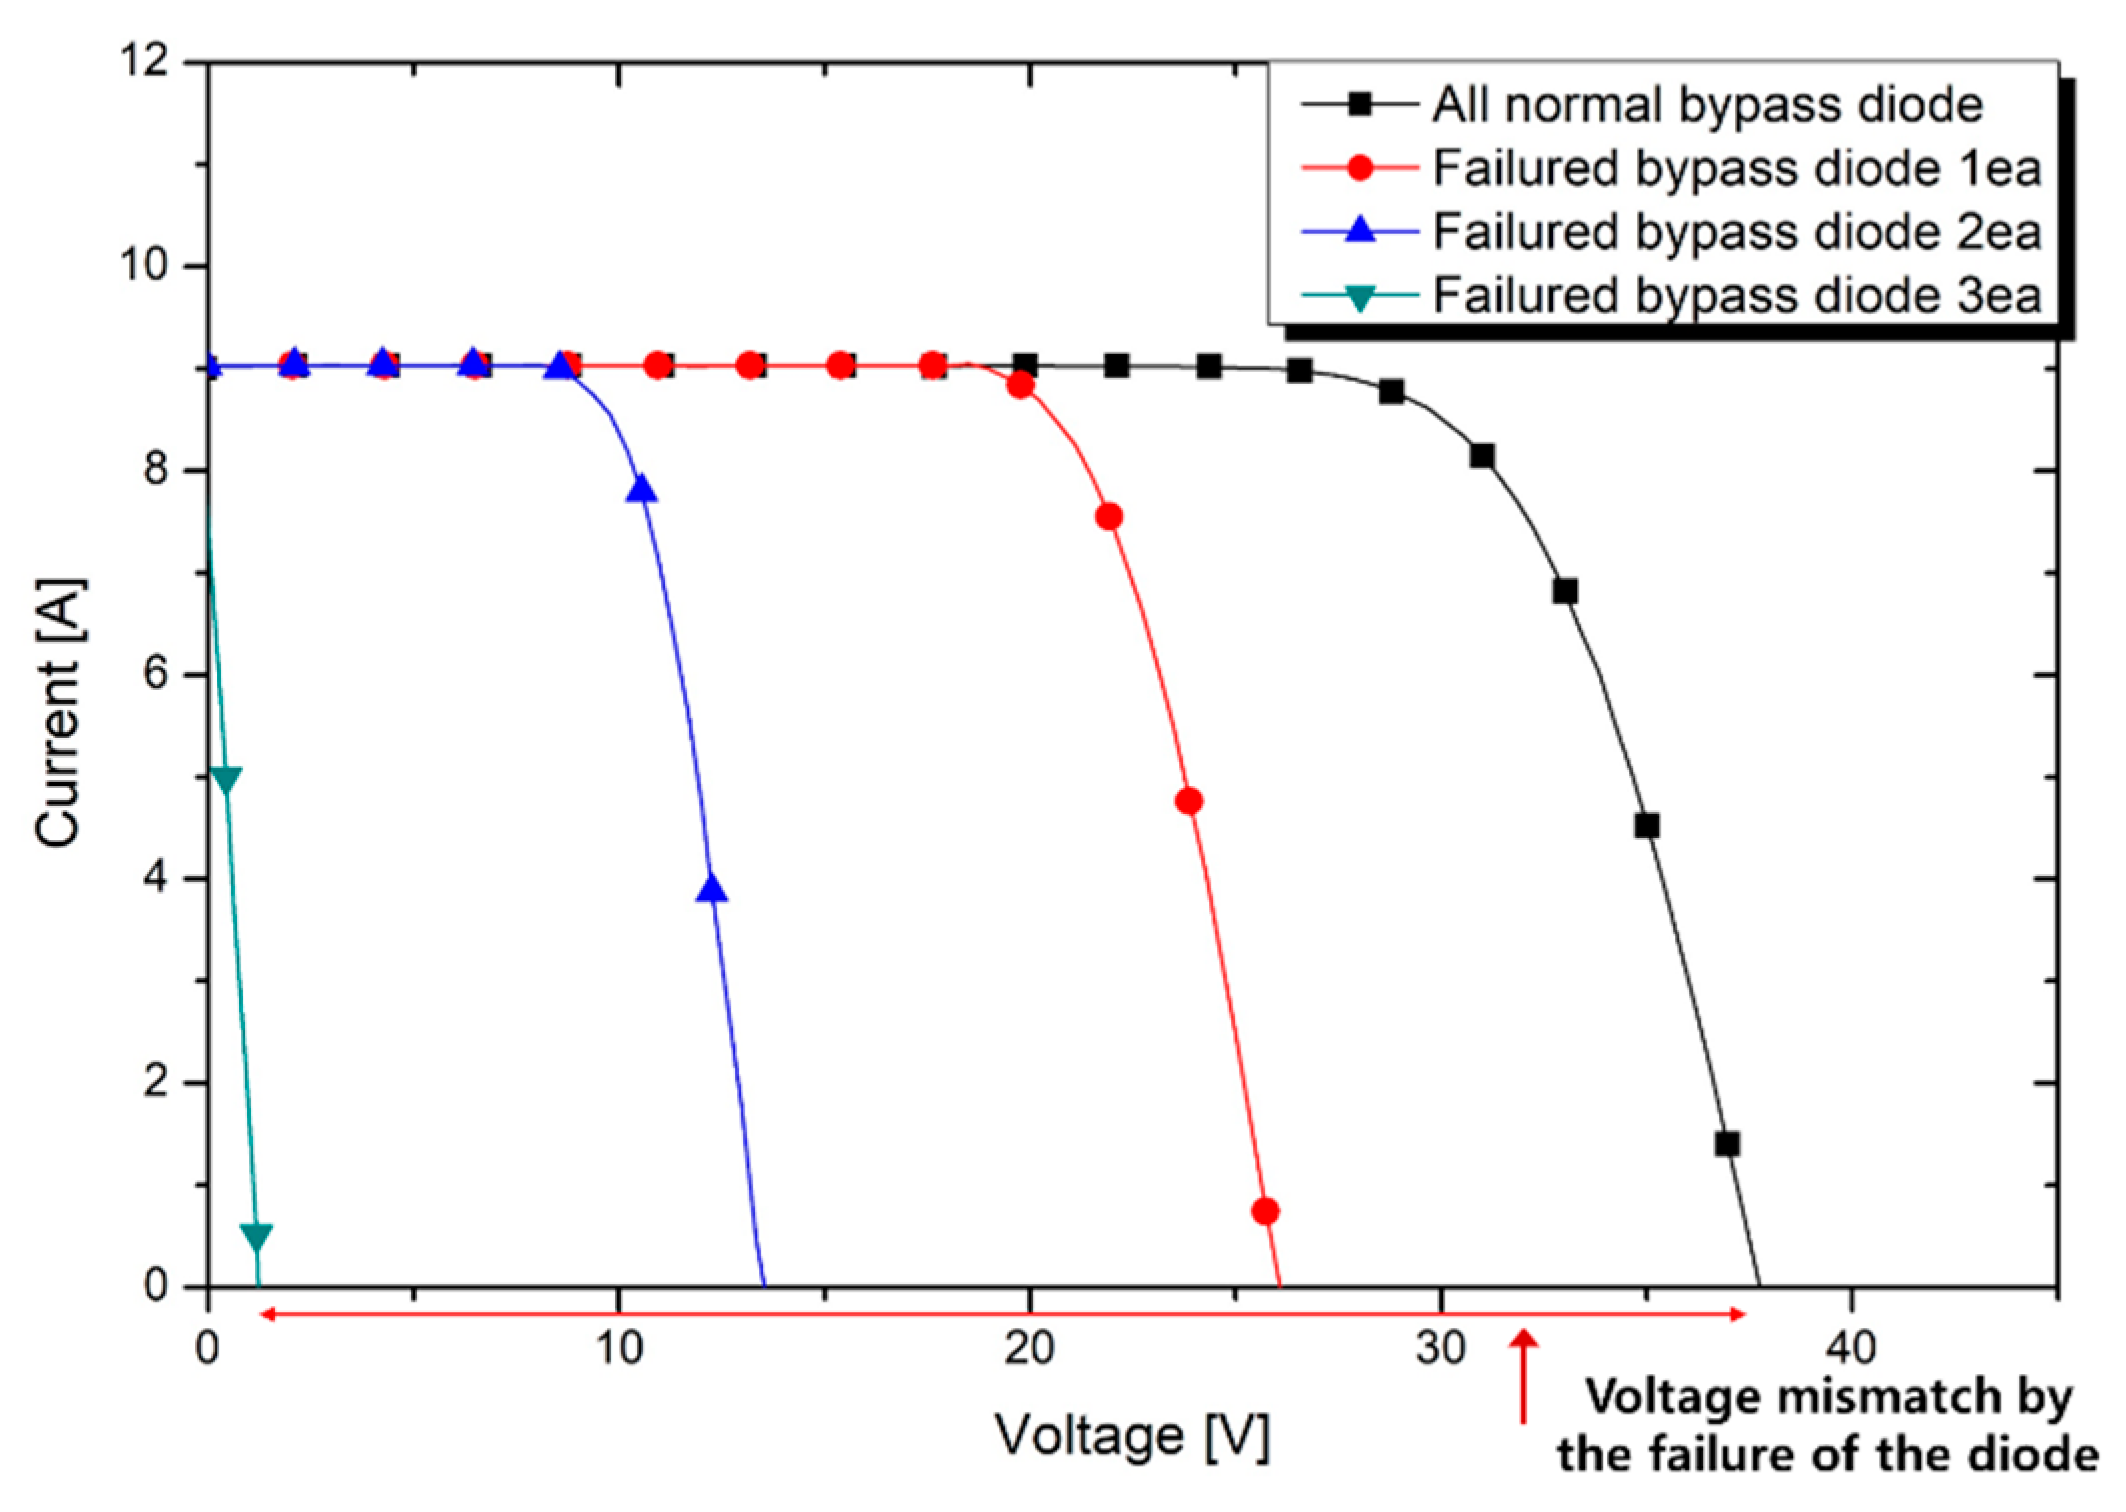
Comparing the I–V curves of the PV module with the normal bypass diode and the failure of the bypass diode, shown in
Figure 8, the open-circuit voltage of the PV module with a fault bypass diode was reduced by 1/3. The failure of the bypass diodes causes them to lose their reverse characteristics, so when a forward voltage is applied to the PV module (bypass diodes in a reverse state), current can flow into the failure of the bypass diode. At the same time, the solar cells connected to the fault bypass diode constitute a short-circuit condition, and their generated voltage is about 0 V, which reduces the overall voltage of the PV module [
21]. The experimental results show that, if all of the bypass diodes in the PV module fail, the open-circuit voltage is reduced by up to 90%, so the reverse current will likely flow into PV modules with the failure of the bypass diode.
3. PV Arrays of Electrical Characteristics Analysis under Voltage Mismatch Conditions Using Matlab-Simulink
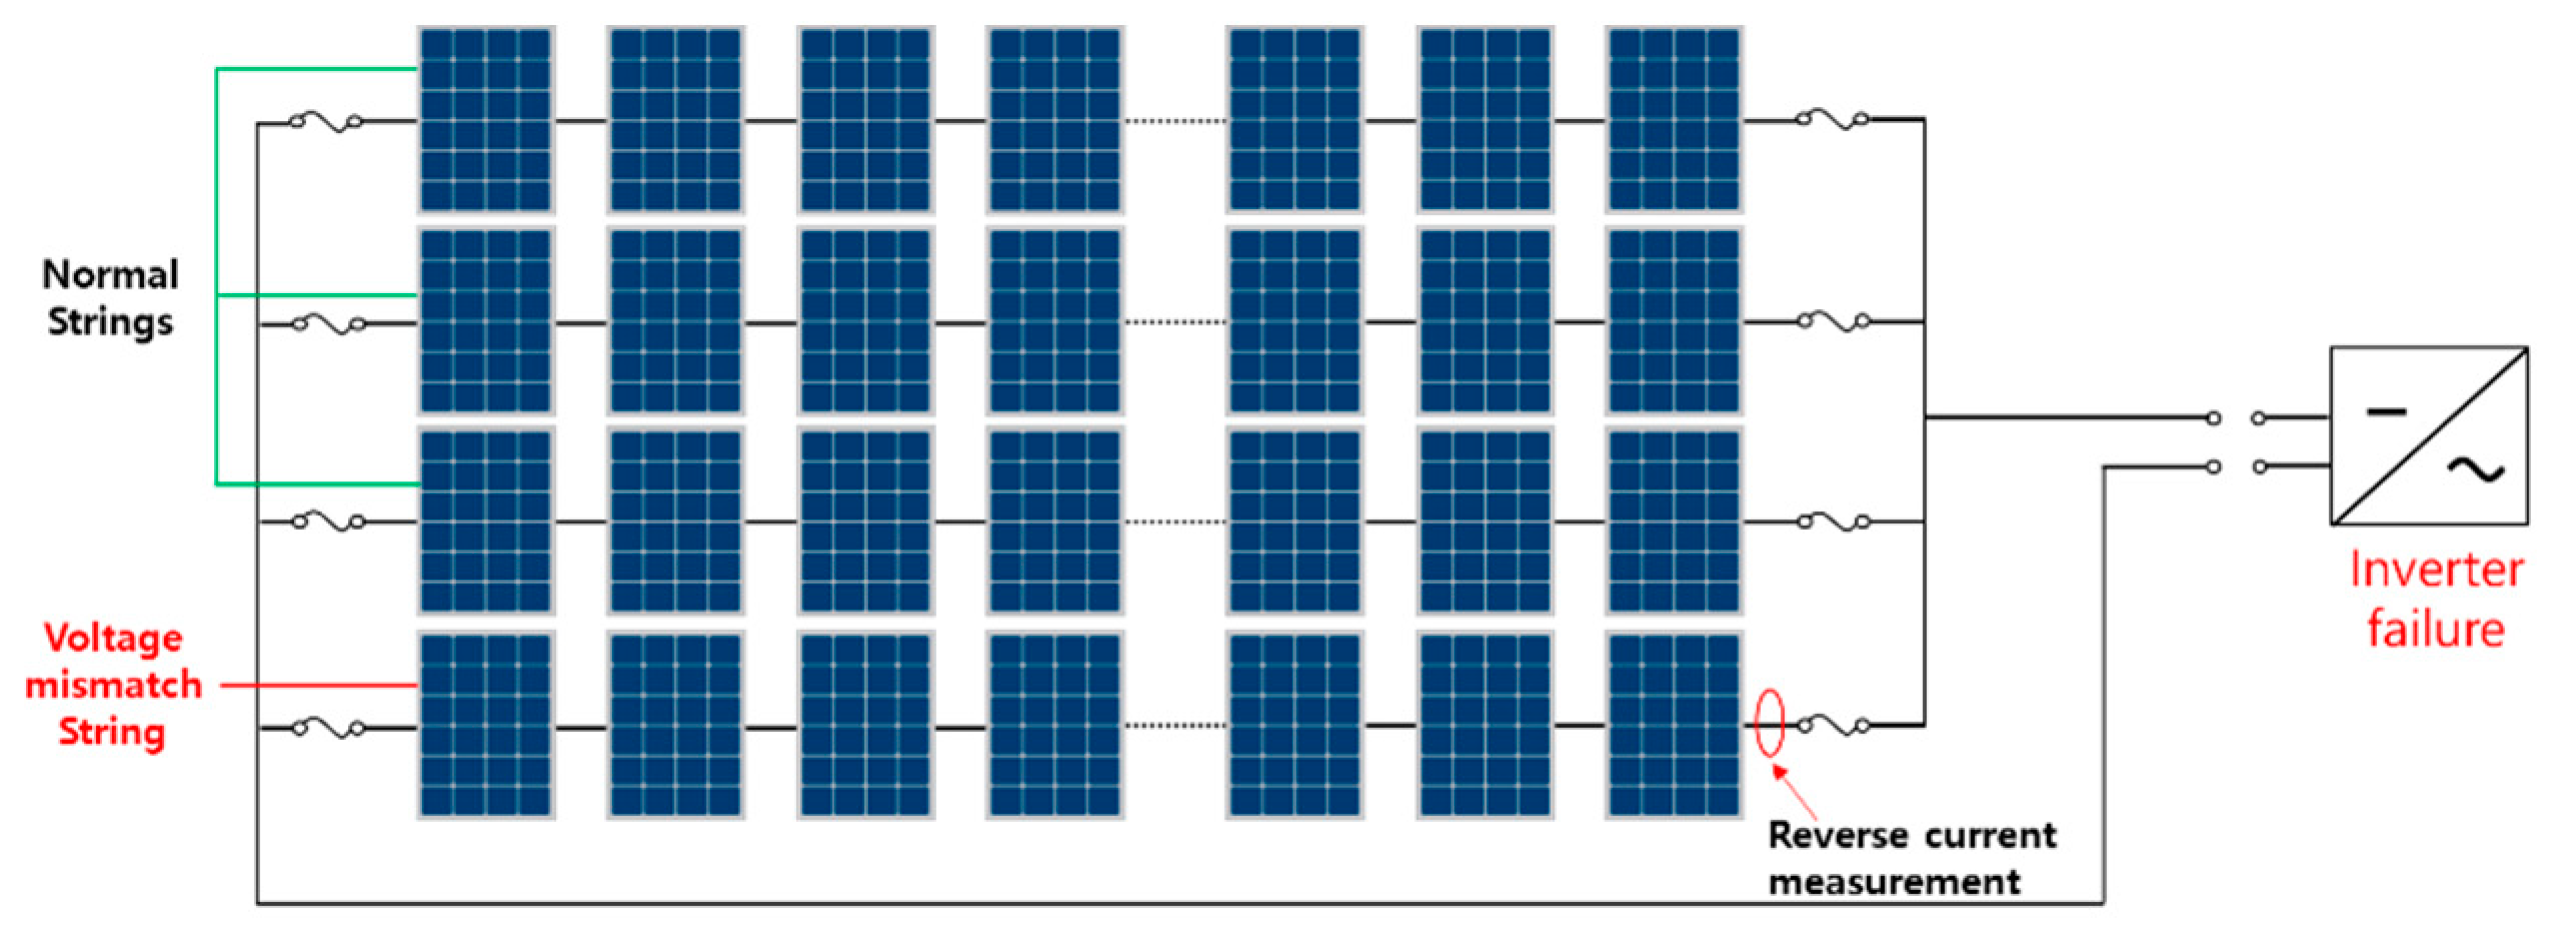
In the previous chapter, the voltage and current, when the reverse current began to flow due to voltage mismatch conditions in PV modules, were measured and analyzed. From the experimental results, it is estimated that the non-uniformity of irradiance and the operation of the bypass diode by partial shading cause a small decrease in the open-circuit voltage of a PV module. For this reason, the reverse current hardly flows or is insignificant. In this chapter, a simulation was conducted to confirm the flow of reverse current due to the voltage mismatch in the PV arrays of dozens of PV modules, connected in series and in parallel. The DC array circuit of a general PV system is shown in
Figure 9. The PV string has dozens of PV modules connected in series, and fuses are installed in the + and − poles of the string. Each string is connected in parallel and connected to the DC side of the inverter.
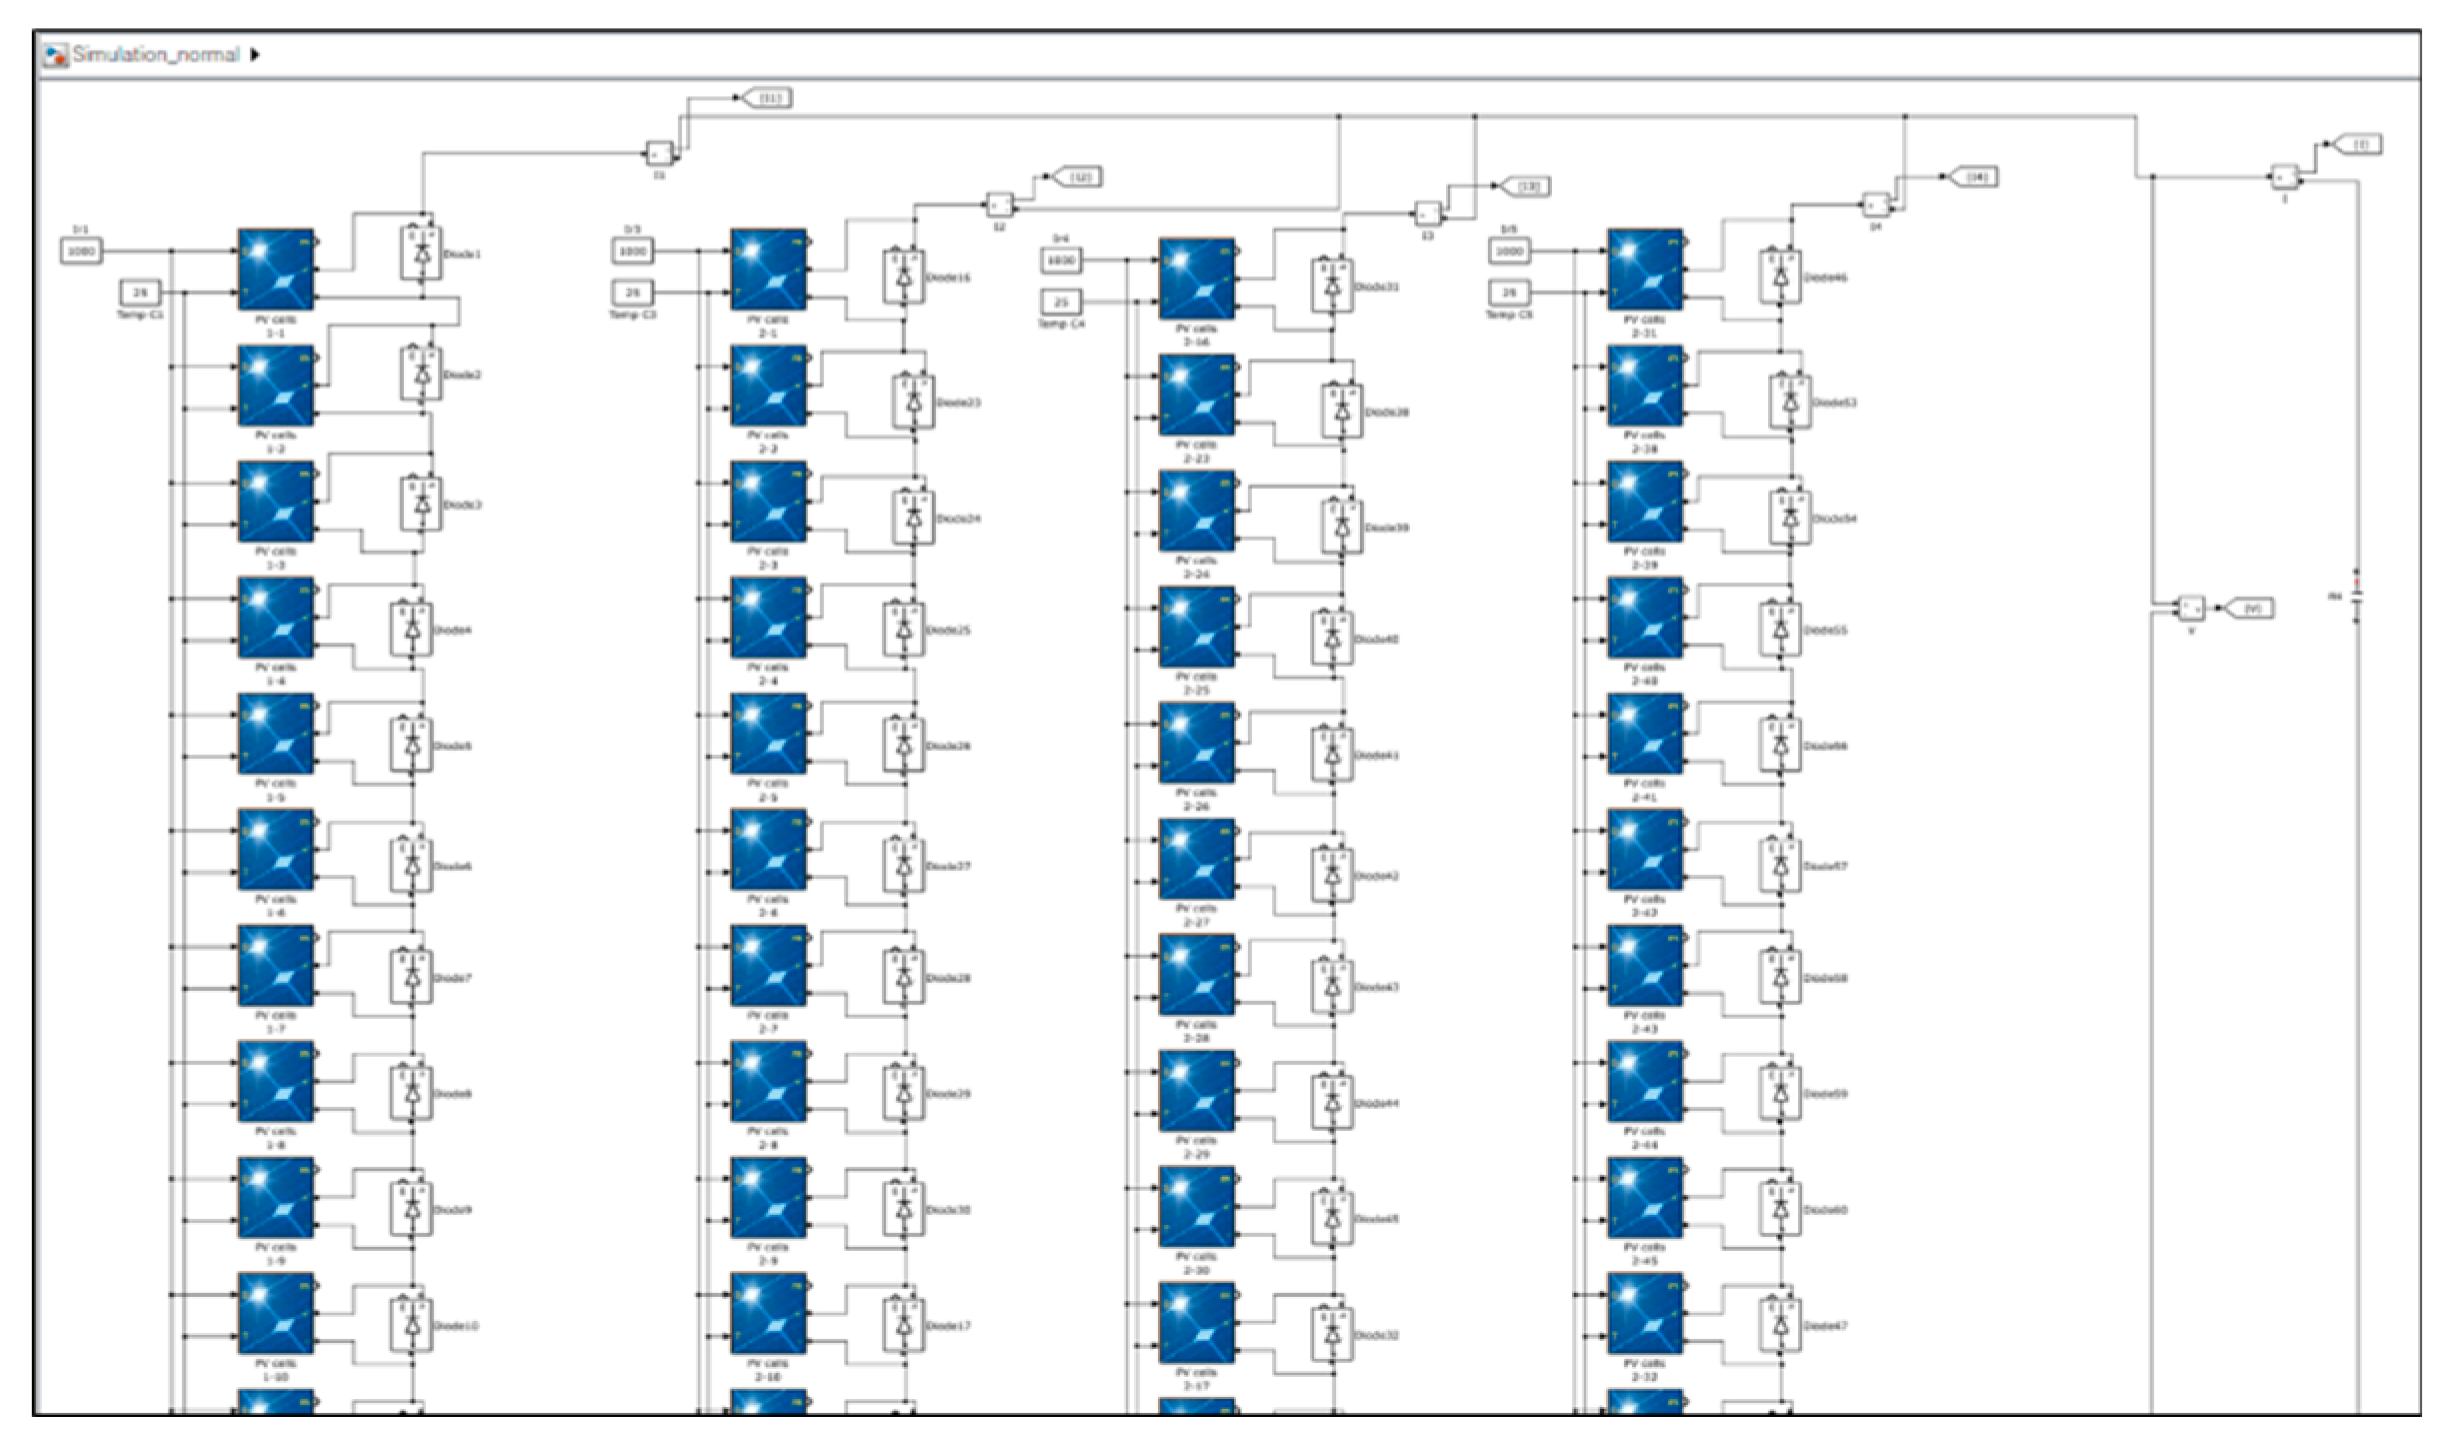
The simulation tool was used with Matlab-Simulink, and the modeling is reflected in
Figure 9. PV strings and arrays were constructed using Matlab-Simulink’s PV module blocks. PV module specifications (Pmax: 320 W, Voc: 45.5 V, Vmp: 36.7 V, Isc: 9.25 A, Imp: 8.72 A) were set to be identical to the PV modules used for the reverse current measurement in
Section 4. Even if three bypass diodes are inserted into the PV module, it was assumed that one bypass diode is embedded in each PV module for a smooth simulation. Inverter failure is assumed to be open-circuit state of the DC array. However, in the simulation, if the circuit is open, an error occurs. Thus, it is equalized using a capacitor. The simulation schematic is shown in
Figure 10.
The simulation conditions were as follows. First, the voltage mismatch conditions in the simulation were set to the operation of the bypass diodes and the failure of the bypass diodes. Second, the installation of blocking diodes in the combiner box was not recommended, according to the current combiner box standard. Thus, blocking diodes were excluded from the PV array configuration. Third, the operating state of the inverter was set to be a stop state, which is one of the common failure factors of the inverter. The parallel circuit of PV arrays was assumed to be a four-loop circuit.
The environmental conditions of the simulation were assumed to be STC conditions, in which the irradiance is 1000 W/m
2, and the PV module temperature is 25 °C. The variables in the simulation were set to increase the number of parallel circuits to 2, 3, and 4 loop circuits and to increase the number of PV modules, with the operation or failure of bypass diodes, to 1, 2, and 3 ea. The operation of bypass diodes by partial shading was simulated by lowering the irradiance to about 0 W/m
2. The reverse current was measured, on the side of the PV string, with the operation or failure of the bypass diode. Additionally, the failure of the bypass diode was assumed to be a minute resistance of about 0.05 Ω or less, in reference to Equation (1), shown below. Equation (1) is the current equation of a PV module with a bypass diode failure. The output of the PV module with the bypass diode failure was analyzed by equalizing it with a minute resistor [
22]:
The simulation results are as follows. First, the simulation is a condition under which the bypass diode operates. In
Table 1, the reverse current ranged from −0.01 A to −0.02 A, even if the number of parallel circuits or operations of bypass diodes of PV modules increased. As shown in the experimental results in
Section 2.3, it can be seen that the operation of bypass diodes does not cause a large potential difference between PV strings. Therefore, it was confirmed that the reverse current rarely flows as a consequence of the operation of the bypass diode.
Next, the simulation is a condition under which the bypass diode fails. The results are shown in
Table 2. For one, two, and three modules, with the failure of the bypass diode in one of two parallel circuits, the reverse currents flowing into the array were −2.64 A, −5.25 A, and −7.44 A, respectively. For one, two, and three modules, with the failure of the bypass diode in one of three parallel circuits, the reverse currents flowing into the array were −3.69 A, −7.74 A, and −11.88 A, respectively. For one, two, and three modules, with the failure of the bypass diode in one of four parallel circuits, the reverse currents flowing into the array were −4.24 A, −9.12 A, and −14.47 A, respectively. Under all conditions, the reverse current flowed into the low-potential string due to the failure of the bypass diode (=short-circuit fault). Notably, in the case of four parallel circuits and the three PV modules with a short failure state, the reverse current, which was more significant than the short-circuit current, flowed up to 14.47 A. As the number of PV modules with the bypass diode failure in a specific string increases, the potential difference between the normal string and the specific string increases. As the number of parallel circuits increases, the magnitude of the reverse current increases.
4. Reverse Current Measurement of PV Arrays in Field
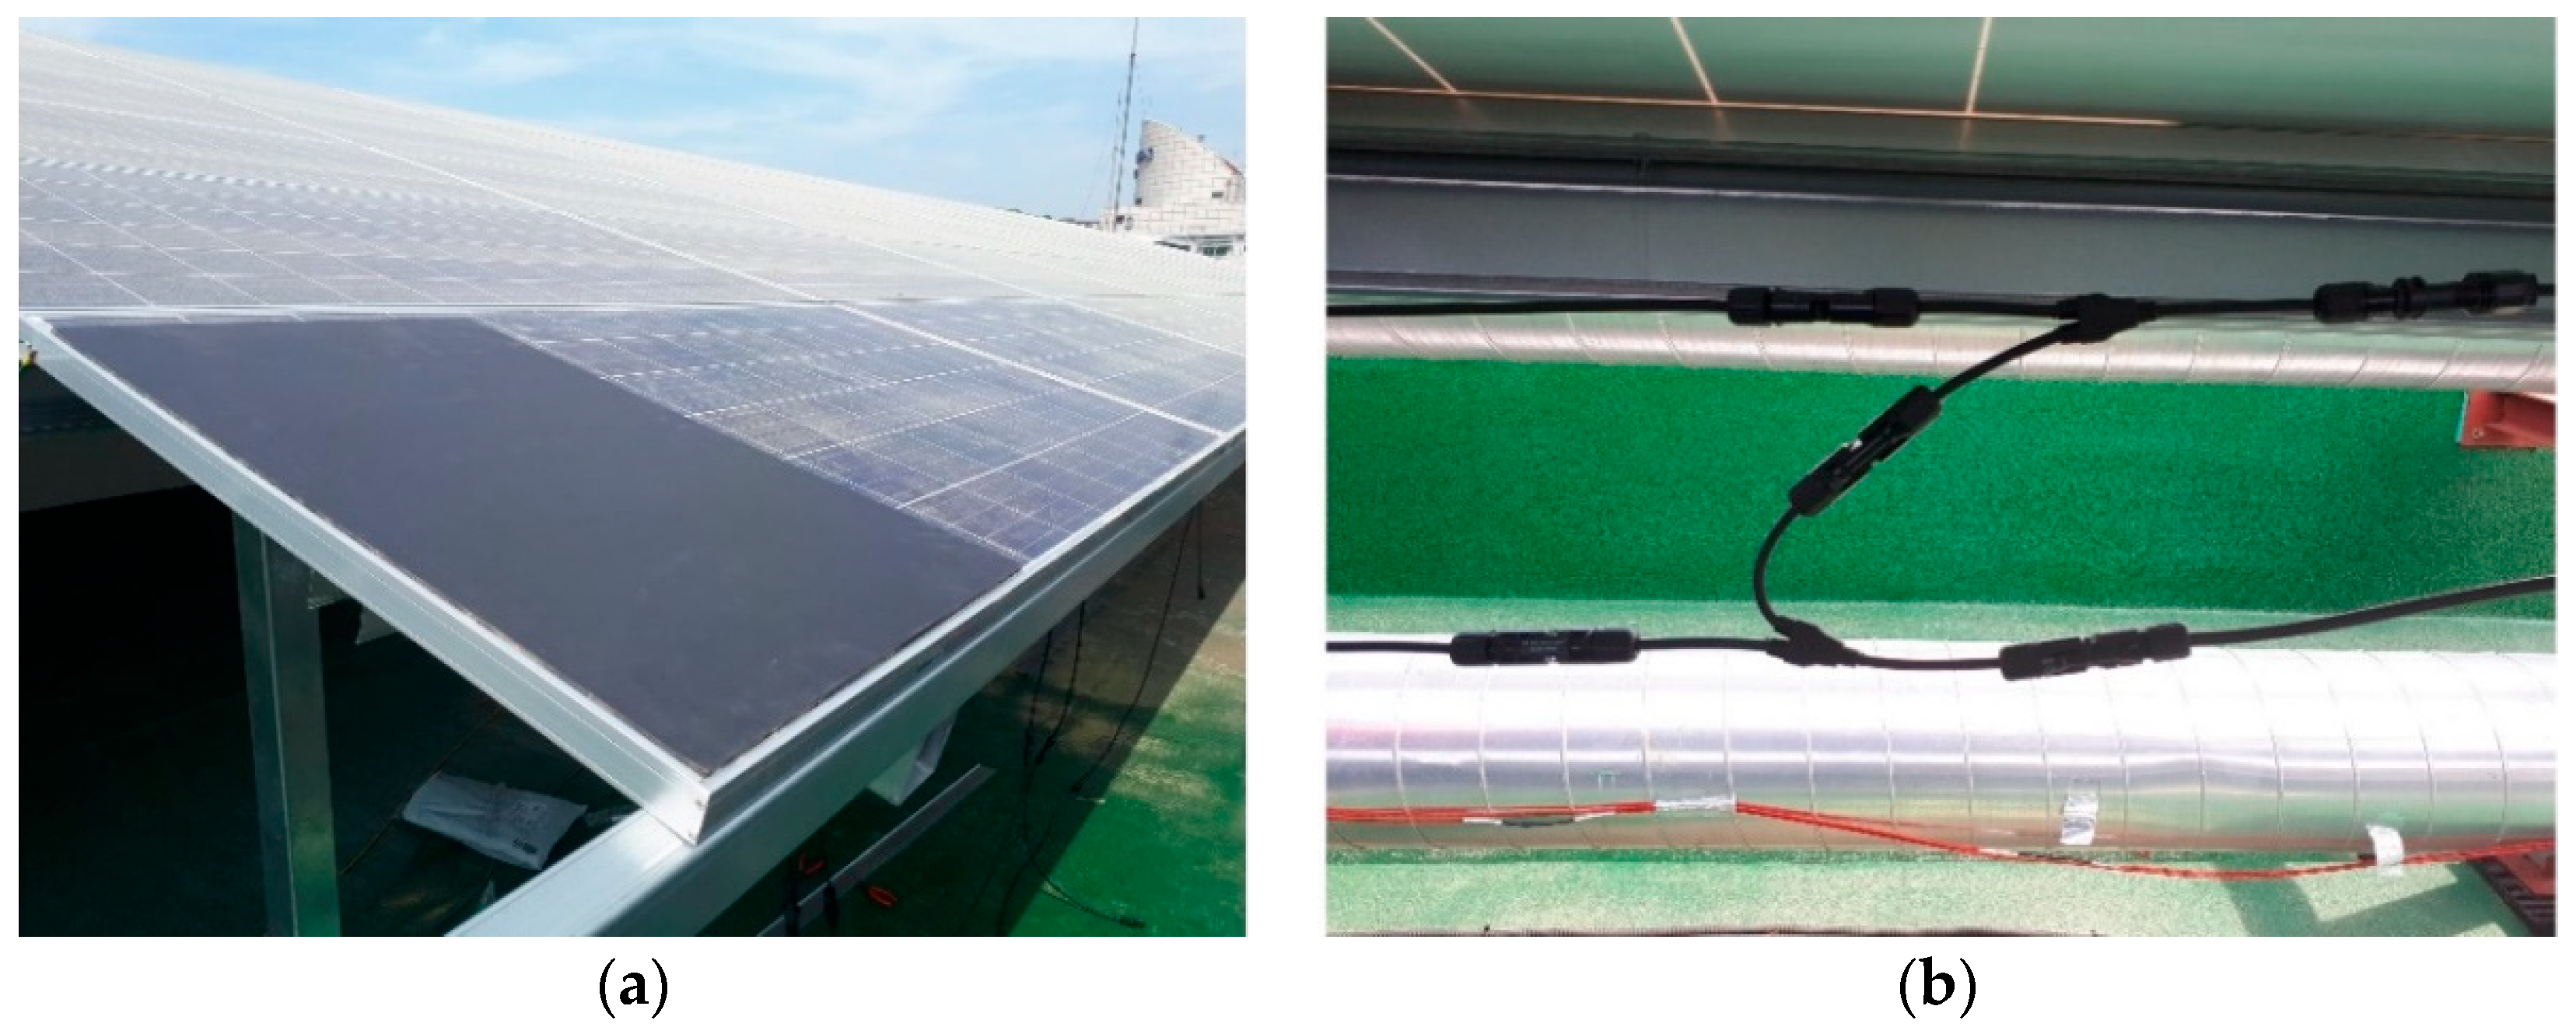
To verify the simulation results, an experiment was conducted to measure the reverse current in actual PV systems. The test site includes a PV system with a capacity of 50 kW, and the test was conducted on four PV strings. Each string consists of 15 PV modules, connected in a series, and fuses are installed in place of the blocking diodes on the + and − poles of the string. The inverter was stopped for the experiment. The purpose of this experiment is to check the effect of bypass diode operation and the short-circuit fault on the circuit. A black sheet that simulates the operation of the bypass diode under shading is used, as shown in
Figure 11a. The failure of the bypass diode is simulated by shorting the PV modules using cables, as shown in
Figure 11b. Reverse currents were measured on one string of the PV arrays, in which the voltage mismatch occurred. Under each experimental condition, the number of PV modules with a turn-on bypass diode and short state was increased to three. The irradiance was measured during the experiment, and the back-surface temperature of the PV module was also measured. The irradiance and temperature were measured for comparison with the simulation results.
The experimental results are as follows. First, the measured reverse currents ranged from −0.01 to 0 A on the turn-on bypass diodes, and, for the PV modules, with the operation of bypass diodes raised to three, the result was the same. This result shows that reverse current hardly flows into the string with voltage mismatch, when the bypass diode is in regular operation. Next, the results in the case of the failure of bypass diodes are in
Table 3. The measured reverse currents were −3.76 A, −6.41 A, and −12.03 A, as the number of PV modules increased to one, two, and three, respectively. At the time of measurement, the irradiance and temperature of the back surface of the PV module were 712 W/m
2 and 29.12 °C for one PV module, 530 W/m
2 and 29.41 °C for two PV modules, and 706 W/m
2 and 28.96 °C for three PV modules. In the simulation results using measured environmental conditions, the reverse currents were 3.32 A, −6.43 A, and −11.30 A, as the number of PV modules increased to one, two, and three, respectively. Comparing the simulated values with the measured values, similar results were obtained with 0.44 A, 0.02 A, and 0.73 A differences, respectively. The experimental results show that the failure of the bypass diode causes a potential difference between PV strings, and reverse current flows into the low-potential string.
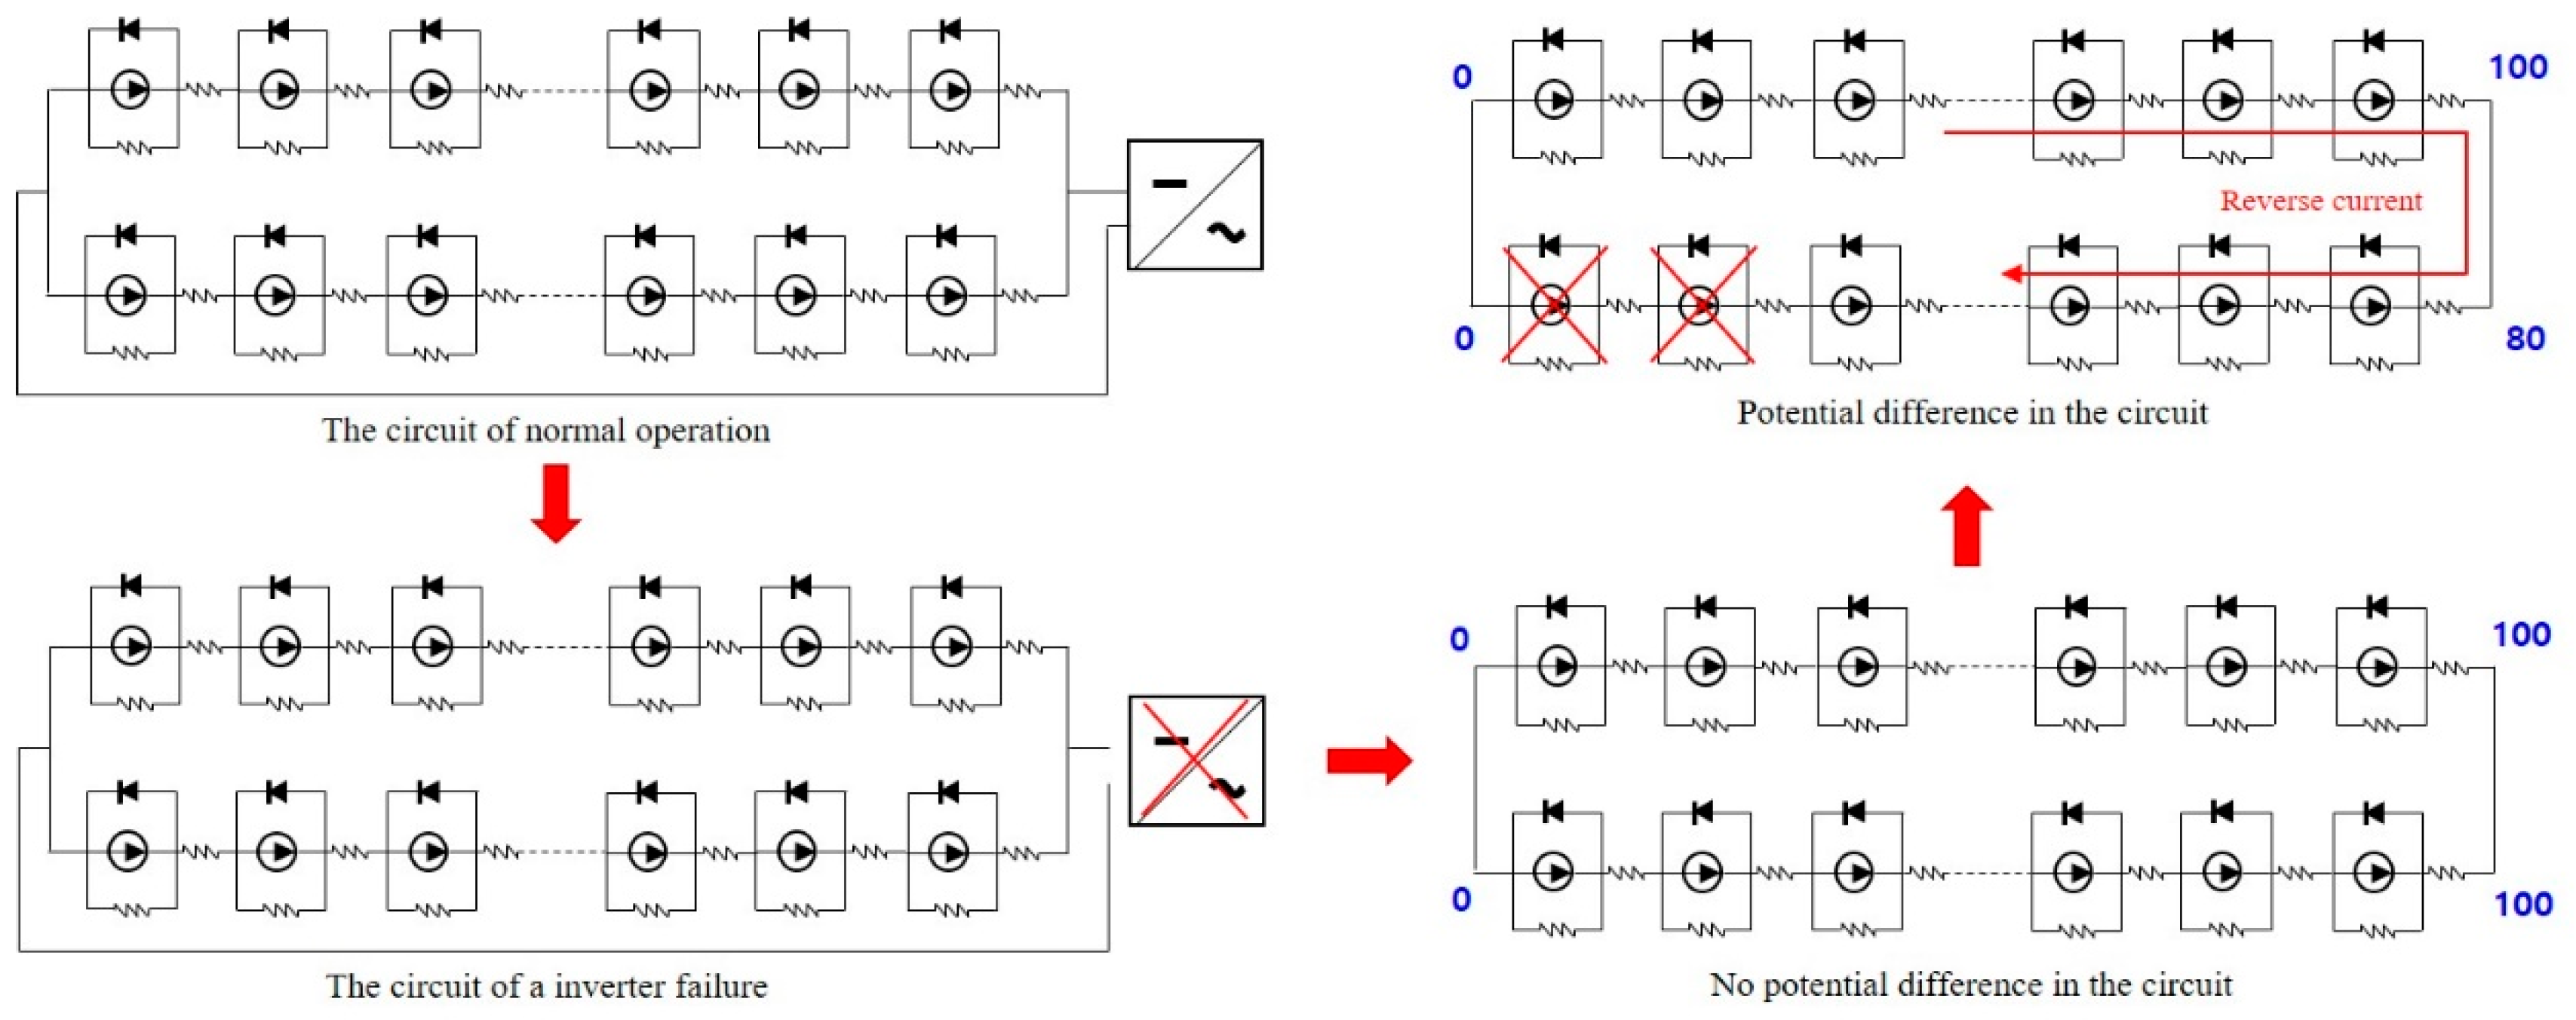
From the simulation and measurement results, it was confirmed that the current flowed by the failure of bypass diodes (=potential difference) in a PV system situation where there is no blocking diode and the inverter failure. In these conditions, the flow of the current is shown in
Figure 12. In normal operation, the inverter of the PV system operates and output current of PV arrays flows into inverter. If an inverter fails, the output current of PV arrays does not flow into the inverter because the electric circuit is disconnected. Thus, the PV arrays connected in parallel are in a closed loop. If there is no potential difference between PV arrays, the current rarely flows into any PV string. However, if there is potential difference, the current will flow into the low-potential string that has the failure of the bypass diodes.


