Study on Seismic Performance and Damage Analysis of Steel Plate Shear Wall with Partially Encased Composite (PEC) Columns


1
School of civil engineering, Lanzhou University of Technology, Lanzhou 730050, China
2
Western Engineering Research Center of Disaster Mitigation in Civil Engineering of Ministry of Education, Lanzhou University of Technology, Lanzhou 730050, China
3
College of Civil and Hydraulic Engineering, Ningxia University, Yinchuan 750021, China
*
Authors to whom correspondence should be addressed.
Appl. Sci. 2019, 9(5), 907; https://0-doi-org.brum.beds.ac.uk/10.3390/app9050907
Submission received: 18 January 2019
/
Revised: 21 February 2019
/
Accepted: 26 February 2019
/
Published: 4 March 2019
(This article belongs to the Special Issue Structural Damage Detection and Health Monitoring)
Abstract
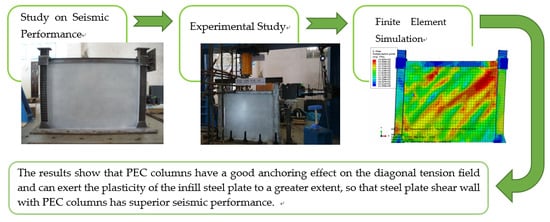
:A steel plate shear wall often uses partially encased composite (PEC) columns instead of edge frame columns. Such a steel plate shear wall not only bears the gravity load of the structure and resists the bending moment caused by lateral force by taking advantage of the high bearing capacity and bending stiffness of PEC columns, but also effectively anchors with the frame column to counteract the tension field generated by the steel plate. Therefore, the performance of the steel plate shear wall after buckling can be fully exerted and the seismic performance of the structure can be improved. In order to investigate the seismic performance of the structure, a 1/3-scale specimen test of steel plate shear wall with PEC columns is designed and fabricated, and a finite element model is established with the same size of test. It is found that the test and simulation results are in good agreement, which confirms the reliability of the simulation. Subsequently, 20 models with different parameters of steel plate shear wall with PEC columns are analyzed using ABAQUS. Finally, the failure mode, hysteretic behavior, skeleton curve, and bearing capacity of steel plate shear wall with PEC columns are obtained. The results show that PEC columns have a good anchoring effect on the diagonal tension field and can fully exert the plasticity of the infill steel plate, so that steel plate shear wall with PEC columns has superior seismic performance. Experiments also reveal that the crack type of damages appear in a steel plate shear wall with PEC columns, and, as a future work, the authors will explore the use of structural health monitoring methods, such as piezoceramic transducer-based method, to monitor such cracks.
1. Introduction
The research on the steel plate shear wall started in Japan and the United States in the 1970s. In 1973, Takahashi et al. [1] conducted the experimental study on steel shear wall for the first time. In 1991, Sabouri and Roberts [2,3,4] carried out low-cycle load experiment on a series of small-scale models of steel plate shear wall and found that the stiffened steel plate shear wall had good hysteretic behaviors. Steel plate shear wall is a kind of structure with high resistance to lateral force, which is suitable for the development of high-rise buildings [5,6,7,8]. Steel plate shear wall has been demonstrated with remarkable ability of seismic energy dissipation through the laboratory tests and aseismic implementations and have received much attention [9,10,11,12,13,14]. In 1994, Xue et al. [15] found that the frame column should not only bear the vertical load but also bear the interlaminar shear force from the steel plate through the study of 4 trusses of steel plate shear walls with 3 spans and 12 floors.
In 2000, Lubell et al. [16] found the post-buckling strength of steel plates mainly depends on the shear strength of the frame by conducting an experimental study on the performance of thin steel plate shear walls in buildings. In 2002, Astaneh-asl et al. [17] introduced the combined members of steel tube and high-strength concrete as the vertical edge column of the specimen into the steel plate shear wall. Although the experimental results showed that the structure had good energy dissipation performance, slippage still occurred in the late stage of the loading. These research results show that the stress of the frame column is extremely complex under the effects of the bending moment caused by the deformation of the steel plate, the lateral and vertical load and the lateral displacement in practice. In order to avoid adverse effects on frame columns, Hitaka et al. [18] proposed steel plate shear wall with slits in 2003. This structure has been applied in three practical projects in Japan. Subsequently, many scholars have proposed many different forms of steel plate shear walls with openings or slots and low yield point steel plate shear walls [19,20,21,22,23,24], but these protect the columns at the expense of stiffness and bearing capacity of steel plate [25]. In 2013, Clayton et al. [26,27,28,29] proposed a self-centering steel plate shear walls. It has the capabilities of recentering, which can concentrate the damage into the thin steel plate. The edge frames are connected by post-tensioning method. Self-centering steel plate walls can reduce time and cost of repair after earthquakes. In 2017, Verma et al. [30] evaluated the role of frame elements in resisting lateral forces by considering the interaction between infill steel plate and frame elements and proposed a formula to predict the contribution of infill steel plate and edge frame to resist lateral forces. According to the above research results, we found that bearing capacity of the frame column has become the limitation on excellent performance of steel plate shear wall. As such, the PEC (Partially Encased Concrete) with high strength, stiffness and ductility is introduced into the steel plate shear wall structure so as to form the steel plate shear wall with partially encased composite (PEC-SPSW) system. The research on PEC column started late at home and abroad [31,32]. Tremblay et al. [33] conducted a series of studies on PEC firstly in 1998. In 2002, Chicoine et al. [34] studied the effects of cross-sectional dimension, spacing of connection and width-to-thickness ratio of column on the failure mode of PEC columns. In 2007, Begum et al. [35,36] developed a more complex and complete PEC column model. In 2011, Karimi et al. [37] studied the effect of slenderness ratio on PEC columns wrapped in fiber reinforced polymer (FRP) jackets. In 2012, Zhou et al. [38] conducted tests on 9 PEC stub-columns under axial load and found that the failure of PEC columns was caused by local buckling of flanges and concrete crushing. In 2013, Begum et al. [39] studied the performance of PEC column with high strength concrete through finite element analysis. The results showed that using high strength concrete (60 MPa) instead of ordinary concrete (30 Mpa), the bearing capacity of PEC column was increased by about 55%, but the load–displacement curve exhibited brittle failure. In 2015, Zhao et al. [40] conducted an experimental study on PEC columns with axial compression ratio, steel content and shear span-ratio as parameters. The results showed that the deformation and bearing capacity of PEC columns increased with the increase of steel content, but the deformation capacity decreased with the increase of axial compression ratio. In 2016, Song et al. [41] conducted research on local and post-local buckling behavior of welded steel shapes in PEC columns. He not only revealed the failure mechanism of steel, but also put forward formulas of critical and post-buckling. PEC column, as an edge restraint member of steel plate shear wall structure, not only bears the large vertical load from the upper part of the structure, but also resists the large bending moment caused by lateral force [42,43,44]. Meanwhile, PEC columns have good fire resistance and cost savings [45,46]. Therefore, it is introduced to steel plate shear wall to enhance the strength and stiffness of the edge members, so as to ensure greater seismic performance of the infill steel plate.
In summary, the steel plate shear wall is a lateral resisting system suitable for buildings in high-intensity earthquake areas, which organically combines the advantages of steel moment-resisting frame and steel plate shear wall. The steel plate wall is the key element that affects the structural performance, which determines the seismic performance of the steel plate shear wall system such as strength, stiffness, energy dissipation capacity and ductility. Moreover, the stability, yield mechanism, energy dissipation capacity and ultimate failure model of the steel plate wall are closely related to the edge frame. However, steel columns are basically used in the vertical edge members of the steel plate wall in the current design. It is difficult to achieve the main function of anchoring the steel plate wall effectively, and it is easy to cause damage of the edge columns under a major earthquake and make the steel plate wall difficult to play its role, especially for thin steel plates. Therefore, how to organically coordinate the lateral stiffness and energy dissipation capacity of the steel plate shear wall to give full play to its superior seismic performance still needs further research and improvement, including: (1) Now, steel columns are basically used in the vertical edge members of the steel plate shear wall. However, there is a lack of research on the steel plate shear wall using PEC columns as the vertical edge members; (2) Steel plate wall is the main component to improve the lateral stiffness of the structure, since the tension field of steel plate wall is closely related to the stiffness of side columns. How to realize the reasonable matching of structural stiffness is the key to give full play to the seismic performance of the structure, such as bearing capacity, lateral stiffness and energy dissipation capacity.
In order to study seismic performance of steel plate shear wall with PEC columns, a 1/3 scale specimen is designed and manufactured. The mechanical testing and simulation (MTS) loading system is used to subject cyclical loading on the model specimens. The failure mode, ultimate strength, stiffness and hysteretic curve of the steel plate shear wall with PEC columns are obtained by collecting and processing the experimental data. At the same time, the feasibility of the finite element analysis is verified with the comparison and analysis of finite element simulation and experimental results, and the parameters of the finite element model are supplemented and improved necessarily through the actual situation of the experiment. The experimental results also reveal that crack type of damages exist in the steel plate shear walls with PEC columns, however, the current strain gauges cannot monitor such damages in real time. As a future work, the authors will explore the use of structural health monitoring method, such as piezoceramic transducer-based method, to real-time monitor the crack type of damages in a steel plate shear wall with PEC columns.
2. Experimental Study
2.1. Specimen Design
The specimen was scaled by 1/3 based on a structure with the column space was 6 m and the story height was 4.5 m. The axial span of the specimens was 2 m, and the story height was 1.5 m. The overall size of the steel plate shear wall with PEC columns was B × H = 2150 mm × 1700 mm. The size of infill plate, frame beam, and left and right columns are shown in Table 1. A 10 mm-thick gusset plate was set at the joint, and a 10 mm-thick T-shaped stiffener was set at the column foot. The design parameters of PEC column are as follow: the diameter of the draw rod was 6 mm; the distance between the non-reinforcement region was 50 mm; the distance between the reinforcement region was 25 mm; the distance between the draw rod and the edge of the flange of steel column was 10 mm. The detailed dimensions and structural design of the specimen are shown in Figure 1.
Considering the requirements of vertical loading, the frame columns should be extended by 200 mm and the cap with 20 mm thickness should be designed. A 30 mm-thick baseboard was designed on the bottom of the entire steel plate to connect the counter-force floor of the laboratory easily. The total height of the specimen included the column cap and the baseboard was 1750 mm and the span was 2000 mm. The loading plate was welded to the side of the specimen to connect lateral actuator of the MTS easily. All steel was Q235B. A photo of the test specimen is shown in Figure 2.
2.2. Test Setup
The specimen was tested under a 300 T combined loading frame. The lateral loading equipment is a kind of static and dynamic hybrid loading device from American company-MTS, which can achieve 100 T lateral force, and the vertical load was loaded by 300 T hydraulic jack.
The specimens were lifted to the specified location under the combined loading frame after completing the acceptance. During the hoisting process, the reserved holes in the bottom plate of the specimen were aligned with the holes in the counter-force floor. After landing, the specimens and the counter-force floor were completely fixed by 10 high-strength anchored bolts with a diameter of 56 mm. Then the MTS lateral device was adjusted at the same level as the loading plate of the specimen and the MTS lateral device was tightly connected to the loading plate by 4 high tensile bolts with a diameter of 32 mm. Afterwards, the distributive girder was lifted and installed to the specified location and fixed on the specimen by the bolts with a diameter of 22 mm. The bolts were not screwed up and kept loose to limit displacement and protect structure. Vertical jack was adjusted to keep good contact with specimen. At this point, the installation of the specimen, vertical and lateral loading device were basically completed. The loading device is shown in Figure 3a.
To prevent the out-of-plane instability or a large displacement outside the plane affecting the stability and bearing capacity of the structure, it is necessary to design the out-of-plane support. This paper adopted the method of setting up scaffolds to confine the out-of-plane displacement, as shown in Figure 3b.
2.3. Loading Program
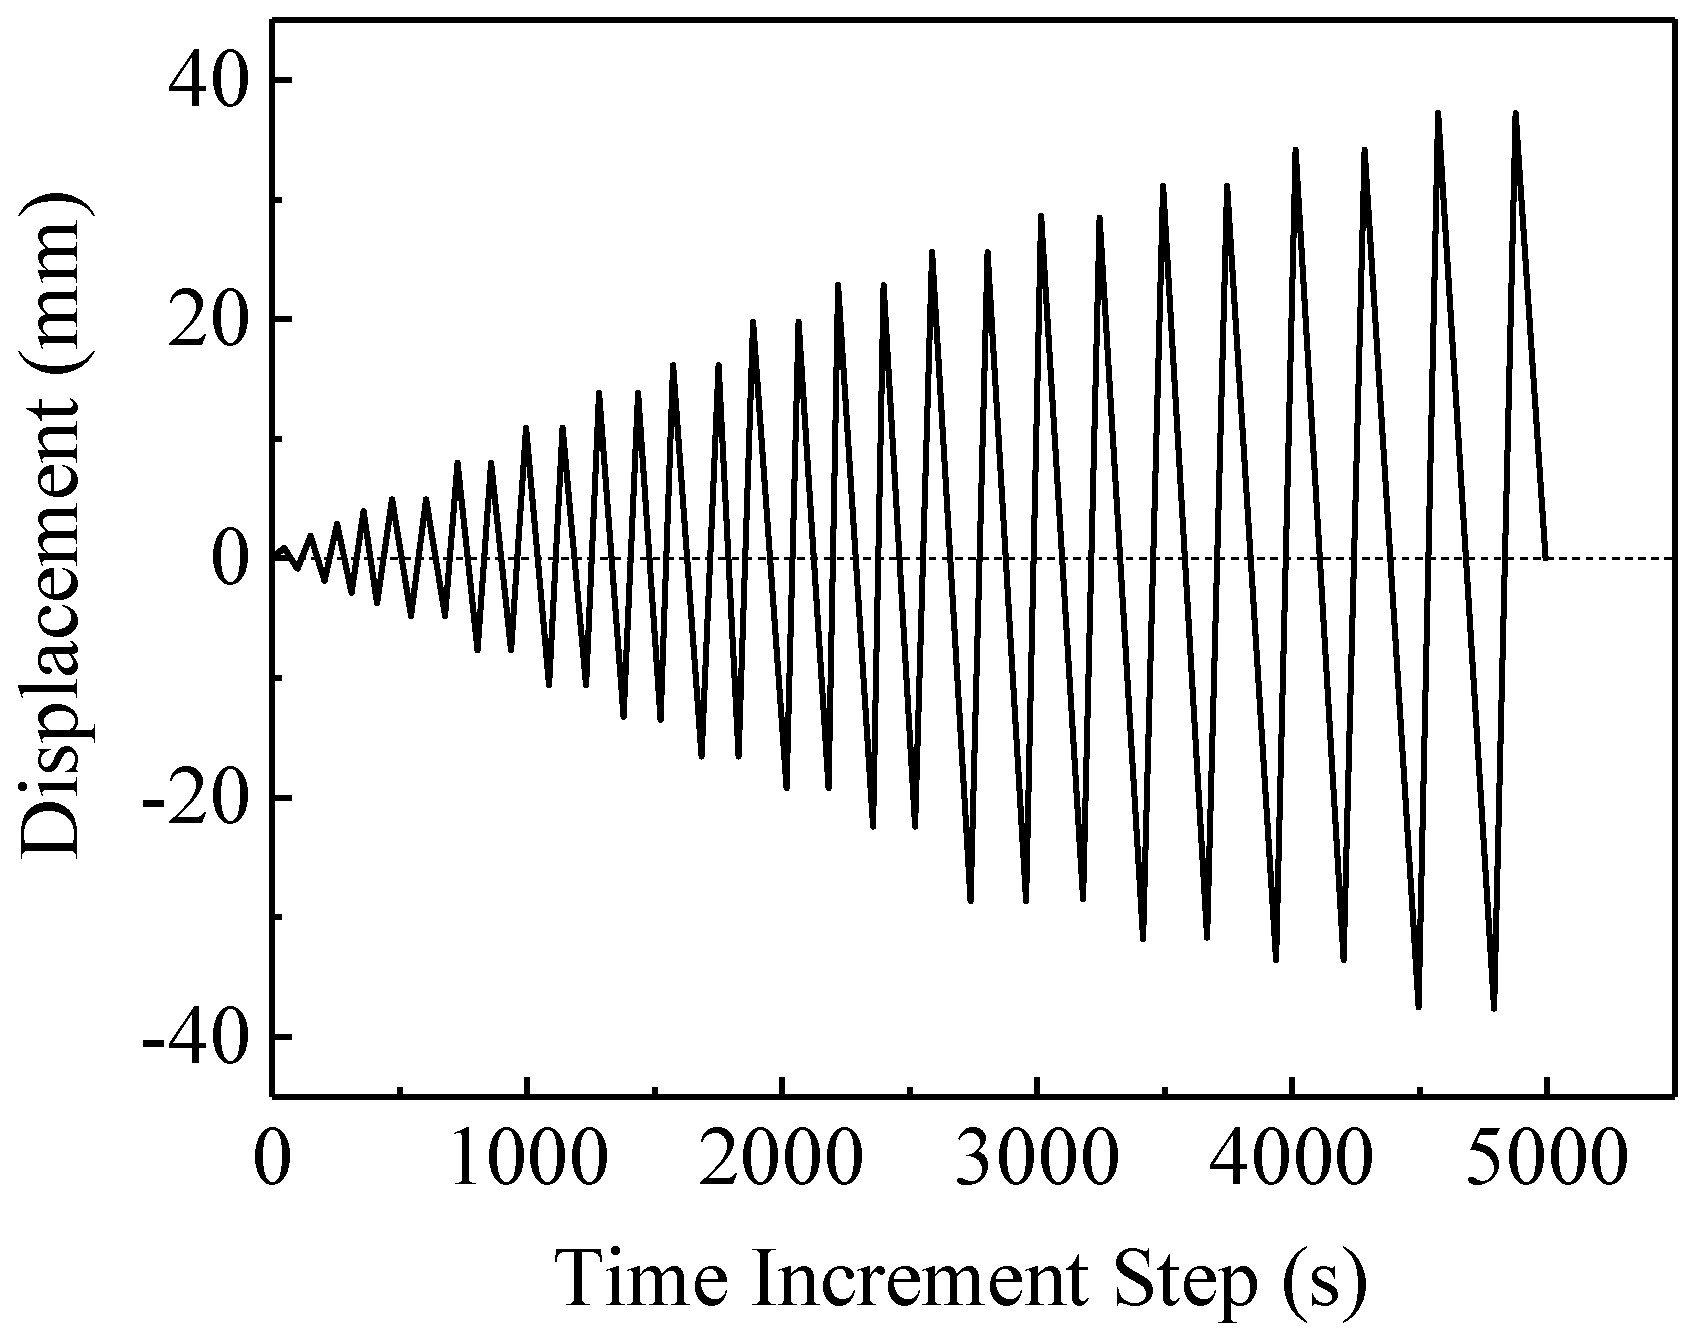
According to the specification of test methods for earthquake resistant building (JGJ 101-96), a preliminary vertical load was applied firstly to check whether all equipment can work normally. After the vertical load was applied, the lateral loading was applied under the condition that the value of the vertical load remained unchanged. The test stopped when the load continued to fall in the load–displacement curve. In the process of cycle loading, it was estimated that there were 28 cycles. The loading amplitudes were 1 mm, 2 mm, 3 mm, 4 mm, 5 mm, 8 mm, 11 mm, 14 mm, 17 mm, 20 mm, 23 mm, 26 mm, 29 mm, 32 mm, 35 mm and 38 mm, respectively. Each cyclic load was applied once when the amplitude was 1 mm, 2 mm, 3 mm and 4 mm, and each cyclic load was applied twice from 5 mm to 38 mm. The loading program is shown in Figure 4.
2.4. Measuring-Point Arrangement
The strain, deformation and displacement of the specimen were obtained by electrical measuring methods. The resistor type strain gauges were attached on the surface of the specimen, and the stress-strain process of different parts of the specimen were collected by the strain gauge. In this paper, the arrangements of displacement meters and strain gauges are shown in Figure 5 and Figure 6, respectively. The testing equipment is a DH3816 Static Strain Collection Device. The vertical load sensor has a capacity of 50 Ton.
2.5. Damage Processes
The loading process was divided into a trial loading stage and a formal loading stage. Specifically, the displacement control method was adopted in the trial loading stage, and the distance increment was 2 mm. The trial loading process was repeated for three times in order to not only check and debug the equipment, but also eliminate the gap between the loading device and the specimen through preloading. The vertical load was not applied in the trial loading stage.
In the formal loading process, the steel plate did not have significant deformation in the first four cycles. Due to the convex and concave defects of the steel plate, the steel plate had crisp sound during the conversion process of positive loading and negative loading. In the fifth cycle (the first cycle of 5 mm), a tension strip appeared above the main diagonal line of the steel plate under the action of the tensile force. After the second cycle of 5 mm, the tension strip moved down to the main diagonal. When the displacement reached 11 mm, an obvious convex stripe was formed along the main diagonal direction of the steel plate with the increase of the load, as shown in Figure 7a. When the displacement returned to 0 in each cycle, the steel plate had a great sound which was slightly greater than the sound in preceding cycles, and such sound volume increase was caused by the convex position alternation on the main diagonal direction. The deformation of steel plate could be obviously observed that convex and concave orderly form from top to bottom, then from bottom to top. Subsequently, with the increase of the peak displacement of cycle, the tension stripe generated along the two diagonal directions becomes more obvious in the positive loading and negative loading process. The degree of concavity and convexity of the tension strips reached the maximum when the positive and negative peaks were reached. The tension stripe formed by the convex firstly appears at the main diagonal line (see Figure 7b). When the displacement reached 14 mm, a secondary diagonal tension stripe (see Figure 7d) gradually appeared at the upper and lower 1/3 positions of steel plate.
When the displacement reached 20 mm, the paint coating of web of frame beam bugled slightly. This indicated that the web of the frame beam began to buckle. In the 17th cycle (the first cycle of 23 mm), the frame beam had a small out-of-plane displacement. The maximum out-of-plane displacement appeared at the middle of the beam, and the displacement was not more than 3 mm. The paint coating of web of frame beam cracked and transverse cracks appeared at the concrete in the middle of the column, as shown in Figure 7e. In the 20th cycle (the second cycle of 26 mm), the stress showed that the steel plate stress reached the yield strength of the steel, and the out-of-plane deformation of the beam was slightly changed due to the yield of the infill steel plate. During the period from the 17th cycle to the 21st cycle, the infill steel plate continuously suffered tension and compression deformation at the peak displacement of +23~+29 mm, and the residual strain was gradually accumulated to wrinkle at the crossing position of the diagonal lines to form folding damage. In the 22nd cycle, the laceration formed by the folding damage of the diagonal lines was continuously promoted at the peak of +29 mm to cause more obvious damage and gradually formed four significant folding damages. In the 24th cycle (the second cycle of 32 mm), the concrete near the actuator in PEC column had 3~5 slight cracks, a large out-of-plane displacement appeared as shown in Figure 7f. In the 25th cycle, the framed beam and the upper and lower flanges of the beam end (near the actuator) were broken, as shown in Figure 8i. In consideration of the significant damage of the specimen, the test was terminated. In this test, the maximum displacement of the top of the column is 32 mm, exceeding the maximum limit of story drift in rare earthquakes. In summary, the maximum negative load was −506.5 kN appeared at the displacement of −26 mm in the 20st cycle. In the 21st cycle, the maximum positive load was 535.5 kN appeared at the displacement of +29 mm in the test.
When the specimen was damaged, the main phenomenon was that transverse and oblique cracks appeared in the upper and middle position of concrete of PEC column, and even concrete dropping. Subsequently, the frame beam buckled locally and appeared slight torsion, as shown in Figure 7j. Finally, small welding cracks at beam-column connections occurred, as shown in Figure 7i. At this time, the built-in steel plate had yielded in a large area and the bearing capacity of structure decreased rapidly, eventually leading to the failure of the specimen.
Remark.
From the above analyses, the steel plate shear walls with PEC columns suffer from concrete cracks and weld cracks. Unfortunately, the strain gauge currently used in this research cannot monitor the damage of steel plate shear wall with PEC columns in real time, especially the formation of concrete cracks and weld cracks. In particular, concrete cracks have an important impact on the safety of structures. For example, the concrete in the PEC column has a protective effect on the corrosion of the section steel, however due to the cracks in a concrete structure, the chloride in the environment can diffuse in the crack, resulting in the corrosion of the steel and thus leading to the reduction of the service life of the structure [47]. In recent years, much attention has been paid to structural health monitoring (SHM) in civil engineering [48]. PZT (Lead Zirconate Titanate) is a type of piezoceramic material that possesses strong piezoelectric effect [49,50]. A PZT tranducer has the unique dual actuating and sensing functions along with its advantage of wide bandwidth, and therefore a PZT tranducer has the ability to generate and detect stress waves [51,52,53,54], including ultrasonic waves [55,56]. As the enanbling element for the active sensing method [57,58,59] and the electromechanial impedance (EMI) method [60,61], PZT transducers are often used in structural health monitoring (SHM) systems [62,63,64,65,66]. With the recent development of PZT based smart aggregates in concrete structure damage detection [67,68,69,70,71] and the application of PZT transducers in health monitoring of steel-concrete composite structures [72,73,74,75], the authors will explore health monitoring and damage detection of steel plate shear wall with PEC Columns using the embeddable smart aggregates [76,77] and the easy-to-install surface-bonded piezoceramic patch transducers [78] in the future work.
2.6. Experimental Result Analyses
2.6.1. Loading-Displacement Curve
The counterforce fed back of loading points of the lateral loading device in the loading process can be obtained through MTS. The relationship between the counterforce and the displacement was plotted to obtain the hysteretic loops at the loading point of the steel plate shear wall with PEC columns, as shown in Figure 8.
In the initial stage of the test loading, the counter-force and displacement were basically linear, the area of hysteresis loop was small, the stiffness of specimen was larger, and the energy consumption was less. At this time, the test piece was in the elastic stage, and the infill steel plate worked well with the fringe frame. As the test continued to load, some parts on the two main diagonal lines of the infill steel plate yielded, and the counter-force and displacement appeared non-linear. At this time, the specimen entered the elastoplastic stage, and the stiffness of the specimen decreased. The area of the hysteresis loop increased and was relatively full, and the energy dissipation performance of the specimen gradually increased. Specimen entered the yield stage after loading continually. The residual strain of the infill steel plate kept increasing under the action of main tensile stress. The plasticity had been developed to a greater extent leading to significant stiffness degradation of the specimen. The hysteresis loop appeared obvious “pinching” phenomenon, and its shape changed to an S shape. However, the area of hysteresis loop was larger, and the specimen still had good energy dissipation performance at this time. The phenomenon of “pinching” is an important characteristic of the hysteretic curve of beam-column joints [79], which results in the reduction of energy dissipation and bearing capacity. Many scholars have proposed different “pinching” models to simulate the mechanical response of structures under cyclic loading [80]. For example, the Pinching4 model in OpenSees is a user-defined model code developed by Mitra [81]. The mechanical curve defined by multiple line segments can take into account the gradual increase of stiffness and strength and pinching effect in hysteretic loading.
2.6.2. Skeleton Curve
The skeleton curve can be obtained by processing the hysteretic curves acquired in the test, as shown in Figure 9. It can be seen from the figure that the skeleton curve of the specimen under the action of tension and compression was basically linear in the elastic stage. The ultimate displacement of the specimen was 32 mm and the story-drift was 1/48. At the later stage of the test, the out-of-plane displacement increased, but the bearing capacity did not immediately decrease. Therefore, it shows that the structure has good ductility and high bearing capacity.
2.6.3. Stress Distribution and Damage Analysis
The damage of the specimens can be judged based on the analysis of the stress change in the loading process. First of all, we are concerned about the stress of all parts of the steel shear walls with PEC columns when the test reaches the ultimate tensile and compressive strength. Z1, H18, T5, etc. mentioned below are all strain gauge numbers. The number and the arrangement of the strain gauge are as shown in Figure 6.
- (1)
- Stress analysis of PEC columnsWhen the displacement reached 26 mm in 20th cycle, the infill steel plate had been yielded, but the stress of PEC columns was still small and the safety stock was still high. When loading forward to the right in the positive direction, the left flange of the PEC column near the side of lateral actuator (Z1, Z4, Z5, Z8, Z9, Z12, Z17, Z20, Z21, Z24, Z25, Z28) was in tension and the right flange away from side of lateral actuator (Z2, Z3, Z6, Z7, Z10, Z11, Z18, Z19, Z22, Z23, Z26, Z27) were in compression. When loading forward to the left in the negative direction, on the contrary, the right flange was in tension and the left flange was in compression. Since it was directly connected with the actuator, the deformation and the stress of left column were obviously greater than that of the right column. The right column had small deformations and stresses because of the buffer function provided by the deformation of the steel plate. According to the test data, the maximum stress of PEC columns and the concrete were 186 MPa and 27 MPa respectively when the steel plate was basically yielding. Therefore, when the steel plate was yielded, PEC columns still had high emergency capacity to ensure the stability of the framework and the occurrence of the yielding dissipation of the steel plate prior to the occurrence of the damage of the whole structure. The concrete stress was uniformly distributed in the normal working state, and the maximum value of concrete was 27.63 MPa. Therefore, the concrete was not damaged, and the stress can be continuously increased.
- (2)
- Stress analysis of infill steel plateBased on the analysis of the data, the upper end of the steel plate was pushed by the actuator from left to right when the displacement reaches +26 mm. At this moment, the main diagonal line H17-H24 suffered from the maximum stress that was more than 500 MPa. Meanwhile, we found that the stress of H4 was also large (reaching up to 400 MPa), indicating that the width of diagonal tension strip extended in the direction of the other diagonal line. Besides the stress in the main diagonal region (H18-H23-T5) reaches yield, the counter-diagonal (T11-T15 and T12-T16) also began to yield and dissipate energy. The yield area of the whole steel plate shear wall was about 2/3. Additionally, the stress of the upper part was usually greater than that of the lower part for the strain gages outside of the main diagonal line. Generally speaking, the steel plate has been significantly yielded at the value of +26 mm. When the displacement reached −29 mm in 21st cycle, there were results corresponding to the above analysis. In addition, it should be noted that the local stress in the corner is generally larger, while the stress in the middle, such as T16, was smaller.
2.6.4. Deformation Analysis
The deformation of the specimen in the test was monitored by the displacement meters installed around the specimen, and the data were acquired through DH3816 strain acquisition system. The number and the arrangement of the displacement meters are as shown in Figure 5.
According to the data, there were the most severe bulges of the corresponding main tension stripe in the test process, and the value of displacement on the corresponding tension stripe was relatively large. When the value was changed from the positive peak to the negative peak, the partial region of the tension stripe was changed from concave to convex or from convex to concave, namely presenting the change of plus-minus sign. However, No. 6 displacement meter was located at the center of the steel plate and was always convex toward the inside of the plane. According to the change of No. 5, 6 and 7 displacement meters in the entire cycle loading process (see Figure 10), the infill steel plate had obvious oscillation along with force change of the framework. Due to the plastic deformation generated in the later period, the middle position was not the zero point. It was important to note that No. 3 displacement meter was used to measure the out-of-plane displacement of the joint plate of PEC column, and this displacement had always been small and relatively stable, as shown in Figure 10d. Thus this shows the excellent plane stability and high out-of-plane rigidity of PEC columns.
3. The Comparison of Finite Element and Experimental Results
3.1. Finite Element Modeling
3.1.1. Material Behaviors Modeling
In order to close to the actual situation, the double broken line model considering reinforcement was selected. The grade of the steel used for the finite element parameter analysis was Q235. The yield strength of steel is 235 MPa, the ultimate strength is 375 MPa and the elasticity modulus is MPa. The grade of concrete was C30. The characteristic value of the concrete compressive strength is 30 MPa, the elasticity modulus is MPa and the Poisson’s ratio is 0.2. According to the formulas given in Appendix C2.3 and C2.4 of the Code for Concrete Structures, the compressive and tensile stress-strain curves given in the specification were inputted to the ABAQUS for the consideration of nonlinearity of the concrete material. The uniaxial tension and compression stress-strain curves of concrete C30 are shown in Figure 11.
3.1.2. Models of Steel Plate Shear Walls with PEC Columns
The model was established by using the ABAQUS finite element analysis software. The size of finite element model was the same as the specimen. Firstly, we created all the components that made up the steel shear walls with PEC columns through the Part module. After the components were completed, the Assembly module is used to position the components geometrically so that they were assembled together to form the geometric model of the whole component.
The eight-node three-dimensional hexahedron solid element C3D8R controlled by reduced integration was selected to divide the concrete element in the model building. Shell element S4R was used for steel plate considering the large stress, buckling and tensile deformation in thin-walled steel, shaped steel and joint plate during modeling. Linear beam element B31 considering bending in two directions was selected for steel tie bar. The figure of the model after meshing is shown in Figure 12.
3.1.3. Loading Program
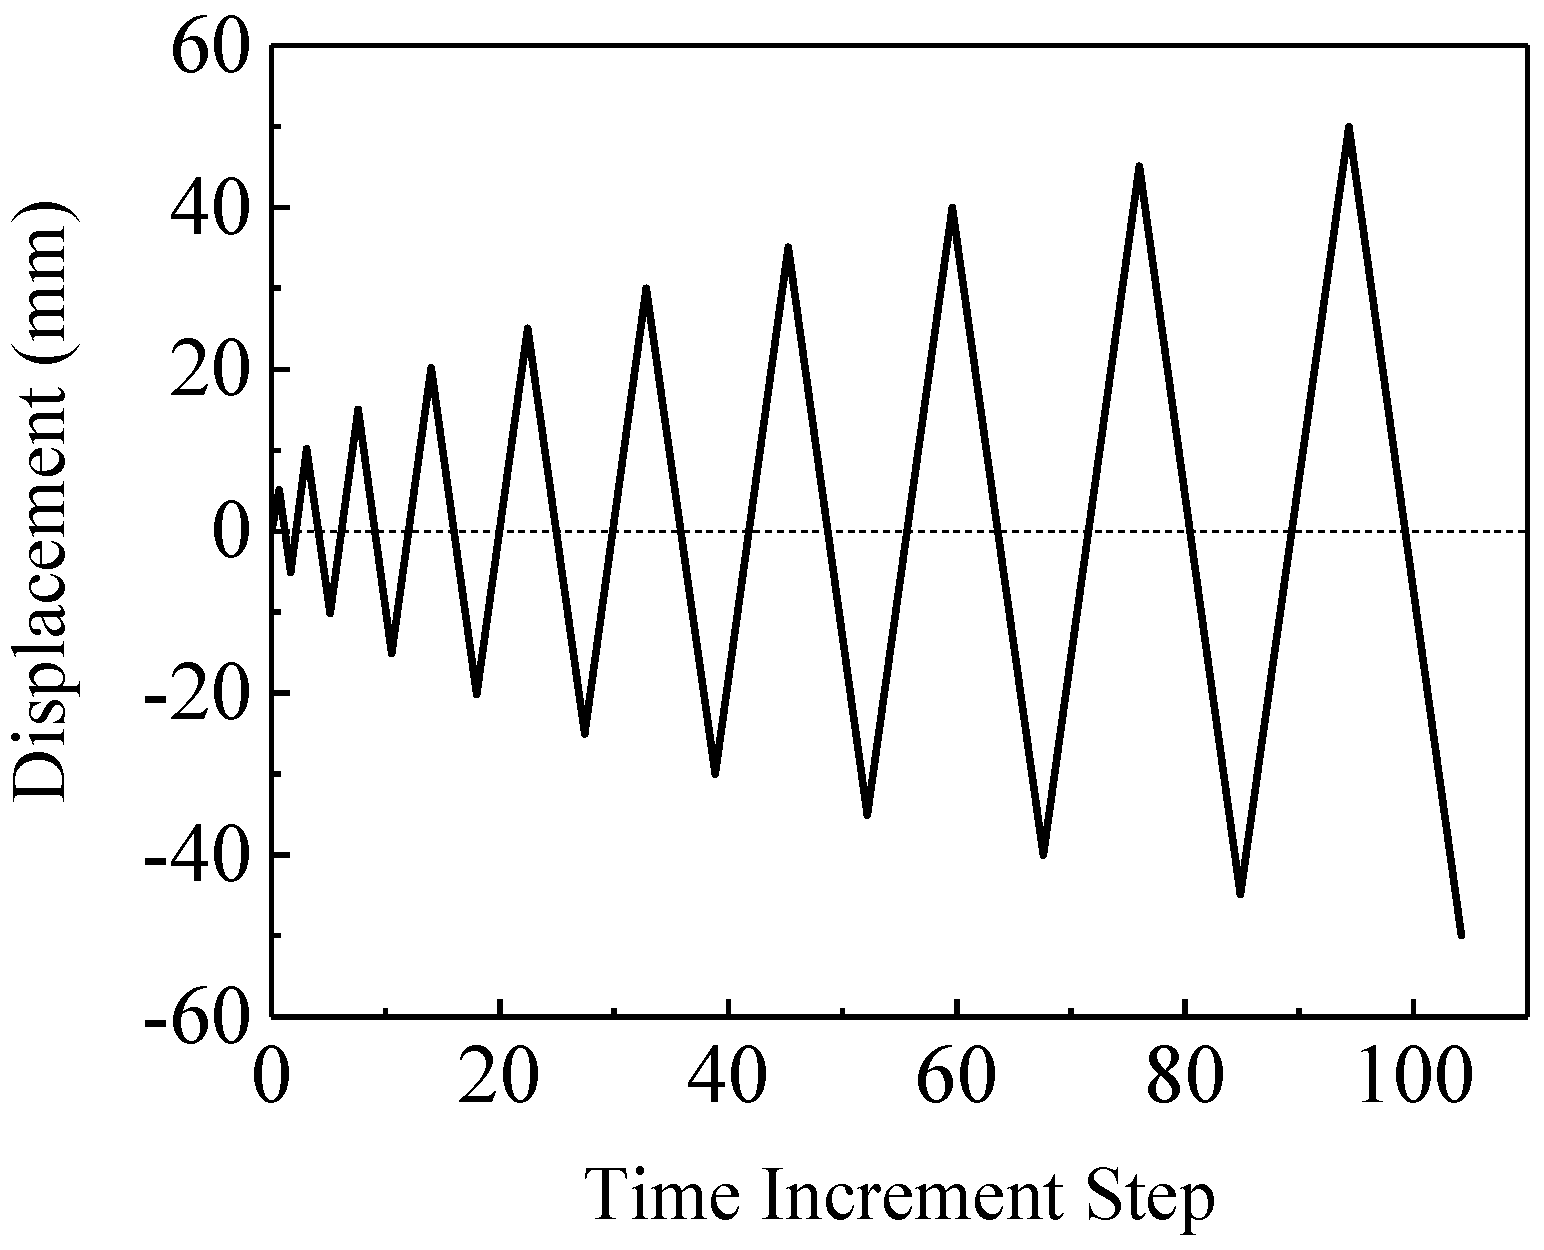
The lateral loading was applied by controlling the displacement, and the loading program is shown in Figure 13. The loading process was divided into 10 steps. The displacement of each step was increased by 5mm, the number of cycles was 1, and the maximum loading amplitude was 50 mm.
3.2. Comparison and Analysis
3.2.1. Failure Mode
The final failure modes of the test and finite element are shown in Figure 14. It can be seen from the figure that the test and finite element have very similar failure modes. The failure sequence of the test specimen included: buckling of the infill steel plate, alternate occurrence and yield of the main diagonal tension strips of the infill steel plate, spread of the main diagonal tension strips of the infill steel plate and occurrence of the secondary diagonal tension strips, local buckling and yielding of the frame beam, cracking in PEC column concrete, continuously increasing out-of-plane displacement of frame beam and cracking of welds at column joint plates due to eccentric loading and fatigue failure. Compared with the test, the failure mode of the finite element is slightly different, because there is no eccentric loading in the finite element and the constraint stiffness is sufficient. The two parts will not crack due to fatigue. The ultimate failure mode of the finite element is not weld cracking, except that the other failure states and sequences are the same as those of the test. Therefore, the PEC columns have sufficient rigidity and strength to constrain the infill steel plate so as to ensure the energy dissipation and improve continuously structural bearing capacity.
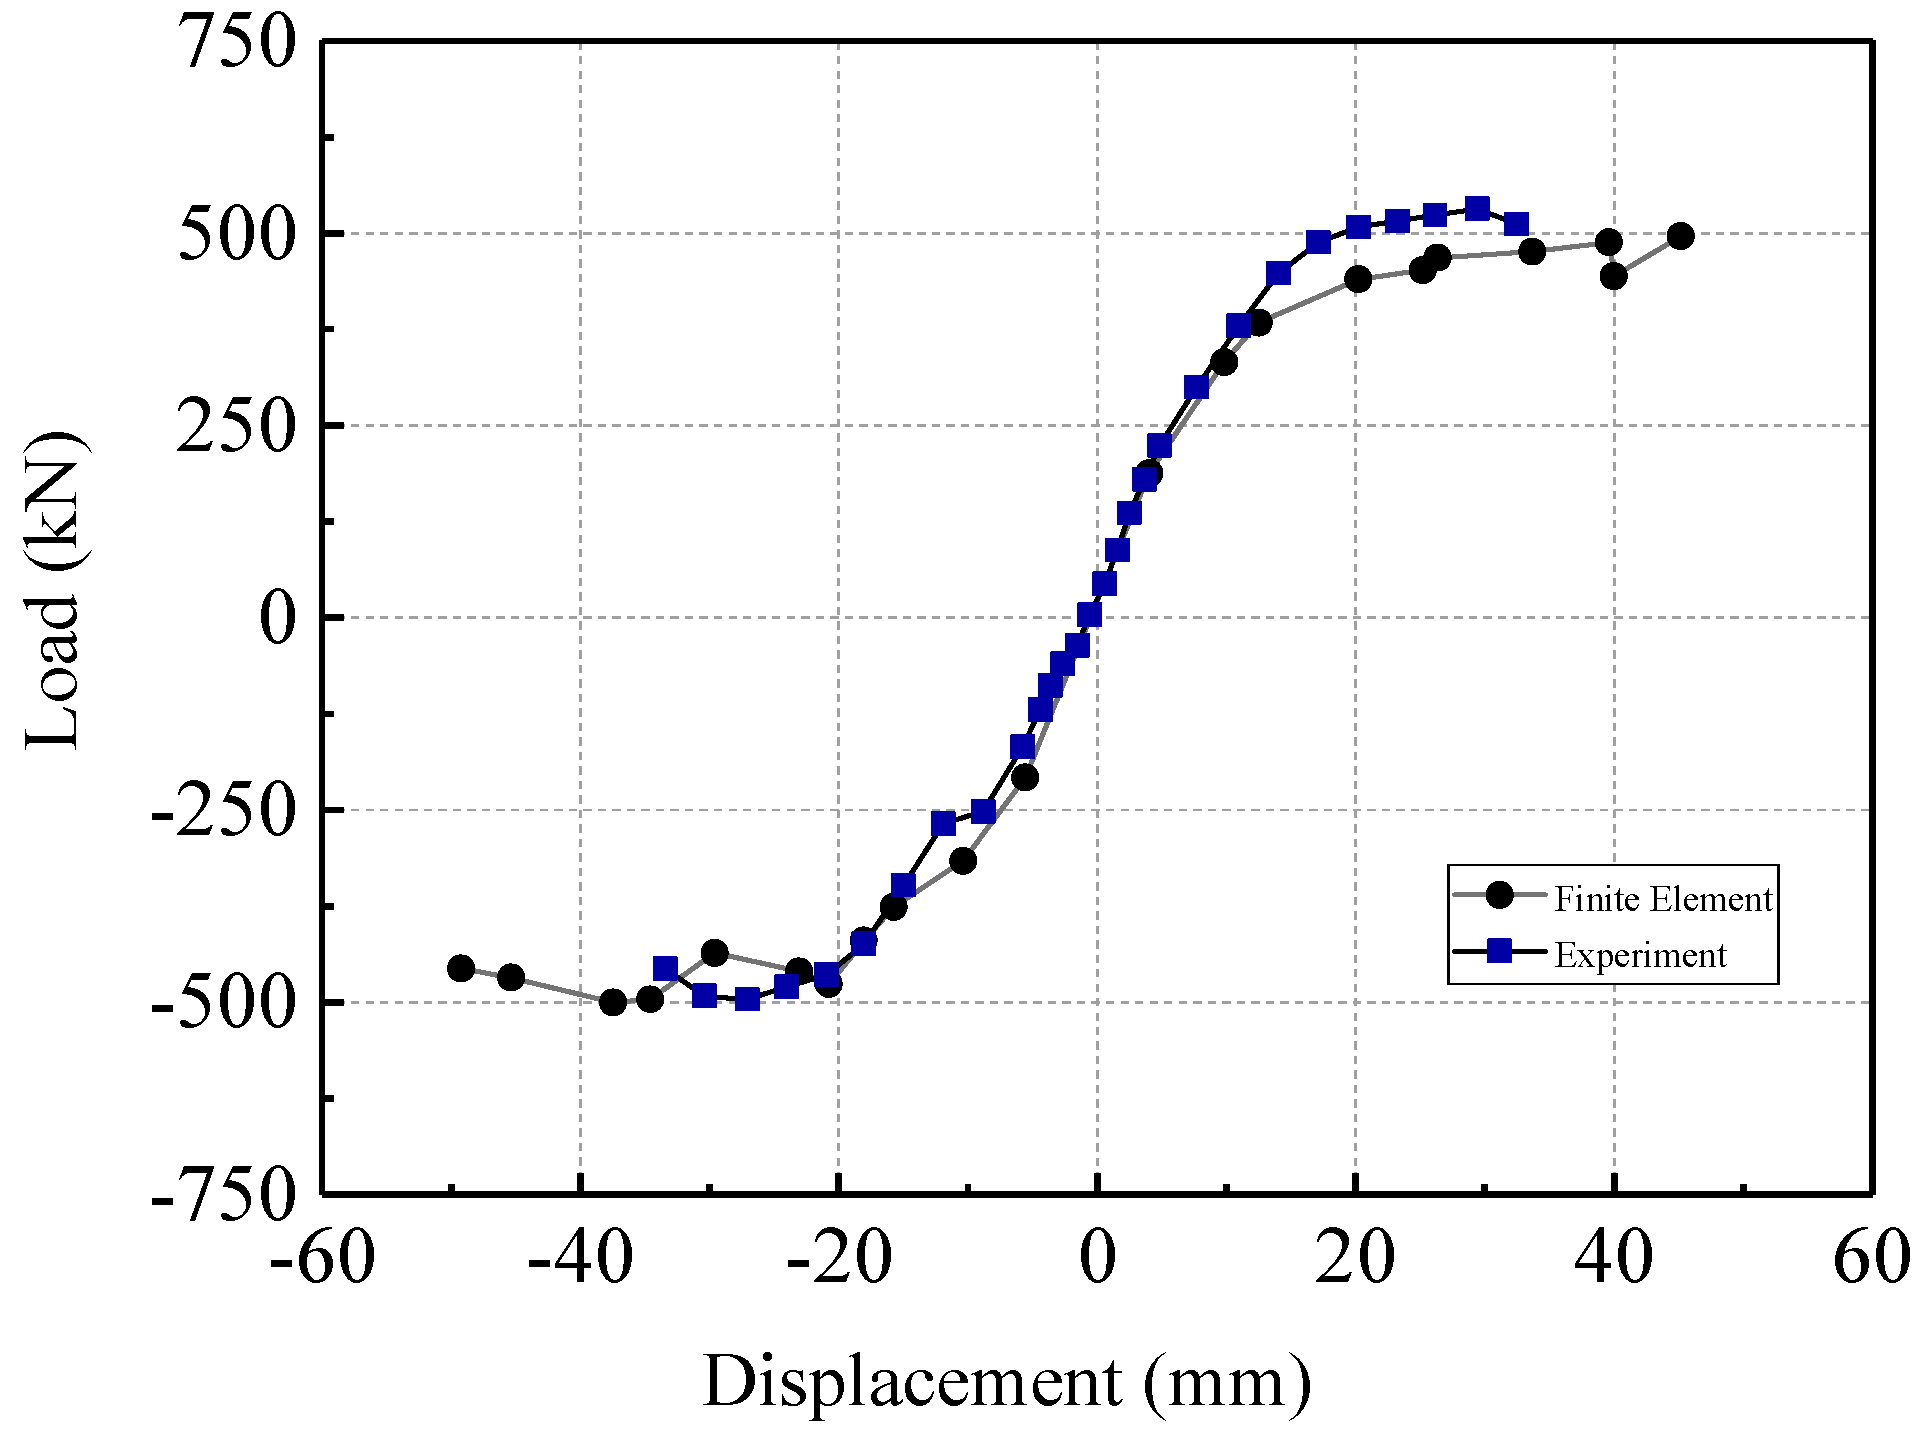
3.2.2. Skeleton Curve
Table 2 shows the comparison results of initial stiffness (K0), max load (Pmax) and ultimate load (Pu) of test pieces. As can be seen from the Figure 15 and Table 2, the overall fitting degree of the skeleton curve of the test and the finite element is good, and the computational result of the initial stiffness is close to the experimental one. In contrast, the initial stiffness of the test was relatively low. The result of the positive loading test was 6.22% lower than that of the finite element and the negative loading test was 8.36% lower than that of the finite element. After entering the elastic-plastic stage, the two curves are still in good agreement under tension, with the peak load test result being 0.38% lower than the finite element result and the ultimate load test result being 0.39% higher. However, under the action of pressure, the test result is slightly larger than the finite element result, and the peak load and ultimate load are 6.67% and 2.83% higher respectively. The main reason for this result may be due to residual stress caused by welding.
3.3. Summary
In this section, the failure modes and the skeleton curves obtained by the finite element analysis and test are compared, and the comparison shows that the finite element and test result are close and the curve fitting degree is good. It shows that the simulation results of ABAQUS software are reliable and the theoretical analysis of the test is feasible with finite element results. The research results in this section will provide reference for the research work in the next section.
4. Parametric Analysis
4.1. Height-Thickness Ratio λ
The λ is the ratio of the height or width (the minimum of the two) to the thickness of the steel plate. The height-thickness ratio reflects the stiffness and strength of infill steel plate. The thickness of 1.5 mm, 2 mm, 2.5 mm, 3.0 mm, 3.5 mm, 4.0 mm, 4.5 mm, 5.0 mm were selected as the basic parameters when concrete grade is C30 and the axial compression ratio is 0.3, and the corresponding height-thickness ratio is respectively 933, 700, 560, 467, 400, 350, 311, and 280. The load–displacement curves of steel plate with the thickness of 1.5 mm~5.0 mm are shown in Figure 16.
It is found that the trend of the load–displacement curves with different thickness of steel plate shear walls are basically the same by observing the 8 curves. There is a first peak at point A. The curve falls briefly at Point B, then continue to rise to ultimate strength of point C. When thickness of the steel plate is increased by 0.5 mm, the ultimate strength increases by about 200 kN (see Table 3). The ultimate strength corresponding to the displacement increases gradually. However, the range is not very large, which shows that the stiffness and ductility of the entire structure are still dominated by the stiffness of the frame. It is noted that the value of point C is decreased when the plate thickness is smaller t = 1.5 mm getting close to the web thickness of PEC column, which indicates that the two peaks of the displacement-load curve are caused by the mismatch of stiffness. On the one hand, this phenomenon can reduce or avoid by improving the design. On the other hand, it also reflects that the PEC columns can improve the overall stiffness of the frame significantly. The stress nephogram of last cycle peak point is shown from Figure 17 with different thickness of steel plate shear walls with PEC columns.
The failure model of the steel plate shear wall with PEC columns has a significant “strip” feature and buckles along the diagonal line with the maximum stress. The number of stripes and the degree of the deformation are decreased with the increase of the thickness of the plate. With the increase of the thickness of the plate, plate stress develops from the upper right corner to the lower left corner. The plumpness of the Hysteretic curves is increased with the increase of the thickness of the steel plate, as shown in Figure 18. The contour envelope area of the hysteretic loop and the energy dissipation coefficient of 8 specimens are shown in Table 4. As shown in Figure 19, the accumulation of each cycle energy consumption is increased significantly.
4.2. Strength Grade of Concrete
Concrete is an important material that influences the compressive strength of columns. However, it is found that the concrete has little effect on the lateral load resistance, bending strength and the stiffness of steel plate shear walls with PEC columns by the test of uniaxial loading and cyclic loading with different grade of concrete. In the case that the parameters of the axial compression ratio is 0.3 and the thickness of steel plate is 2.5 mm, finite element analysis can be carried out taking concrete strength grade of C30, C40, C50, C60, C70, and C80 as the parameter. Specimen numbers and parameters are shown in Table 5.
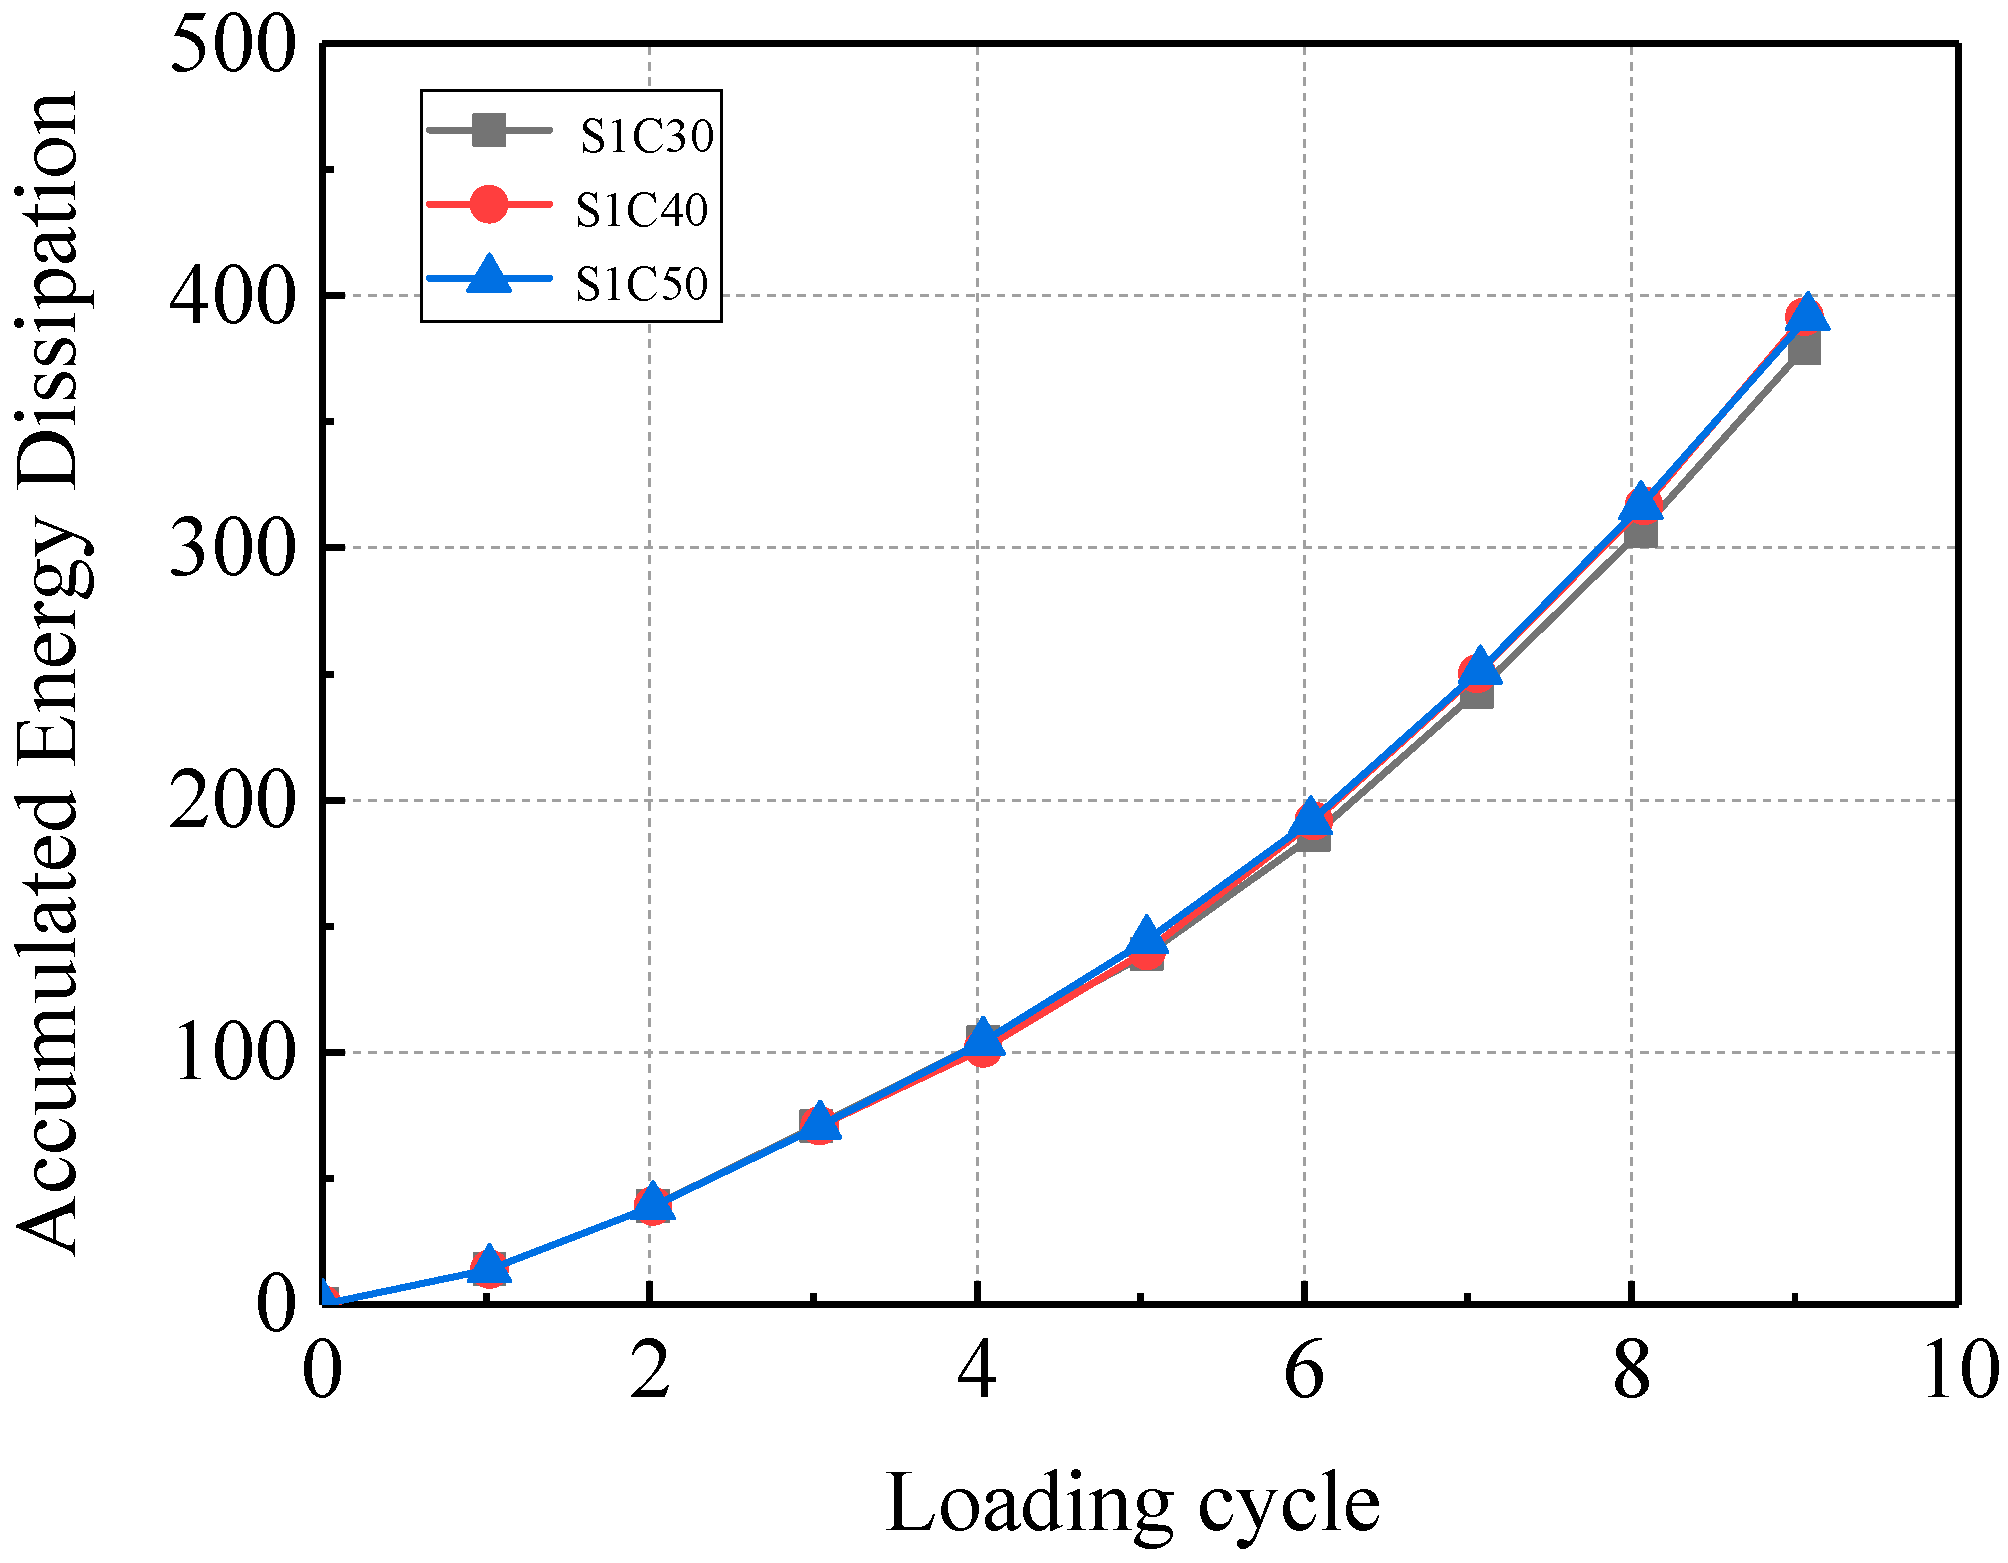
The grade of concrete has little effect on the strength of the entire structure through the load–displacement curve obtained by the finite element analysis. (see in Figure 20). Table 6 shows that the ultimate bearing capacity of the base reaction is slightly improved with the increase of concrete grade. That is to say, the concrete strength can affect the axial bearing capacity of the PEC column directly. However, under the lateral force, the moment is still mainly resisted by the infill steel plate, and the concrete has little contribution to the resistance moment. The concrete has little effect on the energy consumption of steel plate shear walls from the hysteretic curve and energy dissipation obtained by cyclic loading. The hysteretic loop area and the energy dissipation coefficient are shown in Table 7.
4.3. Axial Compression Ratio μ
The axial compression ratio is selected as the main parameter by considering the influence of vertical load on the lateral bearing capacity. The axial compression ratio is the ratio of the axial load to the design strength of the column, and the formula is μ = N/fy. Under the condition that the basic parameter of concrete is C30 and the thickness of steel plate is 2.5 mm, the axial compression ratio with the values of 0, 0.2, 0.3, 0.4, 0.5 and 0.6 are used in the finite element analysis. Specimen numbers and parameters are shown in Table 8.
It can be found that the ultimate bearing capacities at point A and B change little with the increase of the axial compression ratio from load–displacement curves, as shown in Figure 23. However, the influence of ultimate strength is slightly larger at point C. The bearing capacity is gradually reduced with the increase of the axial compression ratio. Comparing the axial compression ratio of 0 and 0.6, the ultimate bearing capacity of the former is 14.4% higher than that of the later, and the difference is about 120 KN, which is shown in Table 9.
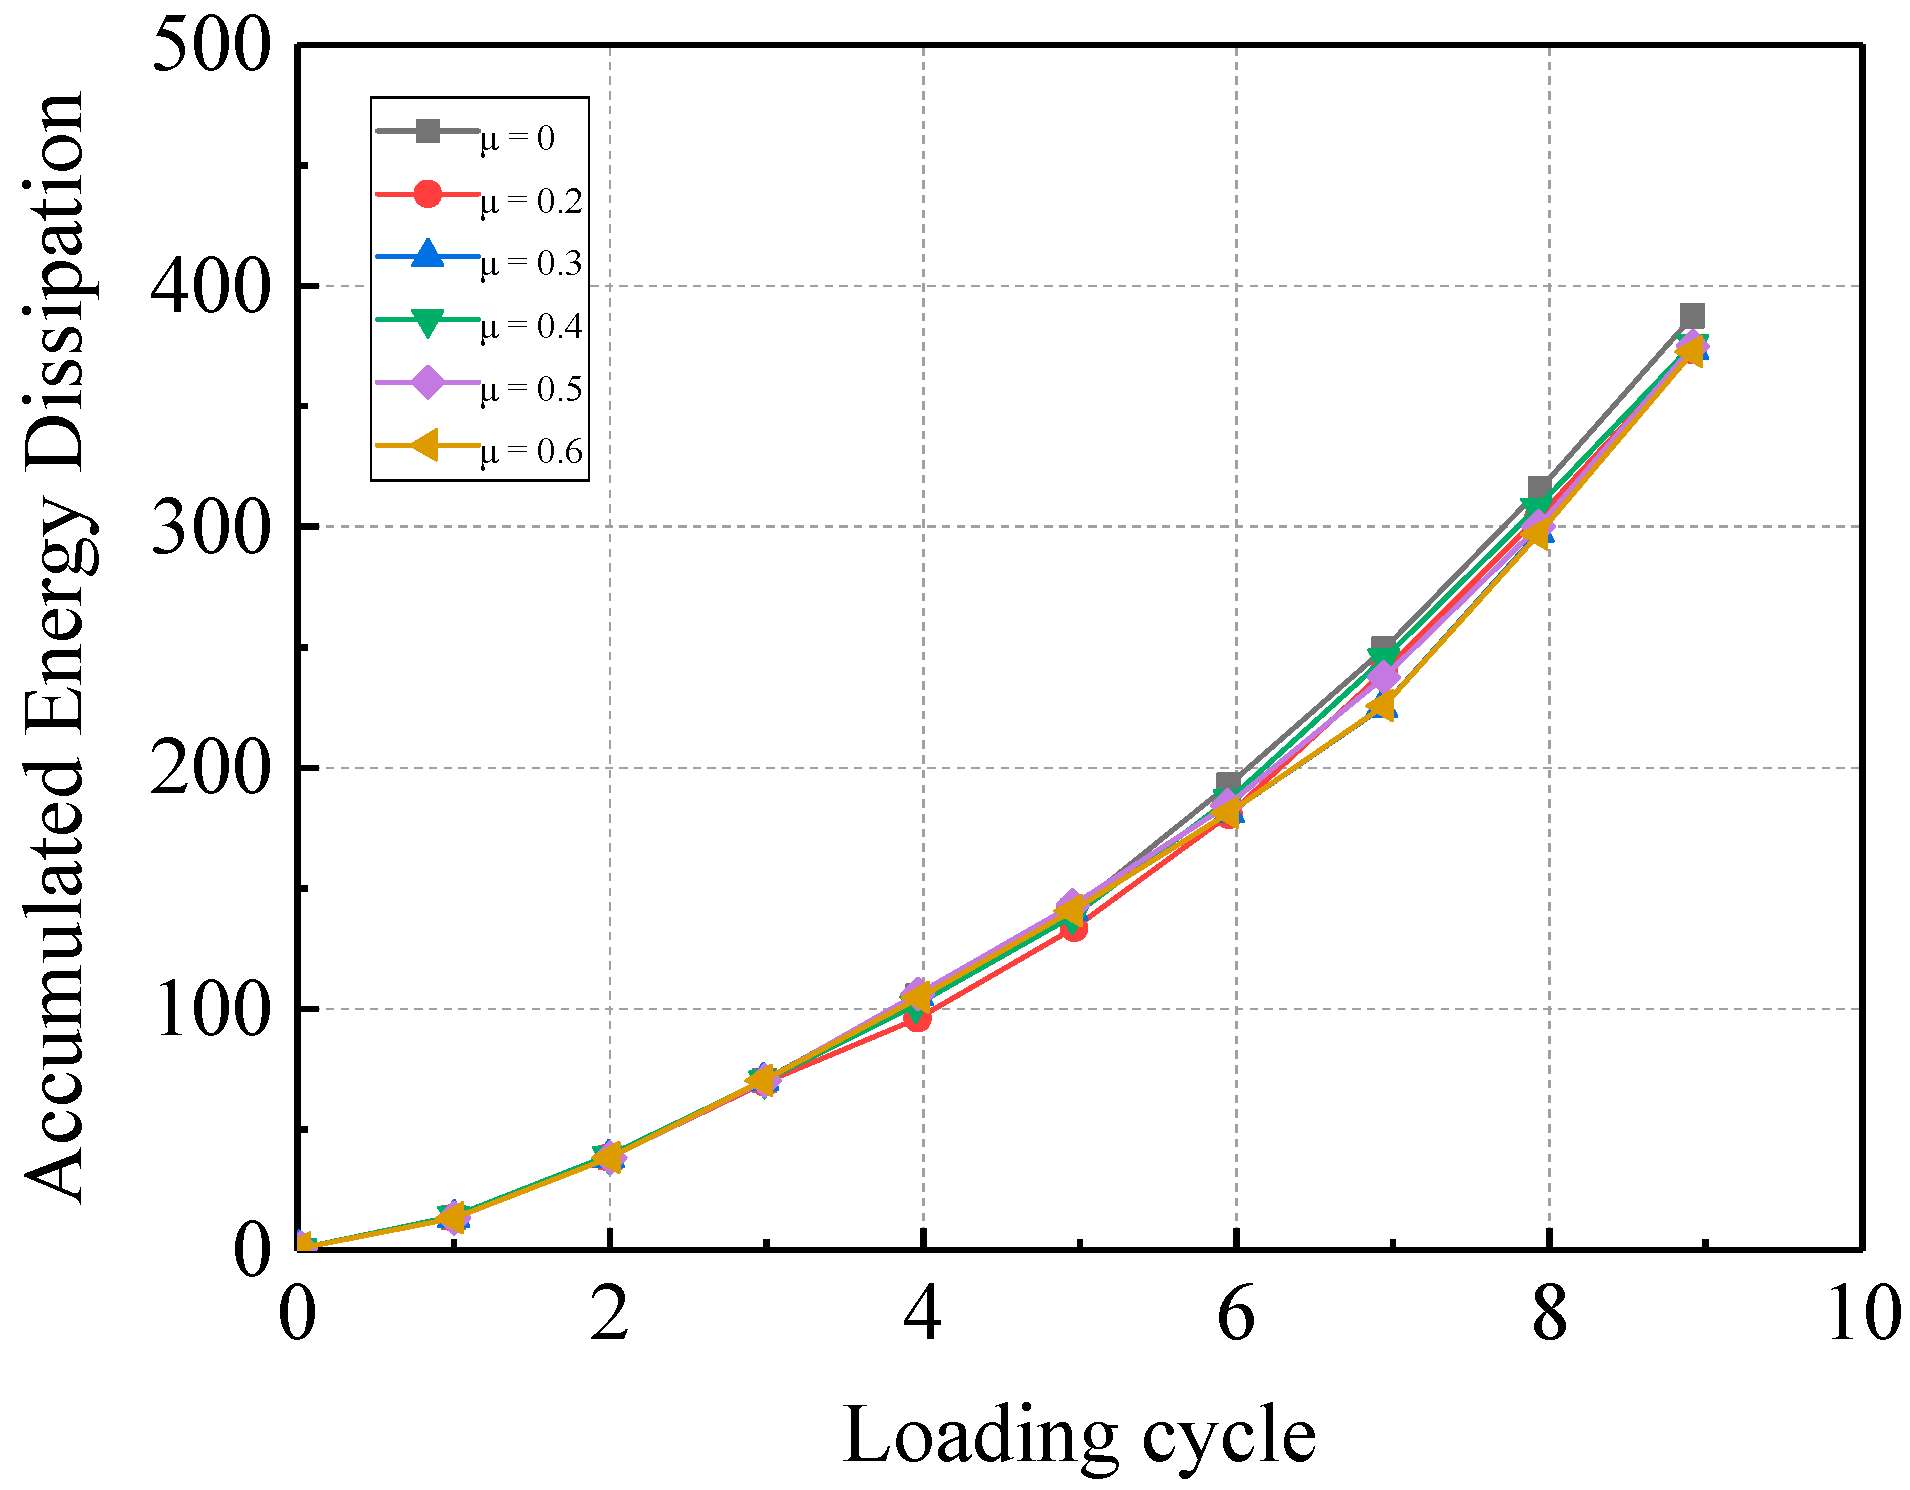
With the increase of the axial compression ratio, the hysteretic capacity is reduced slightly, and the maximum difference of energy dissipation coefficient is not more than 0.5. The trend and plumpness of hysteretic curves are still relatively close as shown in Figure 24 and Table 10. The accumulated energy dissipation is shown in Figure 25.
5. Conclusions and Future Work
Based on the results of this research, the PEC columns have the advantages of high strength and stiffness. Due to these advantages of PEC columns, it is very suitable to be used as the vertical edge member of steel plate shear wall structure. In this paper, a single-span 1/3 specimen of steel plate shear wall with PEC columns is tested under cyclic loading, and the results of the test and finite element are compared. The influence of basic parameters such as height-thickness ratio, strength grade of concrete and axial compression ratio on its bearing capacity and hysteretic behavior is analyzed by finite element software. Finally, the research results are summarized, and the following conclusions are drawn.
- (1)
- It is found that the steel plate shear wall with PEC columns has better mechanical properties and superior seismic performance by finite element analysis and test research. The results show that the introduction of PEC columns into steel plate shear walls plays an outstanding role in improving the seismic performance of steel plate shear wall and exerting the advantages of deformation and energy dissipation of the infill steel plates.
- (2)
- The hysteretic behaviors of steel plate shear wall with PEC columns are stable, and the hysteretic curves are relatively full. The energy dissipation capacity is stable. The energy dissipation coefficient reaches 3.82 and 2.27 by using the finite element analysis and test, respectively. The energy dissipation coefficient is larger obtained by the finite element analysis and experiment.
- (3)
- PEC columns have a good anchoring effect on diagonal tension field of steel plate shear wall. The steel plate yield before the failure of PEC columns. The damage of the steel plate presents a remarkable “stripe” feature, and the concave-convex buckling is formed along the diagonal line where the stress is maximum.
- (4)
- The height-thickness ratio λ as the main parameter of the steel plate has a large effect on the ultimate strength and the hysteretic performance of steel plate shear wall with PEC columns. With the increase of height-thickness ratio, the hysteretic loop becomes full, the increase of ultimate bearing capacity is between 10% and 30%. The concrete strength as the main influential parameter on the axial compressive strength of PEC columns has little effect on the lateral resistance of the steel plate shear wall with PEC columns, and hysteretic behavior with the different grade concrete has little change. The axial compression ratio μ has a great effect on the ultimate bearing capacity of the structure. The ultimate strength and energy dissipation capacity decrease with the increasing of axial compression ratio μ.
The experimental results in this research reveal that crack type of damages exist in the steel plate shear walls with PEC columns. However, the current strain gauges cannot monitor such damages in real time. In future research, the authors will explore real-time crack damage detection in steel plate shear wall with PEC Columns by using the embeddable piezoceramic smart aggregate and surface-bonded piezoceramic patch transducers.
Author Contributions
Z.Y. designed the experiments. W.Y. and H.Z. performed the experiments. Z.Y. and H.Z. analyzed the data and wrote the manuscript.
Funding
This research is supported in part by National NSFC (Natural Science Foundation of China) (51368037, 51568040), the Fundamental Research Funds for the Gansu Universities, the Project of Green and Energy Conservation Architecture of Gansu province, Alumni Foundation of Civil Engineering 77, Lanzhou University of Technology.
Acknowledgments
Authors appreciated Lanzhou University of Science and Technology for providing experimental sites and instruments.
Conflicts of Interest
The authors declare no conflict of interest.
References
- Takahash, T.; Takemoto, Y. Experimental Study on Thin Steel Shear Walls and Particular Bracings under Altermative Horizontal Load. In IABSE Symposium on Resistance and Ultimate Deformability of Structures Acted on by Well-Defined Repeated Loads; International Association for Bridges and Structural Engineering: Lisbon, Portugal, 1973; pp. 185–191. [Google Scholar]
- Sabouri-Ghomi, S.; Roberts, T.M. Nonlinear dynamic analysis of steel plate shear walls including shear and bending deformations. Eng. Struct. 1992, 14, 309–317. [Google Scholar] [CrossRef]
- Roberts, T.M.; Sabouri-Ghomi, S. Hysteretic characteristics of unstiffened plate shear panels. Thin-Walled Struct. 1991, 12, 145–162. [Google Scholar] [CrossRef]
- Roberts, T.M.; Sabouri-Ghomi, S. Hysteretic characteristics of unstiffened perforated steel plate shear panels. Thin-Walled Struct. 1992, 14, 139–151. [Google Scholar] [CrossRef]
- Verma, A.; Sahoo, D.R. Seismic Collapse Analysis of Steel Plate Shear Wall Systems. Key Eng. Mater. 2018, 763, 702–708. [Google Scholar] [CrossRef]
- Verma, A.; Sahoo, D.R. Seismic performance of staggered steel plate shear wall systems in high rise buildings. Earthq. Eng. Struct. Dyn. 2017, 1, 3181–3189. [Google Scholar] [CrossRef]
- Lu, X.Z.; Xie, L.; Guan, H.; Huang, Y.L.; Lu, X. A shear wall element for nonlinear seismic analysis of super-tall buildings using OpenSees. Finite Elem. Anal. Des. 2015, 98, 14–25. [Google Scholar] [CrossRef] [Green Version]
- Mashhadiali, N.; Gholhaki, M.; Zahiri-Hshhem, R. Technical Note: Analytical Evaluation of the Vulnerability of Framed Tall Buildings with Steel Plate Shear Wall to Progressive Collapse. Int. J. Civ. Eng. 2016, 14, 595–608. [Google Scholar] [CrossRef]
- Wang, M.; Yang, W.G.; Shi, Y.J.; Xu, J. Seismic behaviors of steel plate shear wall structures with construction details and materials. J. Constr. Steel Res. 2015, 107, 194–210. [Google Scholar] [CrossRef]
- Zirakian, T.; Zhang, J. Seismic design and behavior of low yield point steel plate shear walls. Int. J. Steel Struct. 2015, 15, 135–151. [Google Scholar] [CrossRef]
- Berman, J.W. Seismic behavior of code designed steel plate shear walls. Steel Constr. 2011, 33, 230–244. [Google Scholar] [CrossRef]
- Bhowmick, A.K. Seismic behavior of steel plate shear walls with centrally placed circular perforations. Steel Constr. 2014, 75, 30–42. [Google Scholar] [CrossRef]
- Xu, W.F.; Yang, X.; Wang, F.L. Experimental investigation on the seismic behavior of newly-developed precast reinforced concrete block masonry shear walls. Appl. Sci. 2018, 8, 1071. [Google Scholar] [CrossRef]
- Jiang, S.F.; Lian, S.H.; Zhao, J.; Li, X.; Ma, S.L. Influence of a new form of bolted connection on the mechanical behaviors of a PC shear wall. Appl. Sci. 2018, 8, 1381. [Google Scholar] [CrossRef]
- Xue, M.; Lu, L.W. Interaction of infilled steel plate shear wall panels with surrounding frame members. In Proceeding of the Structureal Stability Research Council Annual Technical Session, Bethlehem, PA, USA, 11–12 April 1994; pp. 339–354. [Google Scholar]
- Lubell, A.S.; Prion, H.G.L.; Ventura, C.E.; Rezai, M. Unstiffened Steel Plate Shear Wall Performance under Cyclic Loading. J. Struct. Eng. 2000, 127, 453–460. [Google Scholar] [CrossRef]
- Astaneh-Asl, A.; Liu, J.; Mcmullin, K.M. Behavior and design of single plate shear connections. J. Constr. Steel Res. 2002, 58, 1121–1141. [Google Scholar] [CrossRef]
- Hitaka, T.; Matsui, C. Experimental Study on Steel Shear Wall with Slits. J. Struct. Eng. 2003, 129, 586–595. [Google Scholar] [CrossRef]
- Sabourighomi, S.; Mamazizi, S. Experimental investigation on stiffened steel plate shear walls with two rectangular openings. Thin-Walled Struct. 2015, 86, 56–66. [Google Scholar] [CrossRef]
- Jin, S.S.; Bai, J.L.; Ou, J. Seismic behavior of a buckling-restrained steel plate shear wall with inclined slots. J. Constr. Steel Res. 2017, 129, 1–11. [Google Scholar] [CrossRef]
- Wang, P.J.; Xue, Z.P.; Xiao, S.W. Seismic behavior of Self-Buckling-Restrained Steel Plate Shear Wall made by two incline-slotted infill plates. J. Constr. Steel Res. 2017, 133, 47–64. [Google Scholar] [CrossRef]
- Lu, J.Y.; Yu, S.J.; Xia, J.; Qiao, X.D.; Tang, Y. Experimental study on the hysteretic behavior of steel plate shear wall with unequal length slits. J. Constr. Steel Res. 2018, 147, 477–487. [Google Scholar] [CrossRef]
- Li, J.B.; Wang, Y.; Lu, Z.; Li, J.Z. Experimental Study and Numerical Simulation of a Laminated Reinforced Concrete Shear Wall with a Vertical Seam. Appl. Sci. 2017, 7, 629. [Google Scholar] [Green Version]
- Zirakian, T.; Zhang, J. Structural performance of unstiffened low yield point steel plate shear walls. J. Constr. Steel Res. 2015, 112, 40–53. [Google Scholar] [CrossRef]
- Nie, J.G.; Zhu, L. Lateral stiffness of steel plate shear walls. Sci. China 2014, 57, 151–162. [Google Scholar] [CrossRef]
- Clayton, P.M.; Berman, J.W.; Lowes, L.N. Subassembly testing and modeling of self-centering steel plate shear walls. Eng. Struct. 2013, 56, 1848–1857. [Google Scholar] [CrossRef]
- Clayton, P.M.; Berman, J.W.; Lowes, L.N. Seismic performance of self-centering steel plate shear walls with beam-only-connected web plates. J. Constr. Steel Res. 2015, 106, 198–208. [Google Scholar] [CrossRef] [Green Version]
- Clayton, P.M.; Dowden, D.M.; Chaohsien, L.I.; Berman, J.W.; Bruneau, M.; Lowes, N.L.; Tsai, K. Self-centering steel plate shear walls for improving seismic resilience. Front. Struct. Civ. Eng. 2016, 10, 283–290. [Google Scholar] [CrossRef]
- Clayton, P.M.; Tsai, C.; Berman, J.W.; Lowes, L.N. Comparison of web plate numerical models for self-centering steel plate shear walls. Earthq. Eng. Struct. Dyn. 2015, 44, 2093–2110. [Google Scholar] [CrossRef]
- Verma, A.; Sahoo, D.R. Estimation of lateral force contribution of boundary elements in steel plate shear wall systems. Earthq. Engng Struct. Dyn. 2017, 46, 1081–1098. [Google Scholar] [CrossRef]
- Ricles, J.M.; Paboojian, S.D. Seismic performance of steel-encased composite columns. J. Struct. Eng. 1994, 120, 2474–2494. [Google Scholar] [CrossRef]
- Shanmugam, N.E.; Lakshmi, B. State of the art report on steel–concrete composite columns. J. Constr. Steel Res. 2001, 57, 1041–1080. [Google Scholar] [CrossRef]
- Tremblay, R.; Massicotte, B. Experimental Study on the Behavior of Partially Encased Composite Columns Made with Light Welded H Steel Shapes under Compressive Axial Loads; Structral Stability Research Council 1998 Annual Technical Session & Meeting; Trans Tech Publications: Atlanta, GA, USA, 1998; pp. 195–204. [Google Scholar]
- Chicoine, T.; Tremblay, R.; Massicotte, B.; James, M.R.; Lu, L. Behavior and Strength of Partially Encased Composite Columns with Built-up Shapes. J. Struct. Eng. 2002, 128, 279–288. [Google Scholar] [CrossRef]
- Begum, M.; Drivers, R.G.; Elwi, A.E. Finite element modeling of partially encased composite columns using the dynamic explicit solution method. J. Struct. Eng. 2007, 133, 326–334. [Google Scholar] [CrossRef]
- Rahman, M.S.; Begum, M. Numerical simulations of fully encased composite columns under gravity loads. Appl. Mech. Mater. 2016, 860, 140–145. [Google Scholar] [CrossRef]
- Karimi, K.; Tait, M.J.; El-Dakhakhni, W.W. Testing and modeling of a novel FRP-encased steel–concrete composite column. Comp. Struct. 2011, 93, 1463–1473. [Google Scholar] [CrossRef]
- Zhao, G.T.; Feng, C. Axial Ultimate Capacity of Partially Encased Composite Columns. Appl. Mech. Mater. 2012, 166–169, 292–295. [Google Scholar] [CrossRef]
- Begum, M.; Driver, R.G.; Elwi, A.E. Behaviour of partially encased composite columns with high strength concrete. Eng. Struct. 2013, 56, 1718–1727. [Google Scholar] [CrossRef]
- Zhao, G.T.; Hu, Q.W. Seismic Behavior of Partially Encased Concrete Composite Columns. Appl. Mech. Mater. 2015, 777, 190–193. [Google Scholar] [CrossRef]
- Song, Y.C.; Wang, R.P.; Li, J. Local and post-local buckling behavior of welded steel shapes in partially encased composite columns. Thin-Walled Struct. 2016, 108, 93–108. [Google Scholar] [CrossRef]
- Marinopoulou, A.A.; Balopoulos, V.D.; Kalfas, C.N. Simulation of partially encased composite steel–concrete columns with steel columns. J. Constr. Steel Res. 2007, 63, 1058–1065. [Google Scholar] [CrossRef]
- Chen, Y.Y.; Wang, T.; Yang, J.; Zhao, X.Z. Test and numerical simulation of partially encased composite columns subject to axial and cyclic horizontal loads. Int. J. Steel Struct. 2010, 10, 385–393. [Google Scholar] [CrossRef]
- Ellobody, E.; Young, B. Numerical simulation of concrete encased steel composite columns. J. Const. Steel Res. 2011, 67, 211–222. [Google Scholar] [CrossRef]
- Piquer, A.; Hernández-Figueirido, D. Protected steel columns vs partially encased columns: Fire resistance and economic considerations. J. Constr. Steel Res. 2016, 124, 47–56. [Google Scholar] [CrossRef] [Green Version]
- Ahn, J.K.; Lee, C.H. Fire behavior and resistance of partially encased and slim-floor composite beams. J. Constr. Steel Res. 2017, 129, 276–285. [Google Scholar] [CrossRef]
- Peng, J.X.; Hu, S.W.; Zhang, J.R.; Cai, C.S.; Li, L.Y. Influence of cracks on chloride diffusivity in concrete: A five-phase mesoscale model approach. Constr. Build. Mater. 2019, 197, 587–596. [Google Scholar] [CrossRef]
- Song, G.; Wang, C.; Wang, B. Structural Health Monitoring (SHM) of Civil Structures. Appl. Sci. 2017, 7, 789. [Google Scholar] [CrossRef]
- Yang, Y.W.; Divsholi, B.S.; Soh, C.K. A reusable PZT transducer for monitoring initial hydration and structural health of concrete. Sensors 2010, 10, 5193–5208. [Google Scholar] [CrossRef] [PubMed]
- Huo, L.S.; Wang, F.R.; Li, H.N.; Song, G. A fractal contact theory based model for bolted connection looseness monitoring using piezoceramic transducers. Smart Mater. Struct. 2017, 26, 104010. [Google Scholar] [CrossRef]
- Lu, G.T.; Li, Y.R.; Zhou, M.L.; Feng, Q.; Song, G. Detecting Damage Size and Shape in a Plate Structure Using PZT Transducer Array. J. Aerosp. Eng. 2018, 31, 04018075. [Google Scholar] [CrossRef]
- Huo, L.S.; Li, C.B.; Jiang, T.Y.; Li, H.N. Feasibility Study of Steel Bar Corrosion Monitoring Using a Piezoceramic Transducer Enabled Time Reversal Method. Appl. Sci. 2018, 8, 2304. [Google Scholar] [CrossRef]
- Wang, Y.; Zhu, X.Q.; Hao, H.; Ou, J.P. Guided wave propagation and spectral element method for debonding damage assessment in RC structures. J. Sound Vib. 2009, 324, 751–772. [Google Scholar] [CrossRef]
- Zhang, X.Y.; Zhang, L.Y.; Liu, L.J.; Huo, L.S. Prestress monitoring of a steel strand in an anchorage connection using piezoceramic transducers and time reversal method. Appl. Sci. 2018, 18, 4018. [Google Scholar] [CrossRef] [PubMed]
- Du, G.F.; Kong, Q.Z.; Zhou, H.; Gu, H.C. Multiple cracks detection in pipeline using damage index matrix based on piezoceramic transducer-enabled stress wave propagation. Sensors 2017, 17, 1812. [Google Scholar] [CrossRef] [PubMed]
- Venugopal, V.P.; Wang, G. Modeling and analysis of Lamb wave propagation in a beam under Lead Zirconate Titanate actuation and sensing. J. Intell. Mater. Syst. Struct. 2015, 26, 1679–1698. [Google Scholar] [CrossRef]
- Wang, F.R.; Huo, L.S.; Song, G. A piezoelectric active sensing method for quantitative monitoring of bolt loosening using energy dissipation caused by tangential damping based on the fractal contact theory. Smart Mater. Struct. 2018, 27, 9. [Google Scholar] [CrossRef]
- Xu, K.; Deng, Q.S.; Cai, L.J.; Ho, S.H.; Song, G. Damage Detection of a Concrete Column Subject to Blast Loads Using Embedded Piezoceramic Transducers. Sensors 2018, 18, 1377. [Google Scholar] [CrossRef] [PubMed]
- Yin, H.Y.; Wang, T.; Yang, D.; Liu, S.P.; Shao, J.H.; Li, Y.R. A Smart Washer for Bolt Looseness Monitoring Based on Piezoelectric Active Sensing Method. Appl. Sci. 2016, 6, 320. [Google Scholar] [CrossRef]
- Shao, J.H.; Wang, T.; Yin, H.Y.; Yang, D.; Li, Y.R. Bolt Looseness Detection Based on Piezoelectric Impedance Frequency Shift. Appl. Sci. 2016, 6, 298. [Google Scholar] [CrossRef]
- Wang, F.R.; Ho, S.C.M.; Huo, L.S.; Song, G. A Novel Fractal Contact-Electromechanical Impedance Model for Quantitative Monitoring of Bolted Joint Looseness. IEEE Access 2018, 6, 40212–40220. [Google Scholar] [CrossRef]
- Xu, J.; Wang, C.Y.; Li, H.G.; Zhang, C.W.; Hao, J.J.; Fan, S.L. Health Monitoring of Bolted Spherical Joint Connection Based on Active Sensing Technique Using Piezoceramic Transducers. Sensors 2018, 18, 1727. [Google Scholar] [CrossRef] [PubMed]
- Provdakis, C.P.; Stefanaki, K.D.; Voutetaki, M.E.; Tsompanakis, Y.; Stavroulaki, M. Damage detection in concrete structures using a simultaneously activated multi-mode PZT active sensing system: Numerical modelling. Struct. Infrastr. Eng. 2014, 10, 1451–1468. [Google Scholar] [CrossRef]
- Jiang, T.Y.; Kong, Q.Z.; Wang, W.X.; Huo, L.S. Monitoring of grouting compactness in a post-tensioning tendon duct using piezoceramic transducers. Sensors 2016, 16, 1343. [Google Scholar] [CrossRef] [PubMed]
- Xu, B.; Li, B.; Song, G. Active debonding detection for large rectangular CFSTs based on wavelet packet energy spectrum with piezoceramics. J. Struct. Eng. 2013, 139, 1435–1443. [Google Scholar] [CrossRef]
- Luo, M.Z.; Li, W.J.; Hei, C.; Song, G. Concrete infill monitoring in concrete-filled FRP tubes using a PZT-based ultrasonic time-of-flight method. Sensors 2016, 16, 2083. [Google Scholar] [CrossRef] [PubMed]
- Kong, Q.Z.; Feng, Q.; Song, G. Water presence detection in a concrete crack using smart aggregates. Int. Smart Nano Mater. 2015, 6, 149–161. [Google Scholar] [CrossRef] [Green Version]
- Kong, Q.Z.; Robert, R.; Silva, P.; Mo, Y.L. Cyclic crack monitoring of a reinforced concrete column under simulated pseudo-dynamic loading using piezoceramic-based smart aggregates. Appl. Sci. 2016, 6, 341. [Google Scholar] [CrossRef]
- Gu, H.C.; Moslehy, Y.; Sanders, D.; Song, G. Multi-functional smart aggregate-based structural health monitoring of circular reinforced concrete columns subjected to seismic excitations. Smart Mater Struct. 2010, 19, 065026. [Google Scholar] [CrossRef]
- Li, W.J.; Kong, Q.Z.; Ho, S.C.M.; Lim, I. Feasibility study of using smart aggregates as embedded acoustic emission sensors for health monitoring of concrete structures. Smart Mater. Struct. 2016, 25, 115031. [Google Scholar] [CrossRef]
- Wang, J.J.; Kong, Q.Z.; Shi, Z.F.; Song, G. Electromechanical properties of smart aggregate: Theoretical modeling and experimental validation. Smart Mater. Struct. 2016, 25, 095008. [Google Scholar] [CrossRef]
- Hong, X.B.; Wang, H.; Wang, T.; Liu, G.X. Dynamic cooperative identification based on synergetics for pipe structural health monitoring with piezoceramic transducers. Smart Mater. Struct. 2013, 22, 045003. [Google Scholar] [CrossRef]
- Xu, B.; Zhang, T.; Gu, H.; Gu, H.H. Active interface debonding detection of a concrete-filled steel tube with piezoelectric technologies using wavelet packet analysis. Mech. Syst. Sign. Proc. 2013, 36, 7–17. [Google Scholar] [CrossRef]
- Huang, Q.; Xu, B.; Li, B.; Song, G. Monitoring for large cross-section CFSTs of a super high-rise building with piezoceramic actuators and sensors. Adv. Mater. Res. 2011, 163–167, 7. [Google Scholar] [CrossRef]
- Du, G.F.; Zhang, J.; Zhang, J.C.; Song, G. Experimental study on stress monitoring of sand-filled steel tube during impact using piezoceramic smart aggregates. Sensors 2017, 17, 1930. [Google Scholar] [CrossRef] [PubMed]
- Kong, Q.Z.; Fan, S.L.; Bai, X.L.; Mo, Y.L.; Song, G. A novel embeddable spherical smart aggregate for structural health monitoring: Part I. Fabrication and electrical characterization. Smart Mater. Struct. 2017, 26, 8. [Google Scholar] [CrossRef]
- Kong, Q.Z.; Fan, S.L.; Mo, Y.L.; Song, G. A novel embeddable spherical smart aggregate for structural health monitoring: Part II. numerical and experimental verifications. Smart Mater. Struct. 2017, 26. [Google Scholar] [CrossRef]
- Soh, C.K.; Tseng, K.K.; Bhalla, S.; Gupta, A. Performance of smart piezoceramic patches in health monitoring of a RC bridge. Smart Mater. Struct. 2000, 9, 533. [Google Scholar] [CrossRef]
- Tsai, K.C.; Wu, S.; Popve, E.P. Cyclic performance of steel beam-column moment joints. Eng. Struct. 1995, 17, 596–602. [Google Scholar] [CrossRef]
- Mitra, N. Pinching4 Model (OpenSees User Documentation); University of California: Oakland, CA, USA, 2012. [Google Scholar]
- Federico, G.; Maurizio, O.; Paolo, S. Pinching in Steel Rack Joints: Numerical Modelling and Effects on Structural Response. Int. J. Steel Struct. 2019, 19, 131–146. [Google Scholar]
Figure 1.
Geometrical Dimensions. (a) Front View, (b) Side view, (c) Top View, (d) Cross - section of PEC Column.
Figure 1.
Geometrical Dimensions. (a) Front View, (b) Side view, (c) Top View, (d) Cross - section of PEC Column.

Figure 2.
Physical Photo of Test Specimen PEC (partially encased composite).

Figure 3.
Loading system diagram. (a) loading device (b) scaffolds.

Figure 4.
Loading Program.

Figure 5.
Displacement Meter Layout.

Figure 6.
Strain Gauges Layout.

Figure 7.
Phenomenon of Test. (a) The main diagonal tension stripe that appeared when the displacement reached 11 mm, (b) Infill steel plate tension stripe, (c) All diagonal tension stripes appearing during the test, (d) Secondary diagonal line, (e) The paint coating of wed of frame beam cracked and transverse cracks appeared in the middle of the column, (f) Transverse and oblique cracks appeared in the upper part of the column and The maximum out-of-plane displacement of the frame beam occurred when displacement reached 26 mm, (g) Top flange damages, (h) Slight torsion of frame beam, (i) Deformation of beam end (j) crack at loading end.


Figure 8.
Loading-displacement curve.

Figure 9.
Skeleton Curve.

Figure 10.
Displacement Meter. (a) No. 5; (b) No.6; (c) No. 7; (d) No.3.

Figure 11.
Material model. (a) Stress-strain relationship under compression; (b) Stress-strain relationship under Tension; (c) The bi-linear model considering reinforcement.
Figure 11.
Material model. (a) Stress-strain relationship under compression; (b) Stress-strain relationship under Tension; (c) The bi-linear model considering reinforcement.

Figure 12.
The figure of the model after meshing. (a)PEC columns; (b) Concrete; (c) Steel Beam; (d) Infill Plate; (e) Overall Model.
Figure 12.
The figure of the model after meshing. (a)PEC columns; (b) Concrete; (c) Steel Beam; (d) Infill Plate; (e) Overall Model.

Figure 13.
Loading System.

Figure 14.
Failure mode: (a) Experiment; (b) Finite Element.

Figure 15.
Skeleton Curve.

Figure 16.
Load–Displacement Curves.

Figure 17.
The stress nephogram of last cycle peak point with different thickness of steel plate shear wall with PEC column. (a) λ = 933; (b) λ = 467; (c) λ = 350 t = 4.0 mm; (d) λ = 280 t = 5.0 mm.
Figure 17.
The stress nephogram of last cycle peak point with different thickness of steel plate shear wall with PEC column. (a) λ = 933; (b) λ = 467; (c) λ = 350 t = 4.0 mm; (d) λ = 280 t = 5.0 mm.

Figure 18.
Hysteretic curves with the increase of the thickness of the steel plate. (a) t = 1.5 mm; (b) t = 2.0 mm; (c) t = 2.5 mm; (d) t = 3.0 mm; (e) t = 3.5 mm; (f) t = 4.0 mm; (g) t = 4.5 mm; (h) t = 5.0 mm.
Figure 18.
Hysteretic curves with the increase of the thickness of the steel plate. (a) t = 1.5 mm; (b) t = 2.0 mm; (c) t = 2.5 mm; (d) t = 3.0 mm; (e) t = 3.5 mm; (f) t = 4.0 mm; (g) t = 4.5 mm; (h) t = 5.0 mm.


Figure 19.
Accumulation Energy Consumption.

Figure 20.
Load–Displacement Curves.

Figure 21.
The hysteretic curves with different grades of concrete.

Figure 22.
Accumulation Energy Consumption.

Figure 23.
Load–Displacement Curves.

Figure 24.
The hysteretic curves with different axial compression ratio. (a) μ = 0; (b) μ = 0.2; (c) μ = 0.3; (d) μ = 0.4; (e) μ = 0.5; (f) μ = 0.6.
Figure 24.
The hysteretic curves with different axial compression ratio. (a) μ = 0; (b) μ = 0.2; (c) μ = 0.3; (d) μ = 0.4; (e) μ = 0.5; (f) μ = 0.6.

Figure 25.
Accumulated Energy Dissipation.


Table 1.
Member parameters.
| Member | Section-Size (mm) |
|---|---|
| infill plate | 1850 × 1400 × 2.5 |
| frame beam | H100 × 50 × 4.5 × 3.2 |
| left and right columns | H150 × 150 × 4 × 6 |
Table 2.
Comparison of experiment and finite element analysis.
| Item | Forward Loading | Reverse Loading | ||||
|---|---|---|---|---|---|---|
| (kN/mm) | (kN) | (kN) | (kN/mm) | (kN) | (kN) | |
| Experiment | 40.38 | 535.5 | 516.2 | 39.94 | −506.5 | −468.0 |
| Finite Element | 42.89 | 502.0 | 502.0 | 43.28 | −508.4 | −466.2 |
| Difference (%) | 6.22 | −6.67 | −2.83 | 8.36 | 0.38 | −0.39 |
Table 3.
Load–Displacement curve.
| Specimens Number | Peak of Point A (kN) | Displacement of Point A (mm) | Inter Story Drift of Point A | Peak of Point C (kN) | Displacement of Point C (mm) | Inter Story Drift of Point C | Lateral Stiffness (kN/mm) |
|---|---|---|---|---|---|---|---|
| S1t1.5 | 518 | 5.02 | 3.35 × 10⁻³ | 590.5 | 51.78 | 3.45 × 10⁻² | 103.19 |
| S1t2.0 | 685.5 | 4.48 | 2.99 × 10⁻³ | 736.2 | 44.99 | 3.00 × 10⁻² | 153.01 |
| S1t2.5 | 816.4 | 4.47 | 2.98 × 10⁻³ | 930.6 | 46.8 | 3.12 × 10⁻² | 182.64 |
| S1t3.0 | 962.6 | 3.96 | 2.64 × 10⁻³ | 1104.9 | 47.7 | 3.18 × 10⁻² | 243.08 |
| S1t3.5 | 1105.3 | 3.95 | 2.63 × 10⁻³ | 1419 | 50.26 | 3.35 × 10⁻² | 279.82 |
| S1t4.0 | 1232.7 | 3.95 | 2.63 × 10⁻³ | 1622.7 | 53.83 | 3.59 × 10⁻² | 312.08 |
| S1t4.5 | 1358.5 | 3.95 | 2.63 × 10⁻³ | 1761.5 | 52.5 | 3.50 × 10⁻² | 343.92 |
| S1t5.0 | 1480.6 | 3.95 | 2.63 × 10⁻³ | 1962.1 | 53.82 | 3.59 × 10⁻² | 374.84 |
Table 4.
Hysteretic Loop Envelope Area and Energy Dissipation Coefficient.
| Specimens Number | SABC+SCDA Area (kN·mm) | SOBE+SODF Area (kN·mm) | Energy Dissipation Coefficient E |
|---|---|---|---|
| S1t1.5 | 63,360 | 28,800 | 2.2 |
| S1t2.0 | 80,640 | 25,040 | 3.5 |
| S1t2.5 | 128,510 | 33,600 | 3.82 |
| S1t3.0 | 135,640 | 35,120 | 3.86 |
| S1t3.5 | 157,840 | 39,840 | 3.96 |
| S1t4.0 | 170,640 | 38,400 | 4.44 |
| S1t4.5 | 202,640 | 44,280 | 4.57 |
| S1t5.0 | 221,920 | 47,550 | 4.67 |
Table 5.
Specimens Number about Grade of Concrete.
| Specimens Number | Grade of Concrete | Axial Compression Ratio u | Plate Thickness |
|---|---|---|---|
| S1C30 | C30 | 0.3 | 2.5 mm |
| S1C40 | C40 | 0.3 | 2.5 mm |
| S1C50 | C50 | 0.3 | 2.5 mm |
| S1C60 | C60 | 0.3 | 2.5 mm |
| S1C70 | C70 | 0.3 | 2.5 mm |
| S1C80 | C80 | 0.3 | 2.5 mm |
Table 6.
Load–Displacement curve.
| Specimens Number | Peak of Point A (kN) | Displacement of Point A (mm) | Inter Story Drift of Point A | Peak of Point C (kN) | Displacement of Point C (mm) | Inter Story Drift of Point C | Lateral Stiffness (kN/mm) |
|---|---|---|---|---|---|---|---|
| S1C30 | 816.4 | 4.47 | 2.98 × 10⁻³ | 930.6 | 46.8 | 3.12 × 10⁻² | 182.64 |
| S1C40 | 823.3 | 4.47 | 2.98 × 10⁻³ | 951.8 | 46.8 | 3.12 × 10⁻² | 184.18 |
| S1C50 | 823.1 | 4.47 | 2.98 × 10⁻³ | 955.5 | 46.8 | 3.12 × 10⁻² | 184.14 |
| S1C60 | 823.8 | 4.47 | 2.98 × 10⁻³ | 985.2 | 46.8 | 3.12 × 10⁻² | 184.3 |
| S1C70 | 826.7 | 4.47 | 2.98 × 10⁻³ | 971.2 | 46.8 | 3.12 × 10⁻² | 184.94 |
| S1C80 | 824.3 | 3.96 | 2.64 × 10⁻³ | 970.3 | 45.9 | 3.06 × 10⁻² | 208.16 |
Table 7.
Hysteretic Loop Envelope Area and Energy Dissipation Coefficient.
| Specimens Number | SABC+SCDA Area (kN·mm) | SOBE+SODF Area (kN·mm) | Energy Dissipation Coefficient E |
|---|---|---|---|
| S1C30 | 128,510 | 33,600 | 3.82 |
| S1C40 | 129,120 | 33,780 | 3.82 |
| S1C50 | 129,740 | 33,850 | 3.83 |
Table 8.
Specimens Number about Axial Compression Ratio u.
| Specimens Number | Grade of Concrete | Axial Compression Ratio u | Plate Thickness |
|---|---|---|---|
| S1μ0 | C30 | 0 | 2.5 mm |
| S1μ02 | C30 | 0.2 | 2.5 mm |
| S1μ03 | C30 | 0.3 | 2.5 mm |
| S1μ04 | C30 | 0.4 | 2.5 mm |
| S1μ05 | C30 | 0.5 | 2.5 mm |
| S1μ06 | C30 | 0.6 | 2.5 mm |
Table 9.
Load–Displacement curve.
| Specimens Number | Peak of Point A (kN) | Displacement of Point A (mm) | Inter Story Drift of Point A | Peak of Point C (kN) | Displacement of Point C (mm) | Inter Story Drift of Point C | Lateral Stiffness (kN/mm) |
|---|---|---|---|---|---|---|---|
| S1μ0 | 813 | 4.47 | 2.98 × 10⁻³ | 971.9 | 47.7 | 3.18 × 10⁻² | 181.88 |
| S1μ02 | 825.3 | 4.47 | 2.98 × 10⁻³ | 942.7 | 46.8 | 3.12 × 10⁻² | 184.63 |
| S1μ03 | 816.4 | 4.47 | 2.98 × 10⁻³ | 930.6 | 46.8 | 3.12 × 10⁻² | 182.64 |
| S1μ04 | 821.5 | 4.47 | 2.98 × 10⁻³ | 921.8 | 47.7 | 3.18 × 10⁻² | 183.78 |
| S1μ05 | 817.7 | 4.46 | 2.97 × 10⁻³ | 910.2 | 50.3 | 3.35 × 10⁻² | 183.34 |
| S1μ06 | 817 | 4.46 | 2.87 × 10⁻³ | 850.5 | 47.7 | 3.18 × 10⁻² | 183.18 |
Table 10.
Hysteretic Loop Envelope Area and Energy Dissipation Coefficient.
| Specimens Number | SABC+SCDA Area (kN·mm) | SOBE + SODF Area (kN·mm) | Energy Dissipation Coefficient E |
|---|---|---|---|
| S1μ0 | 129,440 | 33,392 | 3.87 |
| S1μ02 | 128,540 | 33,476 | 3.84 |
| S1μ03 | 128,510 | 33,600 | 3.82 |
| S1μ04 | 128,540 | 34,360 | 3.66 |
| S1μ05 | 125,680 | 36,370 | 3.46 |
| S1μ06 | 170,640 | 36,640 | 3.41 |
© 2019 by the authors. Licensee MDPI, Basel, Switzerland. This article is an open access article distributed under the terms and conditions of the Creative Commons Attribution (CC BY) license (http://creativecommons.org/licenses/by/4.0/).
Share and Cite
MDPI and ACS Style
Yin, Z.; Zhang, H.; Yang, W. Study on Seismic Performance and Damage Analysis of Steel Plate Shear Wall with Partially Encased Composite (PEC) Columns. Appl. Sci. 2019, 9, 907. https://0-doi-org.brum.beds.ac.uk/10.3390/app9050907
AMA Style
Yin Z, Zhang H, Yang W. Study on Seismic Performance and Damage Analysis of Steel Plate Shear Wall with Partially Encased Composite (PEC) Columns. Applied Sciences. 2019; 9(5):907. https://0-doi-org.brum.beds.ac.uk/10.3390/app9050907
Chicago/Turabian StyleYin, Zhanzhong, Hui Zhang, and Wenwei Yang. 2019. "Study on Seismic Performance and Damage Analysis of Steel Plate Shear Wall with Partially Encased Composite (PEC) Columns" Applied Sciences 9, no. 5: 907. https://0-doi-org.brum.beds.ac.uk/10.3390/app9050907
Note that from the first issue of 2016, this journal uses article numbers instead of page numbers. See further details here.