Analysis of a Supercapacitor/Battery Hybrid Power System for a Bulk Carrier

1
Future Technology Research Team, Korean Register (KR), Busan 46762, Korea
2
Division of Marine System Engineering, Korea Maritime and Ocean University, Busan 49112, Korea
*
Authors to whom correspondence should be addressed.
Appl. Sci. 2019, 9(8), 1547; https://0-doi-org.brum.beds.ac.uk/10.3390/app9081547
Submission received: 4 March 2019
/
Revised: 8 April 2019
/
Accepted: 10 April 2019
/
Published: 14 April 2019
(This article belongs to the Special Issue Cutting-Edge Technologies for Renewable Energy Production and Storage)
Abstract
:Concerns about harmful exhaust emissions from ships have been an issue. Specifically, the emissions at ports are the most serious. This paper introduces a hybrid power system that combines conventional diesel generators with two different energy storage systems (ESSs) (lithium-ion batteries (LIB) and supercapacitors (SC)) focused on port operations of ships. To verify the proposed system, a bulk carrier with four deck cranes is selected as a target ship, and each size (capacity) of LIB and SC is determined based on assumed power demands. The determined sizes are proven to be sufficient for a target ship through simulation results. Lastly, the proposed system is compared to a conventional one in terms of the environmental and economic aspects. The results show that the proposed system can reduce emissions (CO2, SOX, and NOx) substantially and has a short payback period, particularly for ships that have a long cargo handling time or visit many ports with a short-term sailing time. Therefore, the proposed system could be an eco-friendly and economical solution for bulk carriers for emission problems at ports.
1. Introduction
Although road vehicles currently represent about 70% of total greenhouse gas (GHG) emissions in the transport sector, other forms of transport—including aviation, maritime, and off-road vehicles—are also substantial emissions sources and are expected to see continued growth in the coming years. Specifically, the maritime sector is expected to rise gradually because of its slower improvement efficiency compared to other vehicles; its GHG share is expected to increase from 10% in 2018 to 20% in 2060 among the global transport-related GHG emissions [1].
In this regard, many countries and the international maritime organization (IMO) have been implementing environmental regulations or policies, especially in emission-control areas (ECAs), which are designated areas near ports where ships are required to further reduce emissions. For example, the sulfur limit is currently 0.1% within ECAs; it is 35 times stricter than the outside ECAs. These strict regulations are related to the fact that premature deaths have been increasing each year due to cardiopulmonary disease and lung cancer caused by pollutants emitted from ships at ports [2]. Shipping emissions in East Asia accounted for 16% of global shipping CO2 in 2013, compared to only 4%–7% in 2002–2005. This increase in emissions resulted in large adverse health impacts, with 14,500–37,500 premature deaths per year [3].
Therefore, ship owners have been making efforts to reduce harmful emissions using exhaust gas treatment systems such as sulfur dioxide (SOX) scrubbers, selective catalyst reactors (SCRs), or changing ship fuels from heavy fuel oil (HFO) to liquefied natural gas (LNG) or marine gas oil (MGO), etc. In addition, major ports have been expanding shore power facilities (or alternative maritime power (AMP)), which can supply electric power for ships from land-based electric power plants while staying at a port. Notably, low voltage AMP facilities have already been installed in many dominant ports worldwide. Additionally, high voltage (3.3kV, 6.6kV, 11kV, etc.) AMP facilities are being installed in major ports for large ships such as in the U.S., Canada, European countries, China, etc., and the European Union (EU) requires European ports to offer shore-based electricity to ships by 2025.
In this regard, hybrid systems using an energy storage system (ESS) have gained attention as an alternative solution to solve the environmental issues in the marine industry, and research regarding hybrid systems has already been performed. For example, Lan et al. [4] proposed a hybrid system combined with a photovoltaic (PV) generation system, a diesel generator, and batteries. Choi et al. [5] and Han et al. [6] each proposed a fuel cell–battery hybrid system for a boat. In addition, Ovrum et al. proposed a hybrid system with lithium-ion batteries (LIBs) and diesel generators for a bulk carrier [7].
However, there is not much research regarding the supercapacitor (SC) and LIB hybrid system yet, except for some research focused on small ships; Trieste et al. chose a SC as the power source for a ferry and proposed a charging strategy [8], and Bellache et al. investigated the LIB–SC hybrid system to improve the dynamic response of a boat [9]. On the contrary, many research studies have been conducted to develop the LIB–SC hybrid system for land vehicles, especially in [10,11,12,13,14]; these are SC–LIB hybrid systems for electric cars. These results show that the hybrid system could improve system performance by overcoming individual limitations (disadvantages) and enabling synergistic effects. In other words, LIBs, which are the most common battery types, have a high energy density; however, their power densities are low compared to that of an SC of the same size. Also, LIBs have a short life cycle compared to an SC, which has an approximately 1000× longer life cycle than LIBs (refer to Table 1).
This paper proposes an SC–LIB hybrid system for a ship focused on port operations, where most emissions are caused by onboard engine-generator sets (gensets). The rest of this paper is structured as follows: in Section 2, detailed explanations of a target ship and the proposed system are presented. In Section 3, the capacity (size) of the LIB and SC is determined with the given assumed operating conditions. And in Section 4, harmful exhaust emissions at a port are calculated and compared between the conventional system and proposed one based on simulation results. Additionally, an economic study for the entire lifetime of a ship is performed in that section. Lastly, the results are reviewed along with a conclusion. The novelty of this paper is a new approach toward the eco-friendly power system of a bulk carrier using two kinds of ESSs.
2. System Description
2.1. Target Ship
In this paper, a medium-sized bulk carrier was selected as the target ship. The target ship’s deadweight was about 50,000 tons, and it had five hatches. The target ship was fitted with three gensets as power sources and four electric-driven deck cranes (Figure 1). In addition to these deck cranes, windlass/mooring winches were also of the electric-driven type controlled by each motor drive. Although hydraulic-driven equipment has been used for a long time, it has many disadvantages including low efficiency, high noise and vibration, high maintenance cost, pollution risk through oil, etc. [21]. Therefore, the use of electric-driven equipment has been increasing in the marine industry.
In general, this kind of bulk carrier has four (4) operation modes, as below:
- Normal seagoing mode (at sea);
- Port in/out mode (near a port);
- Cargo loading/unloading mode (at a port);
- Harbor mode (at a port).
First, in the normal seagoing mode, the heaviest electric load is the main engine (M/E) auxiliaries and engine room auxiliaries to propel the ship, and additional electric power is required to maintain the living environment for crews at sea. In the port in/out mode, the heaviest load is the windlass/mooring winches, which are used for lowering/pulling an anchor or hauling-in/winding mooring ropes. The second heaviest load is the ballast pumps, which are used for pumping water into/out from ballast tanks in preparation for cargo loading/unloading or cargo hold cleaning. Additionally, the load on the main air compressors and M/E auxiliary blowers also increases because of the slower speed or frequent stops of a ship while approaching/departing a port.
In the cargo loading/unloading mode, the heaviest load is the onboard deck cranes used for cargo loading or unloading to the shore-side, which is a highly repetitive process. The second heaviest load is the ballast pumps, which ensures the stability of a ship even though its weight is changed during (un)loading cargo. Lastly, in the harbor mode, the majority of the load comes from the activities of crews such as from the air conditioner compressor, lighting, galley, and laundry equipment, etc.
2.2. Conventional System
The simple layout of a conventional power system is shown in Figure 2. Even though three gensets are installed as power sources, the number of gensets in operation is different depending on the power required for each operation mode. Primarily, only one genset is in operation in the normal seagoing mode with about 54.3% load factor (Table 2). The second generator is only used for the port in/out operations or the crane operations, and the last one is installed for redundancy.
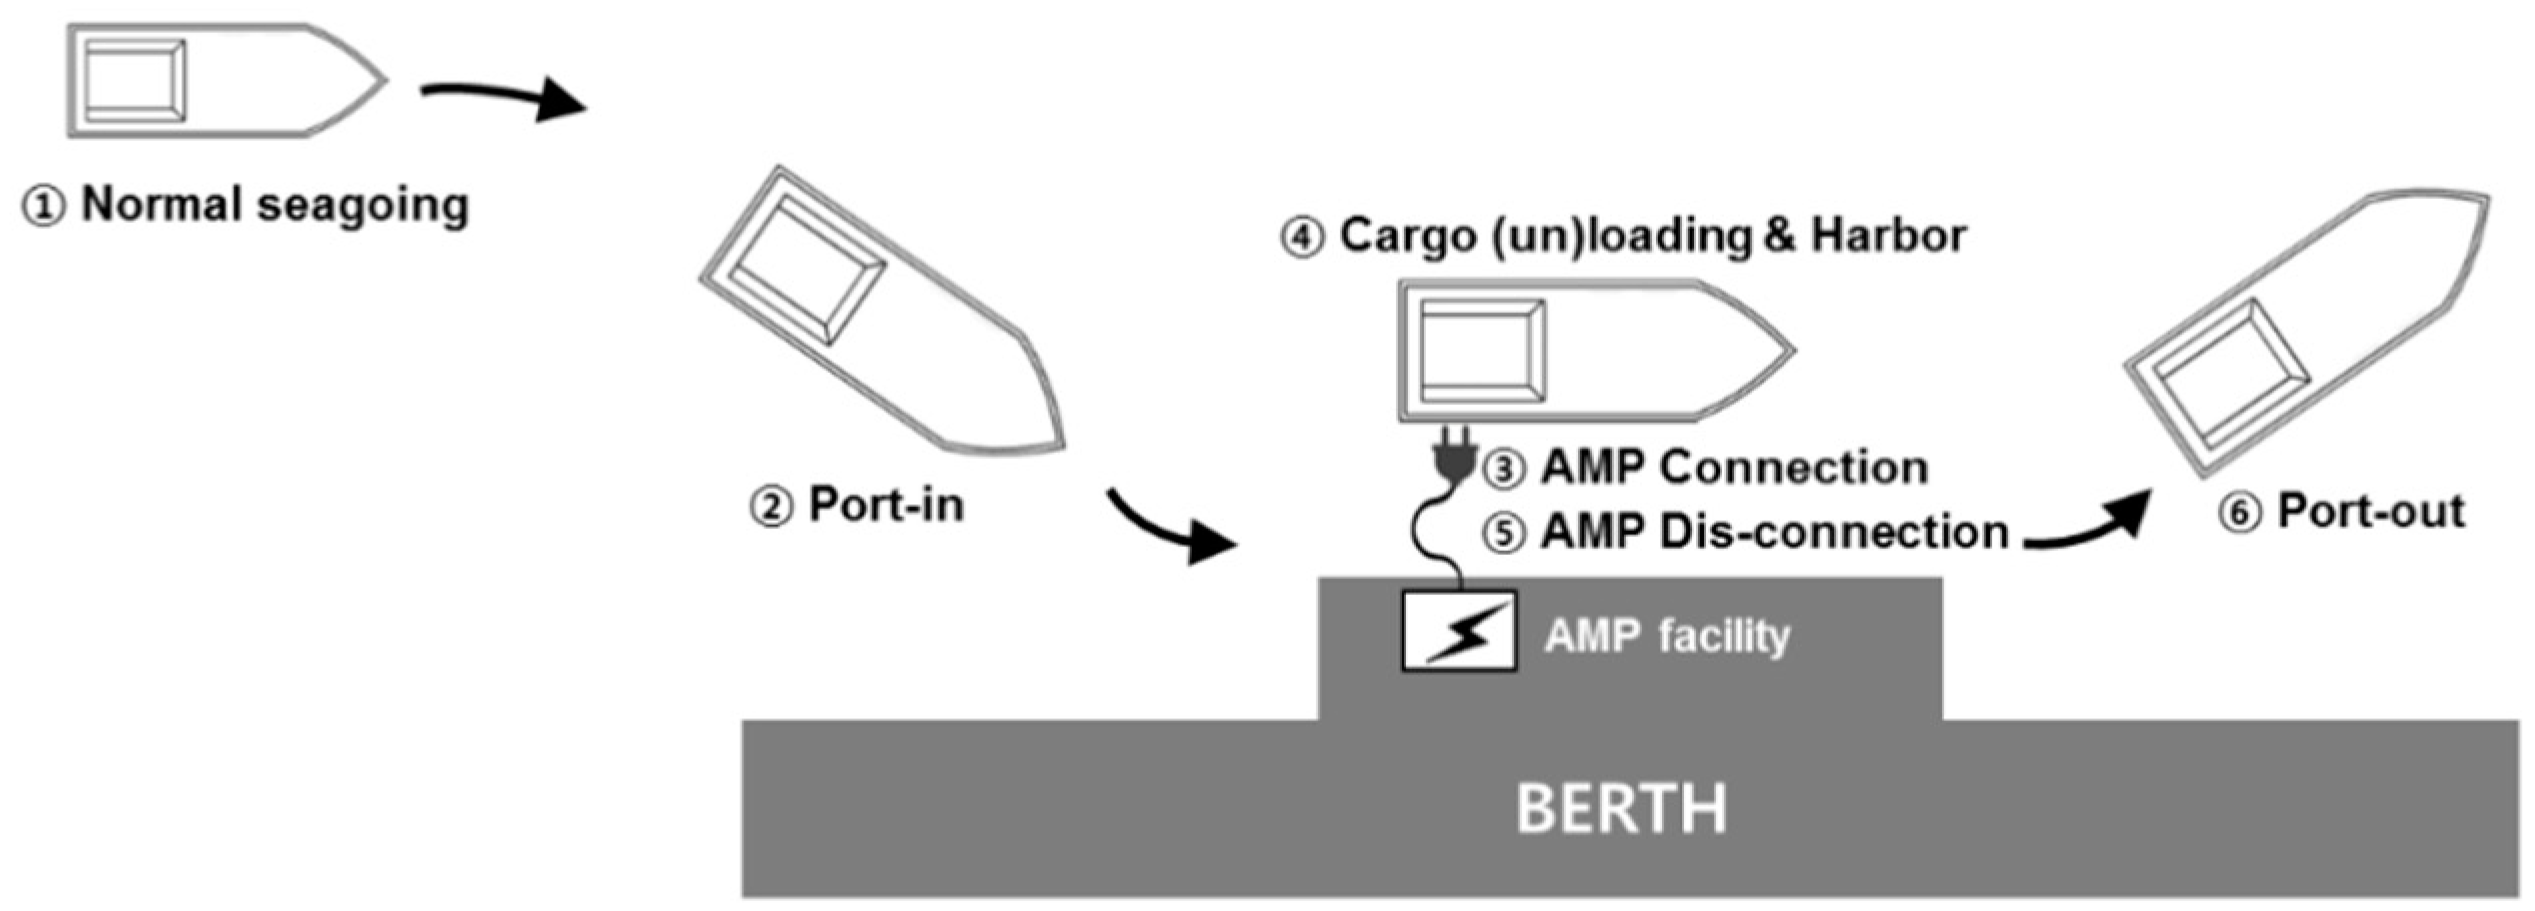
The steps for one voyage cycle in a conventional system are shown in Figure 3. Step 3 includes not only deck crane operation for cargo handling but also simply staying at a harbor. In this study, it was assumed that three (3) of four (4) deck cranes were in operation during cargo handling, because safety risks would be increased if all cranes were in operation simultaneously.
2.3. Proposed System
In the proposed system, one of the onboard gensets was replaced with two kinds of ESSs (LIB and SC). The LIB and SC were used as a power source during port operations. Also, one of the remaining gensets was downsized from 700 kW to 500 kW to obtain a higher fuel efficiency in the normal seagoing mode. The layout of the proposed power system is shown in Figure 4.
The reason for adopting two different ESSs was that each has different characteristics as an energy storage system. In the case of port in/out operations, high load demand occurred only twice (port-in and port-out). Thus, the LIB was more suitable because of its high energy density. On the other hand, the SC was more suitable for highly repetitive deck crane operations because of its long life cycle capacity and high power density. Therefore, the number of gensets in operation in each mode was changed, as shown in Table 2, and it was shown that load factors of the onboard gensets increased to above 70% even in the normal seagoing mode and port in/out mode. In the proposed system, two steps were added for one voyage cycle, as shown in Figure 5, because of the AMP connection/disconnection processes for shore power.
3. Proposed Hybrid Power System
The main purpose of the proposed system was to reduce harmful emissions at ports (especially in ECAs) rather than in the normal seagoing mode at sea. In the port in/out mode, in which additional power is required for a short time, the LIB was selected as an auxiliary power source that replaced a stand-by onboard genset. In the cargo loading/unloading mode, in which additional power is repeatedly required hundreds to thousands of times depending on cargo quantity, the SC and AMP were selected as the main power sources that replaced onboard gensets.
3.1. Port In/Out Mode
In this mode, the mooring and windlass winches were the heaviest loads unless bow thrusters were installed onboard. The combined windlass/mooring winch, which is used to handle both anchors and mooring ropes together, is typically installed towards the fore side of a ship, and mooring winches are installed towards the aft side. The specifications of the selected winches are described in Table 3.
The regenerated power rate when lowering an anchor was difficult to define due to various factors such as the inertia of the motor, angular speed, rotation speed, and mechanical loss, etc. [23]. Therefore, regenerated power rate was assumed to be about 50%, according to similar cases [7,24,25]. The power demands for one operation cycle were assumed, as shown in Table 4, based on empirical evidence from crews. In this study, the instantaneous peak braking and initial starting power were not taken into consideration for simulation simplification. Based on the battery manufacturer’s datasheet, the specifications of the selected LIB modules are shown in Table 5.
The minimum capacity of the LIB is calculated as shown below [27]:
where Cmin (Ah) is the minimum battery capacity, Ed (VAh) is the demanded energy, Vdc (V) is the nominal battery voltage, kDoD is the battery depth of discharge (DoD), ka is the battery aging factor, ke is the system efficiency, and other factors are not considered. In this case, ke was set to 0.9, ka was set to 1.2, and kDoD was set to 0.8, assuming that the operating range of the state of charge (SOC) was 10%–90%. The output voltage of the SC pack was determined to be DC 355 V, which was achieved by arranging four (4) battery modules in series. Moreover, two (2) parallel strings were required to meet the demanded energy capacity. Therefore, Cmin was calculated to be about 196.0 Ah, and the designed battery capacity (ELIB_design) was calculated to be about 76.5 kWh, incorporating a 10% safety margin (ks) as below. The specifications of the selected LIB pack are shown in Table 6. This LIB pack was split into two sets with the same capacities, and installed at different places for safety reasons.
Cmin = (Ed × ka) / (Vdc × kDoD × ke) (Ah),
ELIB_design = Cmin × Vdc × ks = 196.0 Ah × 355 V × 1.1 ≅ 76.5 (kWh) < 80 (kWh).
3.2. Cargo Loading/Unloading Mode
In this mode, the onboard deck cranes were the heaviest loads, and they needed repetitive peak power while unloading or loading cargo. These cranes were generally required to perform three functions, namely, to hoist/lower, to luff and to slew.
- Hoisting (lowering) is bringing up (down) a crane wire while a crane jib remains in a constant position.
- Luffing is the raising or lowering of a crane jib.
- Slewing is the swinging round (or rotation) of a crane.
Among these crane operations, the biggest load is the hoist motor, which raises and lowers cargo. When lowering the cargo, the motor drive must be capable of handling the inverse power by feeding it back to the onboard main power grid. The specifications of the selected deck crane are shown in Table 7.
The power demand for hoisting or luffing is dependent on the weight required to carry the cargo by a crane, as shown in the below equation. The crane jip weight (mj) is only applied to the luffing operation [28,29]:
where, mh (t) is the hoisting weight, mload (t) is the cargo load weight, mg (t) is the grab weight, vh (m/min) is the hoisting speed, and η is the mechanical efficiency. In this study, mload was set to the maximum load of 30 t, mg was assumed to be 5 t, mj was 10 t, and η was 0.85. The power demand for slewing was also dependent on the weight required to turn the load by a crane, as shown below:
where, ms (t) is the slewing weight, mst (t) is the weight of the slewing structure, Rs is the resistance to slewing, vs (m/min) is the slewing speed, and η is the mechanical efficiency. In this study, it was assumed that mst was 10 t, η was 0.85 and Rs was 0.2. The regenerative power rate was assumed to be 50% according to similar cases [7,24,25] as mentioned in Section 3.1. There are ten (10) steps for a deck crane operation, and the expected power demands for one cycle are assumed, as shown in Table 8, based on the empirical evidence from crews. Then, the minimum energy of the SC pack (Esc_min) was obtained through the demand energy (Esc_demand), aging factor (ka), safety factor (ks), and the system efficiency of (ke). If ka was assumed to be 1.2, ks was assumed to be 1.1, and ke was assumed to be 0.9, The Esc_min is calculated as below:
Phoist = (mh × vh) / (6.12 × η) = ((mload + mg + (mj)) ×vh) / (6.12 × η) (kW),
Pslew = (ms × vh) / (6.12 × η) = ((mload + mst) × RS × vs) / (6.12 × η) (kW),
Esc_min = Esc_demand × (ka/ke) × ks = 1,005.92 (Wh) × (1.2/0.9) × 1.1 ≅ 1.48 (kWh) ≅ 5,311 (kJ).
In most applications, the SC pack is assembled in modules, and these are connected in series and parallel to increase both the working voltage and overall capacitance. The total capacitance of the SC pack (CSC,t) is then evaluated as:
where P is the number of parallel strings and S is the number of series modules. The selected SC module specifications are as shown in Table 9. Then, the SC pack capacity was calculated using Equation (7).
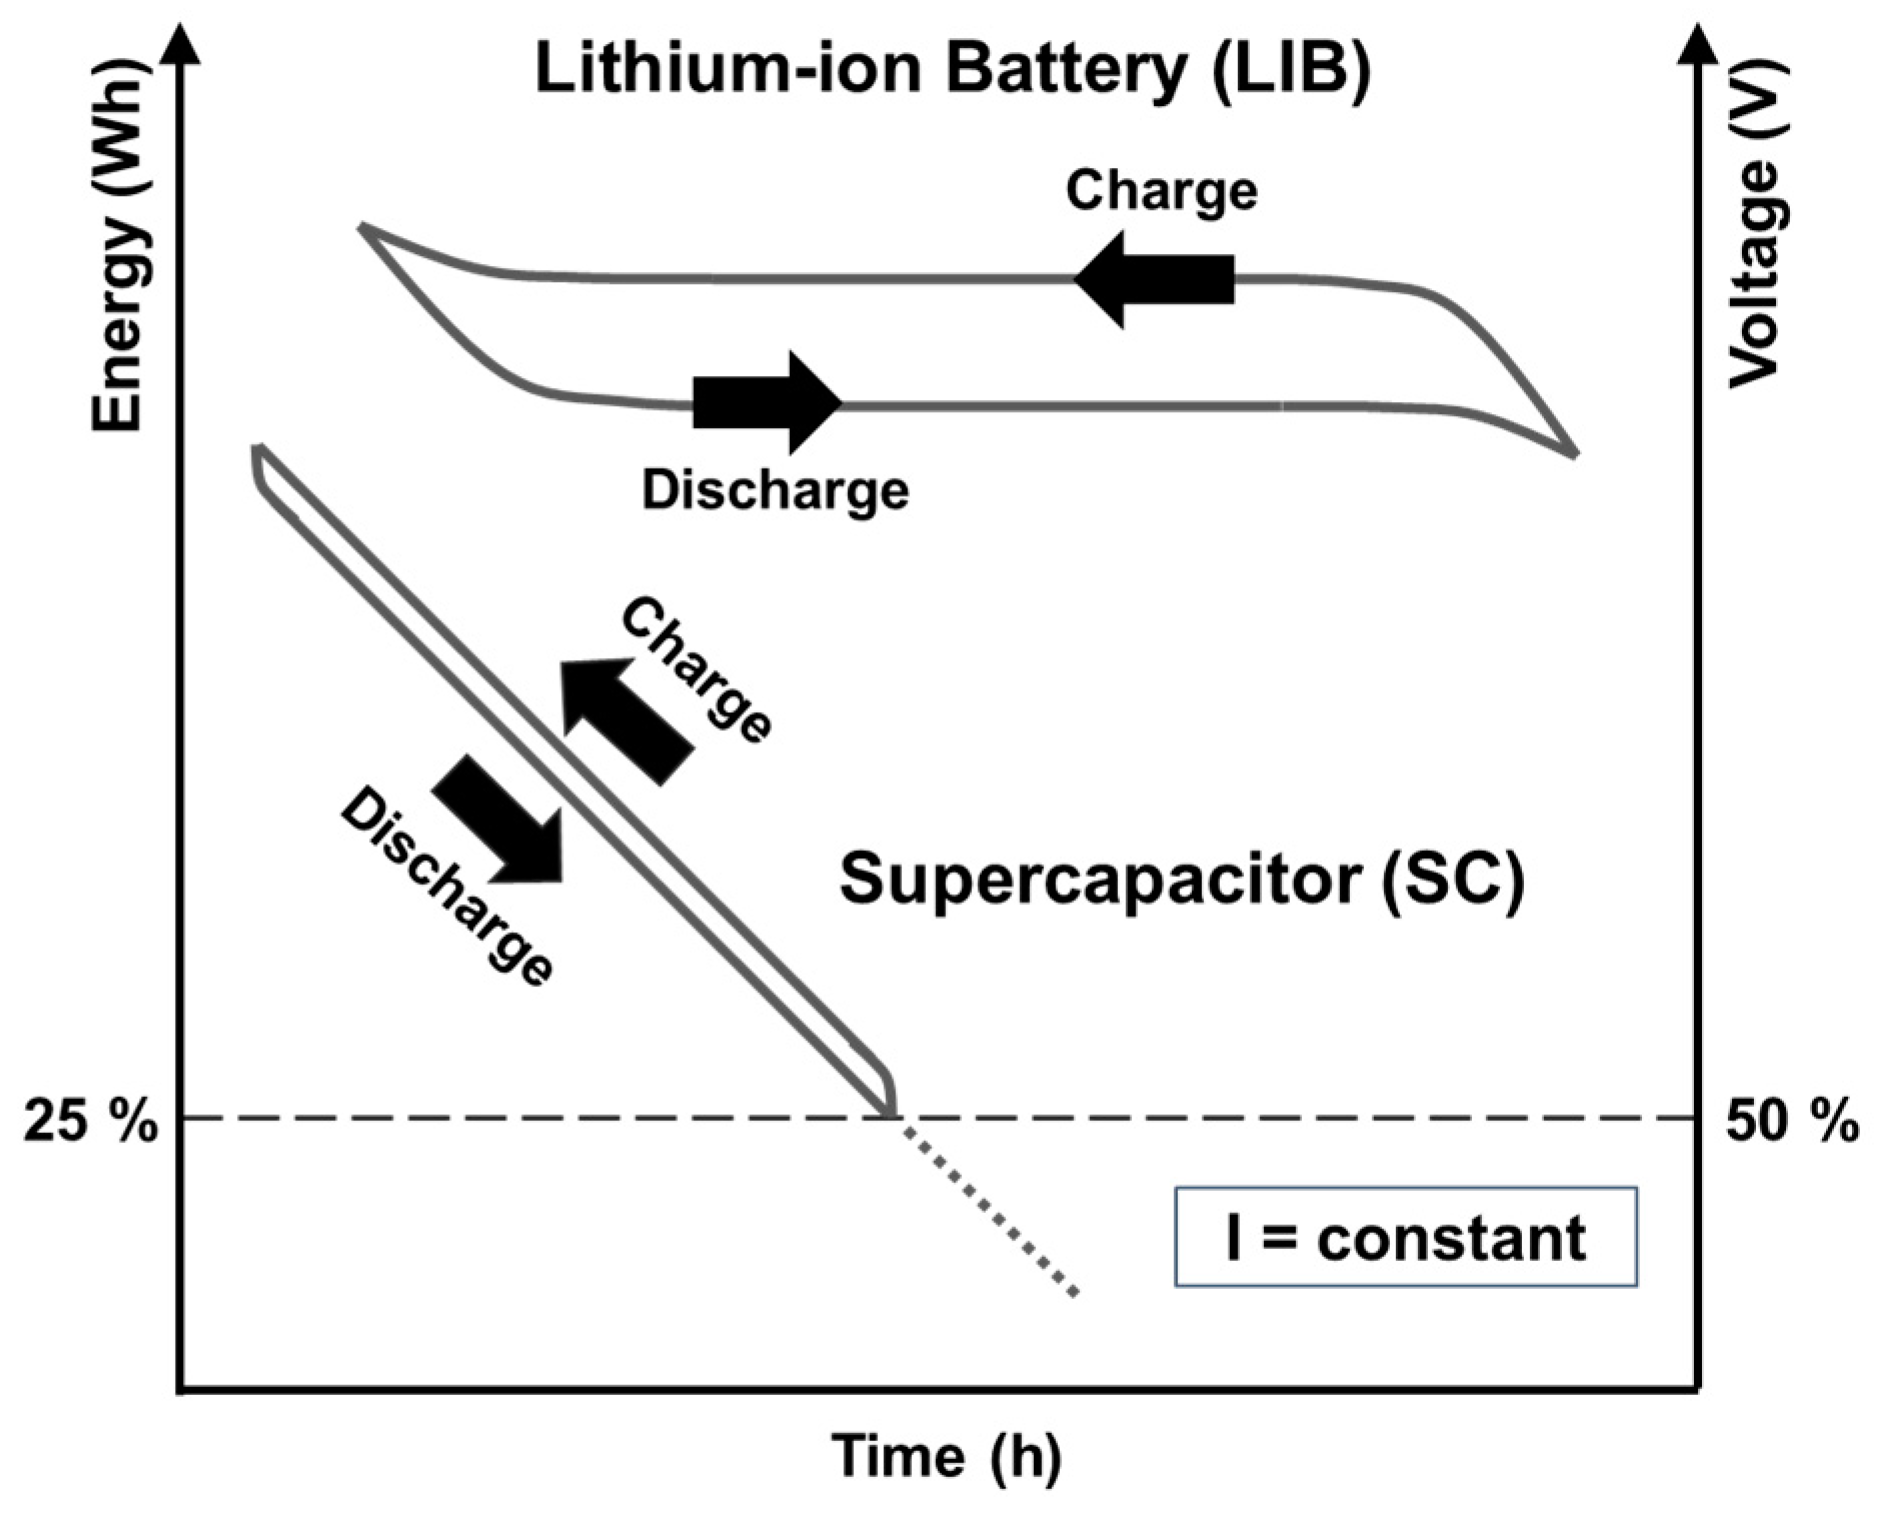
where VSC,t is the voltage of an SC pack, which is proportional to the number of SC modules. In general, the voltage variation of an SC pack is to be kept between 100% and 50% of its maximum voltage. As shown in Figure 6, the LIB offers a fairly constant discharge voltage performance throughout the spectrum of usable energy, whereas the SC voltage shows a linear and decreasing behavior from the maximum value up to 50% in general. Even if the stored energy is proportional to the product of the capacitance for the square of the voltage, the delivered power decreased in the discharging phase because the current is limited [31,32]. Thus, the available energy of the designed SC pack (ESC_design) is calculated by the following equation [31,33]:
where VSC,t,max is the maximum terminal voltage, and VSC,t,min is the minimum terminal voltage of the SC pack. If the output voltage of the SC pack was determined to be DC 625 V, which was achieved by arranging five (5) SC modules in series, then, the SC pack needed have three (3) parallel strings to obtain the demand capacity according to the below equation:
CSC,t = CSC,module × (P/S) (F),
ESC = (1/2) × CSC,t × VSC,t2 (J),
ESC_design = (1/2) × CSC,t × (VSC,t,max2 − VSC,t,min2) = (1/2) × CSC,t × (VSC,t,max2 − ((1/2)×VSC,t,max))2) = (3/8) × CSC,t × VSC,t,max2 (J),
Esc_design = (3/8) × (CSC,module×(P/S)) × VSC,t,max2 = (3/8) × (63 (F) × (3/5)) × (625 (V))2 ≅ 5,537 (kJ) ≅ 1.54 (kWh) > 1.48 (kWh).
The design specifications of the SC pack are as shown in Table 10. If the SC pack was discharged, it could be charged with a C-rate of 180 within about 20.1 seconds during the luffing (10) and lowering (1) steps.
4. Results and Discussion
4.1. Simulation Results
A simulation was conducted using MATLAB/Simulink (MathWorks, Natick, MA, USA) which is a graphics-based simulation environment to validate whether the determined capacities of the LIB and SC packs were suitable for each required power demand. Figure 7a shows the LIB pack with two parallel strings of four modules each, as indicated in Table 6. Figure 7b presents the SC pack with three parallel strings of five modules each, as specified in Table 10. Each LIB and SC pack was charged or discharged according to each required power demand, shown in Table 4 and Table 8. The LIB and SC modules used in the simulation were the generic models provided in Simulink. The applied parameters were obtained from the data in Table 5 and Table 9, which were based on the manufacturer’s specifications [26,30], and the other parameters were assigned predetermined default values in the model (Table 11).
The change in the voltage and SOC of the designed LIB pack according to the power demand is shown in Figure 8. The lowest SOC of the LIB pack was 49.3% after port-in, and 40.1% after port-out, so the capacity of the designed LIB pack was sufficient for windlass/mooring winch operation. In other words, its SOC was within the limited operating range (10%–90%). The change in the voltage and SOC of the designed SC pack during cargo handling is shown in Figure 9. The lowest SOC of each SC pack was 67.7% after the first operation cycle, so the designed SC pack capacity was sufficient for deck crane operation. In other words, its SOC was within the limited operating rage (50%–100%), and it could be recharged by shore power for a short time during steps 1 and 10, as mentioned in Section 3.2.
4.2. Fuel Consumption and CO2 Emissions
The fuel consumption of a genset varies depending on the load factor, as shown in Figure 10, and the lowest fuel consumption is between 70%–85%. In this study, this graph was used to calculate the fuel consumption of the gensets. The emissions from fuels can be calculated by multiplying the fuel consumption of the onboard engine with the emission factor (Ef). This Ef varies according to the engine type (main and auxiliary engines, auxiliary boilers), engine rating, engine speed, type of fuel, etc. [34].
Total emissions (kg) = Fuel consumption × Ef.
For CO2 emissions, the Ef for each fuel type was based on IMO guidelines [36]. The Ef of HFO was 3.114 based on its lower calorific value of 40,200 kJ/kg and carbon content of 0.8493. The Ef of MGO was 3.206 based on its low calorific value of 42,700 kJ/kg and carbon content of 0.8744. And, the Ef of SOX emissions was calculated by multiplying 0.02 with the sulfur content S (%) present in the fuel. In the case of MGO, S (%) did not exceed 0.1 %, whereas the average value of HFO was 2.7%. The Ef used for NOX emissions was the suggested value for Tier I ships without the use of a scrubber system. These emission factors are summarized in Table 12 [37]. Based on the emission factors, the emissions from onboard gensets for the conventional power system were calculated as shown in Table 13, and those for the proposed power system were calculated as shown in Table 14.
Even though the ESS did not generate harmful emissions directly at a port, the emissions were generated indirectly, because it had to be recharged using the AMP; shore power was originally transferred from land-based power plants. Thus, the generated emissions from the used shore power were calculated as shown in Table 15. In this study, emission factors that generated 1 kWh of electricity were assumed to be 151 g∙CO2/kWh, 0.03 g∙SOX/kWh, and 0.16 g∙NOX/kWh based on a European electricity company [40]. This value changed depending on the country. For example, in Denmark where the dominant electricity power source is from wind power plants (about 44%, 2016) [41], the total CO2 emission factor is 75 g/kWh, whereas the world average is 507 g/kWh [42].
Overall, the proposed system could reduce CO2, SOX, and NOX emissions, especially in the cargo handling and harbor modes at a port (Figure 11c,d). There was about a 77% reduction for CO2, about a 93% reduction for SOX, and a 99% reduction for NOX. On the contrary, the emission reduction rates for the normal seagoing mode (Figure 11a) and the port in/out mode (Figure 11b) were not high (under 10%).
In addition, the emission reduction rate varied depending on the ship’s schedule. As shown in Table 16, when the cargo handling time was 60 h, the emission reduction rate was approximately 28% for CO2, 4% for SOx, and 35% for NOx, but this increased to 45%, 6%, and 56% each for 180 h of long cargo handling operations. And, as shown in Table 17, when the sailing time was 20 d, the emission reduction rate was approximately 26% for CO2, 4% for SOx, and 32% for NOx, but this increased to 50%, 8%, and 64% each for 5 d of short sailing time. Therefore, the proposed system is more eco-friendly if a ship has a long cargo handling time or visits many ports with a short-term sailing time.
4.3. Economic Study
An economic study was conducted to compare the conventional power system and proposed one. Some assumptions were made for the study (below) since it was difficult to obtain exact data from the industry, and the data were changeable depending on the cases.
- Only the main equipment was considered;
- The bulk carrier visited 20 ports per year;
- The lifespan of the ship was 25 years.
First, the initial capital expenditure (CAPEX) is the sum of the equipment cost for the system. The cost data for the main equipment were obtained from several references [43,44,45,46,47]. The cost of the LIB was assumed to be 600 /kWh USD, and it was changeable according to the C-rate capacity, cell type, and cooling method, etc. The CAPEX results for the conventional and proposed systems are shown in Table 18. Secondly, the operational expenditure (OPEX) is the sum of each fixed operation & maintenance (O&M) cost, fuel cost for genset(s), and the electricity cost; only the electricity cost for the AMP was considered for the proposed system (Table 19).
The fixed O&M cost data of each main equipment were obtained from several references [48,49,50]. In this study, the variable O&M costs, which included cooling water or consumable materials used in maintenance, were assumed negligible because they comprised a relatively small portion in general power systems [51,52,53]. It was also assumed that it was necessary to switch the onboard fuel from HFO to MGO in port areas to meet environmental regulations for the conventional power system. The total savings during N years is the sum of the yearly savings (Syear), taking into account the interest rate (i) for the capital, as below [54]:
In this study, i was set to 5%, and the annual inflation rates for the fixed O&M cost (a), fuel oil cost (b), and electricity cost (c) were set to 2% each. The replacement of the LIB and SC packs was considered with a replacement cost rate of 80% [55] of the initial cost. And the lifespan was assumed to be about 10 years for the LIB [56] and 15 years for the SC [17].
Thus, the payback period was obtained by solving for n when the initial investment cost was equal to the sum of the yearly savings. Payback occurred at around 5.8 years where the curve passed through the zero of the y-axis in the case of the below assumptions:
- The electricity cost for the AMP was 9.2 cents/kWh;
- The HFO cost was 400/t USD, and the MGO cost was 630/t USD.
- The LIB cost was 600/kWh USD, and the SC cost was 10,000/kWh USD.
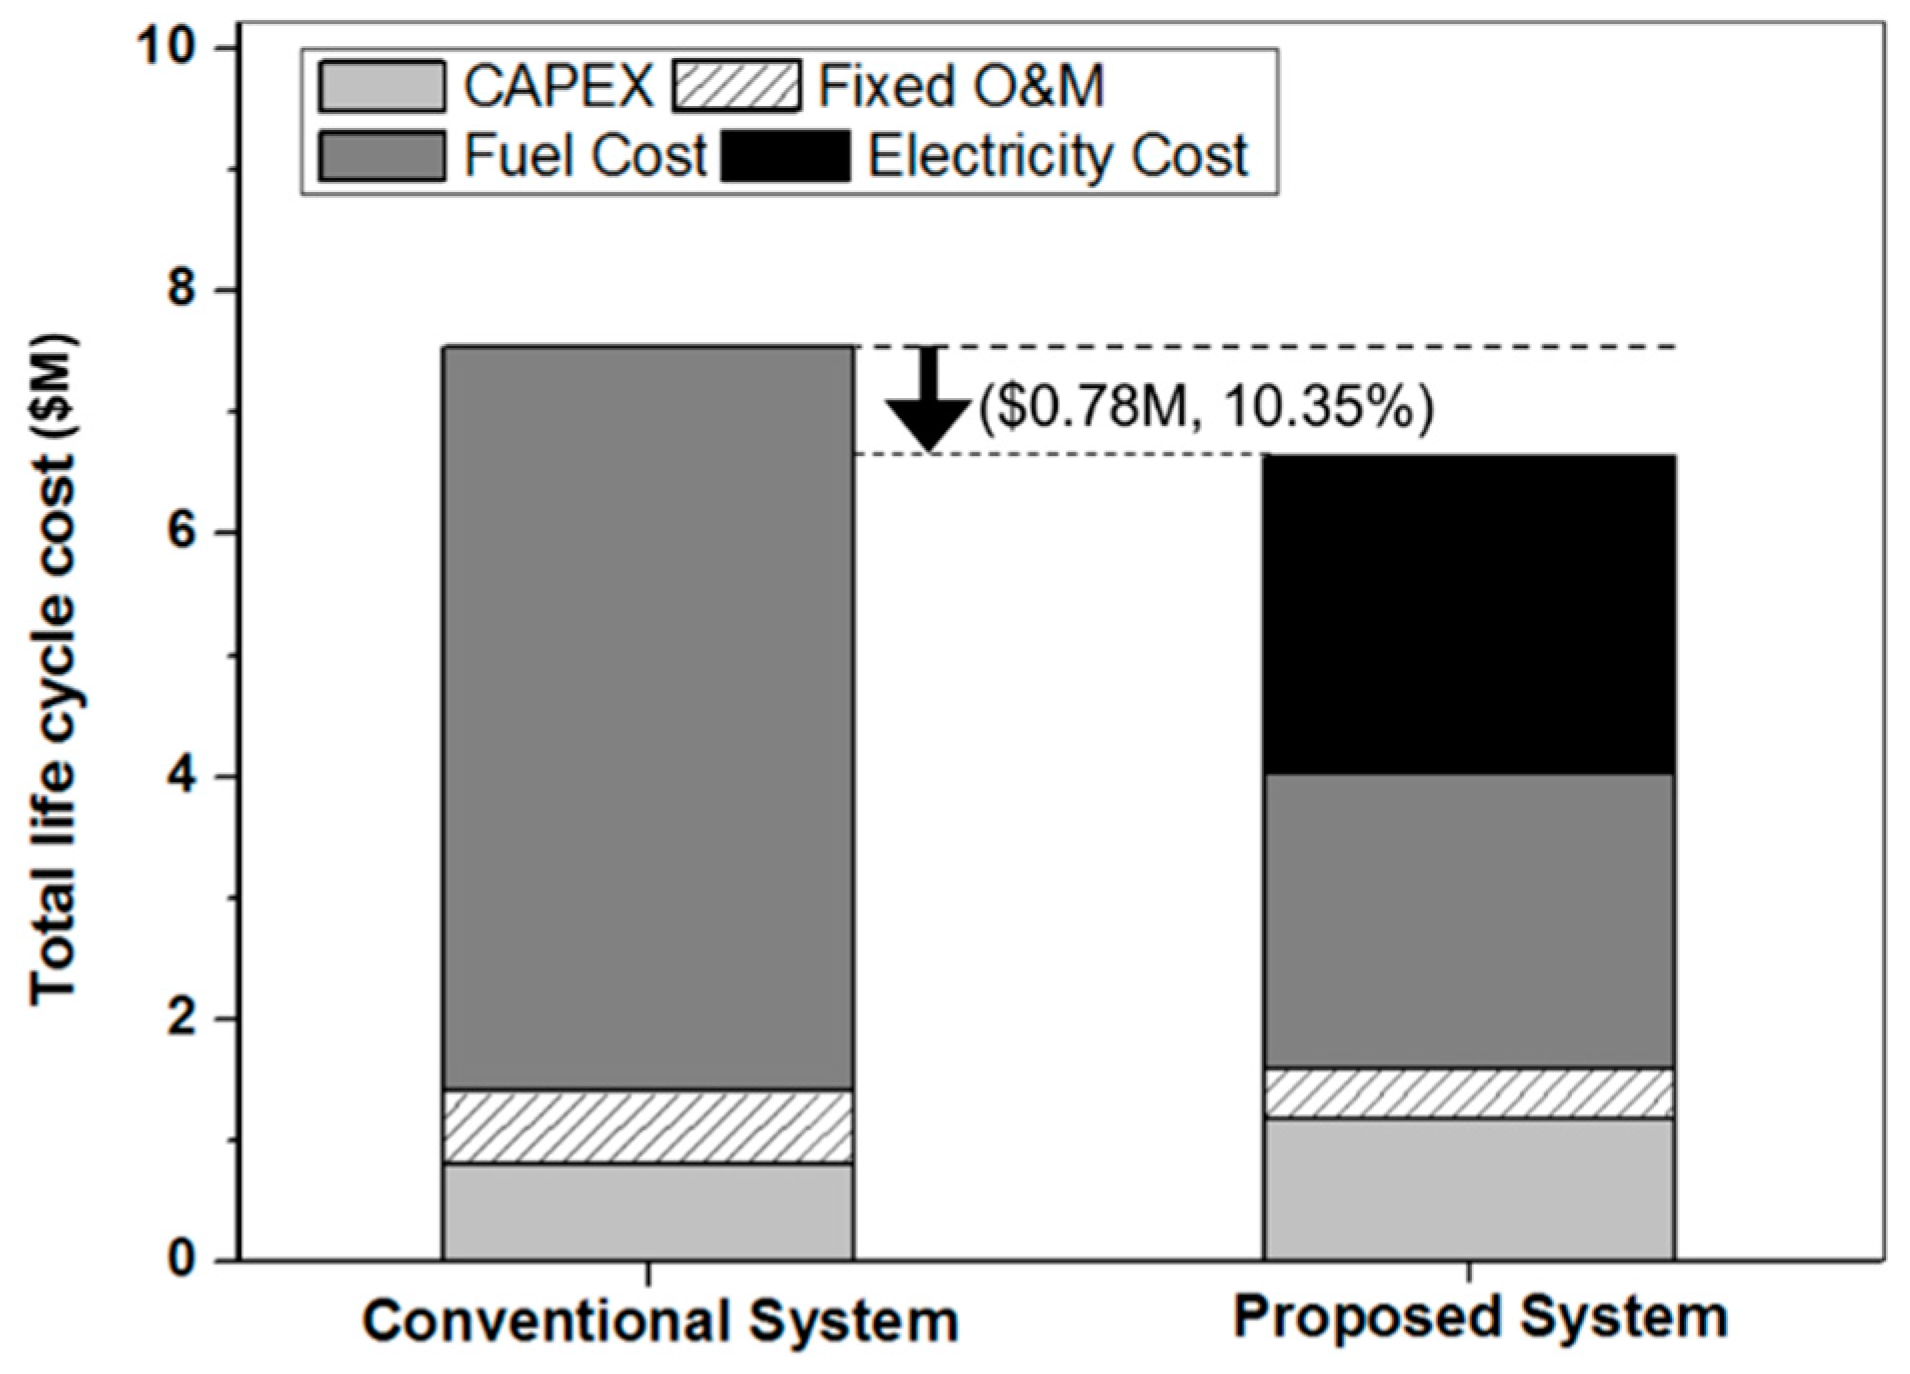
However, the payback period increased to around 10 years or deceased to around 4 years according to the electricity and fuel costs, as shown in Figure 12a,b; these were more critical variables compared to the LIB or SC cost during the lifetime of a ship, as shown in Figure 12c,d. For a 25-year lifespan of a ship, the total savings would be about 0.78 million USD, and the difference was greatly dependent on the fuel and electricity cost, as shown in Figure 13. Even though electricity cost was additionally included for the proposed system, it could be economically beneficial because of the fuel savings (up to 60.2%) compared with the conventional one.
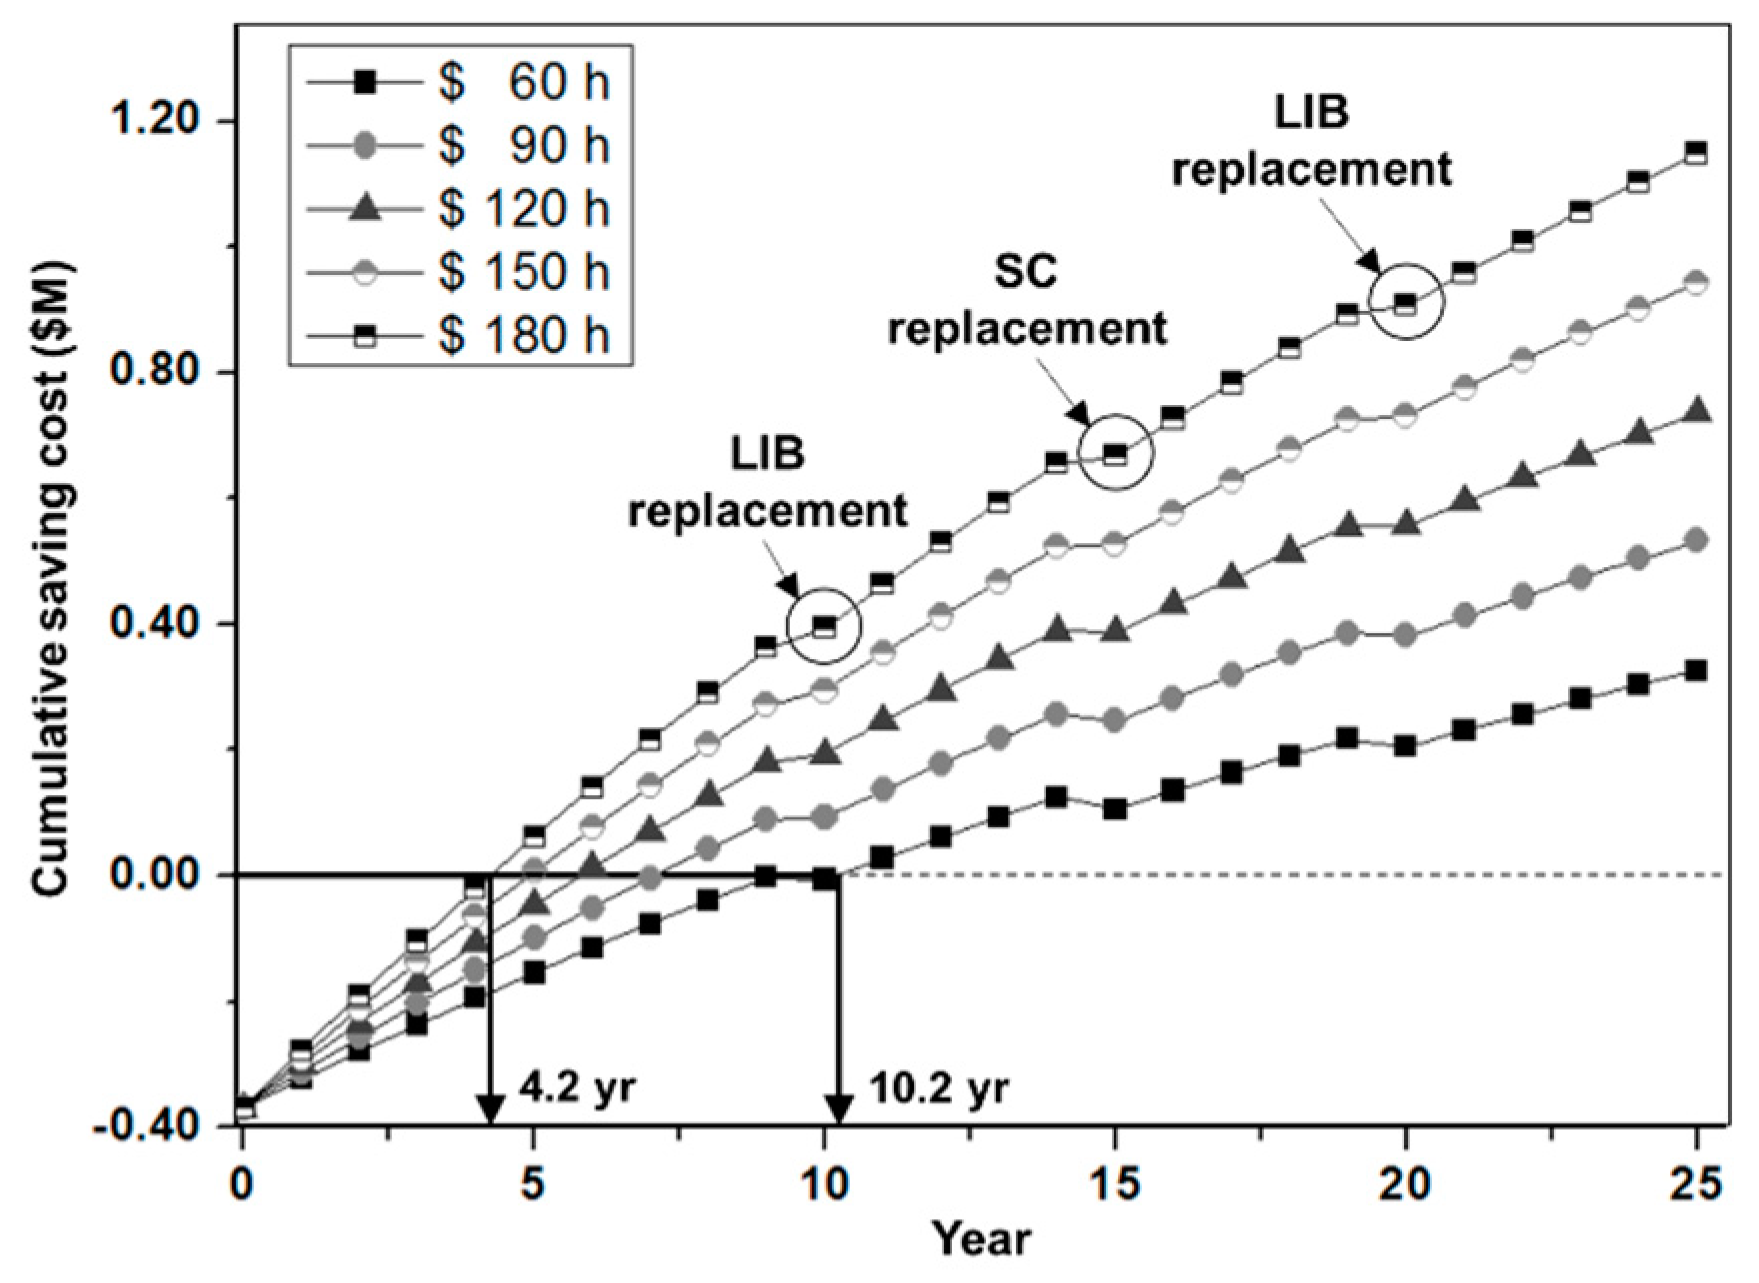
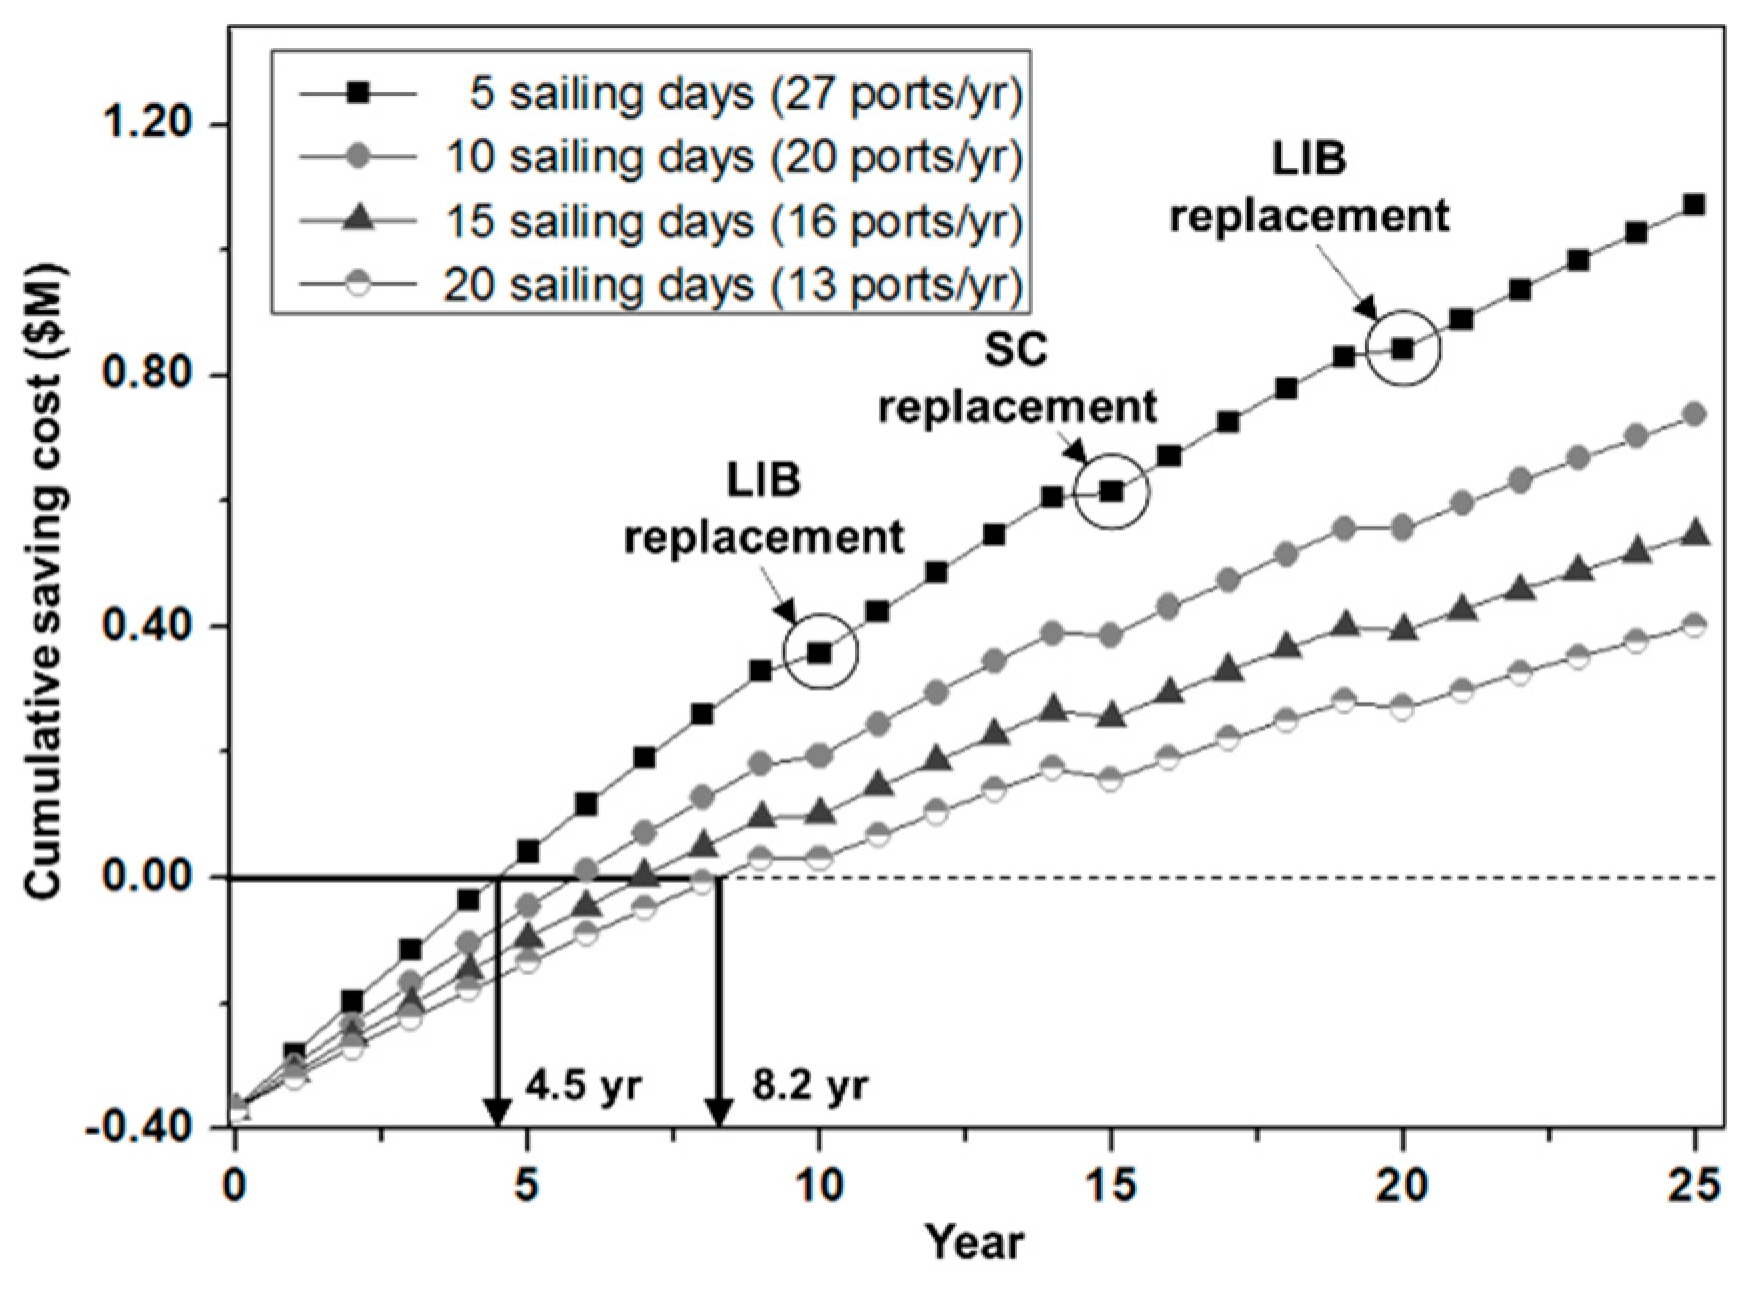
In addition, the payback period varied depending on the ship’s schedule. As shown in Figure 14, when the cargo handling time was 60 h, payback occurred at around 10.2 years, but this decreased to 4.2 years for 180 h of long cargo handling operations. And, as shown in Figure 15, when the sailing time was 20 d, payback occurred at around 8.2 years, but this decreased to 4.5 years for 5 d in a short sailing time. Therefore, the proposed system is more economical if a ship has a long cargo handling time or visits many ports with a short-term sailing time.
5. Conclusions
This paper presents a new alternative solution to reduce harmful emissions at ports, which are mostly generated from onboard gensets. The hybrid power system with two different ESS types is proposed for port operations based on a bulk carrier with deck cranes. In the target ship, the LIB is optimal for the port in/out mode, and the SC is optimal for highly repetitive deck crane operations. To verify the proposed system, the optimal sizes for the LIB and SC are determined according to the load demands, and each capacity is verified using simulations. The emission reductions are then compared with those of the conventional power system. Lastly, an economic study is performed based on the expected CAPEX and OPEX of each system.
The results show that the emission problems in port areas can be solved using this onboard hybrid power system with an AMP facility. And these environmental benefits would be increased if shore power is only generated by clean power sources such as solar power, wind power, fuel cells, etc. Moreover, the economic study shows that this proposed system will be beneficial in terms of the total lifespan of a ship. Particularly, this proposed system can be more advantageous for ships that have a long cargo handling time or visit many ports with a short-term sailing time. However, benefits are highly variable depending on the fuel oil cost for gensets and the electricity cost for the AMP. Even though this paper focused on one type of ship, the two types of ESSs (LIB and SC) could also be applied to other ship types. Therefore, this new approach to for eco-friendly ship could be helpful for many ship owners who are faced with urgent environmental regulation problems.
Author Contributions
K.K. wrote the manuscript, conceptualized, and analyzed; J.A. analyzed; K.P. and G.R. validated results; and K.C. supervised.
Funding
This material is based upon work supported by the Ministry of Trade, Industry & Energy (MOTIE, Korea) under Industrial Core Technology Development Program. No. 10077637, ‘Development of a 20MW shipboard DC optimal power system’.
Conflicts of Interest
The authors declare no conflict of interest.
References
- Hall, D.; Pavlenko, N.; Lutsey, N. Beyond Road Vehicles: Survey of Zero-Emission Technology Options across the Transport Sector; ICCT (International Council on Clean Transportation): Washington, DC, USA, 18 July 2018. [Google Scholar]
- A Study on Demand Estimation and Implementation for AMP (Alternative Maritime Power) Installation; KMI (Korea Maritime Institute): Busan, Korea, 2017; pp. 10–13.
- Liu, H.; Fu, M.; Jin, X.; Shang, Y.; Shindell, D.; Faluvegi, G.; Shindell, C.; He, K. Health and Climate Impacts of Ocean-Going Vessels in East Asia. Nat. Clim. Chang. 2016, 6, 1037–1041. [Google Scholar] [CrossRef]
- Lan, H.; Wen, S.; Hong, Y.-Y.; Yu, D.C.; Zhang, L. Optimal Sizing of Hybrid PV/Diesel/Battery in Ship Power System. Appl. Energy 2015, 158, 26–34. [Google Scholar] [CrossRef]
- Choi, C.H.; Yu, S.; Han, I.S.; Kho, B.K.; Kang, D.G.; Lee, H.Y.; Seo, M.S.; Kong, J.W.; Kim, G.; Ahn, J.W.; et al. Development and Demonstration of PEM Fuel-Cell-Battery Hybrid System for Propulsion of Tourist Boat. Int. J. Hydrogen Energy 2016, 41, 3591–3599. [Google Scholar] [CrossRef]
- Han, J.; Charpentier, J.-F.; Tang, T. An Energy Management System of a Fuel Cell/Battery Hybrid Boat. Energies 2014, 7, 2799–2820. [Google Scholar] [CrossRef] [Green Version]
- Ovrum, E.; Bergh, T.F. Modelling Lithium-Ion Battery Hybrid Ship Crane Operation. Appl. Energy 2015, 152, 162–172. [Google Scholar] [CrossRef]
- Trieste, S.; Hmam, S.; Olivier, J.-C.; Bourguet, S.; Loron, L. Techno-Economic Optimization of a Supercapacitor-Based Energy Storage Unit Chain: Application on the First Quick Charge Plug-in Ferry. Appl. Energy 2015, 153, 3–14. [Google Scholar] [CrossRef]
- Bellache, K.; Camara, M.B.; Dakyo, B. Transient Power Control for Diesel-Generator Assistance in Electric Boat Applications Using Supercapacitors and Batteries. IEEE J. Emerg. Sel. Top. Power Electron. 2018, 6, 416–428. [Google Scholar] [CrossRef]
- Camara, M.B.; Gualous, H.; Gustin, F.; Berthon, A. Design and New Control of DC/DC Converters to Share Energy Between Supercapacitors and Batteries in Hybrid Vehicles. IEEE Trans. Veh. Technol. 2008, 57, 2721–2735. [Google Scholar] [CrossRef]
- Thounthong, P.; Raël, S.; Davat, B. Control Strategy of Fuel Cell/Supercapacitors Hybrid Power Sources for Electric Vehicle. J. Power Sources 2006, 158, 806–814. [Google Scholar] [CrossRef]
- Kouchachvili, L.; Yaïci, W.; Entchev, E. Hybrid Battery/Supercapacitor Energy Storage System for the Electric Vehicles. J. Power Sources 2018, 374, 237–248. [Google Scholar] [CrossRef]
- Sadoun, R.; Rizoug, N.; Bartholumeus, P.; Barbedette, B.; LeMoigne, P. Sizing of Hybrid Supply (Battery-Supercapacitor) for Electric Vehicle Taking into Account the Weight of the Additional Buck-Boost Chopper. In Proceedings of the 2012 First International Conference on Renewable Energies and Vehicular Technology, Hammamet, Tunisia, 26–28 March 2012. [Google Scholar] [CrossRef]
- Mih, B.; Svasta, P. Hybrid supercapacitor-battery electric system with low electromagnetic emissions for automotive applications. UPB Sci. Bull. 2013, 75, 277–290. [Google Scholar]
- Carbon-IonTM: A New, Safer & Faster Charging Category of Rechargeable Energy Storage Devises; White Paper; ZapGo: Oxford, UK, 2017.
- Santoso, S. Standard Handbook for Electrical Engineers, Seventeenth Edition, 17th ed.; McGraw-Hill Education: New York, NY, USA, 2017. [Google Scholar]
- Gidwani, M.; Bhagwani, A.; Rohra, N. Supercapacitors: The near Future of Batteries. Int. J. Eng. Inven. 2014, 4, 22–27. [Google Scholar]
- Lin, Y.-L.; Kyung, C.-M.; Yasuura, H.; Liu, Y. (Eds.) Smart Sensors and Systems; Springer International Publishing: Cham, Switzerland, 2015. [Google Scholar] [CrossRef]
- Zakeri, B.; Syri, S. Electrical Energy Storage Systems A Comparative Life Cycle Cost Analysis. Renew. Sustain. Energy Rev. 2015, 42, 569–596. [Google Scholar]
- Rodriguez-Martinez, L.M.; Omar, N. (Eds.) Emerging Nanotechnologies in Rechargeable Energy Storage Systems; Elsevier: Amsterdam, The Netherlands, 2017. [Google Scholar]
- Lamas Pardo, M.; Carral Couce, L.; Castro-Santos, L.; Carral Couce, J.C. A review of the drive options for offshore anchor handling winches. Brodogradnja 2017, 68, 119–134. [Google Scholar] [CrossRef]
- Isbester, C.J. Bulk Carrier Practice Polymath; ExC FNI; The Nautical Institute: London, UK, 1993; p. 206. [Google Scholar]
- ABB Drives—Technical Guide No. 8, Electrical Braking; ABB: Zurich, Switzerland, 2011; p. 13.
- STARVERT IRU. Technical Report; LS Industrial Systems Co., Ltd., LS Industrial Systems: Anyang, Korea, 2009; p. 2.
- Proposal Paper—High Performance Bi-Directional Inverters; Hyundai Motor Industry: Seoul, Korea, 2014.
- System Specifications for the PBES Power & Energy Systems (Module: Energy 100). PBES (Plan B Energy Storage), 30 May 2017.
- IEEE. Standard 485: IEEE Recommended Practice for Sizing Lead-Acid Batteries for Stationary Applications; IEEE: Piscataway, NJ, USA, 2010. [Google Scholar]
- Agrawal, K.C. Industrial Power Engineering Handbook; Elsevier: Amsterdam, The Netherlands, 2001. [Google Scholar]
- Yaskawa Electric Corporation. Permanent-Magnet Synchronous Motor SS7-Series Eco PM Motor; Yaskawa Electric Corporation: Fukuoka, Japan, 2016; p. 23. [Google Scholar]
- Maxwell Technologies. 125V Heavy Transportation Module (BMOD0063 P125 B08). Available online: http://www.maxwell.com/products/ultracapacitors/downloads Technical Datasheet (accessed on 8 September 2018).
- Ciccarelli, F. Energy Management and Control Strategies for the Use of Supercapacitors Storage Technologies in Urban Railway Traction Systems. Ph.D. Thesis, University of Naples, Napoli, Italy, 2014. [Google Scholar]
- Reveles-Miranda, M.; Flota-Bañuelos, M.; Chan-Puc, F.; Pacheco-Catalán, D. Experimental Evaluation of a Switching Matrix Applied in a Bank of Supercapacitors. Energies 2017, 10, 2077. [Google Scholar] [CrossRef]
- Barrero, R.; Tackoen, X. New Technologies (Supercapacitors) for Energy—Storage and Energy Recuperation for a Higher Energy Efficiency of the Brussels Public Transportation Company Vehicles; Prospective Research for Brussels (Intermediate Report); Université Libre de V (ULB): Bruxelles, Belgium, 2008; p. 48. [Google Scholar]
- de Germán, M.R.; Carlos, M.G.J.; Enrique, M.A.; Sergi, S.M. Evaluation Air Emission Inventories and Indicators Form Ferry Vessels at Ports. In Proceedings of the 12th International Conference on Marine Navigation and Safety of Sea Transportation (TransNav 2017), Gdynia, Poland, 21–23 June 2017. [Google Scholar]
- MAN Diesel & Turbo. Marine GenSets from MAN Diesel & Turbo; MAN Diesel & Turbo: Gothenburg, Sweden, 2014. [Google Scholar]
- MEPC.1/Circ.866 Annex: 2014 Guidelines on the Method of the Attained Energy Efficiency Design Index (EEDI) for New Ships; IMO: London, UK, 30 January 2017.
- Zis, T.; Angeloudis, P.; Bell, M.G.H.; Psaraftis, H.N. Payback Period for Emissions Abatement Alternatives: Role of Regulation and Fuel Prices. Transp. Res. Rec. J. Transp. Res. Board 2016, 2549, 37–44. [Google Scholar] [CrossRef] [Green Version]
- Commercial Marine Vessels Review; EPA (United States Environmental Protection Agency): Washington, DC, USA, 2015.
- Mrs, M. Safety Investigation into a Stevedore Fatality on Board the Maltese Registered Bulk Carrier—TARSUS. Marine Safety Investigation Report 13; MSIU (Marine Safety Investigation Unit): Floriana, Malta, 2013; p. 45. [Google Scholar]
- ESG (Environment, Social and Governance) Performance Report; Ørsted: Fredericia, Denmark, 2017; p. 14.
- Environmental Report for Danish Electricity and CHP for 2016 Status Year (Doc. No.: 16/19207-5); Energinet: Erritsø, Denmark, 2017.
- IEEJ Outlook 2018—Prospects and Challenges until 2050. The 427th Forum on Research Work; IEEJ (The Institute of Energy Economics): Tokyo, Japan, 2017; p. 85.
- Hekkenberg, R.G. A Building Cost Estimation Method for Inland Ships. In Proceedings of the 7th European Inland Waterway Navigation Conference (EIWN), Budapest, Hungary, 10–12 September 2014. [Google Scholar]
- How Does a Supercapacitor Work? Battery University. Available online: http://batteryuniversity.com/learn/article/whats_the_role_of_the_supercapacitor (accessed on 15 August 2018).
- IDC (Industrial Development Corporation). Release of the US Trade and Development Agency Sponsored Energy Storage for South Africa Study—Energy Storage Could Become a Future Industry in South Africa; IDC (Industrial Development Corporation): Sandton, South Africa, 2017; p. 45. [Google Scholar]
- Klein, P. Energy Storage Use Cases for Enhancing Grid Flexibility; SAPVIA Networking Event; Council for Scientific and Industrial Research (CSIR): Petroria, South Africa, 2017; p. 20. [Google Scholar]
- Winkel, R.; Weddige, U.; Johnsen, D.; Hoen, V.; Papaefthymiou, G. Potential for Shore Side Electricity in Europe. Final Report; Navigant Consulting (formerly Ecofys): Chicago, IL, USA, 2015; p. 21. [Google Scholar]
- Lazard’s Levelized Cost of Energy Analysis—Version 8.0; Lazard: New York, NY, USA, 2014.
- Viswanathan, V.; Kintner-Meyer, M.; Balducci, P.; Jin, C. National Assessment of Energy Storage for Grid Balancing and Arbitrage Phase II; Pacific Northwest National Laboratory (PNNL): Washington, DC, USA, 2013; p. 78. [Google Scholar]
- Spatarua, C.; Kokb, Y.C.; Barretta, M. Physical Energy Storage Employed Worldwide. Energy Procedia 2014, 62, 452–461. [Google Scholar] [CrossRef] [Green Version]
- Sim, S. Electric Utility Resource Planning: Economics, Reliability, and Decision-Making; CRC Press: Boca Raton, FL, USA, 2011. [Google Scholar]
- Sabol, S. Case Studies in Mechanical Engineering: Decision Making, Thermodynamics, Fluid Mechanics and Heat Transfer; John Wiley & Sons: Hoboken, NJ, USA, 2016. [Google Scholar]
- Kelp, O.; Lenton, R.; Choudhuri, G. Fuel and Technology Cost Review—Final Report; Acil Allen Consulting: Melbourne, Australia, 2014. [Google Scholar]
- Mukund, R.P. Shipboard Electrical Power Systems; CRC Press: Boca Raton, FL, USA, 2017. [Google Scholar]
- Rodrigues, A.; Machado, D.; Dentinho, T. Electrical Energy Storage Systems Feasibility; the Case of Terceira Island. Sustainability 2017, 9, 1276. [Google Scholar] [CrossRef]
- Battery Energy Storage Study for the 2017 IRP (PacifiCorp); DNV GL KEMA: Arnhem, The Netherlands, 2016; p. 15.
- Fuel Prices (BW380). Available online: http://www.bunkerworld.com/prices/bunkerworldindex/bw380 (accessed on 30 January 2018).
- Tariffs—Shore Power Tariff; Nova Scotia Power: Halifax, NS, Canada, 2017; p. 36.
- Application for Approval of Shore Power Rate; BC Hydro: Vancouver, BC, Canada, 2015; pp. 1–11.
Figure 1.
Typical layout of a bulk carrier with deck cranes [22].
Figure 1.
Typical layout of a bulk carrier with deck cranes [22].

Figure 2.
Layout of a conventional power system.

Figure 3.
Docking/undocking procedure of a ship in a conventional system.

Figure 4.
Layout of the proposed power system.

Figure 5.
Docking/undocking procedure of a ship in the proposed system.

Figure 6.
Comparison of charging/discharging characteristics between SC and LIB.

Figure 7.
Simulation models of the proposed energy storage systems (ESSs).

Figure 8.
LIB pack voltage and state of charge (SOC) changes (port in/out mode).

Figure 9.
SC pack voltage and SOC changes (deck crane mode).

Figure 10.
Example of a genset fuel consumption graph [35].
Figure 10.
Example of a genset fuel consumption graph [35].

Figure 11.
Comparison of emissions for each operation mode.

Figure 12.
Cumulative saving costs for the lifespan of a ship depending on each variation.


Figure 13.
Total life cycle costs for conventional and proposed systems based on present values (25 years; i = 5%; a, b, c = 2%; electricity cost = 9.2 cents/kWh).
Figure 13.
Total life cycle costs for conventional and proposed systems based on present values (25 years; i = 5%; a, b, c = 2%; electricity cost = 9.2 cents/kWh).

Figure 14.
Cumulative saving costs for the lifespan of a ship depending on different cargo handling times (assuming that the ship visits 20 ports per year with a sailing time of 10 days).
Figure 14.
Cumulative saving costs for the lifespan of a ship depending on different cargo handling times (assuming that the ship visits 20 ports per year with a sailing time of 10 days).

Figure 15.
Cumulative saving costs for the lifespan of a ship depending on different sailing times (assuming that the ship stays at a port for 200 h with a cargo handling time of 120 h).
Figure 15.
Cumulative saving costs for the lifespan of a ship depending on different sailing times (assuming that the ship stays at a port for 200 h with a cargo handling time of 120 h).


Table 1.
Comparison between lithium-ion batteries (LIBs) and supercapacitors (SCs) [15,16,17,18,19,20].
| Type | Energy Density (Wh/kg) | Power Density (W/kg) | Life Cycles (cycles) | Voltage (V/cell) | Charging/Discharging Time |
|---|---|---|---|---|---|
| Lithium-ion Battery (LIB) | 150~250 | 50~2,000 | 500~2,000 | 3.6~4.2 | Minutes ~ Hours |
| Supercapacitor (SC) | 5~10 | ~100,000 | 500,000~2,500,000 | 2.7~3.0 | Seconds ~ Minutes |
Table 2.
Comparison of power demands between a conventional and the proposed system.
| Mode | ① Normal Seagoing | ② Port In/Out | ③ Load/Unload | ④ Harbor | |
|---|---|---|---|---|---|
| Maximum demand power | 380 kW | 700 kW | 1015 kW | 250 kW | |
| Conventional system | Power sources | G1 | G1 + G2 | G1 + G2 | G1 |
| Gensets in use (load factor) | 1 × 700 kW (54.3%) | 2 × 700 kW (50.0%) | 2 × 700 kW (71.4%) | 1 × 700 kW (35.7%) | |
| Proposed system | Power sources | G1’ | G2 + LIB | AMP + SC | AMP |
| Gensets in use (load factor) | 1 × 500 kW (76.0%) | 1 × 700 kW (71.4%) | - | - | |
Table 3.
Specifications of windlass/mooring winches.
| Classification | Specification | |
|---|---|---|
| Type | Electric-Driven Type | |
| Rated motor capacity | Combined windlass/mooring winch | 100 kW × 2 (Forward) (one is standby) |
| Mooring winch | 50 kW × 3 (AFT) (one is standby) | |
| Rated pulling force | Combined windlass/mooring winch | 300 kN |
| Mooring winch | 150 kN | |
| Motor drive type | Active front-end (bi-directional) type | |
| Electric voltage | AC 440 V | |
Table 4.
Expected power demands for the port in/out mode.
| Operation Mode | Time (min) | Power (kW) | Energy (kWh) | |
|---|---|---|---|---|
| Port-in | ① Lowering (heaving up) an anchor | 5 | −50 | −4.15 |
| ② Veering out and hauling in mooring ropes to the port side | 10 | 200 1 | 33.40 | |
| Total | 15 | - | 29.25 | |
| Port-out | ③ Pulling (hoisting) an anchor | 10 | 100 | 16.70 |
| ④ Winding mooring ropes to onboard rope drums | 10 | 150 2 | 25.05 | |
| Total | 20 | - | 41.75 | |
1 Combined windlass/mooring winch (100 kW × 1), mooring winch (50 kW × 2). 2 Combined windlass/mooring winch (50 kW × 1), mooring winch (50 kW × 2).
Table 5.
Specifications of the selected LIB module [26].
Table 5.
Specifications of the selected LIB module [26].
| Category | Specification |
|---|---|
| Cell type | Lithium nickel manganese cobalt oxide (NMC) |
| Nominal voltage | 88.8 VDC |
| C-rate | Max. 1.4 C (continuous) |
| Stored energy | 10 kWh |
| Capacity | 112 Ah |
| Weight | 90 kg |
| Size (m) | 0.58 (L) × 0.32 (W) × 0.38 (H) (0.0705 m3) |
Table 6.
Specifications of the selected LIB pack.
| Category | Specification |
|---|---|
| Target terminal voltage | 355 V |
| Configuration | 2 strings × 4 modules in series |
| Usable energy | 80 kWh |
| Total weight (8 modules) | 720 kg |
| Total size (8 modules) | 0.5642 m3 |
Table 7.
Specifications of the selected deck crane.
| Classification | Specifications | |
|---|---|---|
| Crane type | Electric-driven type | |
| Hoisting max. capacity | 30 t | |
| Max. lifting height | 40 m | |
| Crane weight | 45 t | |
| Hoisting/slewing speed | 20 m/min (full load) 40 m/min (no load) | |
| Luffing speed | 10 m/min (full load) | |
| Motor rated power | Hoisting | 145 kW |
| Luffing | 90 kW | |
| Slewing | 40 kW | |
| Grab | 20 kW | |
| Motor drive type | AFE (bi-directional) type | |
| Electric voltage | AC 440 V | |
Table 8.
Expected power demands for deck crane operations.
| No. | Step | Time (s) | Power (kW) | Energy (Wh) | |
|---|---|---|---|---|---|
| ① | Lowering with no load | 20 | −19.2 | −106.68 | |
| ② | Grab (close) | 10 | 20.0 | 55.56 | |
| ③ | Hoisting with full load | 25 | 134.6 | 934.66 | |
| ④ | Luffing in (up) | 5 | 86.5 | 120.15 | |
| ⑤ | Slewing to port side | 15 | 34.6 | 144.18 | |
| ⑥ | Lowering with full load | 15 | −67.3 | −280.44 | |
| ⑦ | Grab (open) | 5 | 20.0 | 27.78 | |
| ⑧ | Hoisting with no load | 10 | 38.4 | 106.68 | |
| ⑨ | Slewing to ship side | 10 | 23.1 | 64.17 | |
| ⑩ | Luffing out (down) | 5 | −43.3 | −60.14 | |
| Total | About 4 min/cycle (including overhauling time) | 1005.92 Wh/cycle | |||
Table 9.
Specifications of the selected SC module [30].
Table 9.
Specifications of the selected SC module [30].
| Category | Specification |
|---|---|
| Rated capacitance | 63 F |
| Rated voltage | 125 V |
| Max. initial equivalent DC series resistance (ESRDC) | 18 mΩ |
| Max. leakage current (at 25 °C) | 10 mA |
| Number of cells | 48 in series |
| Stored energy | 140 Wh |
| Usable specific power | 1700 W/kg |
| Specific energy | 2.3 Wh/kg |
| Cycle life (at 25 °C) | 1,000,000 cycles |
| Weight | 61 kg |
| Size (m) | 0.619 (L) × 0.425 (W) × 0.265 (H) (0.0697 m3) |
Table 10.
Specifications of the selected SC pack.
| Category | Specifications |
|---|---|
| Target terminal voltage | 625 V |
| Configuration | 3 strings × 5 modules in series |
| Usable energy | 5537 kJ (1.54 kWh) |
| Total weight (15 modules) | 915 kg |
| Total size (15 modules) | 1.0455 m3 |
Table 11.
Applied parameters of LIB and SC modules for the simulation.
| Model | Description | Value | Unit |
|---|---|---|---|
| Li-ion Battery (LIB) | Nominal voltage | 88.8 | V |
| Rated capacity | 112 | Ah | |
| Fully charged voltage | 103.36 | V | |
| Nominal discharge current | 48.70 | A | |
| Internal resistance | 7.93 | mΩ | |
| Supercapacitor (SC) | Rated capacitance | 63 | F |
| Rated voltage | 125 | V | |
| Surge voltage | 130 | V | |
| Initial voltage | 122 | V | |
| Equivalent DC series resistance (ESRDC) | 18 | mΩ | |
| Leakage current | 10 | mA |
Table 12.
Emission factors for different pollutant types.
| Fuel | Emission factors | ||
|---|---|---|---|
| CO2 (g∙CO2/g∙fuel) | SOX (g∙SOX/g∙fuel) | NOX (g∙NOX/g∙fuel) | |
| Heavy Fuel Oil (HFO) | 3.114 | 0.054 | 0.057 |
| Marine Gas Oil (MGO) | 3.206 | 0.002 | 0.057 |
Table 13.
Emissions from onboard gensets for each mode (conventional system).
| Mode | Electric Power Demand (kW) | Time (h) | Fuel Efficiency (g/kWh) | Fuel (kg) | Emissions (kg) | |||
|---|---|---|---|---|---|---|---|---|
| CO2 | SOX | NOX | ||||||
| Normal seagoing (10 days) | 380 | 240 | 195 | 17,784.0 | 55,379.38 | 960.34 | 1013.69 | |
| Port in/out | Excluding winch loads | 500 | 2 [38] | 198 | 198.0 | 634.79 | 0.40 | 11.29 |
| Winch (Port-in) | 29.25 kWh (Table 4) | 5.8 | 18.59 | 0.01 | 0.33 | |||
| Winch (Port-out) | 41.75 kWh (Table 4) | 8.3 | 26.61 | 0.02 | 0.47 | |||
| Cargo loading/unloading | Excluding crane loads | 550 | 120 1 | 192 | 12,672.0 | 40,626.43 | 25.34 | 722.30 |
| Crane loads (3 cranes) | 1.01 kWh × 3 each × 1800 cycle 2 (Table 8) | 1047.2 | 3357.32 | 2.09 | 59.69 | |||
| Harbor | 250 | 48 | 213 | 2556.0 | 8194.54 | 5.11 | 145.69 | |
| Total | - | 34,271.3 | 108,237.66 | 993.31 | 1953.46 | |||
1 Assuming crane operators work in shifts of 6 h (120 h = 6 h × 20 turns) [39]. 2 Assuming each crane was operated for 15 cycles per hour (1800 cycles = 120 h × 15 cycles).
Table 14.
Emissions from onboard gensets for each mode (proposed system).
| Mode | Electric Power Demand (kW) | Time (h) | Fuel Efficiency (g/kWh) | Fuel (kg) | Emissions (kg) | ||||
|---|---|---|---|---|---|---|---|---|---|
| CO2 | SOX | NOX | |||||||
| Ship power (AMP) | Normal seagoing (10 d) | Ship loads | 380 | 240 | 191 | 17,419.2 | 54,243.39 | 940.64 | 992.89 |
| LIB Charging (After port-out) | 80 kWh × (85%–40.1%) | 191 | 6.8 | 21.18 | 0.37 | 0.39 | |||
| Port in/out (Excluding winch loads) | 500 | 2 | 192 | 192.0 | 615.55 | 0.38 | 10.94 | ||
| Total | - | 17,618.0 | 54,880.12 | 941.39 | 1004.23 | ||||
Table 15.
Emissions from shore charging (proposed system).
| Mode | Electric Power Demand (kW) | Time (h) | Emissions (kg) | |||||
|---|---|---|---|---|---|---|---|---|
| CO2 | SOX | NOX | ||||||
| Shore power (AMP) | Cargo loading/unloading | Excluding crane loads | 550 | 120 | 9966.00 | 1.98 | 10.56 | |
| Crane loads (SC charging) | 1.54 kWh × 3 each × (97.4%–67.7%) × 1800 cycle | 372.95 | 0.07 | 0.40 | ||||
| Harbor | LIB charging (After port-in) | 80 kWh × (90%–49.3 %) | 4.92 | 0.00 | 0.01 | |||
| Harbor loads | 250 | 48 | 1812.00 | 0.36 | 1.92 | |||
| Total | 80,502.41 kWh | 12,155.86 | 2.42 | 12.88 | ||||
Table 16.
Comparison of emissions according to different cargo handling times.
| Cargo Handling Time at a Port (h) 1 | Conventional System (ton/yr) | Proposed System (ton/yr) | Emission Reduction (%) | ||||||
|---|---|---|---|---|---|---|---|---|---|
| CO2 | SOX | NOX | CO2 | SOX | NOX | CO2 | SOX | NOX | |
| 60 | 1724.91 | 19.59 | 31.25 | 1237.33 | 18.86 | 20.23 | 28.27 | 3.73 | 35.26 |
| 90 | 1944.83 | 19.73 | 35.16 | 1289.03 | 18.87 | 20.29 | 33.72 | 4.36 | 42.29 |
| 120 | 2164.75 | 19.87 | 39.07 | 1340.72 | 18.88 | 20.34 | 38.07 | 4.98 | 47.94 |
| 150 | 2384.67 | 20.00 | 42.98 | 1392.41 | 18.89 | 20.40 | 41.61 | 5.55 | 52.54 |
| 180 | 2604.59 | 20.14 | 46.89 | 1444.11 | 18.90 | 20.45 | 44.56 | 6.16 | 56.39 |
1 Assuming that the ship visits 20 ports per year with a sailing time of 10 d.
Table 17.
Comparison of emissions according to different sailing times.
| Sailing Time for Port-To-Port (d) 1 | Conventional System (ton/yr) | Proposed System (ton/yr) | Emission Reduction (%) | ||||||
|---|---|---|---|---|---|---|---|---|---|
| CO2 | SOX | NOX | CO2 | SOX | NOX | CO2 | SOX | NOX | |
| 5 (27 ports/yr) | 2174.79 | 13.85 | 39.06 | 1,077.69 | 12.78 | 14.06 | 50.45 | 7.73 | 64.00 |
| 10 (20 ports/yr) | 2164.75 | 19.87 | 39.07 | 1,340.72 | 18.88 | 20.34 | 38.07 | 4.98 | 47.94 |
| 15 (16 ports/yr) | 2174.84 | 23.58 | 39.36 | 1,506.52 | 22.63 | 24.22 | 30.73 | 4.03 | 38.47 |
| 20 (13 ports/yr) | 2127.02 | 25.40 | 38.57 | 1,576.63 | 24.50 | 26.13 | 25.88 | 3.54 | 32.25 |
1 Assuming that the ship stays at a port for 200 h with a cargo handling time of 120 h.
Table 18.
Comparison of the capital expenditure (CAPEX) for each system.
| Type | Conventional Power System | Proposed Power System | ||||
|---|---|---|---|---|---|---|
| Main equipment cost | Equipment | Cost | No. | Equipment | Cost | No. |
| Generator (700 kW) | 149,800 USD | 3 | Generator (500 kW) | 107,000 USD | 1 | |
| Crane converter (300 kW) | 90,000 USD | 4 | Generator (700 kW) | 149,800 USD | 1 | |
| - | - | - | LIB (40 kWh) | 24,000 USD | 2 | |
| - | - | - | SC (1.54 kWh) | 15,400 USD | 4 | |
| - | - | - | Converter of LIB (40 kW) | 12,000 USD | 2 | |
| - | - | - | Converter of SC (280 kW) | 84,000 USD | 4 | |
| - | - | - | AMP converter (750 kW) | 225,000 USD | 2 | |
| - | - | - | Cable system for AMP | 1,300 USD | 1 | |
| Total cost | 809,400 USD | 1,177,700 USD | ||||
Table 19.
Comparison of the operational expenditure (OPEX) for each system per year.
| Type | Conventional Power System | Proposed Power System | ||||
|---|---|---|---|---|---|---|
| Fixed O&M cost /year | Equipment | Unit cost (/kW/yr) | No. | Equipment | Unit cost (/kW/yr) | No. |
| Generator (700 kW) | 15 USD | 3 | Generator (500 kW) | 15 USD | 1 | |
| Crane converter (300 kW) | 2 USD | 4 | Generator (700 kW) | 15 USD | 1 | |
| - | - | LIB (40 kWh) | 3 USD | 2 | ||
| - | - | - | SC (1.54 kWh) | 5.55 USD | 4 | |
| - | - | - | Converter (LIB) (40 kW) | 2 USD | 2 | |
| - | - | - | Converter (SC) (280 kW) | 2 USD | 4 | |
| - | - | - | AMP converter (750 kW) | 2 USD | 2 | |
| Total cost | 33,900/year USD | 23,674/year USD | ||||
| Type | Fuel Consumption | No. of visited ports/yr | Unit price | Fuel Consumption | No. of visited ports/yr | Unit price |
| HFO | 17.784 (t/port) | 20 | 400/t USD 1 | 17.426 (t/port) | 20 | 400/t USD 1 |
| MGO | 16.487 (t/port) | 20 | 630/t USD 1 | 0.192 (t/port) | 20 | 630/t USD 1 |
| Electricity (AMP) | - | - | - | 80,502.41 (kWh/port) (Table 15) | 20 | 9.2 cents/kWh 2 |
| Total cost | 350,008/year USD | 289,952/year USD | ||||
© 2019 by the authors. Licensee MDPI, Basel, Switzerland. This article is an open access article distributed under the terms and conditions of the Creative Commons Attribution (CC BY) license (http://creativecommons.org/licenses/by/4.0/).
Share and Cite
MDPI and ACS Style
Kim, K.; An, J.; Park, K.; Roh, G.; Chun, K. Analysis of a Supercapacitor/Battery Hybrid Power System for a Bulk Carrier. Appl. Sci. 2019, 9, 1547. https://0-doi-org.brum.beds.ac.uk/10.3390/app9081547
AMA Style
Kim K, An J, Park K, Roh G, Chun K. Analysis of a Supercapacitor/Battery Hybrid Power System for a Bulk Carrier. Applied Sciences. 2019; 9(8):1547. https://0-doi-org.brum.beds.ac.uk/10.3390/app9081547
Chicago/Turabian StyleKim, Kyunghwa, Juwan An, Kido Park, Gilltae Roh, and Kangwoo Chun. 2019. "Analysis of a Supercapacitor/Battery Hybrid Power System for a Bulk Carrier" Applied Sciences 9, no. 8: 1547. https://0-doi-org.brum.beds.ac.uk/10.3390/app9081547
Note that from the first issue of 2016, this journal uses article numbers instead of page numbers. See further details here.