
A Novel Automated RGB-D Sensor-Based Measurement of Voluntary Items of the Fugl-Meyer Assessment for Upper Extremity: A Feasibility Study

Abstract
:1. Introduction
2. Materials and Methods
2.1. Participants
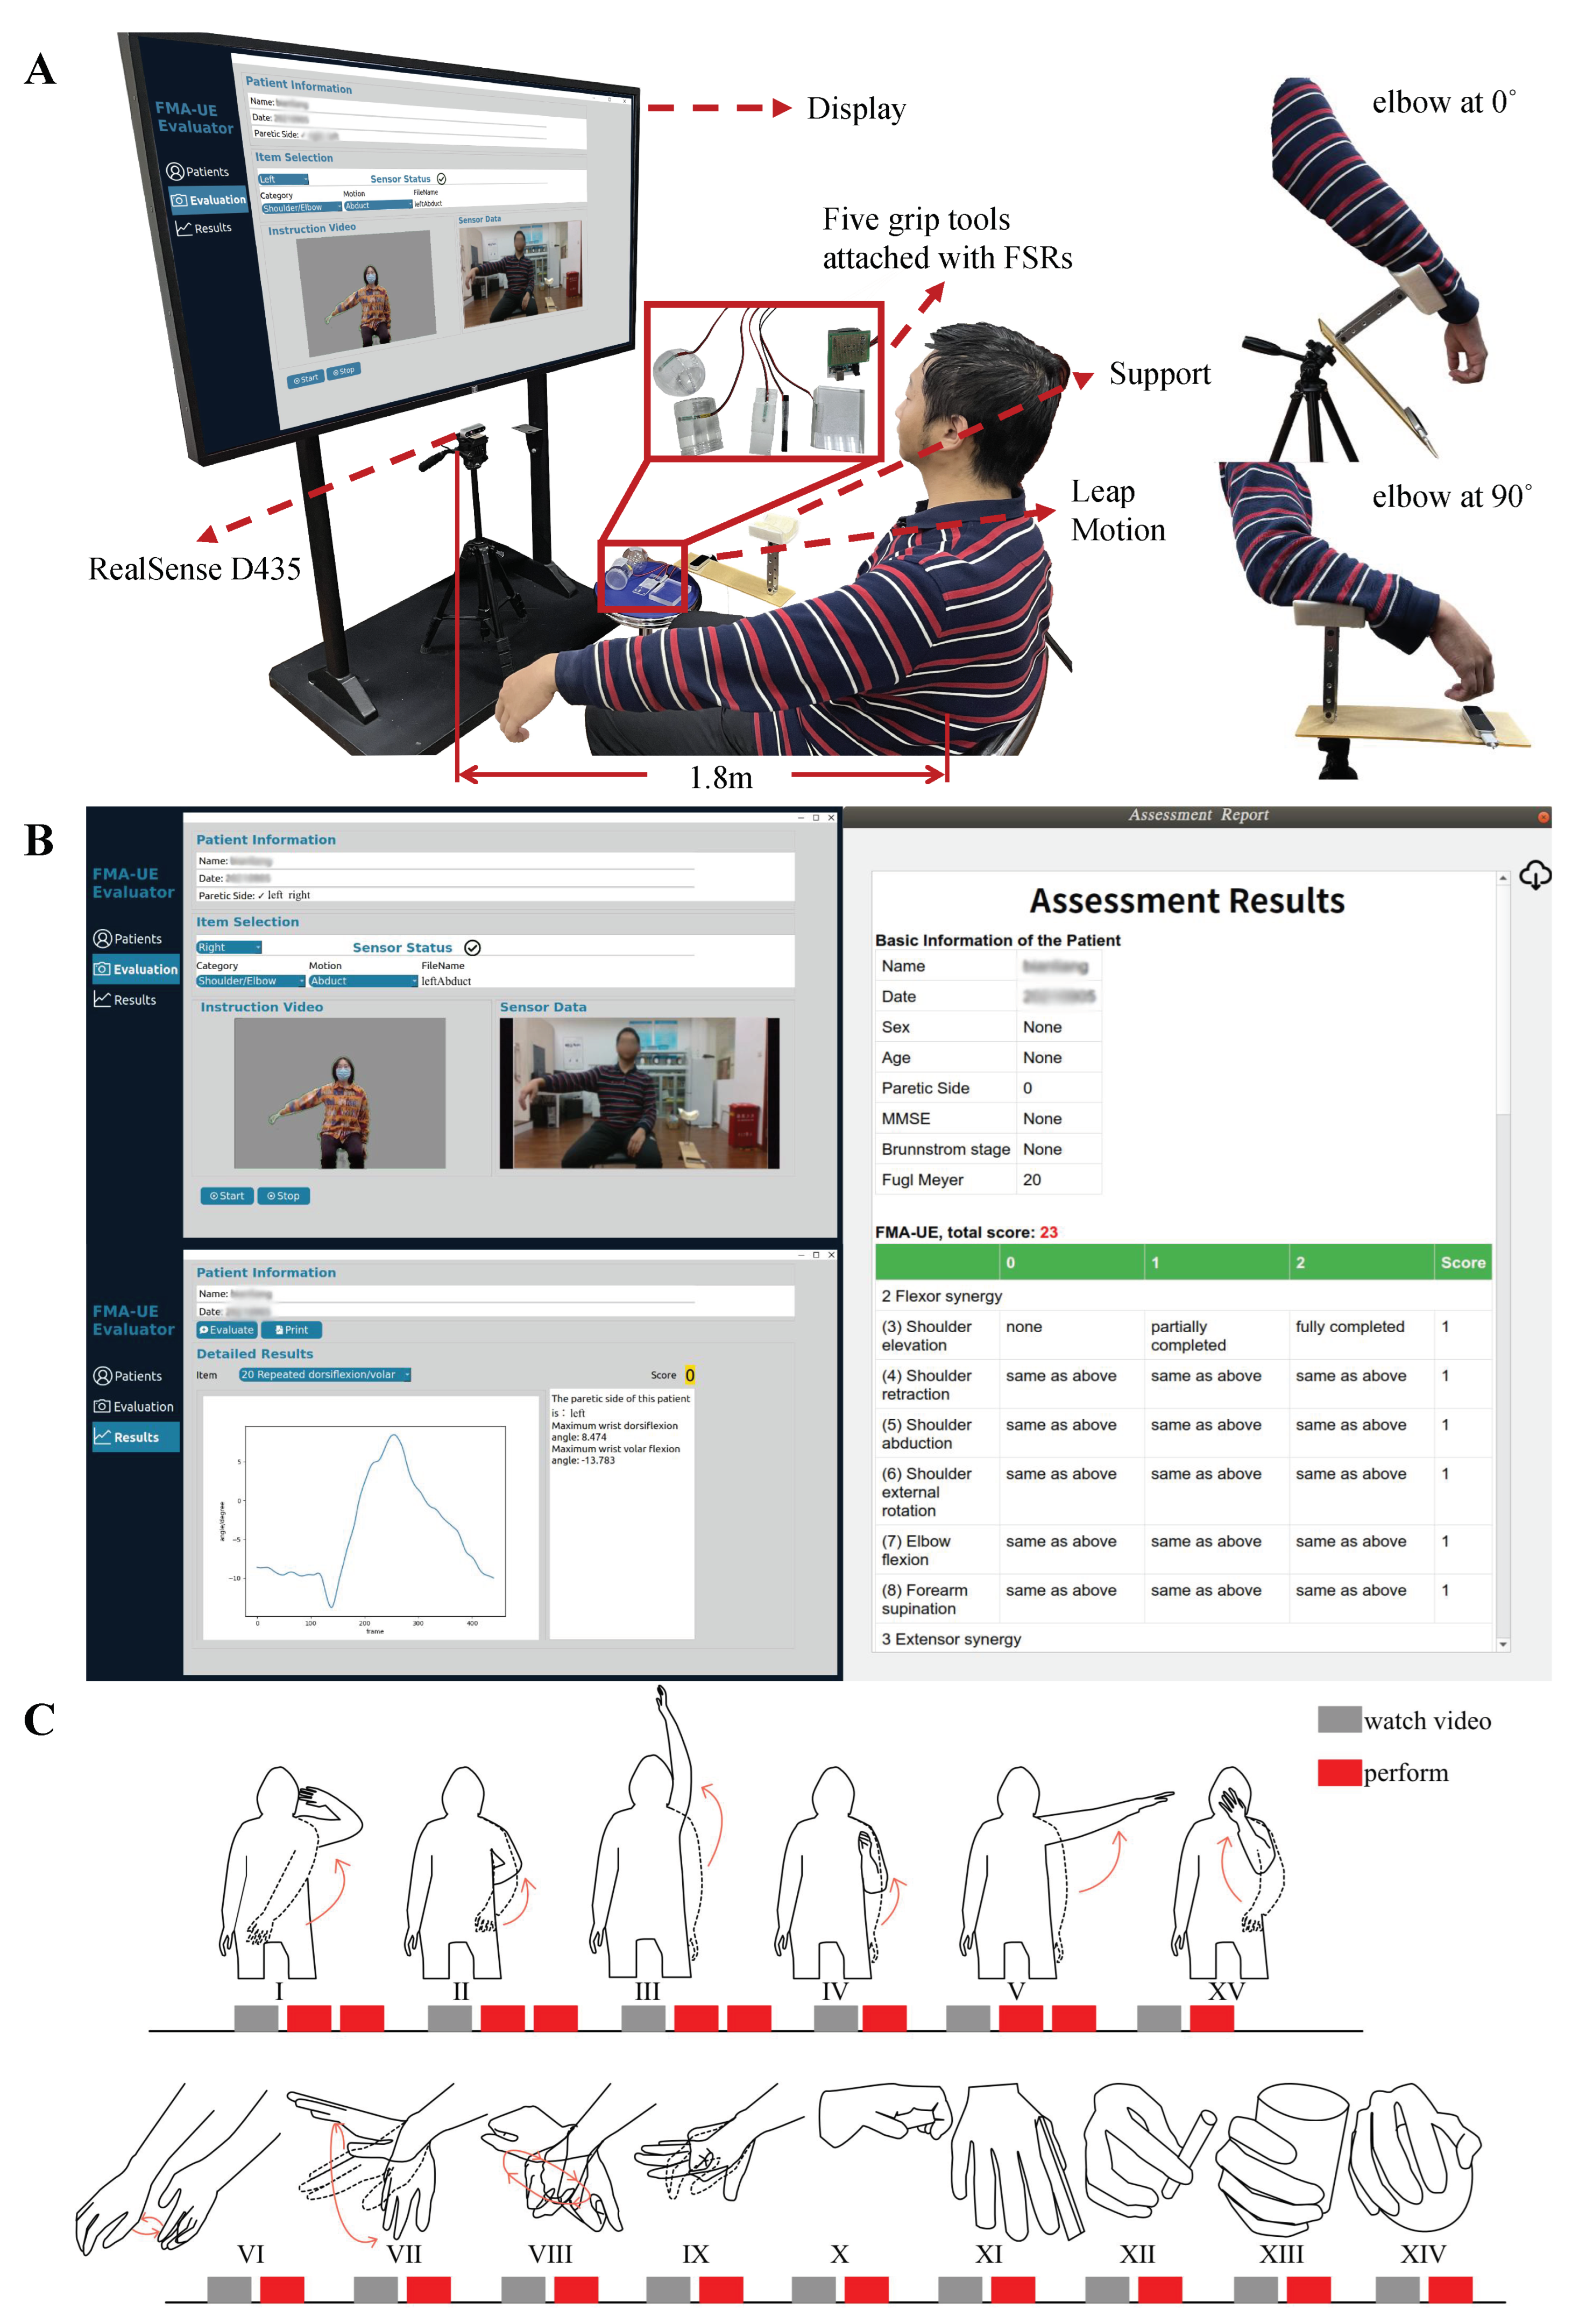
2.2. System Design
2.2.1. FMA Items
2.2.2. Hardware and Software
2.2.3. Experimental Protocol
2.3. Assessment
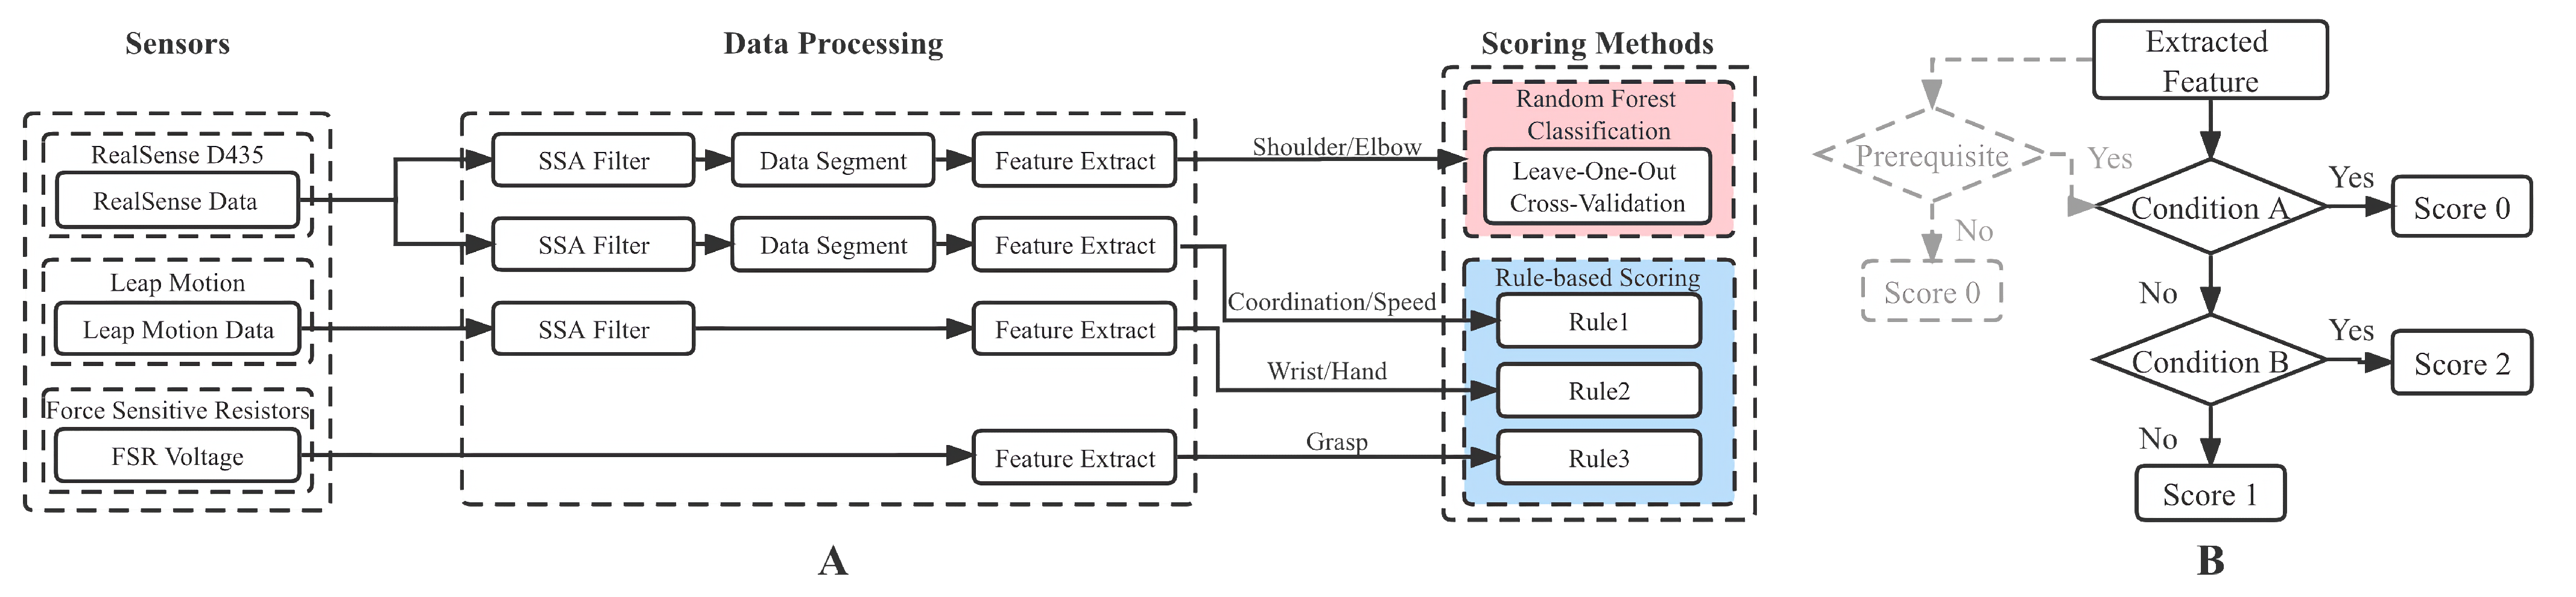
2.3.1. Data Analysis Procedure
2.3.2. The Shoulder/Elbow Part
2.3.3. The Other Three Parts
2.4. Data Analysis
- 1.
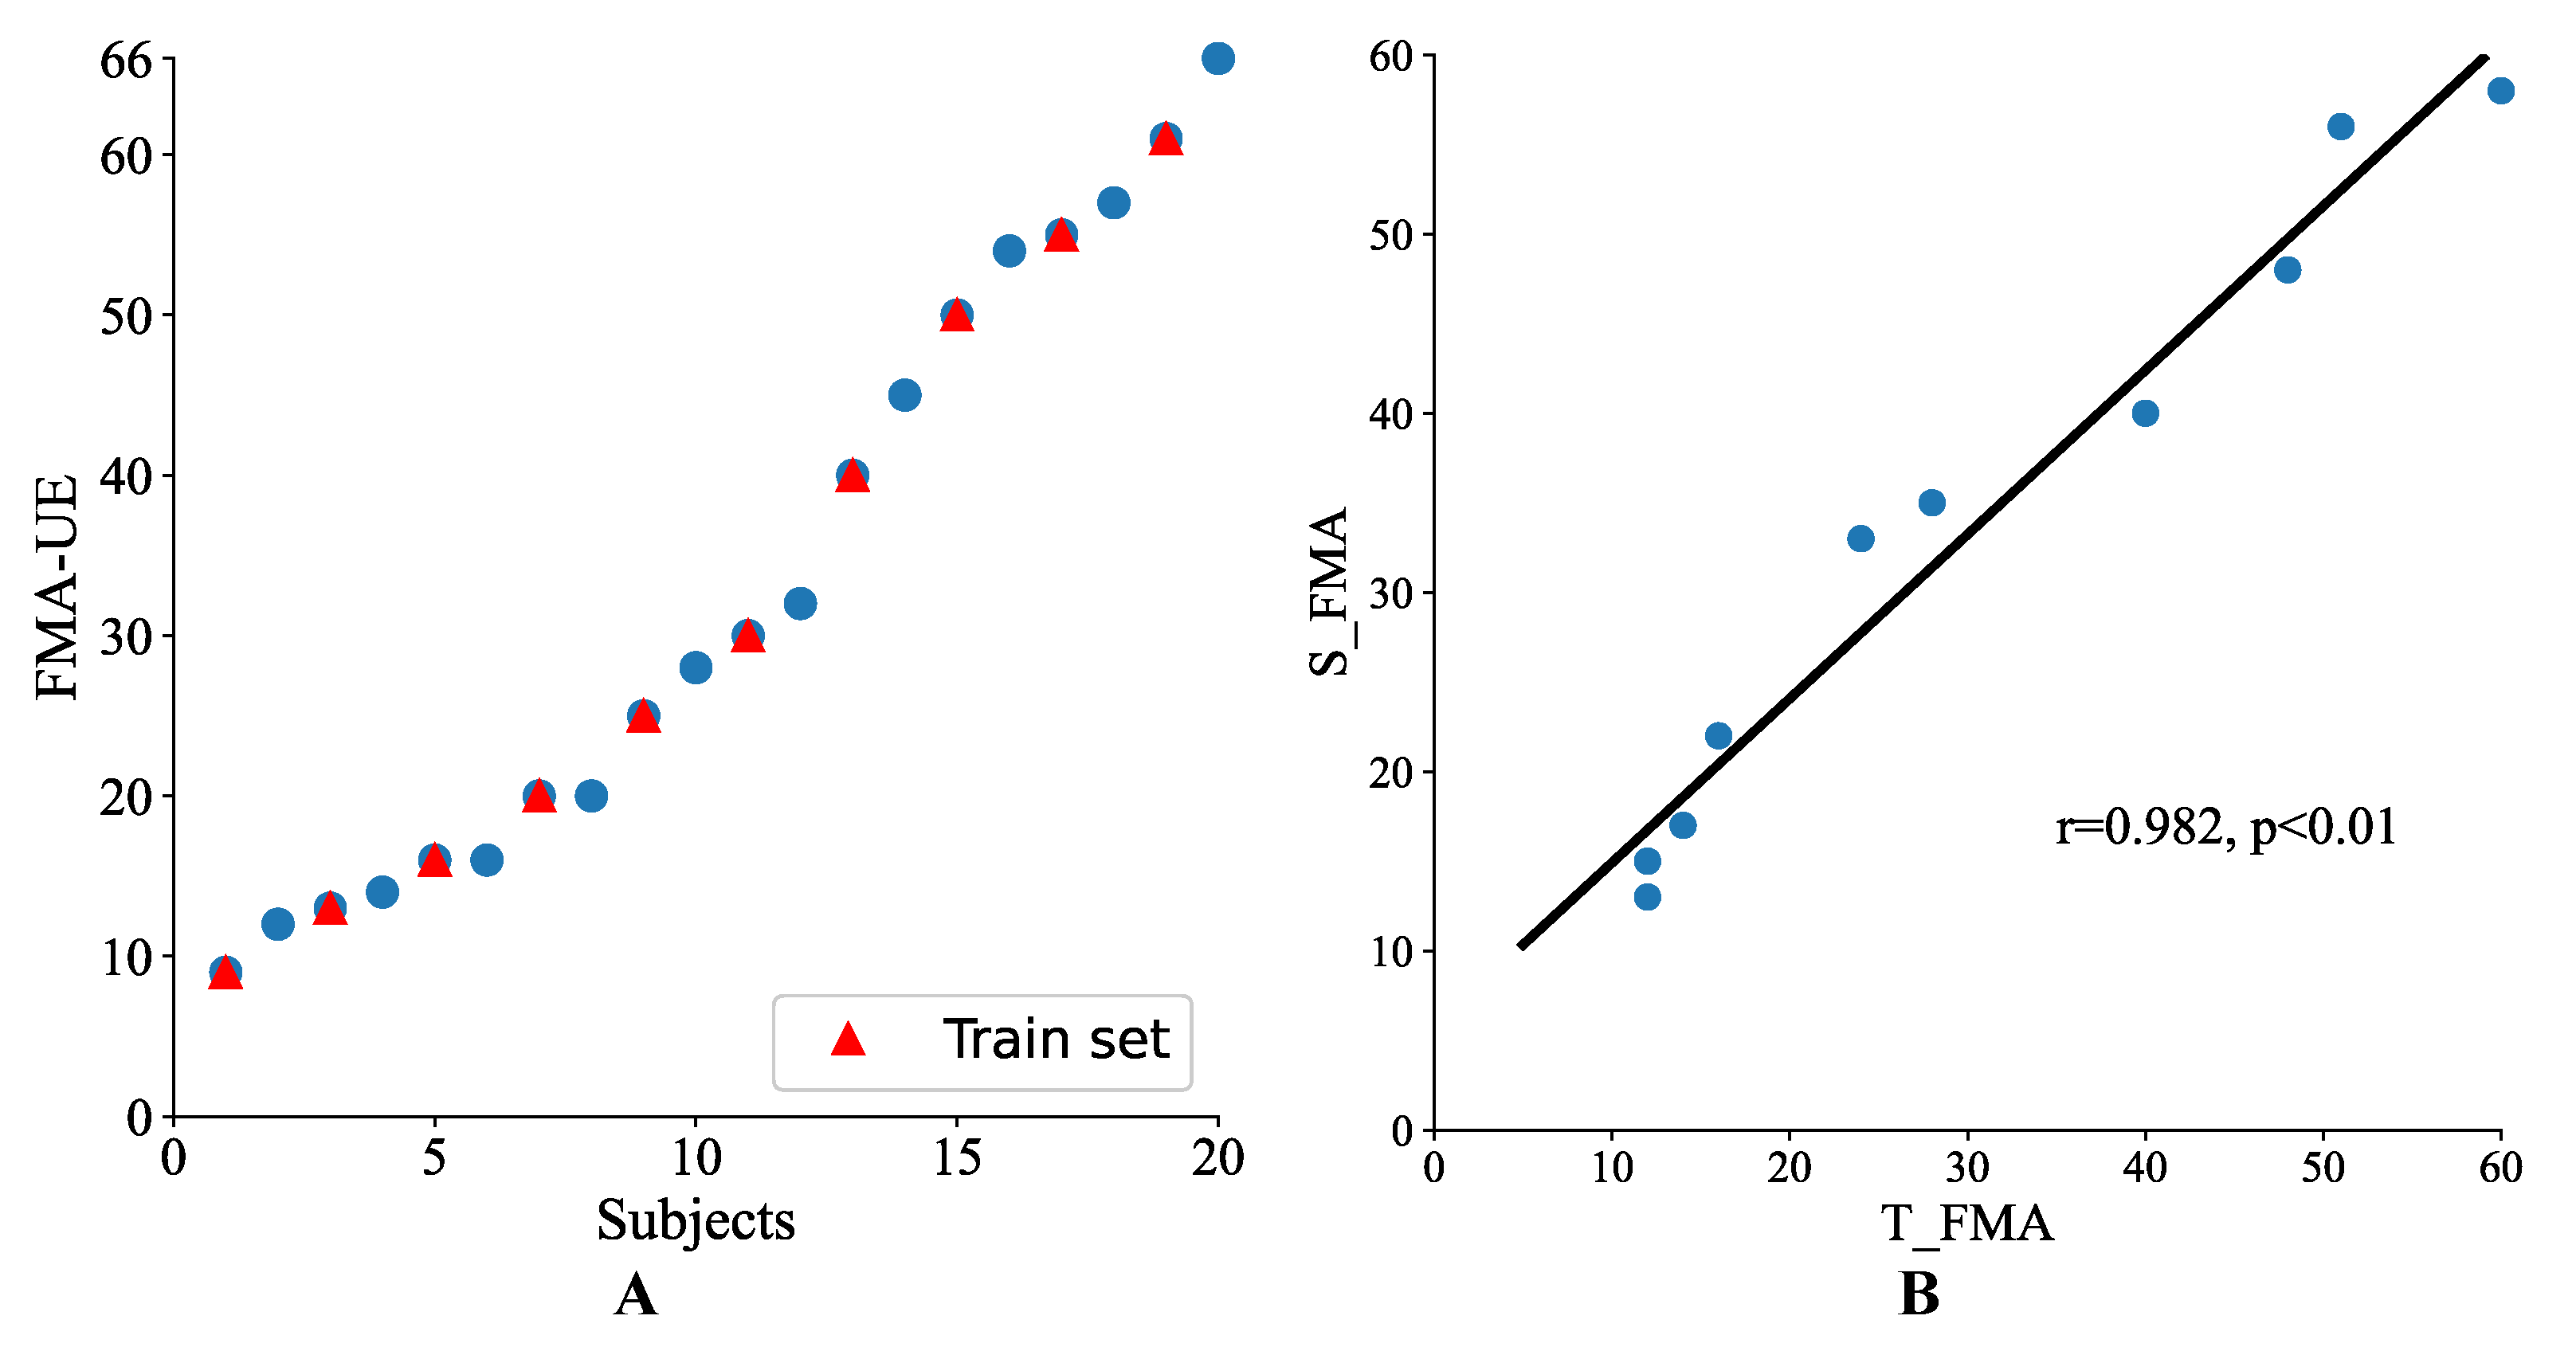
- Total scores: Using Pearson’s correlation coefficient, the correlation between the system and therapist scores was investigated. In addition, in order to further prove the system value in practical applications, a simulated online test was also implemented. The 20 participating patients were first ranked in ascending order according to their FMA-UE scores. In order to ensure the involvement of different motor function levels, every other subject was selected to construct a ten-patient training set, and the remaining ten patients made up the test set. For convenience, the result predicted by the automated system was abbreviated as S_FMA and that evaluated by the therapist was abbreviated as T_FMA.
- 2.
- Single FMA items: To evaluate the scoring accuracy of the proposed system, both the prediction accuracy and mean absolute error (MAE) of each item were calculated, using scores obtained from the therapist as the gold standard. The consistency between all the scores for a total of 600 items (30 items for each of 20 subjects) obtained by these two assessment methods was estimated by linear weighted Cohen’s kappa coefficient. Four additional macro-averaged metrics, including F1-score, sensitivity, specificity, and precision, were also calculated according to the confusion matrix.
3. Results
3.1. Participants
3.2. Performance Evaluation on Total Scores
3.3. Performance Evaluation on Single FMA Items
4. Discussion
5. Conclusions
Author Contributions
Funding
Institutional Review Board Statement
Informed Consent Statement
Data Availability Statement
Acknowledgments
Conflicts of Interest
Appendix A. Detailed Feature Extraction Methods

Appendix B. Scoring Rules

| Category | FMA Item | Rule 1 | Score 2 |
|---|---|---|---|
| Wrist/Hand (Rule2 3) | 14 | If | 0 |
| Else If | 0 | ||
| Else if | 2 | ||
| Else | 1 | ||
| 17 | If A | 0 | |
| Else If | 0 | ||
| Else if | 2 | ||
| Else | 1 | ||
| 19, 21 | If | 0 | |
| Else if | 2 | ||
| Else | 1 | ||
| 20, 22 | If ( AND ) OR | 0 | |
| Else if AND AND | 2 | ||
| Else | 1 | ||
| 23 | If AND | 0 | |
| Else if OR | 2 | ||
| Else | 1 | ||
| 24 | If | ||
| Else if AND | |||
| Else | |||
| If | 0 | ||
| Else if AND | 2 | ||
| Else | 1 | ||
| 25 | If OR | ||
| Else if | |||
| Else | |||
| If | 0 | ||
| Else if AND | 2 | ||
| Else | 1 | ||
| Grasp (Rule3) | 26–30 | If | |
| If | 0 | ||
| Else | 1 | ||
| Else if | 2 | ||
| Else | 1 | ||
| Coordination /Speed (Rule1) | 31 | If | 0 |
| Else if | 2 | ||
| Else | 1 | ||
| 32 | If | 0 | |
| Else if | 2 | ||
| Else | 1 | ||
| 33 | If | 0 | |
| Else If | 0 | ||
| Else if | 2 | ||
| Else | 1 |
| Symbol | Logic Operation 1 |
|---|---|
| A | |
References
- Veerbeek, J.M.; Langbroek-Amersfoort, A.C.; Van Wegen, E.E.; Meskers, C.G.; Kwakkel, G. Effects of robot-assisted therapy for the upper limb after stroke: A systematic review and meta-analysis. Neurorehabilit. Neural Repair 2017, 31, 107–121. [Google Scholar] [CrossRef]
- Warlow, C.P.; Van Gijn, J.; Dennis, M.S.; Wardlaw, J.M.; Bamford, J.M.; Hankey, G.J.; Sandercock, P.A.; Rinkel, G.; Langhorne, P.; Sudlow, C.; et al. Stroke: Practical Management, 3rd ed.; Peter, L., Martin, D., Eds.; John Wiley & Sons: Hoboken, NJ, USA, 2008. [Google Scholar]
- Sivan, M.; O’Connor, R.J.; Makower, S.; Levesley, M.; Bhakta, B. Systematic review of outcome measures used in the evaluation of robot-assisted upper limb exercise in stroke. J. Rehabil. Med. 2011, 43, 181–189. [Google Scholar] [CrossRef] [Green Version]
- Fugl-Meyer, A.R.; Jääskö, L.; Leyman, I.; Olsson, S.; Steglind, S. The post-stroke hemiplegic patient. 1. A method for evaluation of physical performance. Scand. J. Rehabil. Med. 1975, 7, 13–31. [Google Scholar]
- Lin, J.H.; Hsueh, I.P.; Sheu, C.F.; Hsieh, C.L. Psychometric properties of the sensory scale of the Fugl-Meyer Assessment in stroke patients. Clin. Rehabil. 2004, 18, 391–397. [Google Scholar] [CrossRef]
- Gladstone, D.J.; Danells, C.J.; Black, S.E. The Fugl-Meyer assessment of motor recovery after stroke: A critical review of its measurement properties. Neurorehabilit. Neural Repair 2002, 16, 232–240. [Google Scholar] [CrossRef]
- Kim, H.; Her, J.; Ko, J.; Park, D.s.; Woo, J.H.; You, Y.; Choi, Y. Reliability, concurrent validity, and responsiveness of the Fugl-Meyer Assessment (FMA) for hemiplegic patients. J. Phys. Ther. Sci. 2012, 24, 893–899. [Google Scholar] [CrossRef] [Green Version]
- Poole, J.L.; Whitney, S.L. Assessments of motor function post stroke: A review. Phys. Occup. Ther. Geriatr. 2001, 19, 1–22. [Google Scholar] [CrossRef]
- Wang, J.; Yu, L.; Wang, J.; Guo, L.; Gu, X.; Fang, Q. Automated Fugl-Meyer assessment using SVR model. In Proceedings of the 2014 IEEE International Symposium on Bioelectronics and Bioinformatics (IEEE ISBB 2014), Chung Li, Taiwan, 11–14 April 2014; pp. 1–4. [Google Scholar]
- Park, S.J.; Hussain, I.; Hong, S.; Kim, D.; Park, H.; Benjamin, H.C.M. Real-time gait monitoring system for consumer stroke prediction service. In Proceedings of the 2020 IEEE International Conference on Consumer Electronics (ICCE), Las Vegas, NV, USA, 4–6 January 2020; pp. 1–4. [Google Scholar]
- Yu, L.; Xiong, D.; Guo, L.; Wang, J. A remote quantitative Fugl-Meyer assessment framework for stroke patients based on wearable sensor networks. Comput. Methods Programs Biomed. 2016, 128, 100–110. [Google Scholar] [CrossRef]
- Li, H.T.; Huang, J.J.; Pan, C.W.; Chi, H.I.; Pan, M.C. Inertial sensing based assessment methods to quantify the effectiveness of post-stroke rehabilitation. Sensors 2015, 15, 16196–16209. [Google Scholar] [CrossRef] [Green Version]
- Hussain, I.; Park, S.J. Prediction of myoelectric biomarkers in post-stroke gait. Sensors 2021, 21, 5334. [Google Scholar] [CrossRef]
- Hesam-Shariati, N.; Trinh, T.; Thompson-Butel, A.G.; Shiner, C.T.; McNulty, P.A. A longitudinal electromyography study of complex movements in poststroke therapy. 2: Changes in coordinated muscle activation. Front. Neurol. 2017, 8, 277. [Google Scholar] [CrossRef] [PubMed]
- Li, Y.; Zhang, X.; Gong, Y.; Cheng, Y.; Gao, X.; Chen, X. Motor function evaluation of hemiplegic upper-extremities using data fusion from wearable inertial and surface EMG sensors. Sensors 2017, 17, 582. [Google Scholar] [CrossRef] [Green Version]
- Olesh, E.V.; Yakovenko, S.; Gritsenko, V. Automated assessment of upper extremity movement impairment due to stroke. PLoS ONE 2014, 9, e104487. [Google Scholar]
- Kim, W.S.; Cho, S.; Baek, D.; Bang, H.; Paik, N.J. Upper extremity functional evaluation by Fugl-Meyer assessment scoring using depth-sensing camera in hemiplegic stroke patients. PLoS ONE 2016, 11, e0158640. [Google Scholar] [CrossRef] [PubMed] [Green Version]
- Bai, J.; Song, A. Development of a novel home based multi-scene upper limb rehabilitation training and evaluation system for post-stroke patients. IEEE Access 2019, 7, 9667–9677. [Google Scholar] [CrossRef]
- Fang, Q.; Mahmoud, S.S.; Gu, X.; Fu, J. A novel multistandard compliant hand function assessment method using an infrared imaging device. IEEE J. Biomed. Health Inform. 2018, 23, 758–765. [Google Scholar] [CrossRef] [PubMed]
- Lee, S.; Lee, Y.S.; Kim, J. Automated evaluation of upper-limb motor function impairment using Fugl-Meyer assessment. IEEE Trans. Neural Syst. Rehabil. Eng. 2017, 26, 125–134. [Google Scholar] [CrossRef] [PubMed]
- Li, C.; Cheng, L.; Yang, H.; Zou, Y.; Huang, F. An Automatic Rehabilitation Assessment System for Hand Function Based on Leap Motion and Ensemble Learning. Cybern. Syst. 2020, 52, 3–25. [Google Scholar] [CrossRef]
- Bonett, D.G.; Wright, T.A. Sample size requirements for estimating Pearson, Kendall and Spearman correlations. Psychometrika 2000, 65, 23–28. [Google Scholar] [CrossRef]
- Folstein, M.F.; Folstein, S.E.; McHugh, P.R. “Mini-mental state”: A practical method for grading the cognitive state of patients for the clinician. J. Psychiatr. Res. 1975, 12, 189–198. [Google Scholar] [CrossRef]
- Woodbury, M.L.; Velozo, C.A.; Richards, L.G.; Duncan, P.W.; Studenski, S.; Lai, S.M. Dimensionality and construct validity of the Fugl-Meyer Assessment of the upper extremity. Arch. Phys. Med. Rehabil. 2007, 88, 715–723. [Google Scholar] [CrossRef] [PubMed]
- Woytowicz, E.J.; Rietschel, J.C.; Goodman, R.N.; Conroy, S.S.; Sorkin, J.D.; Whitall, J.; Waller, S.M. Determining levels of upper extremity movement impairment by applying a cluster analysis to the Fugl-Meyer assessment of the upper extremity in chronic stroke. Arch. Phys. Med. Rehabil. 2017, 98, 456–462. [Google Scholar] [CrossRef]
- Siena, F.L.; Byrom, B.; Watts, P.; Breedon, P. Utilising the intel realsense camera for measuring health outcomes in clinical research. J. Med Syst. 2018, 42, 53. [Google Scholar] [CrossRef] [PubMed] [Green Version]
- Simbaña, E.D.O.; Baeza, P.S.H.; Huete, A.J.; Balaguer, C. Review of automated systems for upper limbs functional assessment in neurorehabilitation. IEEE Access 2019, 7, 32352–32367. [Google Scholar] [CrossRef]
- Patel, S.; Hughes, R.; Hester, T.; Stein, J.; Akay, M.; Dy, J.G.; Bonato, P. A novel approach to monitor rehabilitation outcomes in stroke survivors using wearable technology. Proc. IEEE 2010, 98, 450–461. [Google Scholar] [CrossRef]
- Del Din, S.; Patel, S.; Cobelli, C.; Bonato, P. Estimating Fugl-Meyer clinical scores in stroke survivors using wearable sensors. In Proceedings of the 2011 Annual International Conference of the IEEE Engineering in Medicine and Biology Society, Boston, MA, USA, 30 August–3 September 2011; pp. 5839–5842. [Google Scholar]
- Rodriguez-Galiano, V.F.; Ghimire, B.; Rogan, J.; Chica-Olmo, M.; Rigol-Sanchez, J.P. An assessment of the effectiveness of a random forest classifier for land-cover classification. ISPRS J. Photogramm. Remote Sens. 2012, 67, 93–104. [Google Scholar] [CrossRef]
- Golyandina, N.; Nekrutkin, V.; Zhigljavsky, A.A. Analysis of Time Series Structure: SSA and Related Techniques; CRC Press: Boca Raton, FL, USA, 2001. [Google Scholar]
- Wang, Q.; Kurillo, G.; Ofli, F.; Bajcsy, R. Evaluation of pose tracking accuracy in the first and second generations of microsoft kinect. In Proceedings of the 2015 International Conference on Healthcare Informatics, Dallas, TX, USA, 21–23 October 2015; pp. 380–389. [Google Scholar]
- Sheng, B.; Wang, X.; Hou, M.; Huang, J.; Xiong, S.; Zhang, Y. An automated system for motor function assessment in stroke patients using motion sensing technology: A pilot study. Measurement 2020, 161, 107896. [Google Scholar] [CrossRef]
- Balasubramanian, S.; Melendez-Calderon, A.; Burdet, E. A robust and sensitive metric for quantifying movement smoothness. IEEE Trans. Biomed. Eng. 2011, 59, 2126–2136. [Google Scholar] [CrossRef] [PubMed]
- Ozturk, A.; Tartar, A.; Huseyinsinoglu, B.E.; Ertas, A.H. A clinically feasible kinematic assessment method of upper extremity motor function impairment after stroke. Measurement 2016, 80, 207–216. [Google Scholar] [CrossRef]
- Scano, A.; Molteni, F.; Molinari Tosatti, L. Low-cost tracking systems allow fine biomechanical evaluation of upper-limb daily-life gestures in healthy people and post-stroke patients. Sensors 2019, 19, 1224. [Google Scholar] [CrossRef] [PubMed] [Green Version]
- Ma, Y.; Liu, D.; Cai, L. Deep learning-based upper limb functional assessment using a single Kinect v2 sensor. Sensors 2020, 20, 1903. [Google Scholar] [CrossRef] [PubMed] [Green Version]
- Song, X.; Chen, S.; Jia, J.; Shull, P.B. Cellphone-Based Automated Fugl-Meyer Assessment to Evaluate Upper Extremity Motor Function After Stroke. IEEE Trans. Neural Syst. Rehabil. Eng. 2019, 27, 2186–2195. [Google Scholar] [CrossRef] [PubMed]
- Held, J.P.; Klaassen, B.; Eenhoorn, A.; Beijnum, B.J.F.v.; Buurke, J.H.; Veltink, P.H.; Luft, A.R. Inertial sensor measurements of upper-limb kinematics in stroke patients in clinic and home environment. Front. Bioeng. Biotechnol. 2018, 6, 27. [Google Scholar] [CrossRef] [PubMed] [Green Version]
- Formstone, L.; Huo, W.; Wilson, S.; McGregor, A.; Bentley, P.; Vaidyanathan, R. Quantification of Motor Function Post-stroke using Novel Combination of Wearable Inertial and Mechanomyographic Sensors. IEEE Trans. Neural Syst. Rehabil. Eng. 2021, 29, 1158–1167. [Google Scholar] [CrossRef] [PubMed]


| Category 2 | Motion 3 | FMA Item | Sensors 4 |
|---|---|---|---|
| Reflex activity | 1. Flexors | ||
| 2. Extensors | |||
| Shoulder/Elbow Volitional movement within synergies | I | 3. Shoulder elevation | RS |
| 4. Shoulder retraction | RS | ||
| 5. Shoulder abduction(90) | RS | ||
| 6. Shoulder external rotation | RS | ||
| 7. Elbow flexion | RS | ||
| 8. Forearm supination | RS | ||
| 9. Shoulder adduction/internal rotation | RS | ||
| 10. Elbow extension | RS | ||
| 11. Forearm pronation | RS | ||
| Shoulder/Elbow Volitional movement mixing synergies | II | 12. Hand to lumbar spine | RS |
| III | 13. Shoulder flexion 0∼90 | RS | |
| Shoulder/Elbow Volitional movement with little or no synergy | V | 15. Shoulder abduction 0∼90 | RS |
| III | 16. Shoulder flexion 90∼180 | RS | |
| Normal reflex activity | 18. Biceps, triceps, finger flexors | ||
| Wrist/Hand | IV + VI | 14. Forearm pronation-supination with elbow 90 | RS + LM |
| III + VI | 17. Forearm pronation-supination with elbow 0 | RS + LM | |
| VII | 19. Stability at dorsiflexion with elbow 90 | LM | |
| 20. Repeated dorsiflexion/volar flexion with elbow 90 | LM | ||
| VII | 21. Stability at dorsiflexion with elbow 0 | LM | |
| 22. Repeated dorsiflexion/volar flexion with elbow 0 | LM | ||
| VIII | 23. Circumduction | LM | |
| IX | 24. Mass flexion | LM | |
| 25. Mass extension | LM | ||
| Grasp | X | 26. Hook grasp | FSRs |
| XI | 27. Thumb adduction | FSRs | |
| XII | 28. Pincer grasp | FSRs | |
| XIII | 29. Cylinder grasp | FSRs | |
| XIV | 30. Sphere grasp | FSRs | |
| Coordination/Speed | XV | 31. Tremor | RS |
| 32. Dysmetria | RS | ||
| 33. Time | RS |
| Data Source | RealSense D435 | Leap Motion | Force Sensitive Resistors |
|---|---|---|---|
| Sampling frequency | 30 fps | 200 fps | 10 Hz |
| Experimental protocol | Perform motions I–V, XV | Perform motions VI-IX | Grasp 5 specified tools |
| Original data format | Color and depth images | Hand tracking data | Voltage and force |
| Features1 | 3D coordinates of joints () | Angles () | Force () |
| Sample Size | 20 subjects × 2 repetitions | 20 subjects | 20 subjects |
| Category | FMA Item | Feature Category/Symbol | Feature |
|---|---|---|---|
| Shoulder/Elbow | 3–17 (except 14,17) | Endpoint | Path length of the endpoint |
| Max velocity | |||
| Mean velocity | |||
| Velocity variance | |||
| Spectral arc length | |||
| Dimensionless jerk | |||
| Angle (Shoulder flexion, shoulder adduction, shoulder rotation, elbow flexion) | Range of motion (ROM) | ||
| Max angle | |||
| Min angle | |||
| Max angular velocity | |||
| Mean angular velocity | |||
| Angular velocity variance | |||
| Others | Inter-joint coordination index | ||
| Time | |||
| Max shoulder joint displacement (X, Y, Z) | |||
| Trunk compensation | |||
| Wrist/Hand | 14 | Max elbow flexion angle and forearm angle | |
| 17 | Max shoulder flexion angle and forearm angle | ||
| 19–22 | Wrist pitch angle (max, min) | ||
| 23 | Wrist pitch angle and yaw angle (max, min) | ||
| 24, 25 | Finger tip anlge and hand grab strength (max, min) | ||
| Grasp | 26–30 | Max voltage and force | |
| Coordination/Speed | 31 | Spectral arc length | |
| 32 | Min relative distance between wrist and nose | ||
| 33 | T | Time |
| Index | Age | Sex | Time since Stroke Onset (Month) | Paretic Side | MMSE | Brunnstrom | FMA-UE |
|---|---|---|---|---|---|---|---|
| P1 | 54 | M | 2 | Left | 28 | 2 | 14 |
| P2 | 70 | F | 4 | Right | 29 | 6 | 66 |
| P3 | 51 | M | 1 | Left | 30 | 4 | 54 |
| P4 | 61 | M | 7 | Left | 28 | 3 | 32 |
| P5 | 43 | F | 2 | Left | 29 | 4 | 45 |
| P6 | 70 | F | 24 | Left | 27 | 2 | 9 |
| P7 | 69 | F | 3 | Left | 29 | 5 | 57 |
| P8 | 58 | M | 2 | Right | 30 | 5 | 61 |
| P9 | 58 | M | 4 | Right | 28 | 3 | 20 |
| P10 | 54 | M | 1 | Right | 28 | 2 | 13 |
| P11 | 73 | M | 7 | Left | 24 | 2 | 25 |
| P12 | 68 | M | 2 | Right | 28 | 4 | 28 |
| P13 | 33 | M | 11 | Left | 28 | 4 | 30 |
| P14 | 56 | M | 24 | Right | 29 | 4 | 40 |
| P15 | 74 | M | 2 | Right | 27 | 3 | 16 |
| P16 | 61 | M | 22 | Left | 27 | 2 | 12 |
| P17 | 70 | F | 1 | Left | 28 | 3 | 20 |
| P18 | 58 | M | 5 | Left | 28 | 5 | 55 |
| P19 | 51 | M | 2 | Left | 27 | 3 | 16 |
| P20 | 47 | M | 1 | Left | 28 | 5 | 50 |
| Indicators | Shoulder/Elbow Part | The Other Three Parts | All Four Parts |
|---|---|---|---|
| Accuracy (%) | 88.08 | 75.30 | 80.83 |
| F1-score (%) | 86.59 | 74.58 | 80.97 |
| Precision (%) | 88.70 | 74.27 | 81.11 |
| Sensitivity (%) | 85.81 | 75.22 | 81.22 |
| Specificity (%) | 93.77 | 87.72 | 90.40 |
| Mean absolute error | 0.15 | 0.26 | 0.21 |
Publisher’s Note: MDPI stays neutral with regard to jurisdictional claims in published maps and institutional affiliations. |
© 2022 by the authors. Licensee MDPI, Basel, Switzerland. This article is an open access article distributed under the terms and conditions of the Creative Commons Attribution (CC BY) license (https://creativecommons.org/licenses/by/4.0/).
Share and Cite
Li, Y.; Li, C.; Shu, X.; Sheng, X.; Jia, J.; Zhu, X. A Novel Automated RGB-D Sensor-Based Measurement of Voluntary Items of the Fugl-Meyer Assessment for Upper Extremity: A Feasibility Study. Brain Sci. 2022, 12, 1380. https://0-doi-org.brum.beds.ac.uk/10.3390/brainsci12101380
Li Y, Li C, Shu X, Sheng X, Jia J, Zhu X. A Novel Automated RGB-D Sensor-Based Measurement of Voluntary Items of the Fugl-Meyer Assessment for Upper Extremity: A Feasibility Study. Brain Sciences. 2022; 12(10):1380. https://0-doi-org.brum.beds.ac.uk/10.3390/brainsci12101380
Chicago/Turabian StyleLi, Yue, Chong Li, Xiaokang Shu, Xinjun Sheng, Jie Jia, and Xiangyang Zhu. 2022. "A Novel Automated RGB-D Sensor-Based Measurement of Voluntary Items of the Fugl-Meyer Assessment for Upper Extremity: A Feasibility Study" Brain Sciences 12, no. 10: 1380. https://0-doi-org.brum.beds.ac.uk/10.3390/brainsci12101380