
Pre-Treatment and Preoperative Neutrophil-to-Lymphocyte Ratio Predicts Prognostic Value of Glioblastoma: A Meta-Analysis

Abstract
:1. Introduction
2. Methods
2.1. Identification of Studies and Collection of Data
2.2. Inclusion and Exclusion Criteria
2.3. Quality Assessment
2.4. Statistical Analysis
3. Results
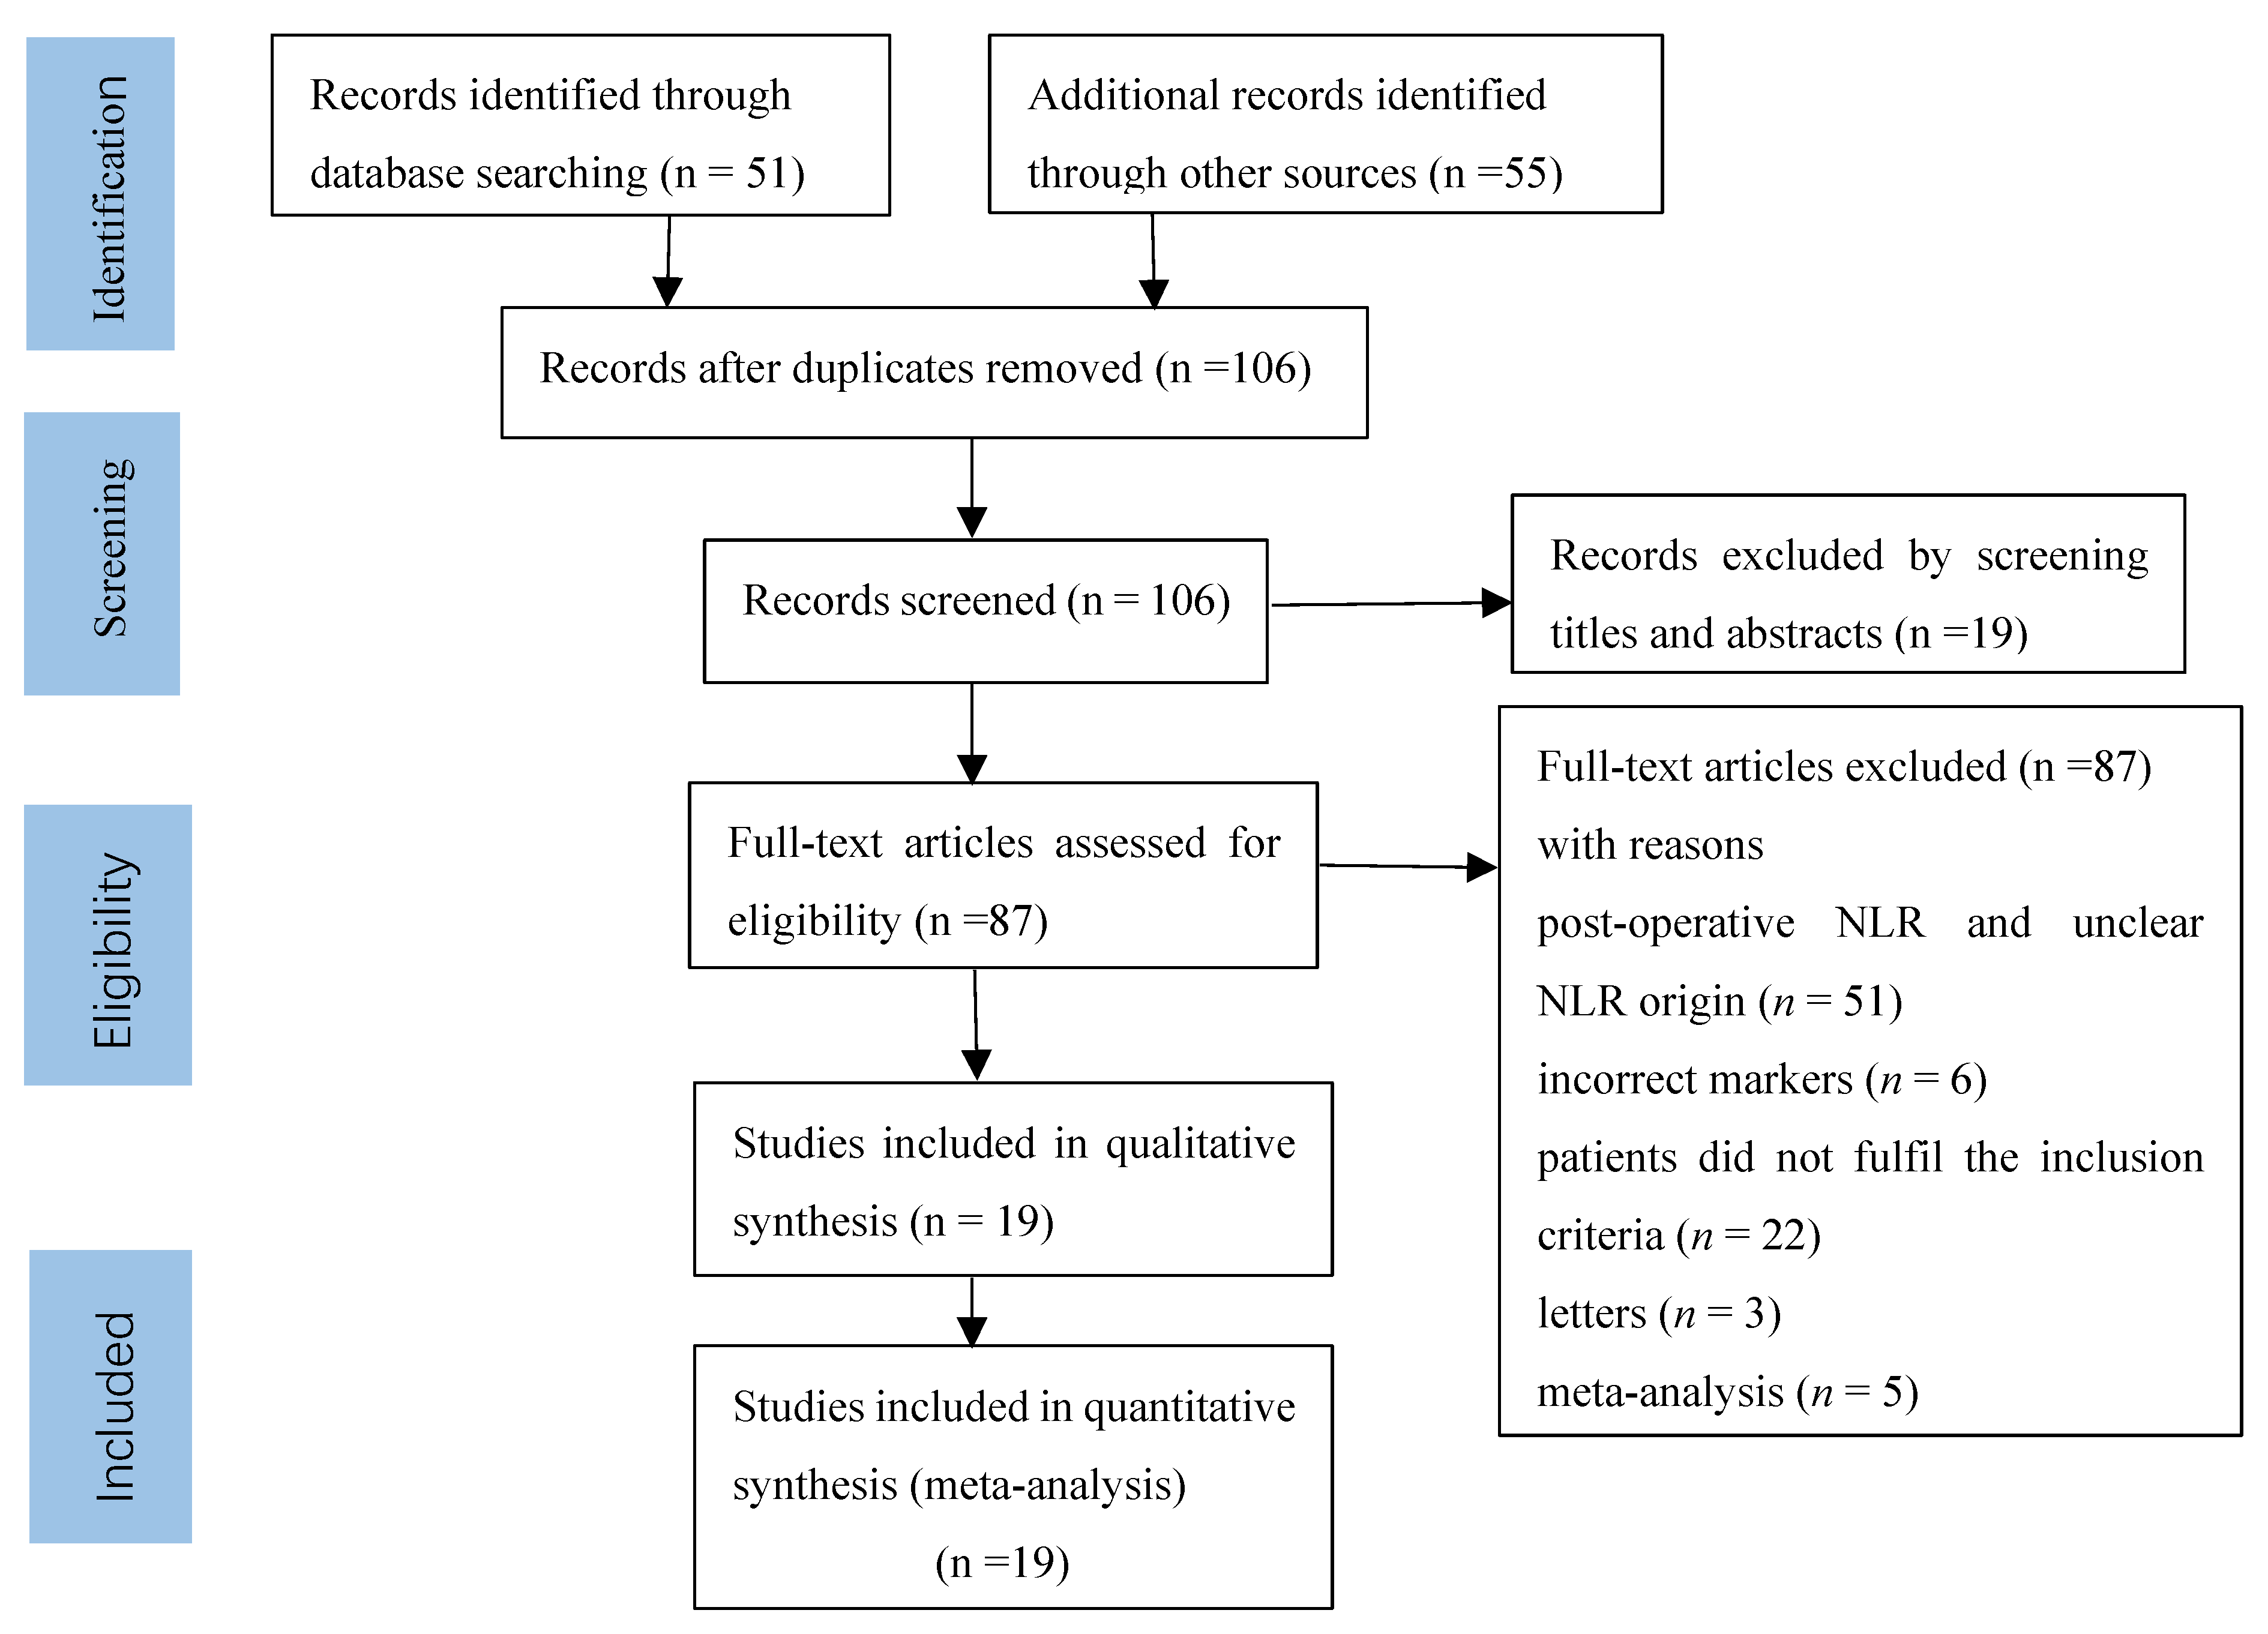
3.1. Search Results
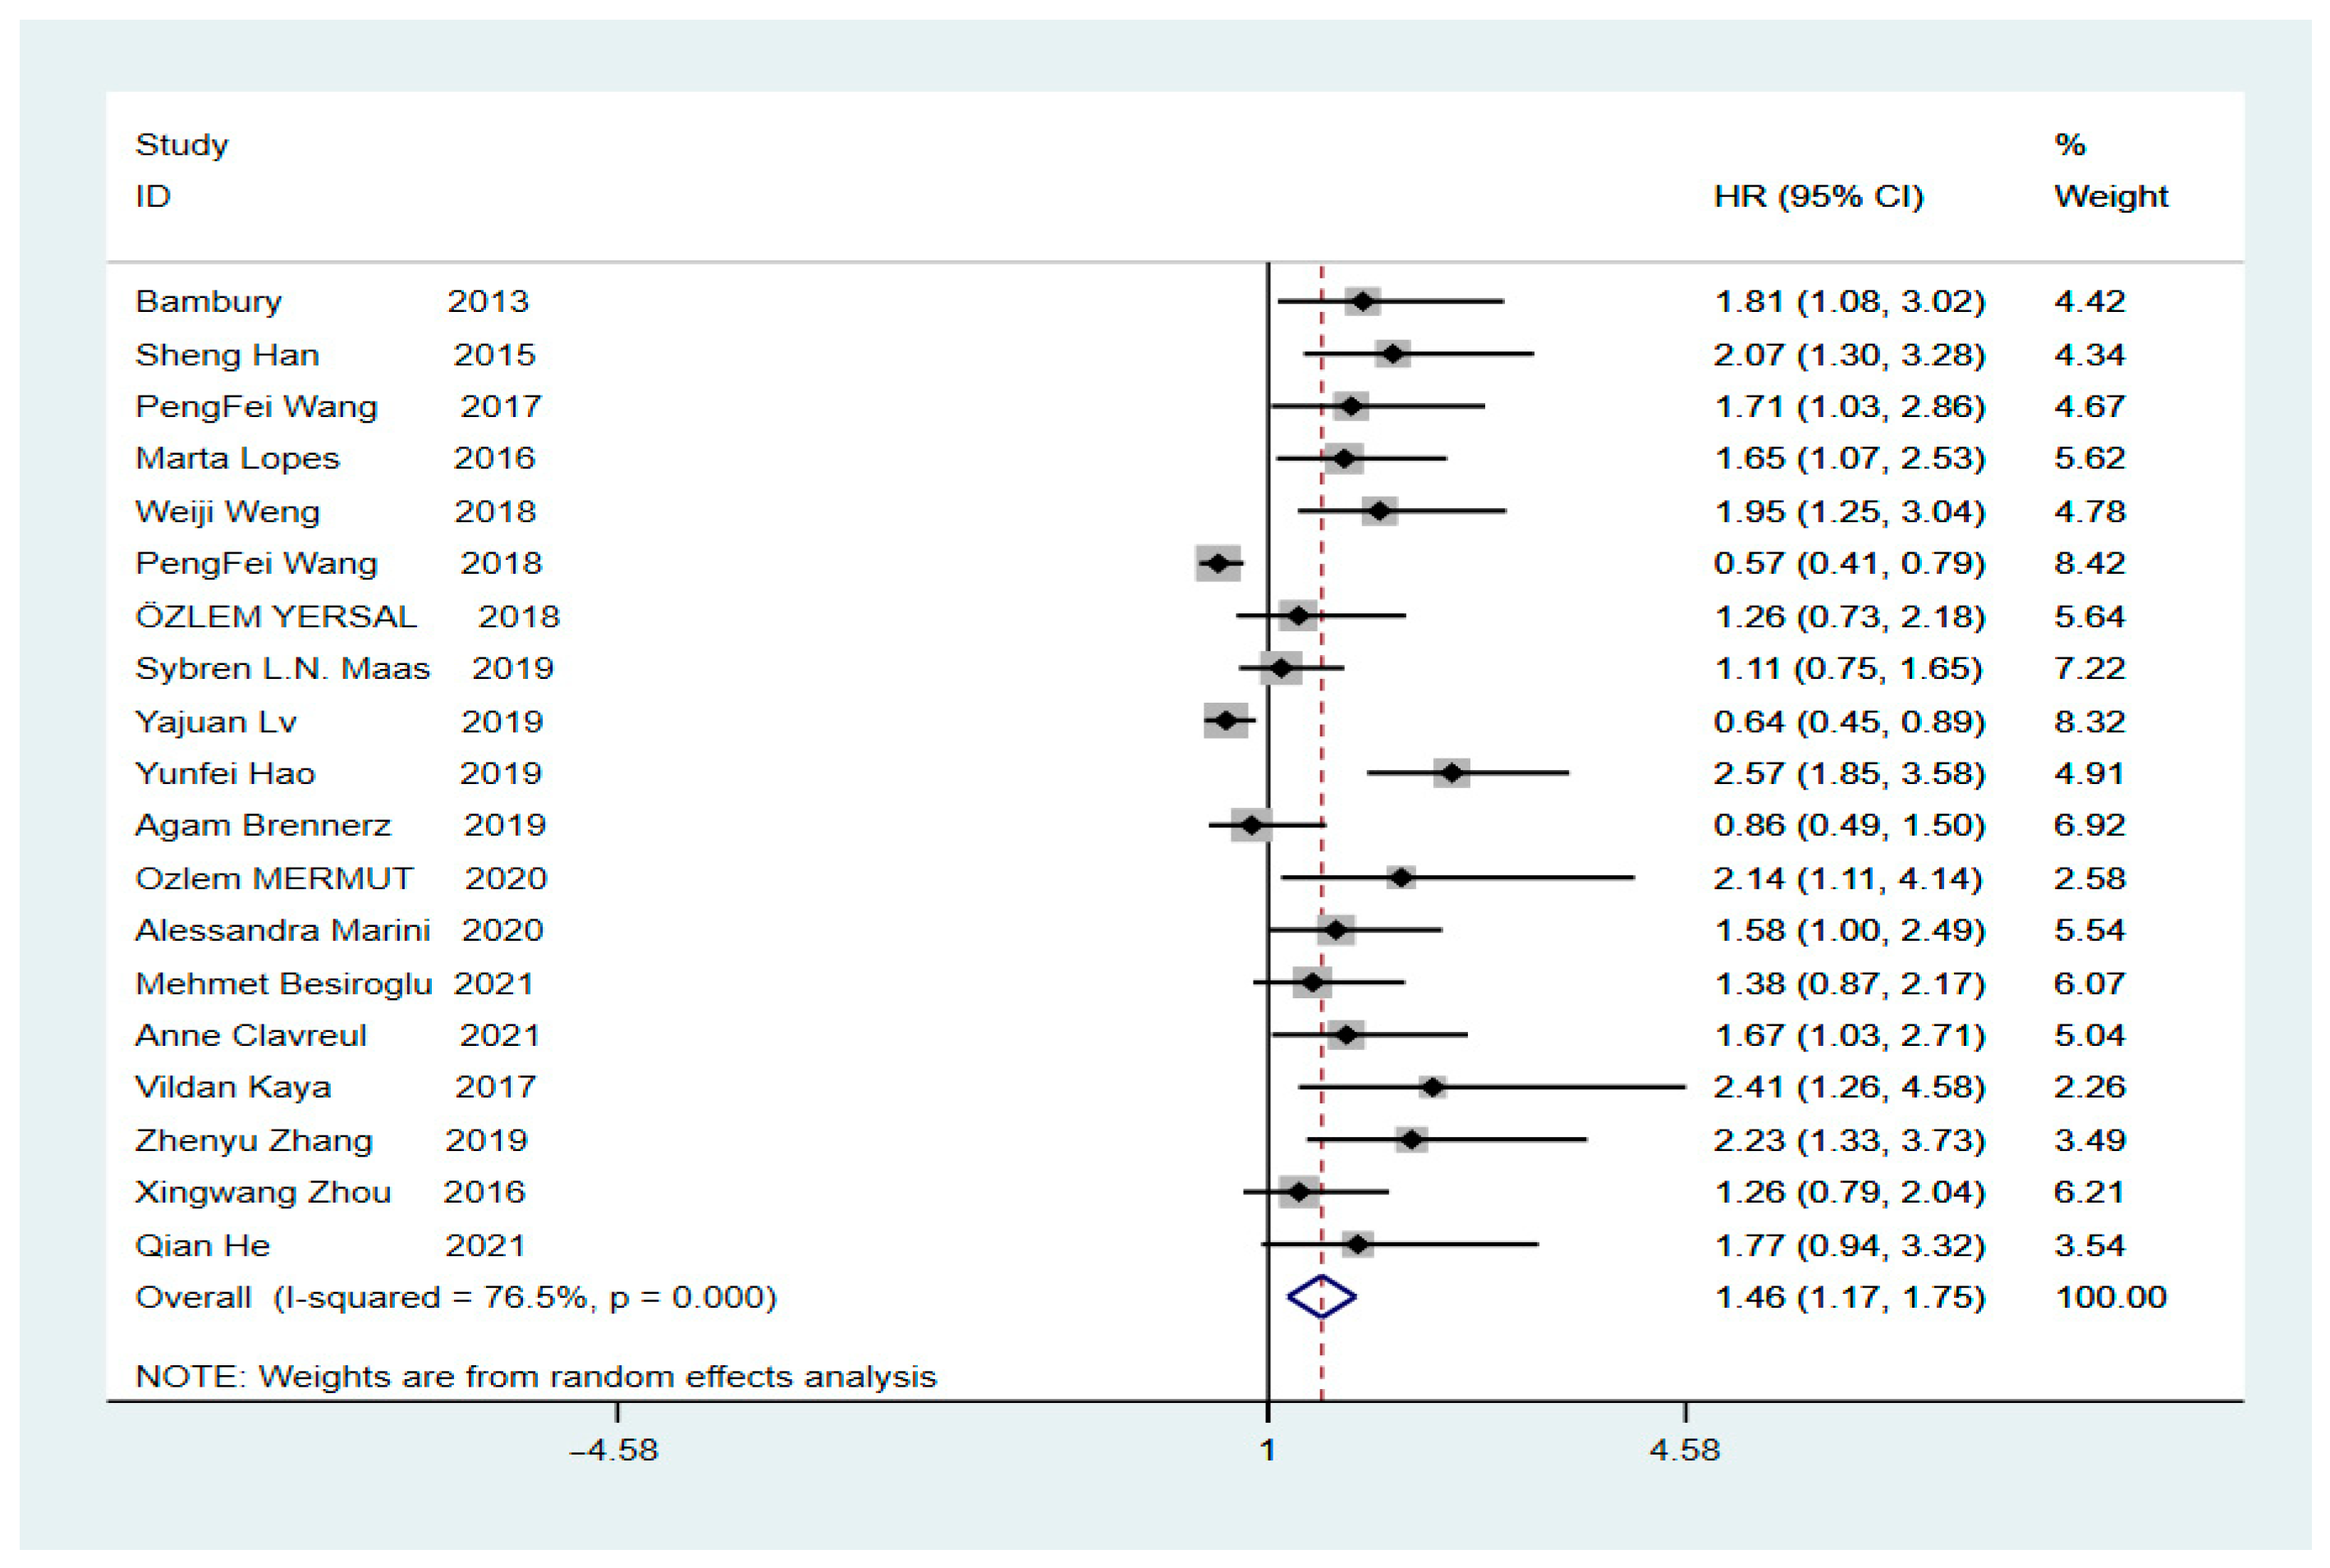
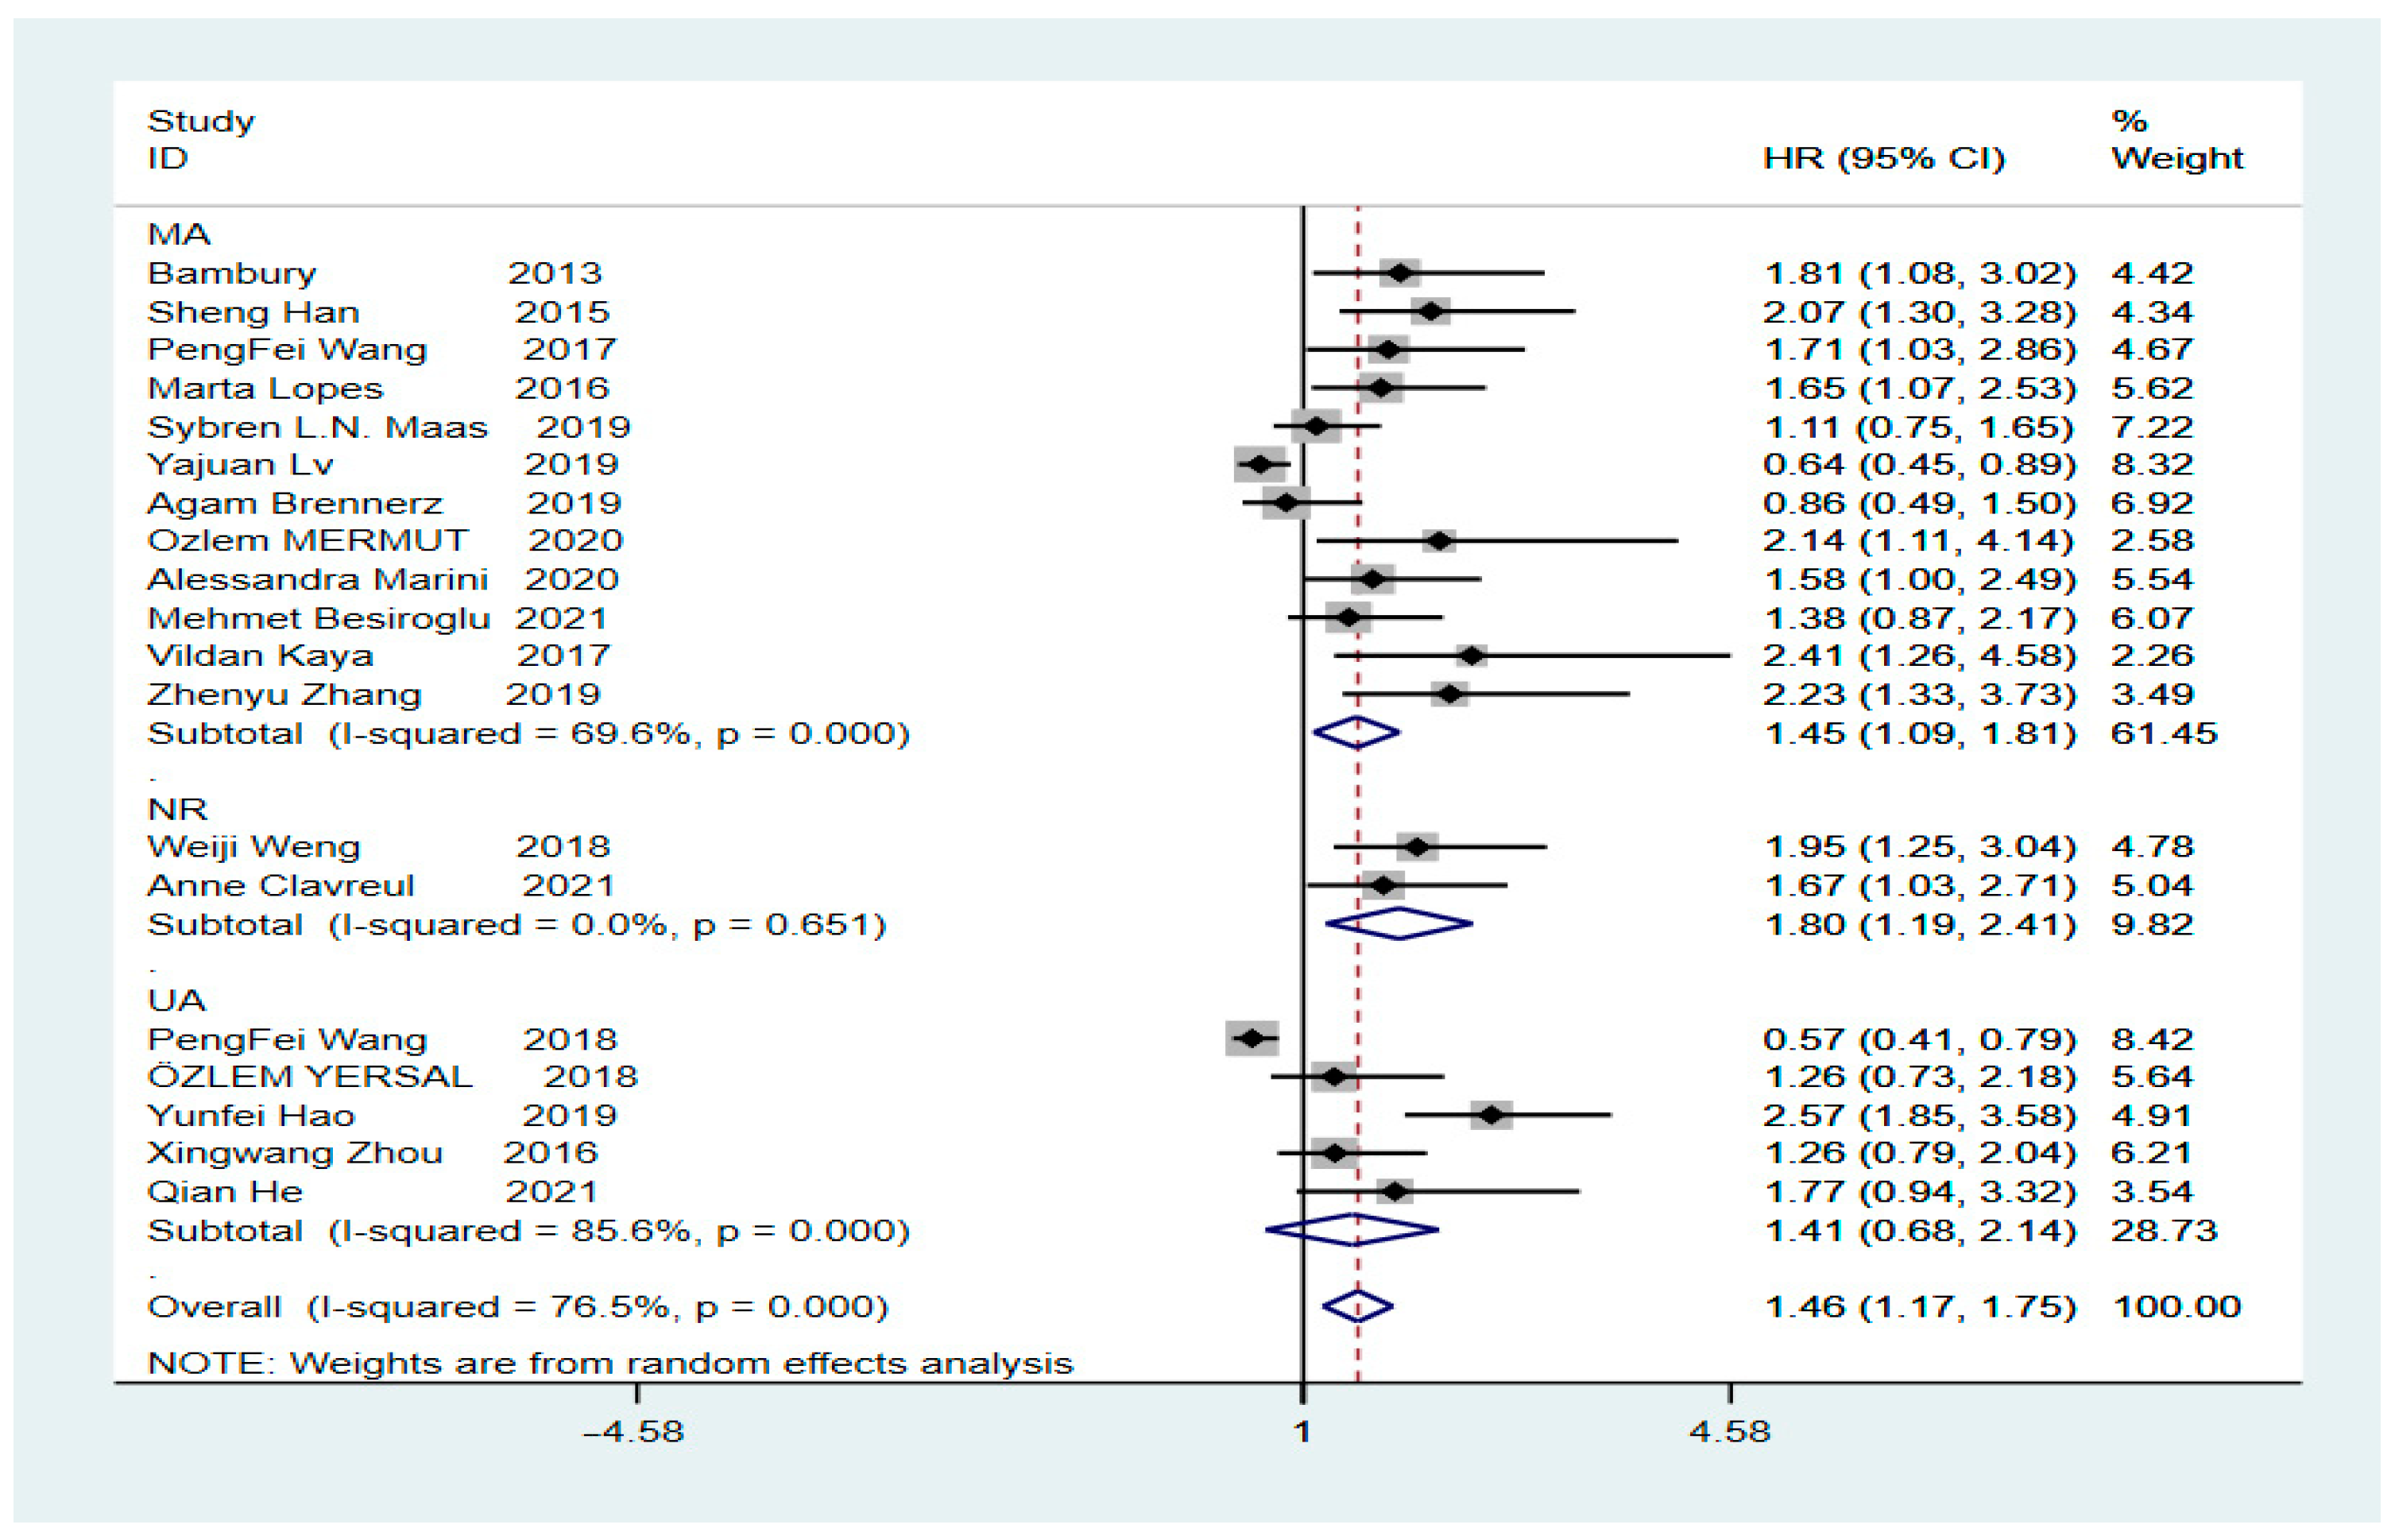
3.2. Correlation between OS and NLR in GBM
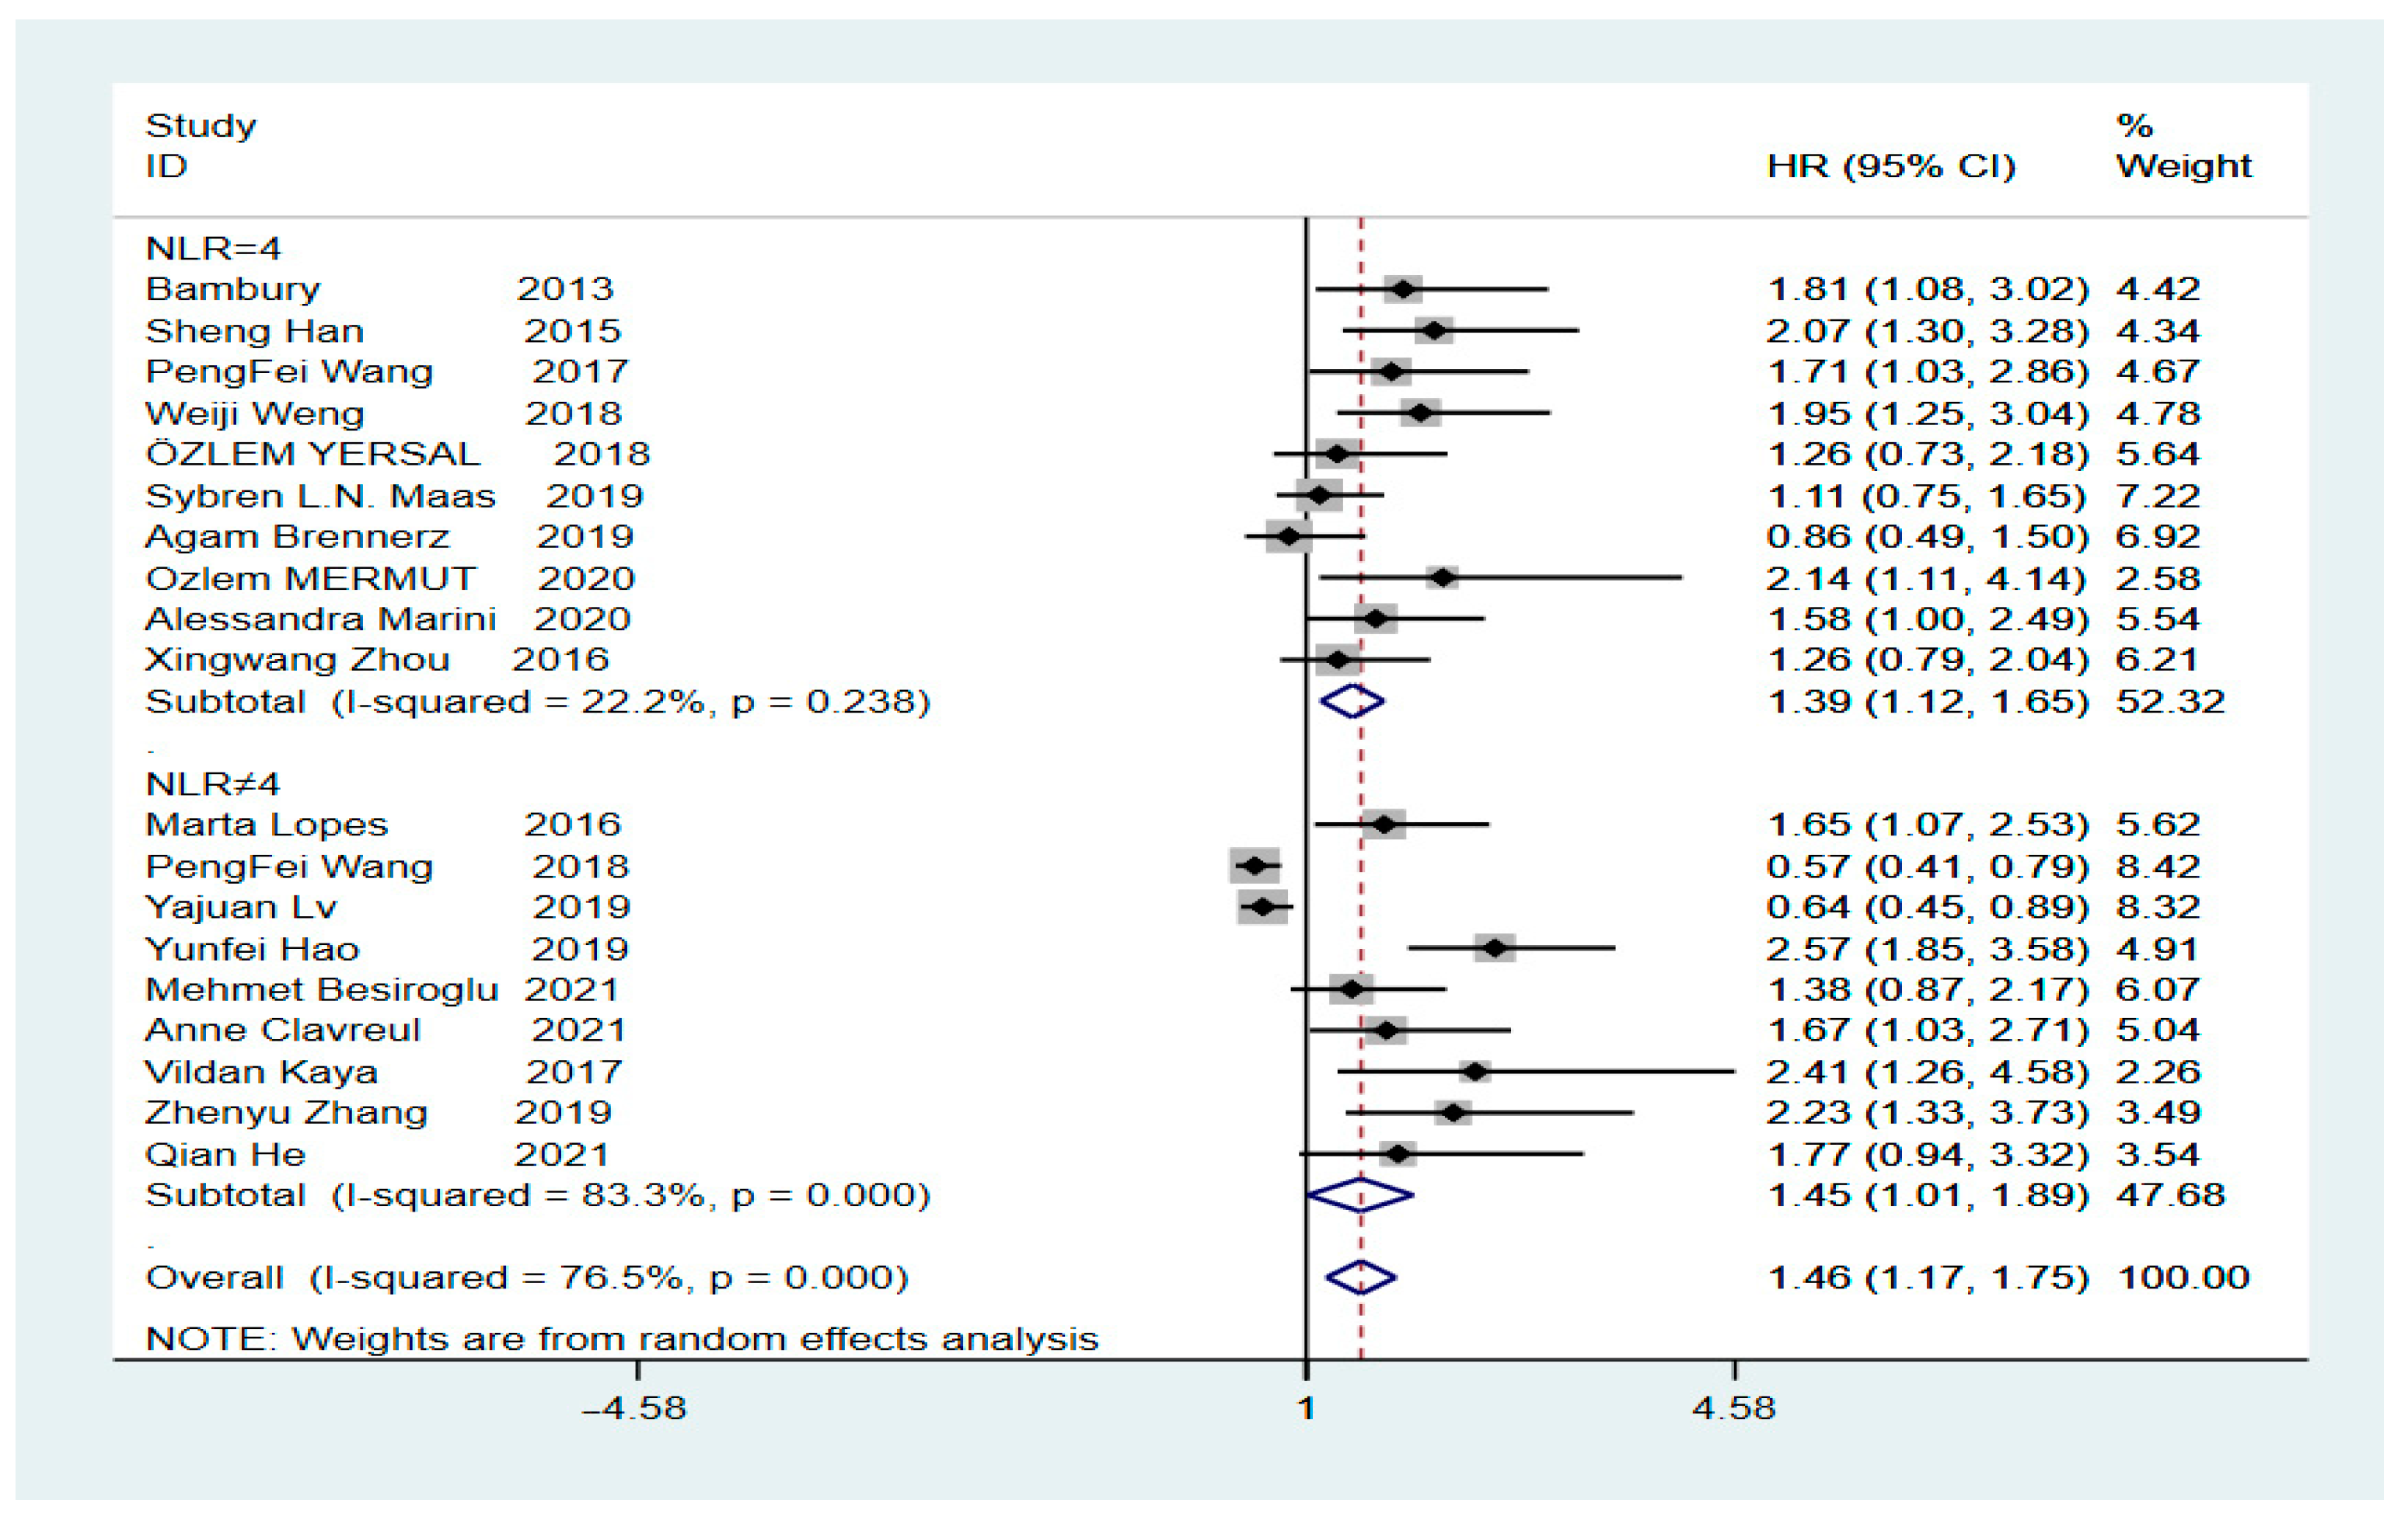
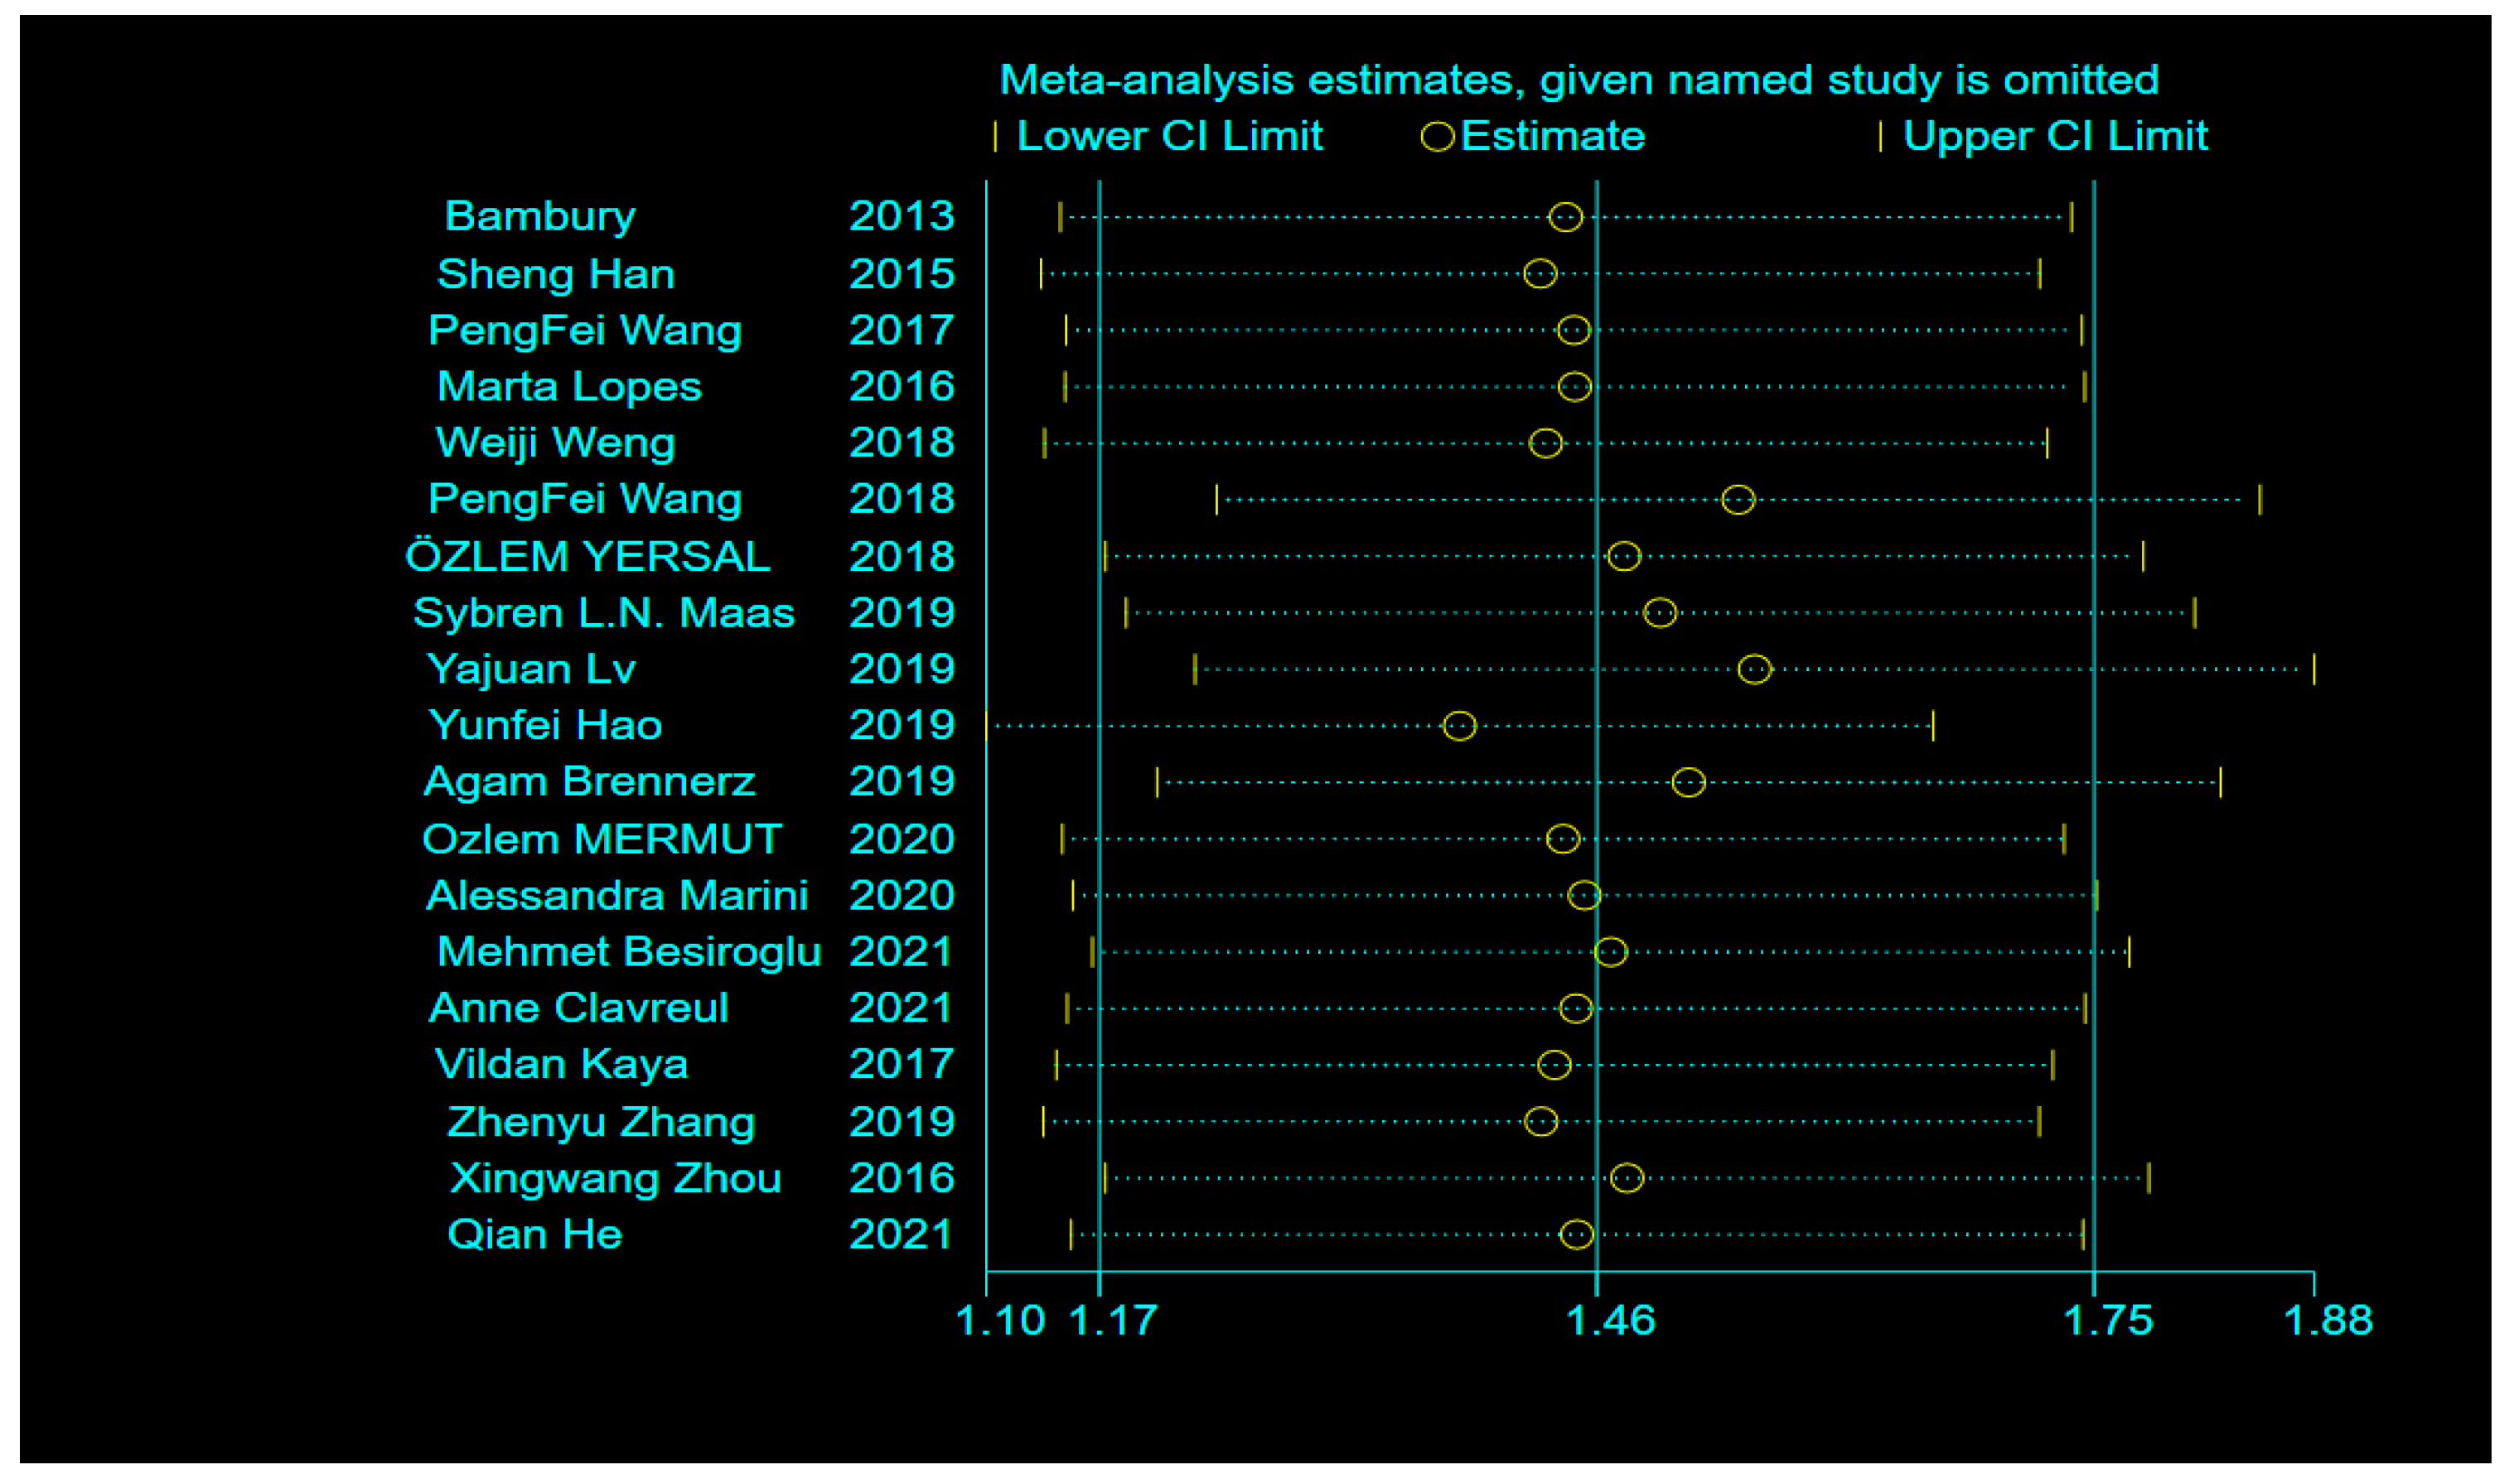
3.3. Heterogeneity and Sensitivity Analysis
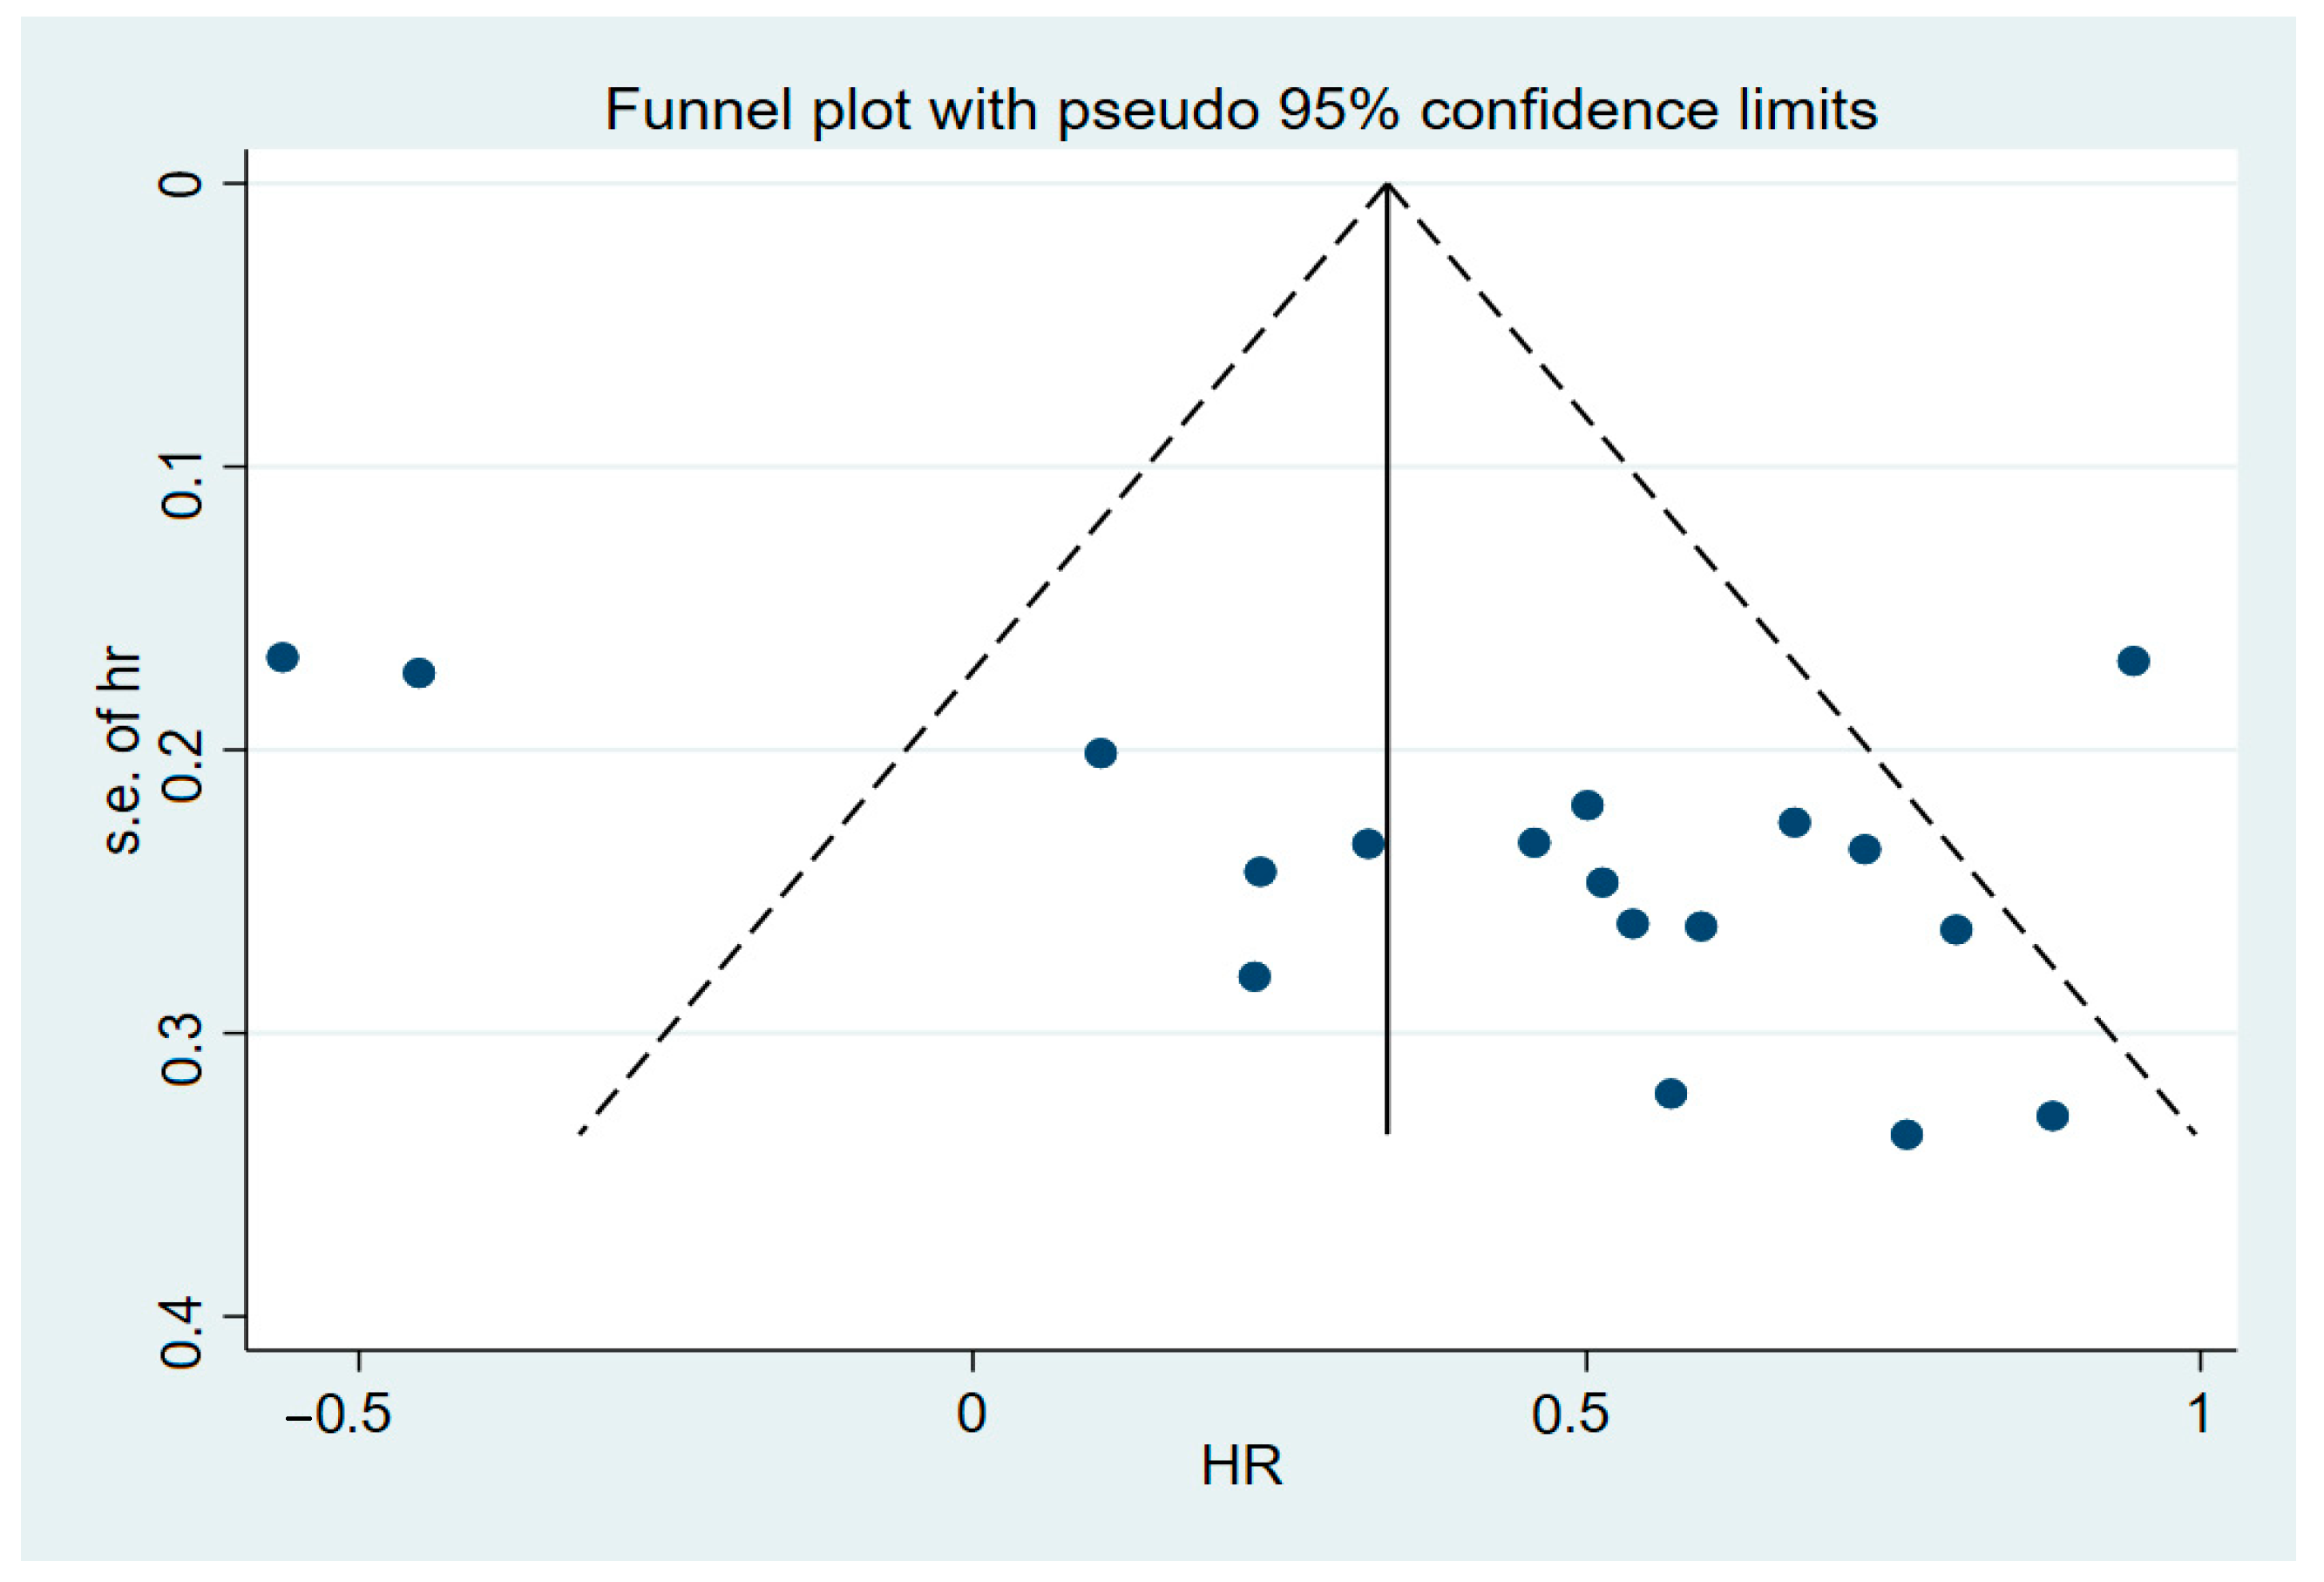
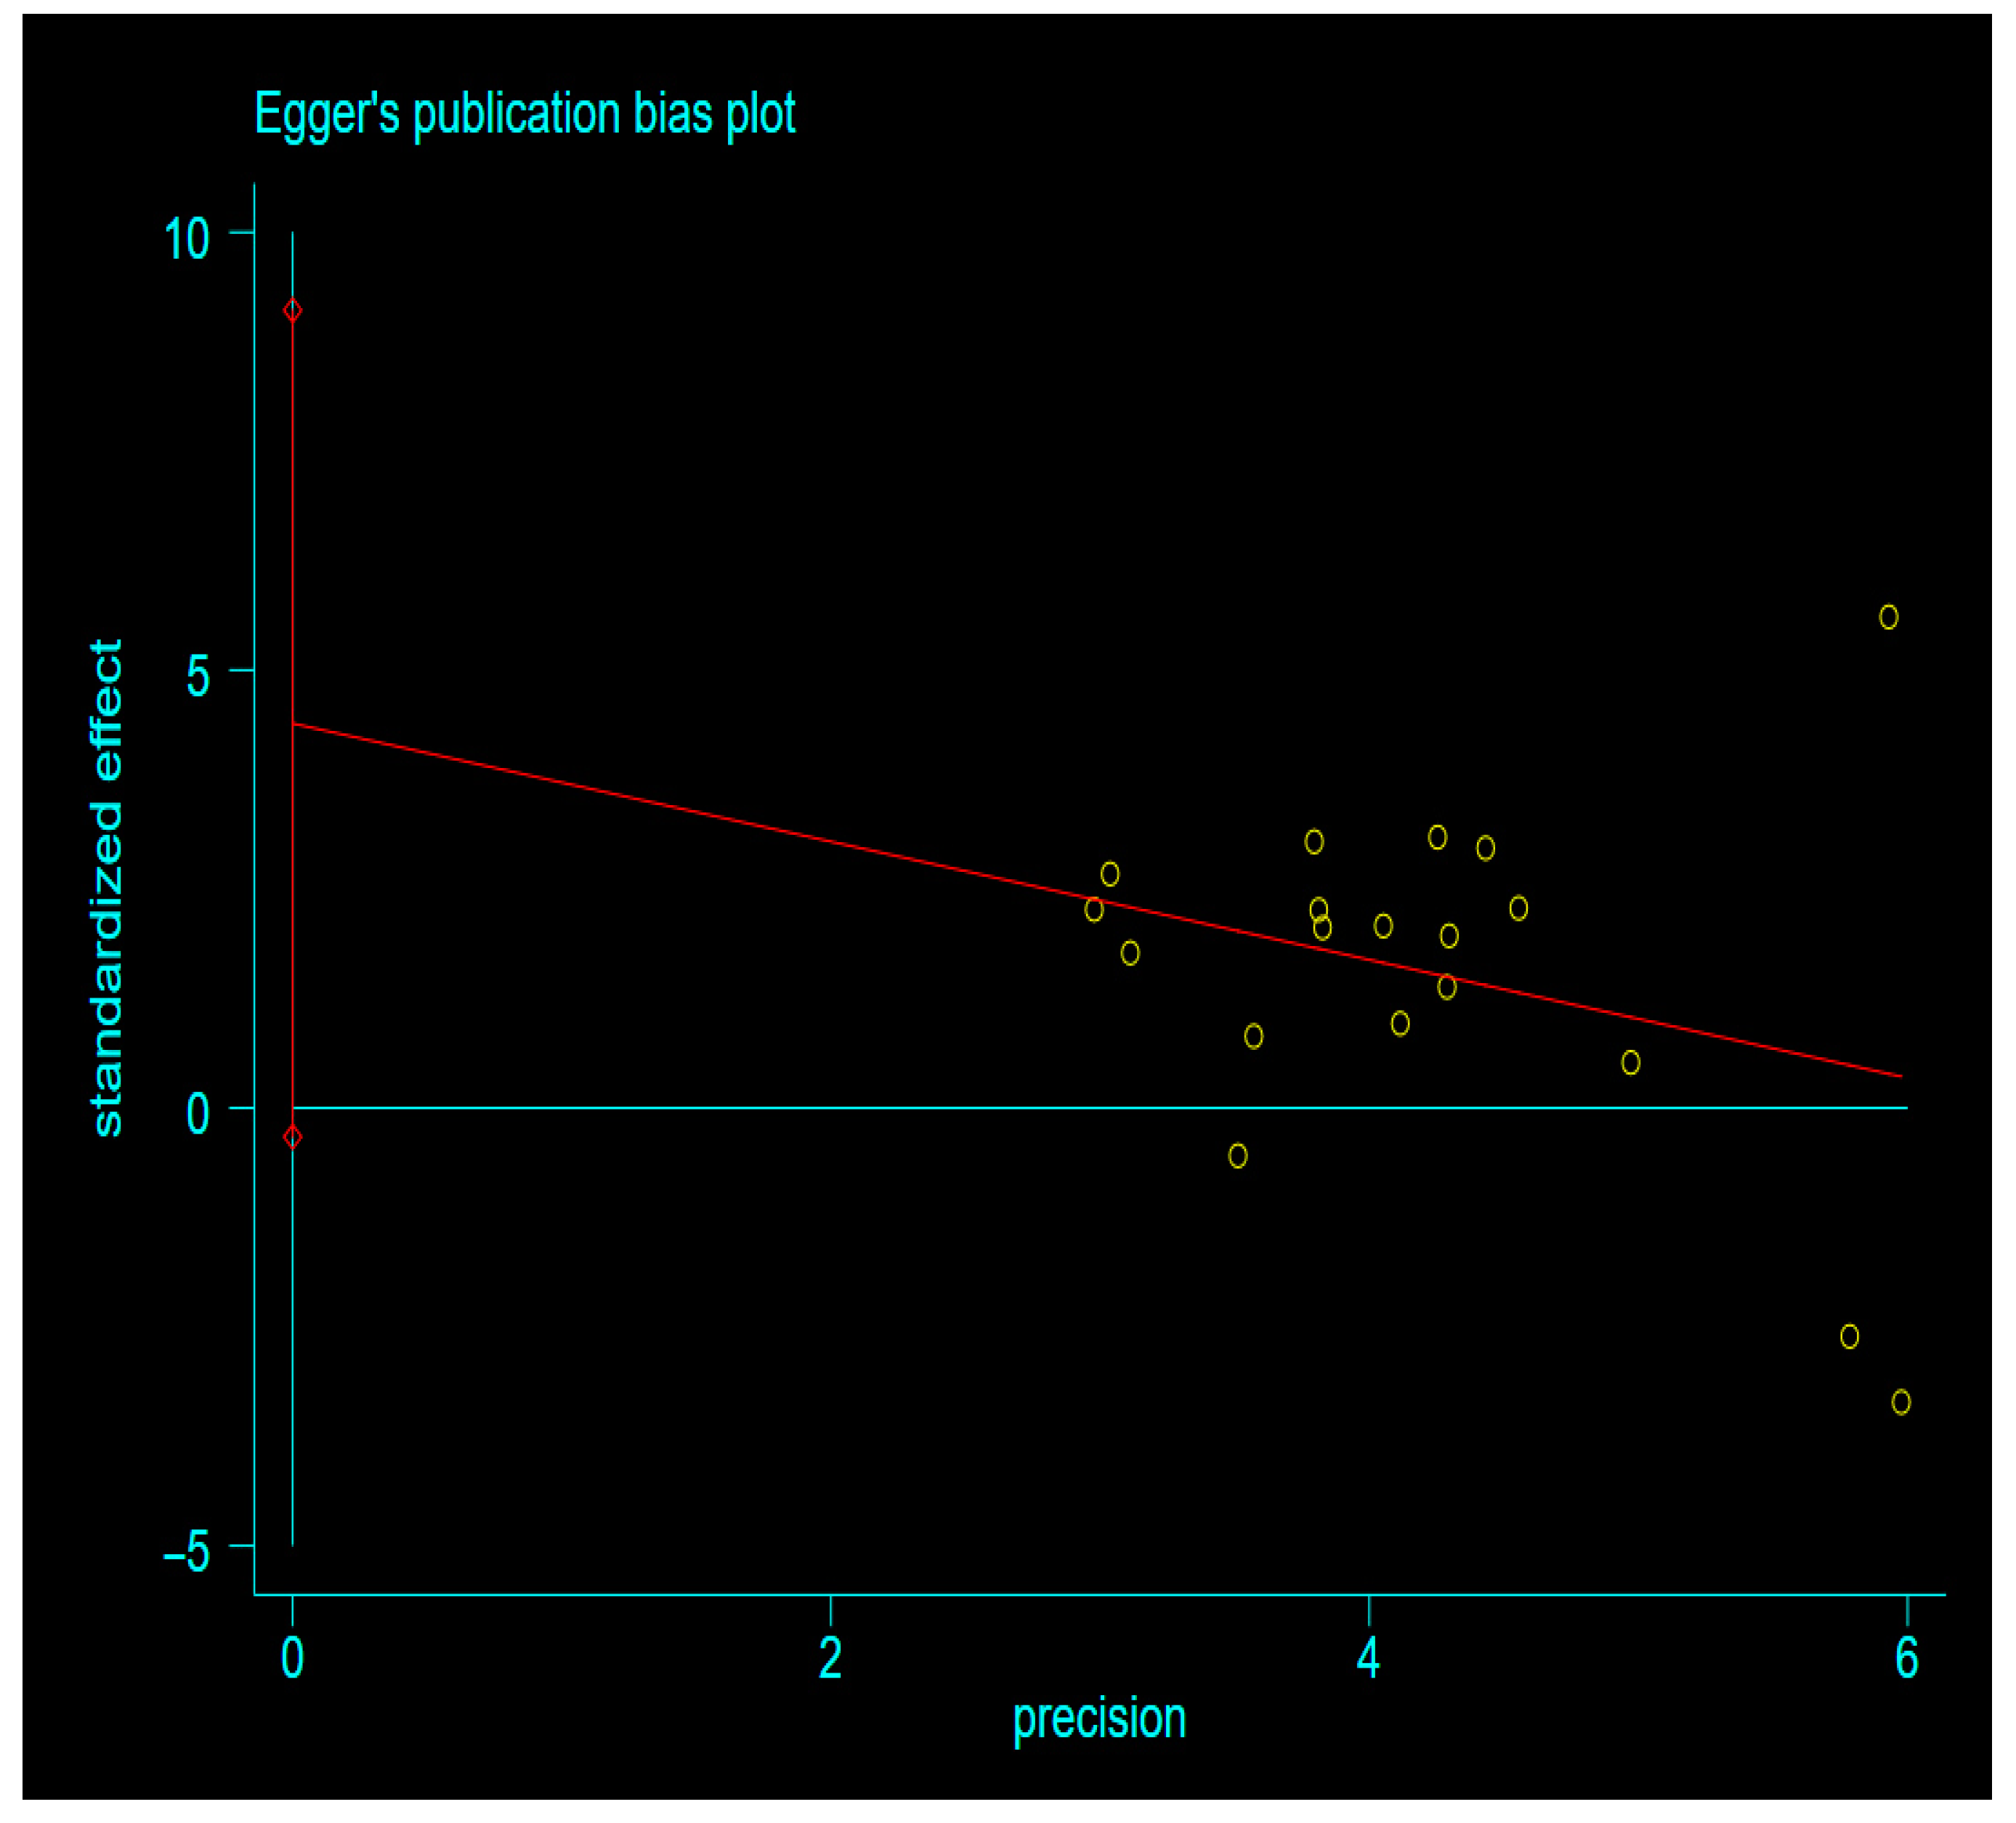
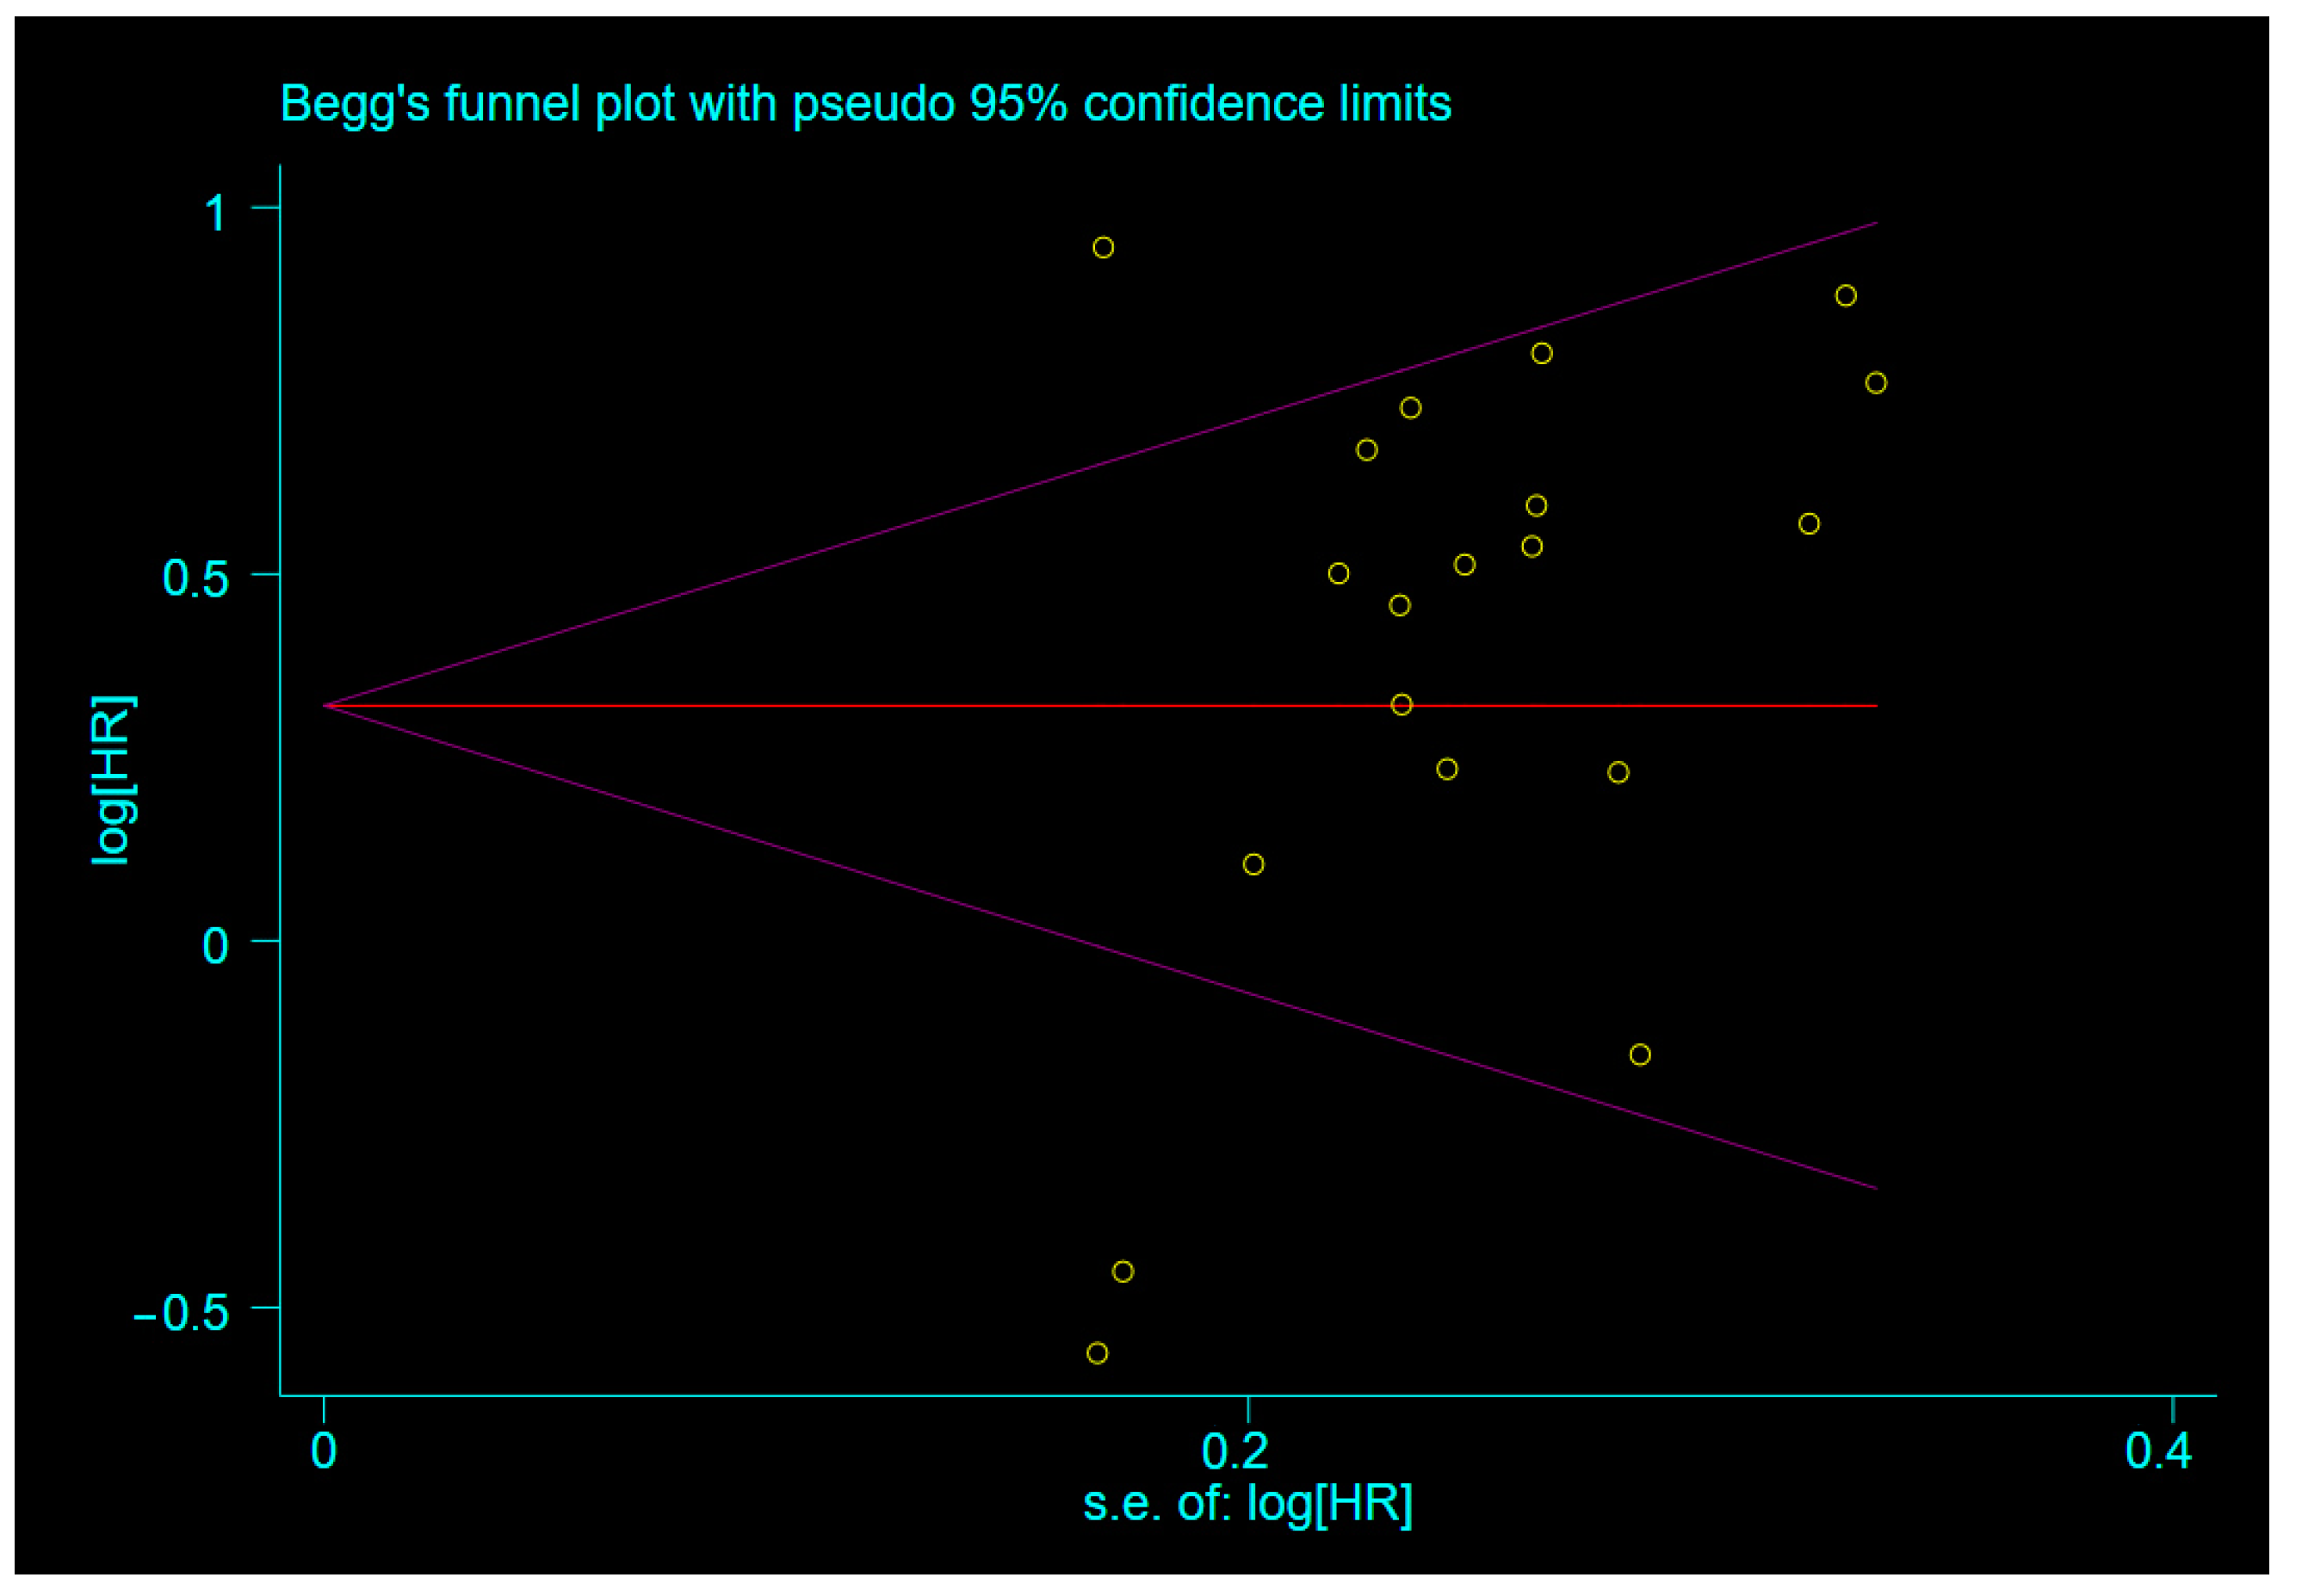
3.4. Publication Bias
4. Discussions
5. Conclusions
Supplementary Materials
Author Contributions
Funding
Institutional Review Board Statement
Informed Consent Statement
Data Availability Statement
Acknowledgments
Conflicts of Interest
Abbreviations and Acronyms
| GBM | glioblastoma |
| OS | overall survival |
| UA | univariate |
| MA | multivariate |
| S + C + T | Stupp + chemoradiotherapy + temozolomide |
| NLR | neutrophil count/lymphocyte count |
| HR | hazard ratio |
| CI | confidence interval |
| NR | not reported |
| NOS | Newcastle-Ottawa quality assessment |
Appendix A


References
- Lapointe, S.; Perry, A.; Butowski, N.A. Primary brain tumours in adults. Lancet 2018, 392, 432–446. [Google Scholar] [CrossRef]
- Stupp, R.; Mason, W.P.; Van Den Bent, M.J.; Weller, M.; Fisher, B.; Taphoorn, M.J.B.; Belanger, K.; Brandes, A.A.; Marosi, C.; Bogdahn, U.; et al. Radiotherapy plus concomitant and adjuvant temozolomide for glioblastoma. N. Engl. J. Med. 2005, 352, 987–996. [Google Scholar] [CrossRef] [PubMed]
- Aum, D.J.; Kim, D.H.; Beaumont, T.L.; Leuthardt, E.C.; Dunn, G.P.; Kim, A.H. Molecular and cellular heterogeneity: The hallmark of glioblastoma. Neurosurg. Focus 2014, 37, E11. [Google Scholar] [CrossRef] [PubMed] [Green Version]
- Bambury, R.M.; Teo, M.Y.; Power, D.G.; Yusuf, A.; Murray, S.; Battley, J.E.; Drake, C.; O’Dea, P.; Bermingham, N.; Keohane, C.; et al. The association of pre-treatment neutrophil to lymphocyte ratio with overall survival in patients with glioblastoma multiforme. J. Neuro Oncology 2013, 114, 149–154. [Google Scholar] [CrossRef] [PubMed]
- McNamara, M.G.; Lwin, Z.; Jiang, H.; Templeton, A.J.; Zadeh, G.; Bernstein, M.; Chung, C.; Millar, B.-A.; Laperriere, N.; Mason, W.P. Factors impacting survival following second surgery in patients with glioblastoma in the temozolomide treatment era, incorporating neutrophil/lymphocyte ratio and time to first progression. J. Neurooncol. 2014, 117, 147–152. [Google Scholar] [CrossRef] [PubMed]
- Szkandera, J.; Absenger, G.; Liegl-Atzwanger, B.; Pichler, M.; Stotz, M.; Samonigg, H.; Glehr, M.; Zacherl, M.; Stojakovic, T.; Gerger, A.; et al. Elevated preoperative neutrophil/lymphocyte ratio is associated with poor prognosis in soft-tissue sarcoma patients. Br. J. Cancer 2013, 108, 1677–1683. [Google Scholar] [CrossRef] [PubMed] [Green Version]
- Feng, J.-F.; Huang, Y.; Chen, Q.-X. Preoperative platelet lymphocyte ratio (PLR) is superior to neutrophil lymphocyte ratio (NLR) as a predictive factor in patients with esophageal squamous cell carcinoma. World J. Surg. Oncol. 2014, 12, 58. [Google Scholar] [CrossRef] [Green Version]
- Lee, Y.-Y.; Choi, C.H.; Kim, H.-J.; Kim, T.-J.; Lee, J.-W.; Lee, J.-H.; Bae, D.-S.; Kim, B.-G. Pretreatment neutrophil:lymphocyte ratio as a prognostic factor in cervical carcinoma. Anticancer Res. 2012, 32, 1555–1561. [Google Scholar]
- Han, S.; Liu, Y.; Li, Q.; Li, Z.; Hou, H.; Wu, A. Pre-treatment neutrophil-to-lymphocyte ratio is associated with neutrophil and T-cell infiltration and predicts clinical outcome in patients with glioblastoma. BMC Cancer 2015, 15, 617. [Google Scholar] [CrossRef] [Green Version]
- Malietzis, G.; Giacometti, M.; Kennedy, R.H.; Athanasiou, T.; Aziz, O.; Jenkins, J.T. The Emerging Role of Neutrophil to Lymphocyte Ratio in Determining Colorectal Cancer Treatment Outcomes: A Systematic Review and Meta-Analysis. Ann. Surg. Oncol. 2014, 21, 3938–3946. [Google Scholar] [CrossRef]
- Rutledge, W.C.; Kong, J.; Gao, J.; Gutman, D.A.; Cooper, L.A.; Appin, C.; Park, Y.; Scarpace, L.; Mikkelsen, T.; Cohen, M.L.; et al. Tumor-Infiltrating Lymphocytes in Glioblastoma Are Associated with Specific Genomic Alterations and Related to Transcriptional Class. Clin. Cancer Res. 2013, 19, 4951–4960. [Google Scholar] [CrossRef] [PubMed] [Green Version]
- Lohr, J.; Ratliff, T.; Huppertz, A.; Ge, Y.; Dictus, C.; Ahmadi, R.; Grau, S.; Hiraoka, N.; Eckstein, V.; Ecker, C.R.; et al. Effector T-cell infiltration positively impacts survival of glioblastoma patients and is impaired by tumor-derived TGF-beta. Clin. Cancer Res. 2011, 17, 4296–4308. [Google Scholar] [CrossRef] [PubMed] [Green Version]
- Liang, J.; Piao, Y.; Holmes, L.; Fuller, G.; Henry, V.; Tiao, N.; De Groot, J.F. Neutrophils Promote the Malignant Glioma Phenotype through S100A4. Clin. Cancer Res. 2013, 20, 187–198. [Google Scholar] [CrossRef] [PubMed] [Green Version]
- Fossati, G.; Ricevuti, G.; Edwards, S.W.; Walker, C.; Dalton, A.; Rossi, M.L. Neutrophil infiltration into human gliomas. Acta Neuropathol. 1999, 98, 349–354. [Google Scholar] [CrossRef]
- Lei, Y.-Y.; Li, Y.-T.; Hu, Q.-L.; Wang, J.; Sui, A.-X. Prognostic impact of neutrophil-to-lymphocyte ratio in gliomas: A systematic review and meta-analysis. World J. Surg. Oncol. 2019, 17, 152. [Google Scholar] [CrossRef] [Green Version]
- Wang, D.; Kang, K.; Lin, Q.; Hai, J. Prognostic Significance of Preoperative Systemic Cellular Inflammatory Markers in Gliomas: A Systematic Review and Meta-Analysis. Clin. Transl. Sci. 2020, 13, 179–188. [Google Scholar] [CrossRef]
- Yang, C.; Wen, H.B.; Zhao, Y.H.; Huang, W.H.; Wang, Z.F.; Li, Z.Q. Systemic Inflammatory Indicators as Prognosticators in Glioblastoma Patients: A Comprehensive Meta-Analysis. Front. Neurol. 2020, 11, 580101. [Google Scholar] [CrossRef]
- Dos Santos, A.G.; de Carvalho, R.F.; Morais, A.N.L.R.; Silva, T.M.; RibeiroBaylão, V.M.; Azevedo, M.; de Oliveira, A.J.M. Role of neutrophil-lymphocyte ratio as a predictive factor of glioma tumor grade: A systematic review. Crit. Rev. Oncol. Hematol. 2021, 163, 103372. [Google Scholar] [CrossRef]
- He, Q.; Li, L.; Ren, Q. The Prognostic Value of Preoperative Systemic Inflammatory Response Index (SIRI) in Patients with High-Grade Glioma and the Establishment of a Nomogram. Front. Oncol. 2021, 11, 671811. [Google Scholar] [CrossRef]
- Besiroglu, M.; Shbair, A.T.; Yasin, A.I.; Topcu, A.; Turk, H.M.; Demir, T. Systemic Inflammatory Markers for Prediction of Bevacizumab Benefit in Glioblastoma Multiforme. J. Coll. Physicians Surg. Pak. 2021, 31, 39–44. [Google Scholar] [CrossRef]
- Moher, D.; Liberati, A.; Tetzlaff, J.; Altman, D.G.; PRISMA Group. Preferred reporting items for systematic reviews and meta-analyses: The PRISMA statement. PLoS Med. 2009, 6, e1000097. [Google Scholar] [CrossRef] [PubMed] [Green Version]
- Stang, A. Critical evaluation of the Newcastle-Ottawa scale for the assessment of the quality of nonrandomized studies in meta-analyses. Eur. J. Epidemiol. 2010, 25, 603–605. [Google Scholar] [CrossRef] [PubMed] [Green Version]
- Higgins, J.P.; Thompson, S.G. Quantifying heterogeneity in a meta-analysis. Stat. Med. 2002, 21, 1539–1558. [Google Scholar] [CrossRef] [PubMed]
- Wang, P.; Song, H.-W.; Cai, H.-Q.; Kong, L.-W.; Yao, K.; Jiang, T.; Li, S.; Yan, C.-X. Preoperative inflammation markers and IDH mutation status predict glioblastoma patient survival. Oncotarget 2017, 8, 50117–50123. [Google Scholar] [CrossRef] [PubMed] [Green Version]
- Lopes, M.; Carvalho, B.; Vaz, R.; Linhares, P. Influence of neutrophil–lymphocyte ratio in prognosis of glioblastoma multiforme. J. Neuro-Oncology 2017, 136, 173–180. [Google Scholar] [CrossRef] [PubMed]
- Weng, W.; Chen, X.; Gong, S.; Guo, L.; Zhang, X. Preoperative neutrophil–lymphocyte ratio correlated with glioma grading and glioblastoma survival. Neurol. Res. 2018, 40, 917–922. [Google Scholar] [CrossRef]
- Wang, P.-F.; Meng, Z.; Song, H.-W.; Yao, K.; Duan, Z.-J.; Yu, C.-J.; Li, S.; Yan, C.-X. Preoperative Changes in Hematological Markers and Predictors of Glioma Grade and Survival. Front. Pharmacol. 2018, 9, 886. [Google Scholar] [CrossRef]
- Odabaşi, E.; Kemal, Y. Prognostic significance of pre-treatment neutrophil-to-lymphocyte ratio and platelet-to-lymphocyte ratio in patients with glioblastoma. Mol. Clin. Oncol. 2018, 9, 453–458. [Google Scholar] [CrossRef] [Green Version]
- Maas, S.L.; Draaisma, K.; Snijders, T.J.; Senders, J.T.; Berendsen, S.; Seute, T.; Schiffelers, R.M.; Van Solinge, W.; Berg, M.J.T.; Robe, P.A.; et al. Routine Blood Tests Do Not Predict Survival in Patients with Glioblastoma—Multivariable Analysis of 497 Patients. World Neurosurg. 2019, 126, e1081–e1091. [Google Scholar] [CrossRef]
- Lv, Y.; Zhang, S.; Liu, Z.; Tian, Y.; Liang, N.; Zhang, J. Prognostic value of preoperative neutrophil to lymphocyte ratio is superior to systemic immune inflammation index for survival in patients with Glioblastoma. Clin. Neurol. Neurosurg. 2019, 181, 24–27. [Google Scholar] [CrossRef]
- Hao, Y.; Li, X.; Chen, H.; Huo, H.; Liu, Z.; Tian, F.; Chai, E. A Cumulative Score Based on Preoperative Neutrophil-Lymphocyte Ratio and Fibrinogen in Predicting Overall Survival of Patients with Glioblastoma Multiforme. World Neurosurg. 2019, 128, e427–e433. [Google Scholar] [CrossRef] [PubMed]
- Brenner, A.; Friger, M.; Geffen, D.B.; Kaisman-Elbaz, T.; Lavrenkov, K. The Prognostic Value of the Pretreatment Neutrophil/Lymphocyte Ratio in Patients with Glioblastoma Multiforme Brain Tumors: A Retrospective Cohort Study of Patients Treated with Combined Modality Surgery, Radiation Therapy, and Temozolomide Chemotherapy. Oncology 2019, 97, 255–263. [Google Scholar] [CrossRef]
- Mermut, O.; Inanc, B. The effect of indicators of systemic inflammatory response on survival in glioblastoma multiforme. Turk. Neurosurg. 2020, 30, 658–665. [Google Scholar] [CrossRef] [PubMed]
- Marini, A.; Dobran, M.; Aiudi, D.; Pesaresi, A.; di Somma, L.G.M.; Iacoangeli, M. Pre-operative hematological markers as predictive factors for overall survival and progression free survival in glioblastomas. Clin. Neurol. Neurosurg. 2020, 197, 106162. [Google Scholar] [CrossRef] [PubMed]
- Clavreul, A.; Lemée, J.-M.; Soulard, G.; Rousseau, A.; Menei, P. A Simple Preoperative Blood Count to Stratify Prognosis in Isocitrate Dehydrogenase-Wildtype Glioblastoma Patients Treated with Radiotherapy plus Concomitant and Adjuvant Temozolomide. Cancers 2021, 13, 5778. [Google Scholar] [CrossRef]
- Kaya, V.; Yıldırım, M.; Yazıcı, G.; Yalçın, A.Y.; Orhan, N.; Güzel, A. Prognostic Significance of Indicators of Systemic Inflammatory Responses in Glioblastoma Patients. Asian Pac. J. Cancer Prev. 2017, 18, 3287–3291. [Google Scholar] [CrossRef] [PubMed]
- Zhang, Z.-Y.; Zhan, Y.-B.; Zhang, F.-J.; Yu, B.; Ji, Y.-C.; Zhou, J.-Q.; Bai, Y.-H.; Wang, Y.-M.; Wang, L.; Jing, Y.; et al. Prognostic value of preoperative hematological markers combined with molecular pathology in patients with diffuse gliomas. Aging 2019, 11, 6252–6272. [Google Scholar] [CrossRef]
- Zhou, X.-W.; Dong, H.; Yang, Y.; Luo, J.-W.; Wang, X.; Liu, Y.-H.; Mao, Q. Significance of the prognostic nutritional index in patients with glioblastoma: A retrospective study. Clin. Neurol. Neurosurg. 2016, 151, 86–91. [Google Scholar] [CrossRef]
- Templeton, A.J.; Mcnamara, M.G.; Šeruga, B.; Vera-Badillo, F.E.; Aneja, P.; Ocaña, A.; Leibowitz-Amit, R.; Sonpavde, G.; Knox, J.J.; Tran, B.; et al. Prognostic Role of Neutrophil-to-Lymphocyte Ratio in Solid Tumors: A Systematic Review and Meta-Analysis. J. Natl. Cancer Inst. 2014, 106, dju124. [Google Scholar] [CrossRef] [Green Version]
- Gu, X.; Gao, X.; Li, X.; Qi, X.; Ma, M.; Qin, S.; Yu, H.; Sun, S.; Zhou, D.; Wang, W. Prognostic significance of neutrophil-to-lymphocyte ratio in prostate cancer: Evidence from 16,266 patients. Sci. Rep. 2016, 6, 22089. [Google Scholar] [CrossRef]
- Leitch, E.F.; Chakrabarti, M.; Crozier, J.E.M.; McKee, R.F.; Anderson, J.H.; Horgan, P.G.; McMillan, D.C. Comparison of the prognostic value of selected markers of the systemic inflammatory response in patients with colorectal cancer. Br. J. Cancer 2007, 97, 1266–1270. [Google Scholar] [CrossRef] [PubMed]
- Dutta, S.; Crumley, A.B.; Fullarton, G.M.; Horgan, P.G.; McMillan, D.C. Comparison of the prognostic value of tumour and patient related factors in patients undergoing potentially curative resection of gastric cancer. Am. J. Surg. 2012, 204, 294–299. [Google Scholar] [CrossRef] [PubMed]
- Wainwright, D.A.; Sengupta, S.; Han, Y.; Lesniak, M.S. Thymus-derived rather than tumor-induced regulatory T cells predominate in brain tumors. Neuro Oncol. 2011, 13, 1308–1323. [Google Scholar] [CrossRef] [PubMed] [Green Version]
- Hanahan, D.; Weinberg, R.A. Hallmarks of cancer: The next generation. Cell 2011, 144, 646–674. [Google Scholar] [CrossRef] [Green Version]
- Zahorec, R. Ratio of neutrophil to lymphocyte counts--rapid and simple parameter of systemic inflammation and stress in critically ill. Bratislavske Lekarske Listy 2001, 102, 5–14. [Google Scholar]
- Mason, M.; Maurice, C.; McNamara, M.G.; Tieu, M.T.; Lwin, Z.; Millar, B.-A.; Menard, C.; Laperriere, N.; Milosevic, M.; Atenafu, E.G.; et al. Neutrophil–lymphocyte ratio dynamics during concurrent chemo-radiotherapy for glioblastoma is an independent predictor for overall survival. J. Neuro-Oncology 2017, 132, 463–471. [Google Scholar] [CrossRef]
- Yovino, S.; A Grossman, S. Severity, etiology and possible consequences of treatment-related lymphopenia in patients with newly diagnosed high-grade gliomas. CNS Oncol. 2012, 1, 149–154. [Google Scholar] [CrossRef]
- Montemurro, N.; Fanelli, G.N.; Scatena, C.; Ortenzi, V.; Pasqualetti, F.; Mazzanti, C.M.; Morganti, R.; Naccarato, F.P.A.G.; Perrini, P. Surgical outcome and molecular pattern characterization of recurrent glio-blastoma multiforme: A single-center retrospective series. Clin. Neurol Neurosurg. 2021, 207, 106735. [Google Scholar] [CrossRef]
- Bloch, O.; Hab, S.J.; Sun, M.Z.; Aghi, M.K.; McDermott, M.W.; Berger, M.S.; Parsa, A.T. Impact of extent of resection for recurrent glioblastoma on overall survival: Clinical article. J. Neurosurg. 2012, 117, 1032–1038. [Google Scholar] [CrossRef]
- Yong, R.L.; Wu, T.; Mihatov, N.; Shen, M.J.; Brown, M.; Zaghloul, K.A.; Park, G.E.; Park, J.K. Residual tumor volume and patient survival following reoperation for recurrent glioblastoma. J. Neurosurg. 2014, 121, 802–809. [Google Scholar] [CrossRef]
- Gandhi, P.; Khare, R.; Gulwani, H.; Kaur, S. Circulatory YKL-40 & NLR: Underestimated Prognostic Indicators in Diffuse Glioma. Int. J. Mol. Cell. Med. 2018, 7, 111–118. [Google Scholar] [CrossRef] [PubMed]
- Gregory, A.D.; Houghton, A.M. Tumor-Associated Neutrophils: New Targets for Cancer Therapy: Figure 1. Cancer Res. 2011, 71, 2411–2416. [Google Scholar] [CrossRef] [PubMed] [Green Version]
- Massara, M.; Persico, P.; Bonavita, O.; Poeta, V.M.; Locati, M.; Simonelli, M.; Bonecchi, R. Neutrophils in Gliomas. Front. Immunol. 2017, 8, 1349. [Google Scholar] [CrossRef] [PubMed] [Green Version]
- Zheng, S.-H.; Huang, J.-L.; Chen, M.; Wang, B.-L.; Ou, Q.-S.; Huang, S.-Y. Diagnostic value of preoperative inflammatory markers in patients with glioma: A multicenter cohort study. J. Neurosurg. 2018, 129, 583–592. [Google Scholar] [CrossRef] [Green Version]
- Sharma, G.; Jain, S.K.; Sinha, V.D. Peripheral Inflammatory Blood Markers in Diagnosis of Glioma and IDH Status. J. Neurosci Rural. Pract. 2021, 12, 88–94. [Google Scholar] [CrossRef]
- Baran, O.; Kemerdere, R.; Korkmaz, T.S.; Kayhan, A.; Tanriverdi, T. Can preoperative neutrophil to lymphocyte, lymphocyte to monocyte, or platelet to lymphocyte ratios differentiate glioblastoma from brain metastasis? Medicine 2019, 98, e18306. [Google Scholar] [CrossRef]
- Zhao, C.; Li, L.; Guo, X.; Song, D.; Wang, M.; Zhai, Y.; Yang, F.; Xue, Y.; Wei, X. Preoperative Predictors of Early Mortality Risk in Isocitrate Dehydrogenase-Wild-Type Glioblastoma Patients Treated with Standard Therapy. Cancer Manag. Res. 2021, ume 13, 1159–1168. [Google Scholar] [CrossRef]


| First Author and Year | Country | Patients (N) | Design | Age (mean ± SD) | Gender (M) | Sample Size (N) | Gross Total Resection (N) | Second Surgery (N) | NLR Cut-off | Therapy | Outcome | HR (95%CI) |
|---|---|---|---|---|---|---|---|---|---|---|---|---|
| Bambury 2013 | USA | GBM multiforme | Retrospective | 56.6 ± 11.53 | 65 | 84 | 23 | NR | NLR = 4 | S + C+ T | MA | 1.81 (1.08–3.02) |
| Sheng Han 2015 | China | GBM | Retrospective | 50.4 ± 15.4 | 95 | 152 | 75 | NR | NLR = 4 | S + C | MA | 2.068 (1.304–3.277) |
| Peng-Fei Wang 2017 | China | GBM | Prospective | 52.1 ± 0.984 | 96 | 166 | 102 | NR | NLR = 4 | NR | MA | 1.712 (1.026–2.858) |
| Marta Lopes 2018 | Portugal | GBM multiforme | Retrospective | NR | NR | 126 | NR | NR | NLR = 5 | NR | MA | 1.56 (1.04–2.34) |
| Weiji Weng 2018 | China | GBM | Retrospective | NR | 53 | 105 | 57 | NR | NLR = 4 | S + C+ T | NR | 1.953 (1.255–3.039) |
| Peng-Fei Wang 2018 | China | GBM | Retrospective | NR | NR | 314 | NR | NR | NR | NR | UA | 0.57 (0.41–0.79) |
| ÖZLEM YERSAL 2018 | Turkey | GBM | Retrospective | 56.8 ± 13.1 | 39 | 80 | 42 | NR | NLR = 4 | S + C+ T | UA | 1.258 (0.727–2.179) |
| SybrenL.N. Maas 2019 | Netherlands | GBM | Retrospective | NR | NR | 479 | NR | NR | NLR = 4 | NR | MA | 1.11 (0.75–1.65) |
| Yajuan Lv 2019 | China | GBM | Retrospective | 53.25 ± 13.9 | 113 | 192 | NR | NR | NLR = 2.7 | NR | MA | 0.637 (0.454–0.894) |
| Yunfei Hao 2019 | China | GBM multiforme | Retrospective | 55 ± 13.55 | 116 | 187 | 112 | NR | NLR = 4.1 | S + C+ T | UA | 2.574 (1.849–3.581) |
| Agam Brenner 2019 | Israel | GBM multiforme | Retrospective | 57.73 ± 12.43 | 46 | 89 | 59 | 23 | NLR = 4 | S + C+ T | MA | 0.856 (0.49–1.496) |
| Ozlem MERMUT 2020 | Turkey | GBM multiforme | Retrospective | 58.0 ± 13.02 | 47 | 75 | 31 | NR | NLR = 4 | NR | MA | 2.14 (1.11–4.14) |
| Alessandra Marini 2020 | Italy | GBM | Retrospective | NR | 65 | 124 | 64 | NR | NLR = 4 | S + C | MA | 1.58 (1–2.49) |
| Mehmet Besiroglu 2021 | Turkey | GBM multiforme | Retrospective | 47.2 ± 12.1 | 58 | 107 | 73 | NR | NLR = 2.9 | S + C+ T | MA | 1.38 (0.87–2.17) |
| Anne Clavreul 2021 | France | GBM | Retrospective | 61.5 ± 8.8 | 65 | 85 | 46 | NR | NLR = 2.06 | S + C+ T | NR | 1.67 (1.03–2.71) |
| Vildan Kaya 2017 | Antalya | GBM | Retrospective | 55.7 ± 16.3 | NR | 90 | NR | NR | NLR = 5 | NR | MA | 2.41 (1.26–4.58) |
| Zhen-Yu Zhang 2019 | China | GBM | Retrospective | NR | NR | 170 | NR | NR | NLR = 7.25 | NR | MA | 2.228 (1.329–3.733) |
| Xing-Wang Zhou 2016 | China | GBM | Retrospective | 52.85 ± 4.03 | 50 | 84 | 59 | NR | NLR = 4 | C | UA | 1.264 (0.785–2.035) |
| Qian He 2021 | China | GBM | Retrospective | NR | NR | 62 | 46 | NR | NLR = 3.31 | S + C | UA | 1.766 (0.941–3.316) |
| Author and Year | Selection (0–4 points) | Comparability Control for Important Factor (0–2 points) | Outcome (0–3 points) | Scores (9 Points) | |||||
|---|---|---|---|---|---|---|---|---|---|
| Representativeness of the Exposed Cohort | Selection of the Nonexposed Cohort | Ascertainment of Exposure | Demonstration that Outcome of Interest was not Present at Start of Study | Assessment of Outcome | was Follow-Up Long Enough for Outcomes to Occur | Adequacy of Follow-Up of Cohorts | |||
| Bambury 2013 | 1 | 1 | 1 | 1 | 1 | 1 | 1 | 1 | 8 |
| Sheng Han 2015 | 1 | 1 | 1 | 1 | 1 | 0 | 1 | 0 | 6 |
| Peng-Fei Wang 2017 | 1 | 1 | 1 | 1 | 1 | 1 | 1 | 0 | 7 |
| Marta Lopes 2018 | 1 | 1 | 1 | 1 | 0 | 0 | 1 | 0 | 5 |
| Weiji Weng 2018 | 1 | 1 | 0 | 1 | 1 | 1 | 0 | 0 | 5 |
| Peng-Fei Wang 2018 | 1 | 1 | 0 | 1 | 1 | 1 | 0 | 1 | 6 |
| ÖZLEM YERSAL 2018 | 1 | 0 | 1 | 1 | 1 | 1 | 0 | 0 | 5 |
| SybrenL.N. Maas 2019 | 1 | 1 | 1 | 1 | 1 | 1 | 1 | 1 | 8 |
| Yajuan Lv 2019 | 1 | 1 | 1 | 1 | 1 | 1 | 0 | 1 | 7 |
| Yunfei Hao 2019 | 1 | 1 | 1 | 1 | 0 | 1 | 1 | 0 | 6 |
| Agam Brenner 2019 | 1 | 1 | 1 | 1 | 1 | 1 | 1 | 0 | 7 |
| Ozlem MERMUT 2020 | 1 | 1 | 1 | 1 | 1 | 1 | 1 | 1 | 8 |
| Alessandra Marini 2020 | 1 | 1 | 1 | 1 | 0 | 1 | 0 | 0 | 5 |
| Mehmet Besiroglu 2021 | 1 | 1 | 0 | 1 | 1 | 1 | 1 | 0 | 6 |
| Anne Clavreul 2021 | 1 | 1 | 1 | 1 | 1 | 1 | 0 | 1 | 7 |
| Vildan Kaya 2017 | 1 | 1 | 0 | 1 | 1 | 1 | 0 | 0 | 5 |
| Zhen-Yu Zhang 2019 | 1 | 1 | 0 | 1 | 1 | 1 | 1 | 1 | 7 |
| Xing-Wang Zhou 2016 | 1 | 0 | 1 | 1 | 1 | 1 | 1 | 1 | 7 |
| Qian He 2021 | 1 | 1 | 1 | 0 | 1 | 1 | 1 | 1 | 7 |
| Hr | Coef. | Std. Err. | t | p > |t| | [95% Conf.] | Interval |
|---|---|---|---|---|---|---|
| year | −0.0623897 | 0.2007026 | −0.31 | 0.761 | −0.4996832 | 0.3749038 |
| country | 0.0193201 | 0.1760801 | −0.11 | 0.914 | −0.4029657 | 0.3643255 |
| age | 0.1452009 | 0.2485765 | 0.58 | 0.57 | −0.3964008 | 0.6868027 |
| gender | 0.879301 | 0.1934452 | 0.45 | 0.658 | −0.3335507 | 0.5094109 |
| Extent of surgery | −0.1954218 | 0.3527367 | −0.55 | 0.59 | −0.963969 | 0.5731255 |
| treatment | 0.1881377 | 0.4750795 | 0.4 | 0.699 | −0.8469717 | 1.223247 |
| cons | 1.393349 | 2.010993 | 0.69 | 0.502 | −2.988229 | 5.774926 |
| Std_Eff | Coef. | Std. Err | t | P > |t| | [95% Conf. Interval] | |
|---|---|---|---|---|---|---|
| Slope | −0.6745632 | 0.5180683 | −1.30 | 0.210 | −1.767592 | 0.4184653 |
| Bias | 4.389166 | 2.236887 | 1.96 | 0.066 | −0.3302535 | 9.108586 |
Publisher’s Note: MDPI stays neutral with regard to jurisdictional claims in published maps and institutional affiliations. |
© 2022 by the authors. Licensee MDPI, Basel, Switzerland. This article is an open access article distributed under the terms and conditions of the Creative Commons Attribution (CC BY) license (https://creativecommons.org/licenses/by/4.0/).
Share and Cite
Guo, X.; Jiao, H.; Zhang, T.; Zhang, Y. Pre-Treatment and Preoperative Neutrophil-to-Lymphocyte Ratio Predicts Prognostic Value of Glioblastoma: A Meta-Analysis. Brain Sci. 2022, 12, 675. https://0-doi-org.brum.beds.ac.uk/10.3390/brainsci12050675
Guo X, Jiao H, Zhang T, Zhang Y. Pre-Treatment and Preoperative Neutrophil-to-Lymphocyte Ratio Predicts Prognostic Value of Glioblastoma: A Meta-Analysis. Brain Sciences. 2022; 12(5):675. https://0-doi-org.brum.beds.ac.uk/10.3390/brainsci12050675
Chicago/Turabian StyleGuo, Xin, Hengxing Jiao, Tiantian Zhang, and Yuelin Zhang. 2022. "Pre-Treatment and Preoperative Neutrophil-to-Lymphocyte Ratio Predicts Prognostic Value of Glioblastoma: A Meta-Analysis" Brain Sciences 12, no. 5: 675. https://0-doi-org.brum.beds.ac.uk/10.3390/brainsci12050675