
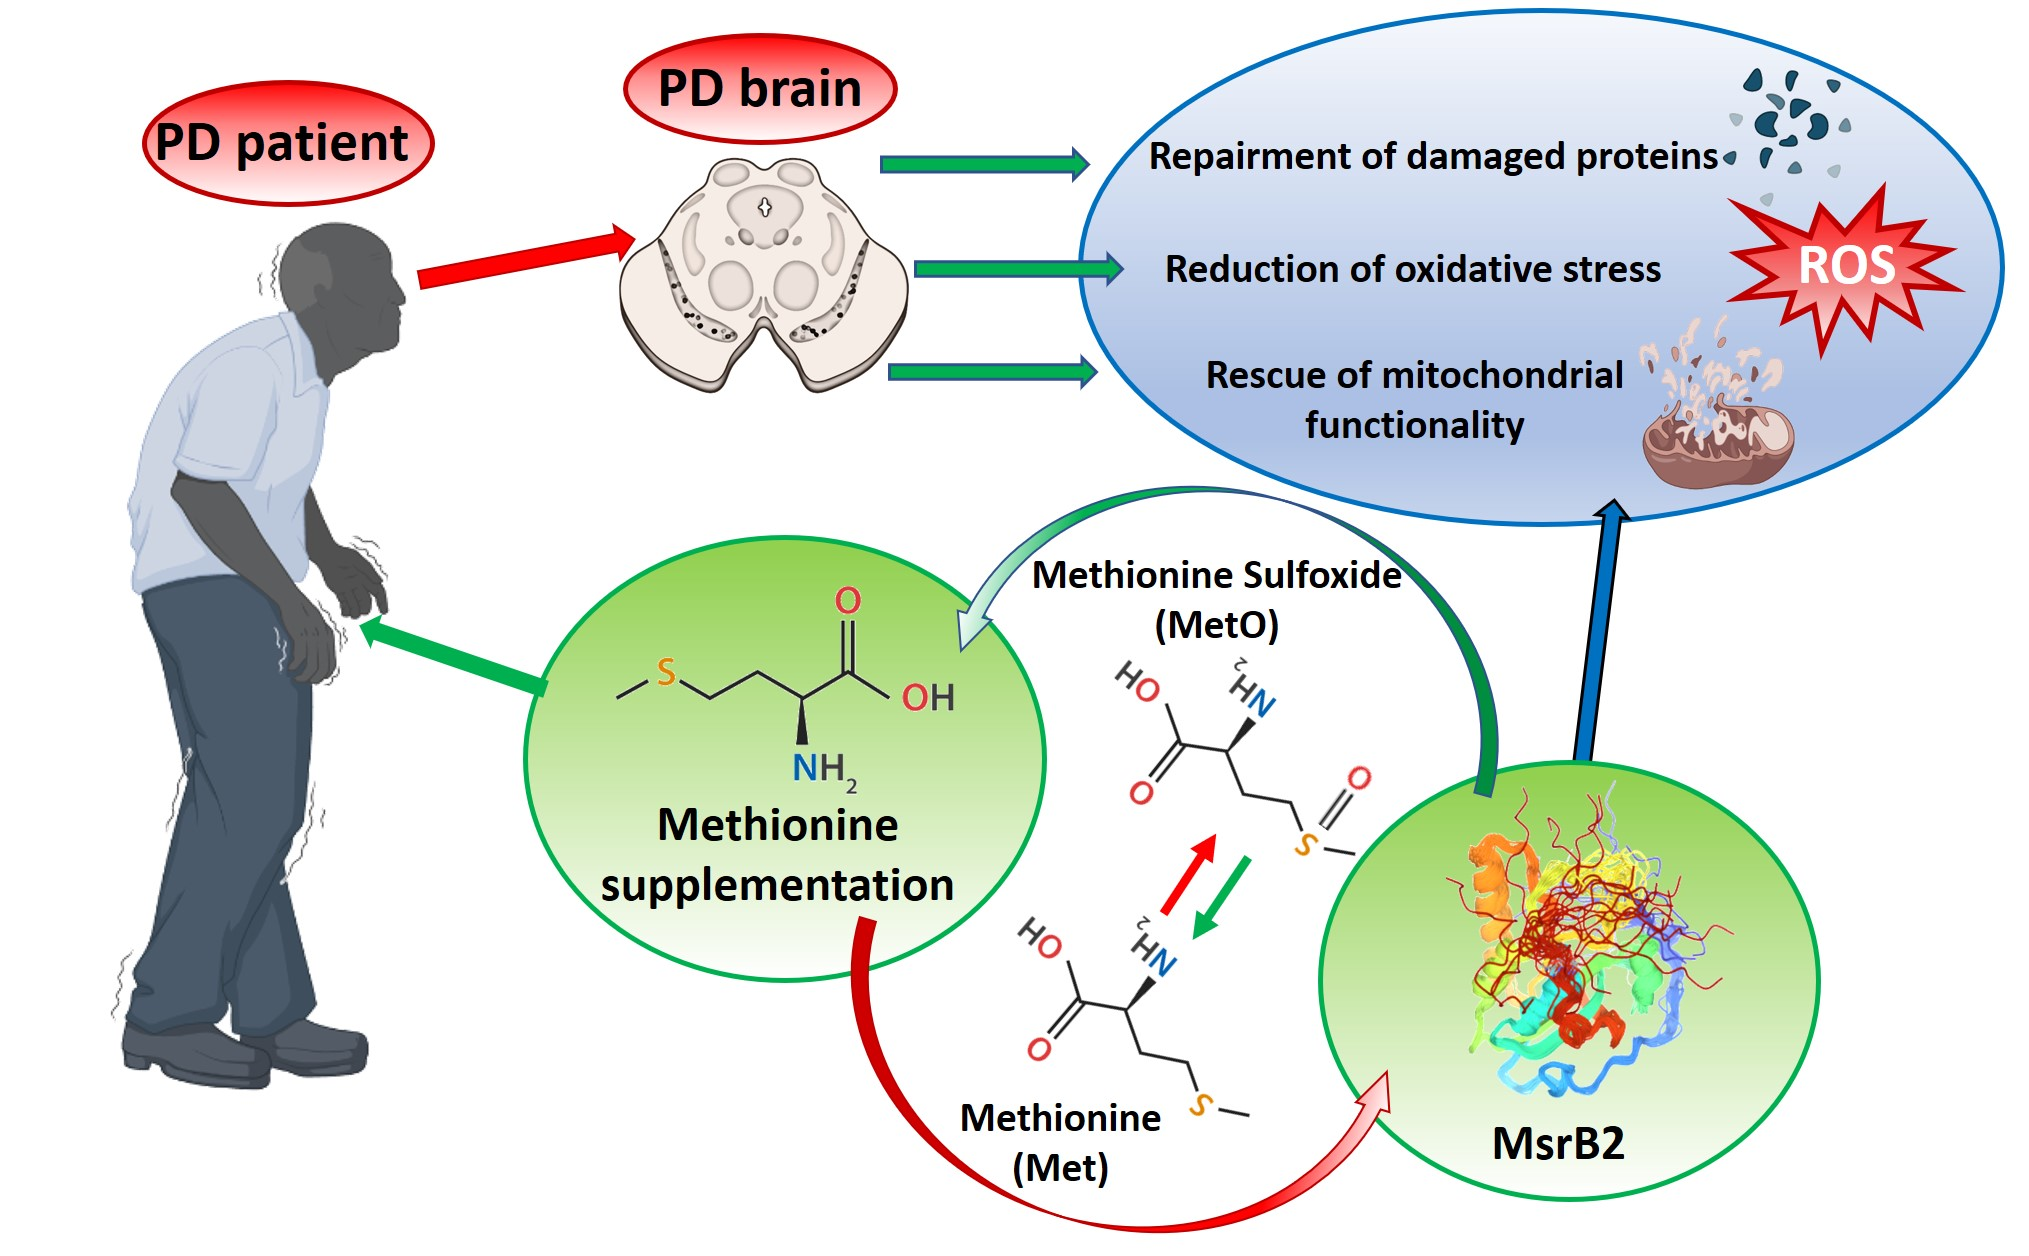
L-Methionine Protects against Oxidative Stress and Mitochondrial Dysfunction in an In Vitro Model of Parkinson’s Disease


 , , , , , ,
  and
and
Abstract
:
1. Introduction
2. Materials and Methods
2.1. Cellular Model
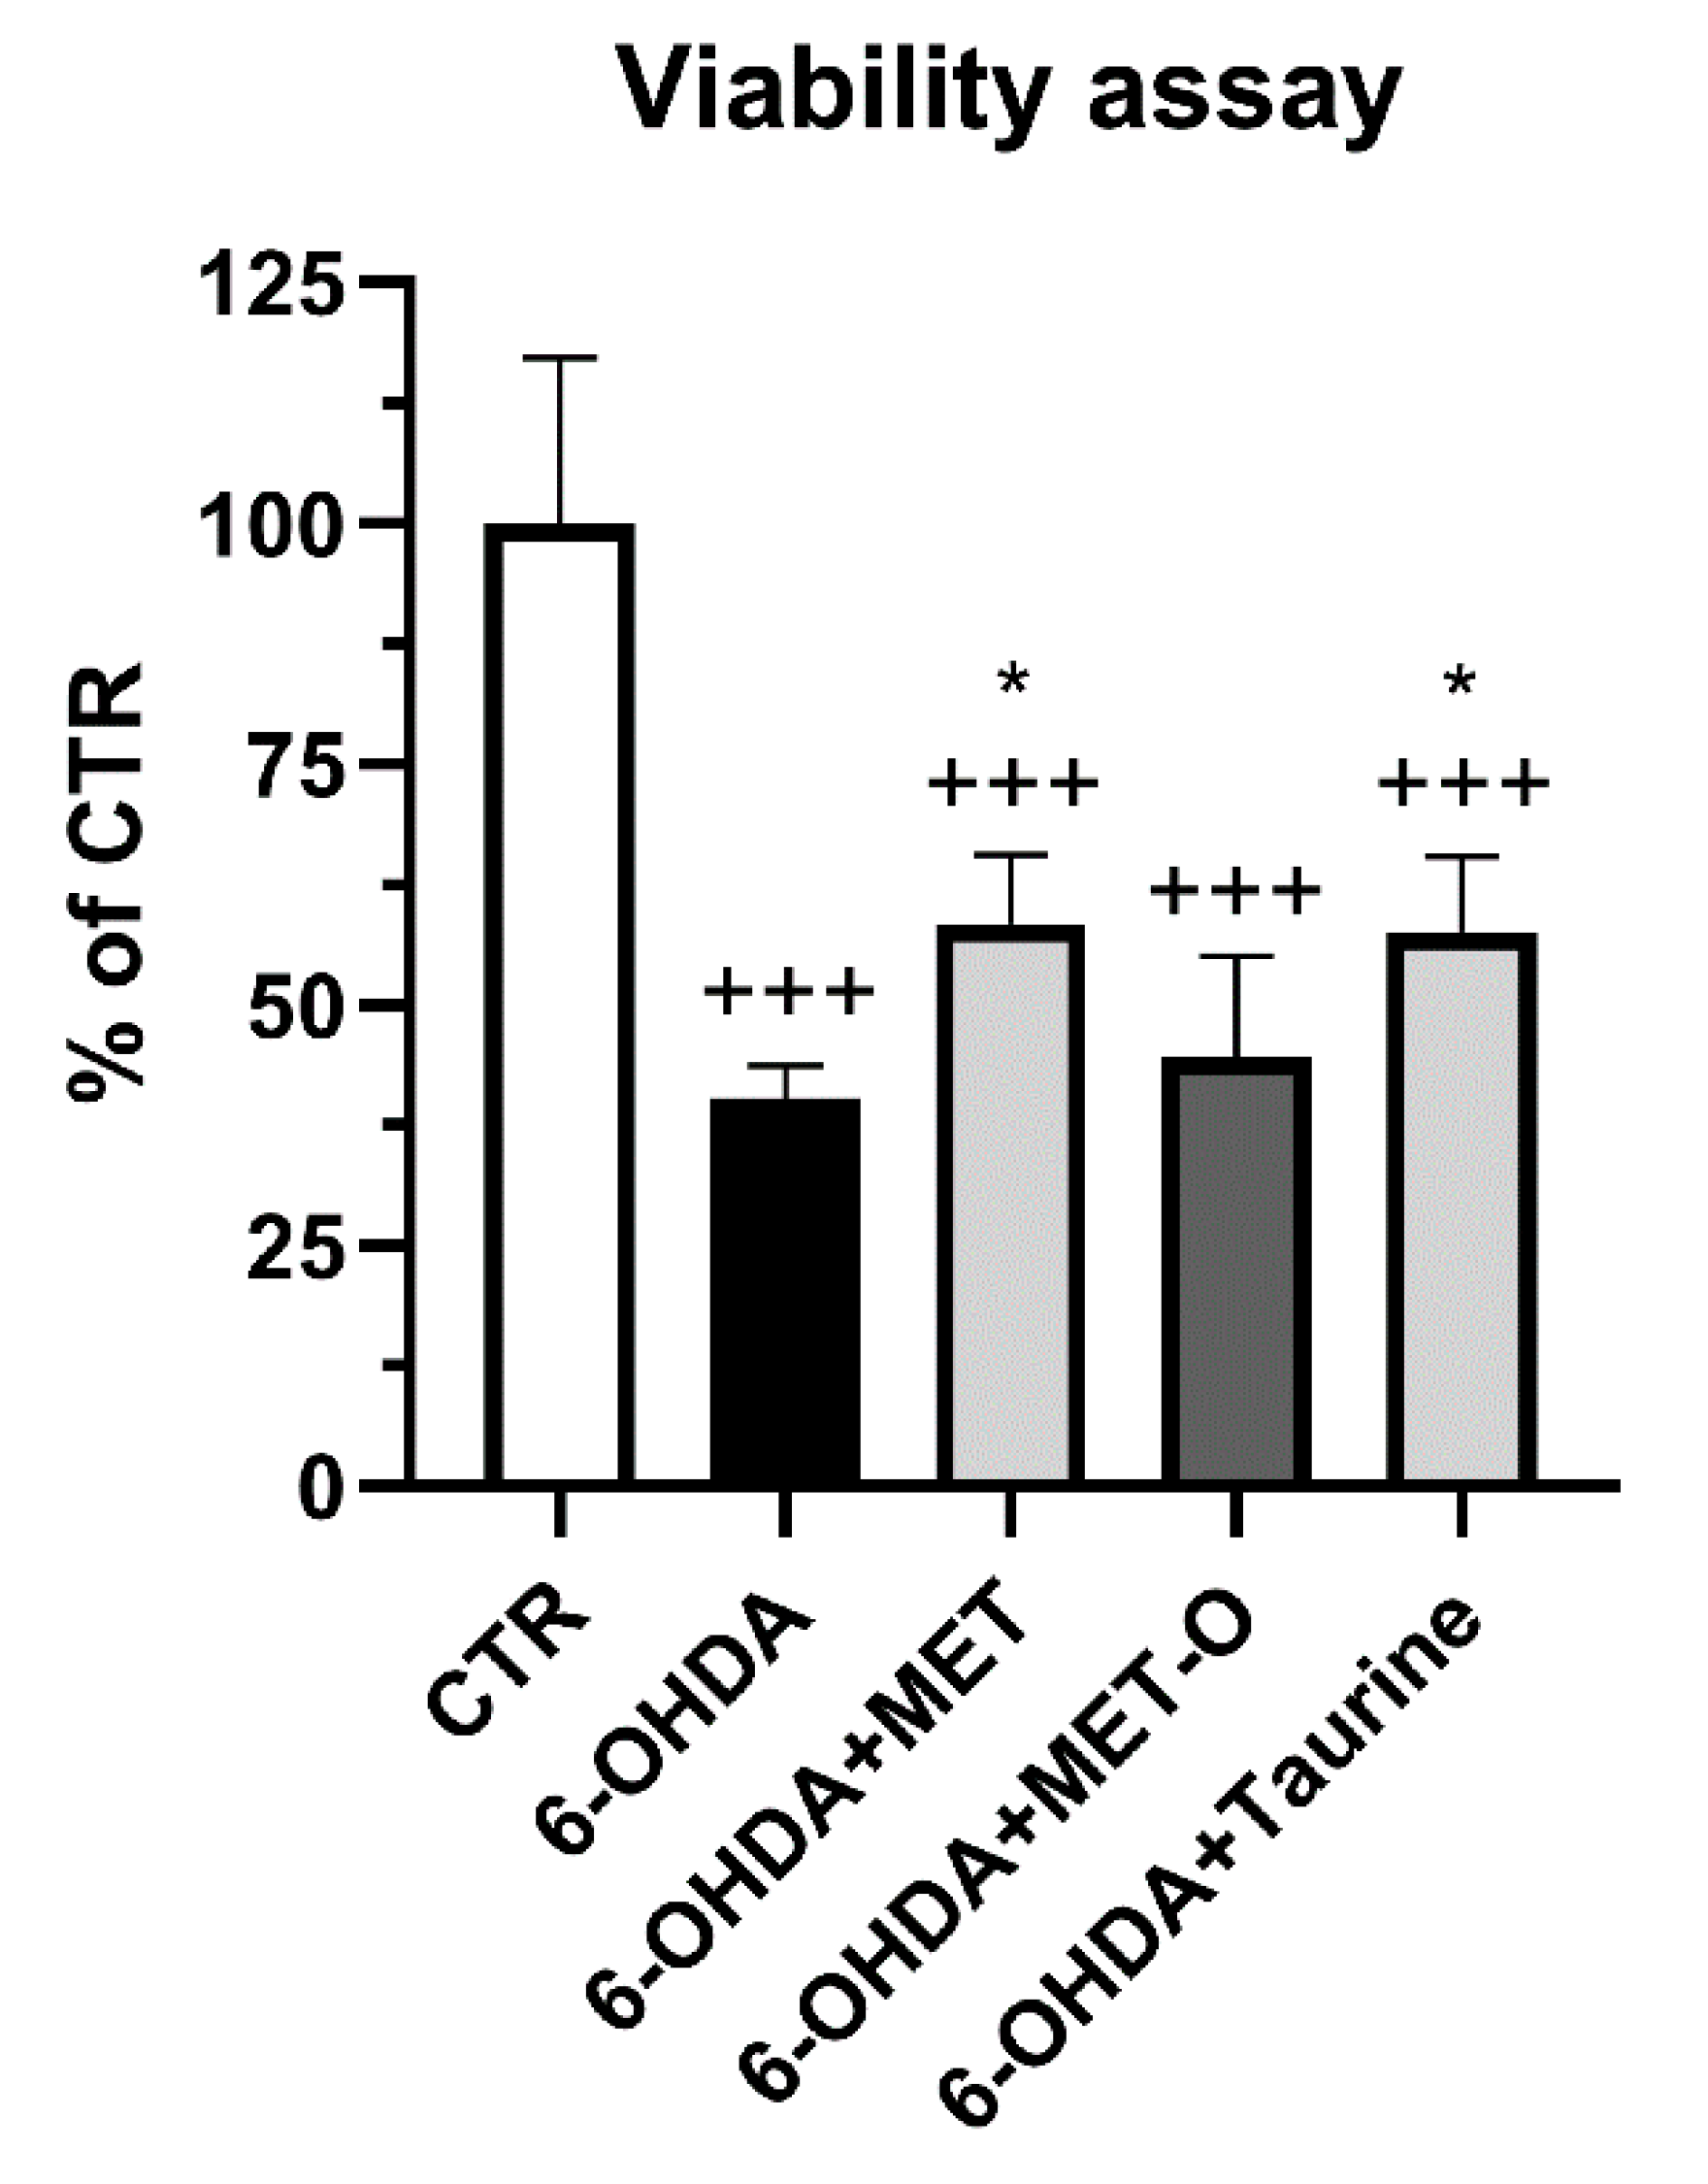
2.2. Cell Viability
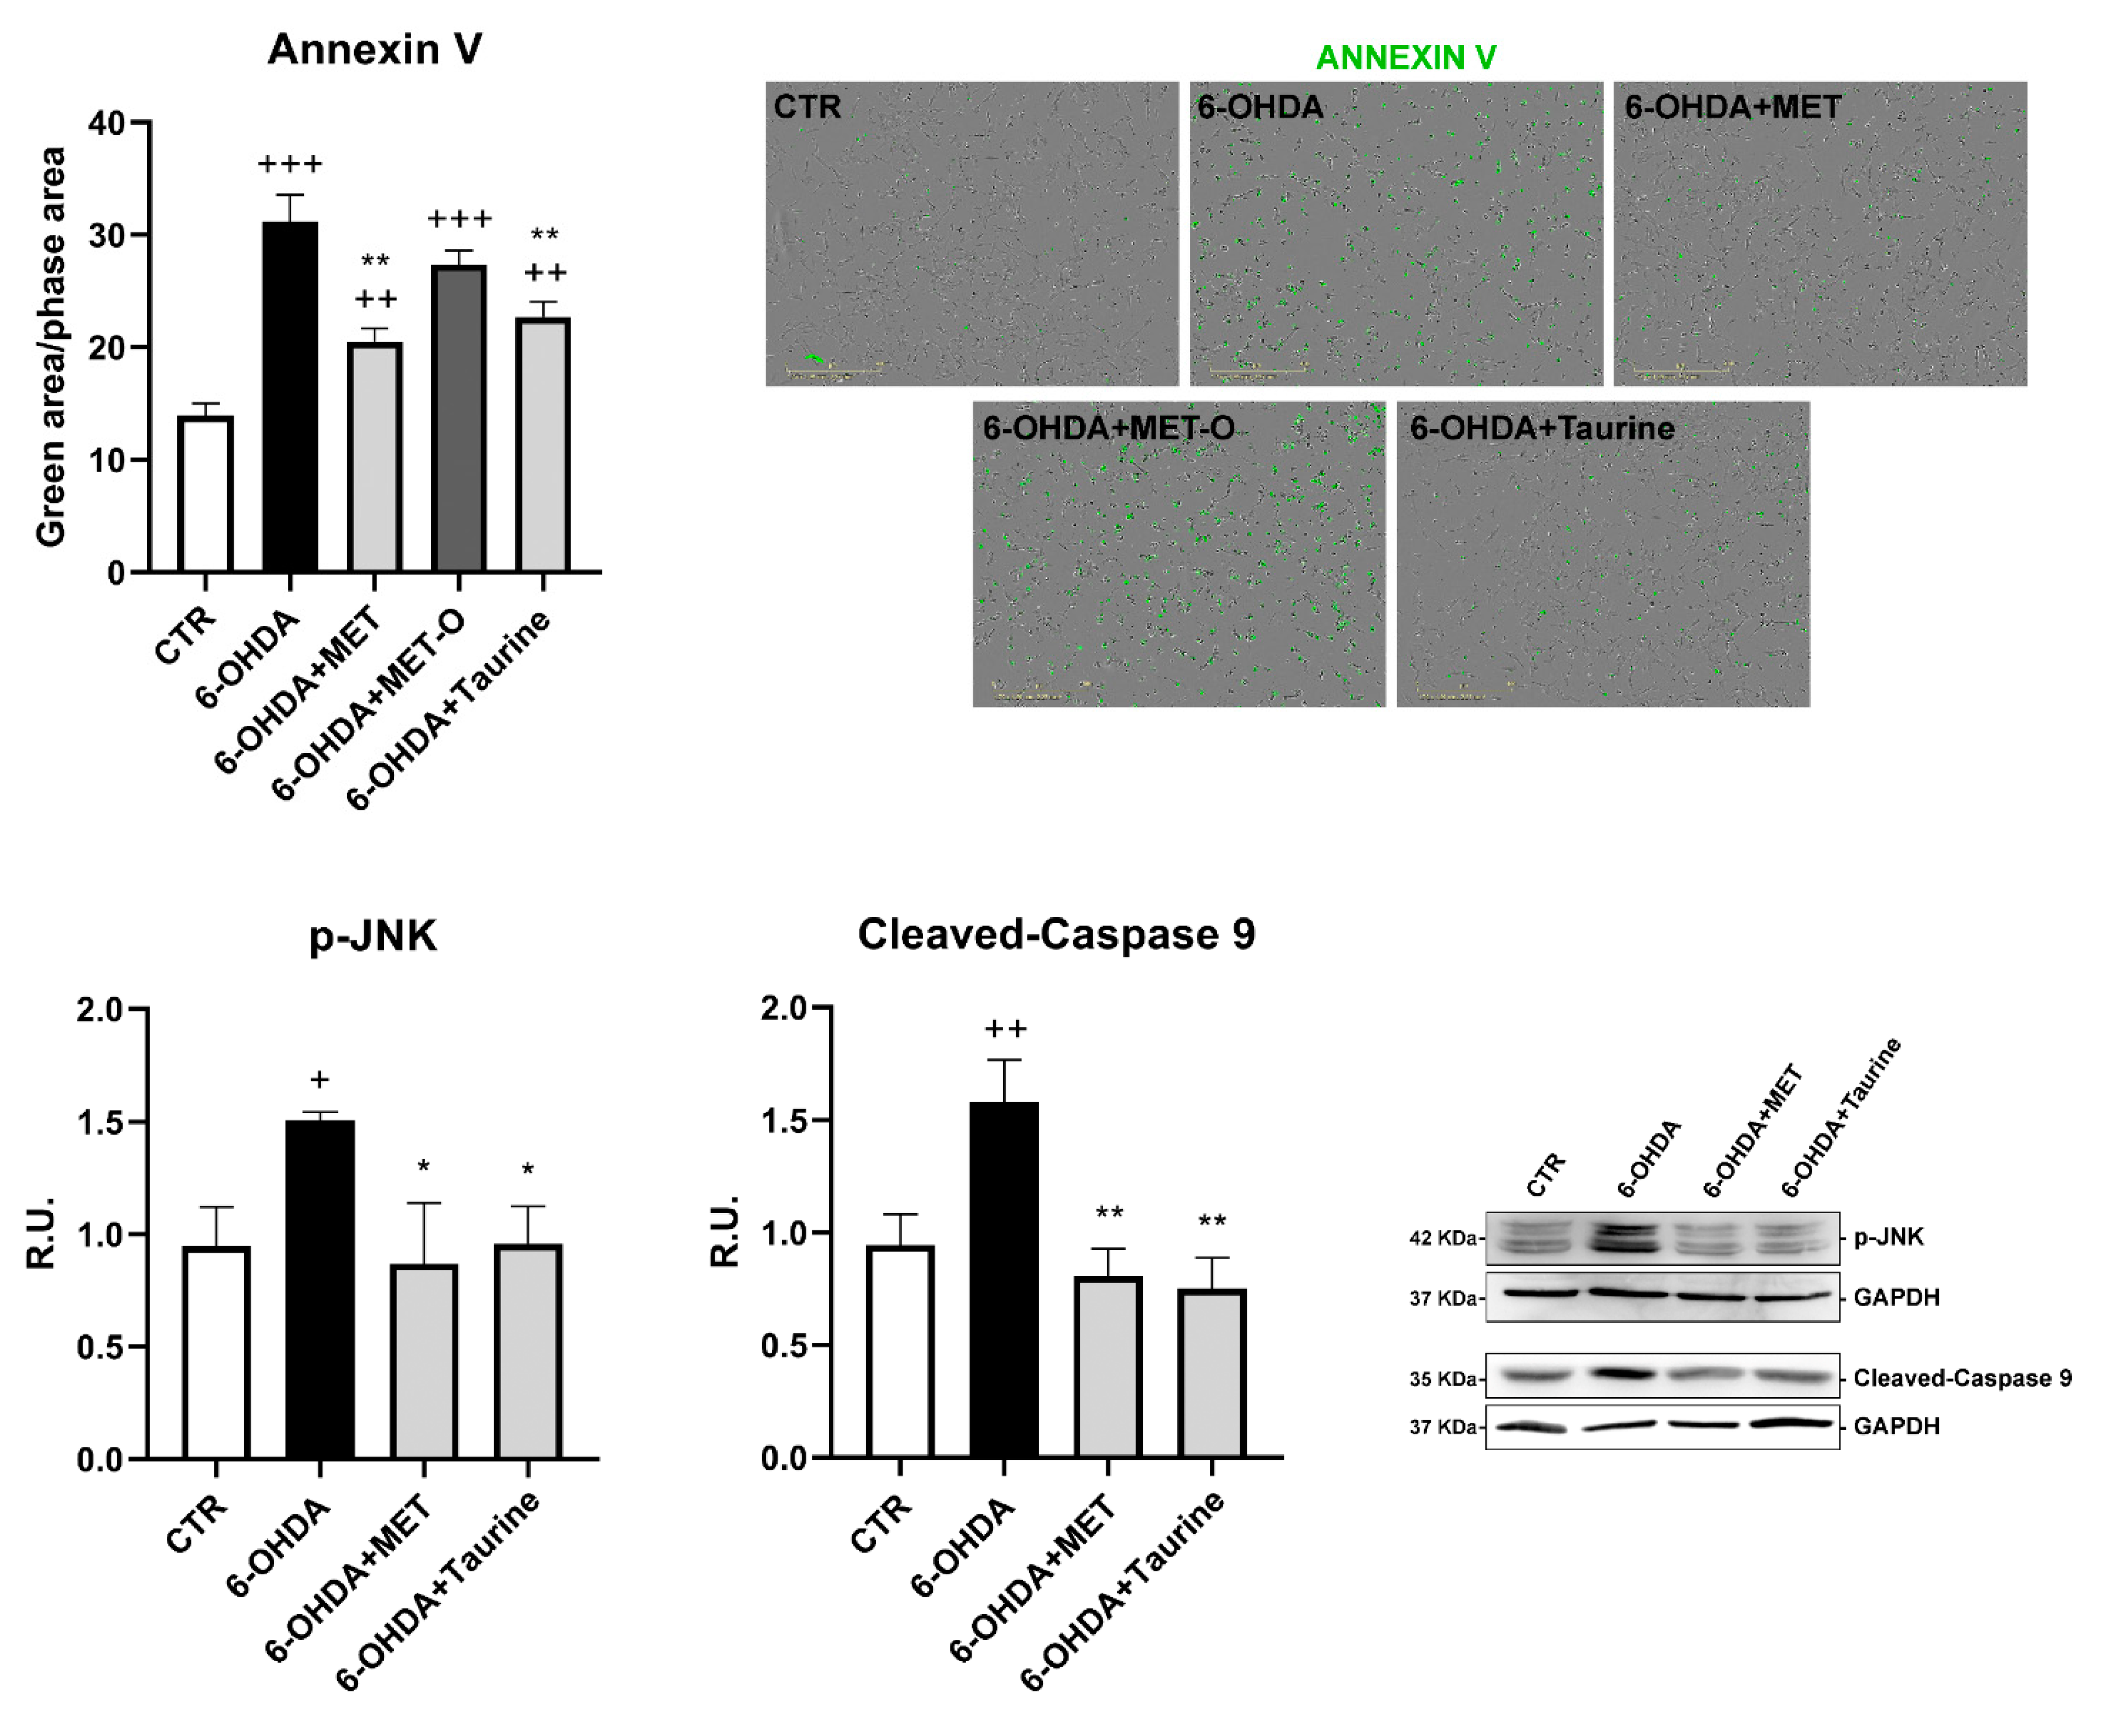
2.3. Annexin V
2.4. Western Blotting
2.5. OxyBlot Detection Kit
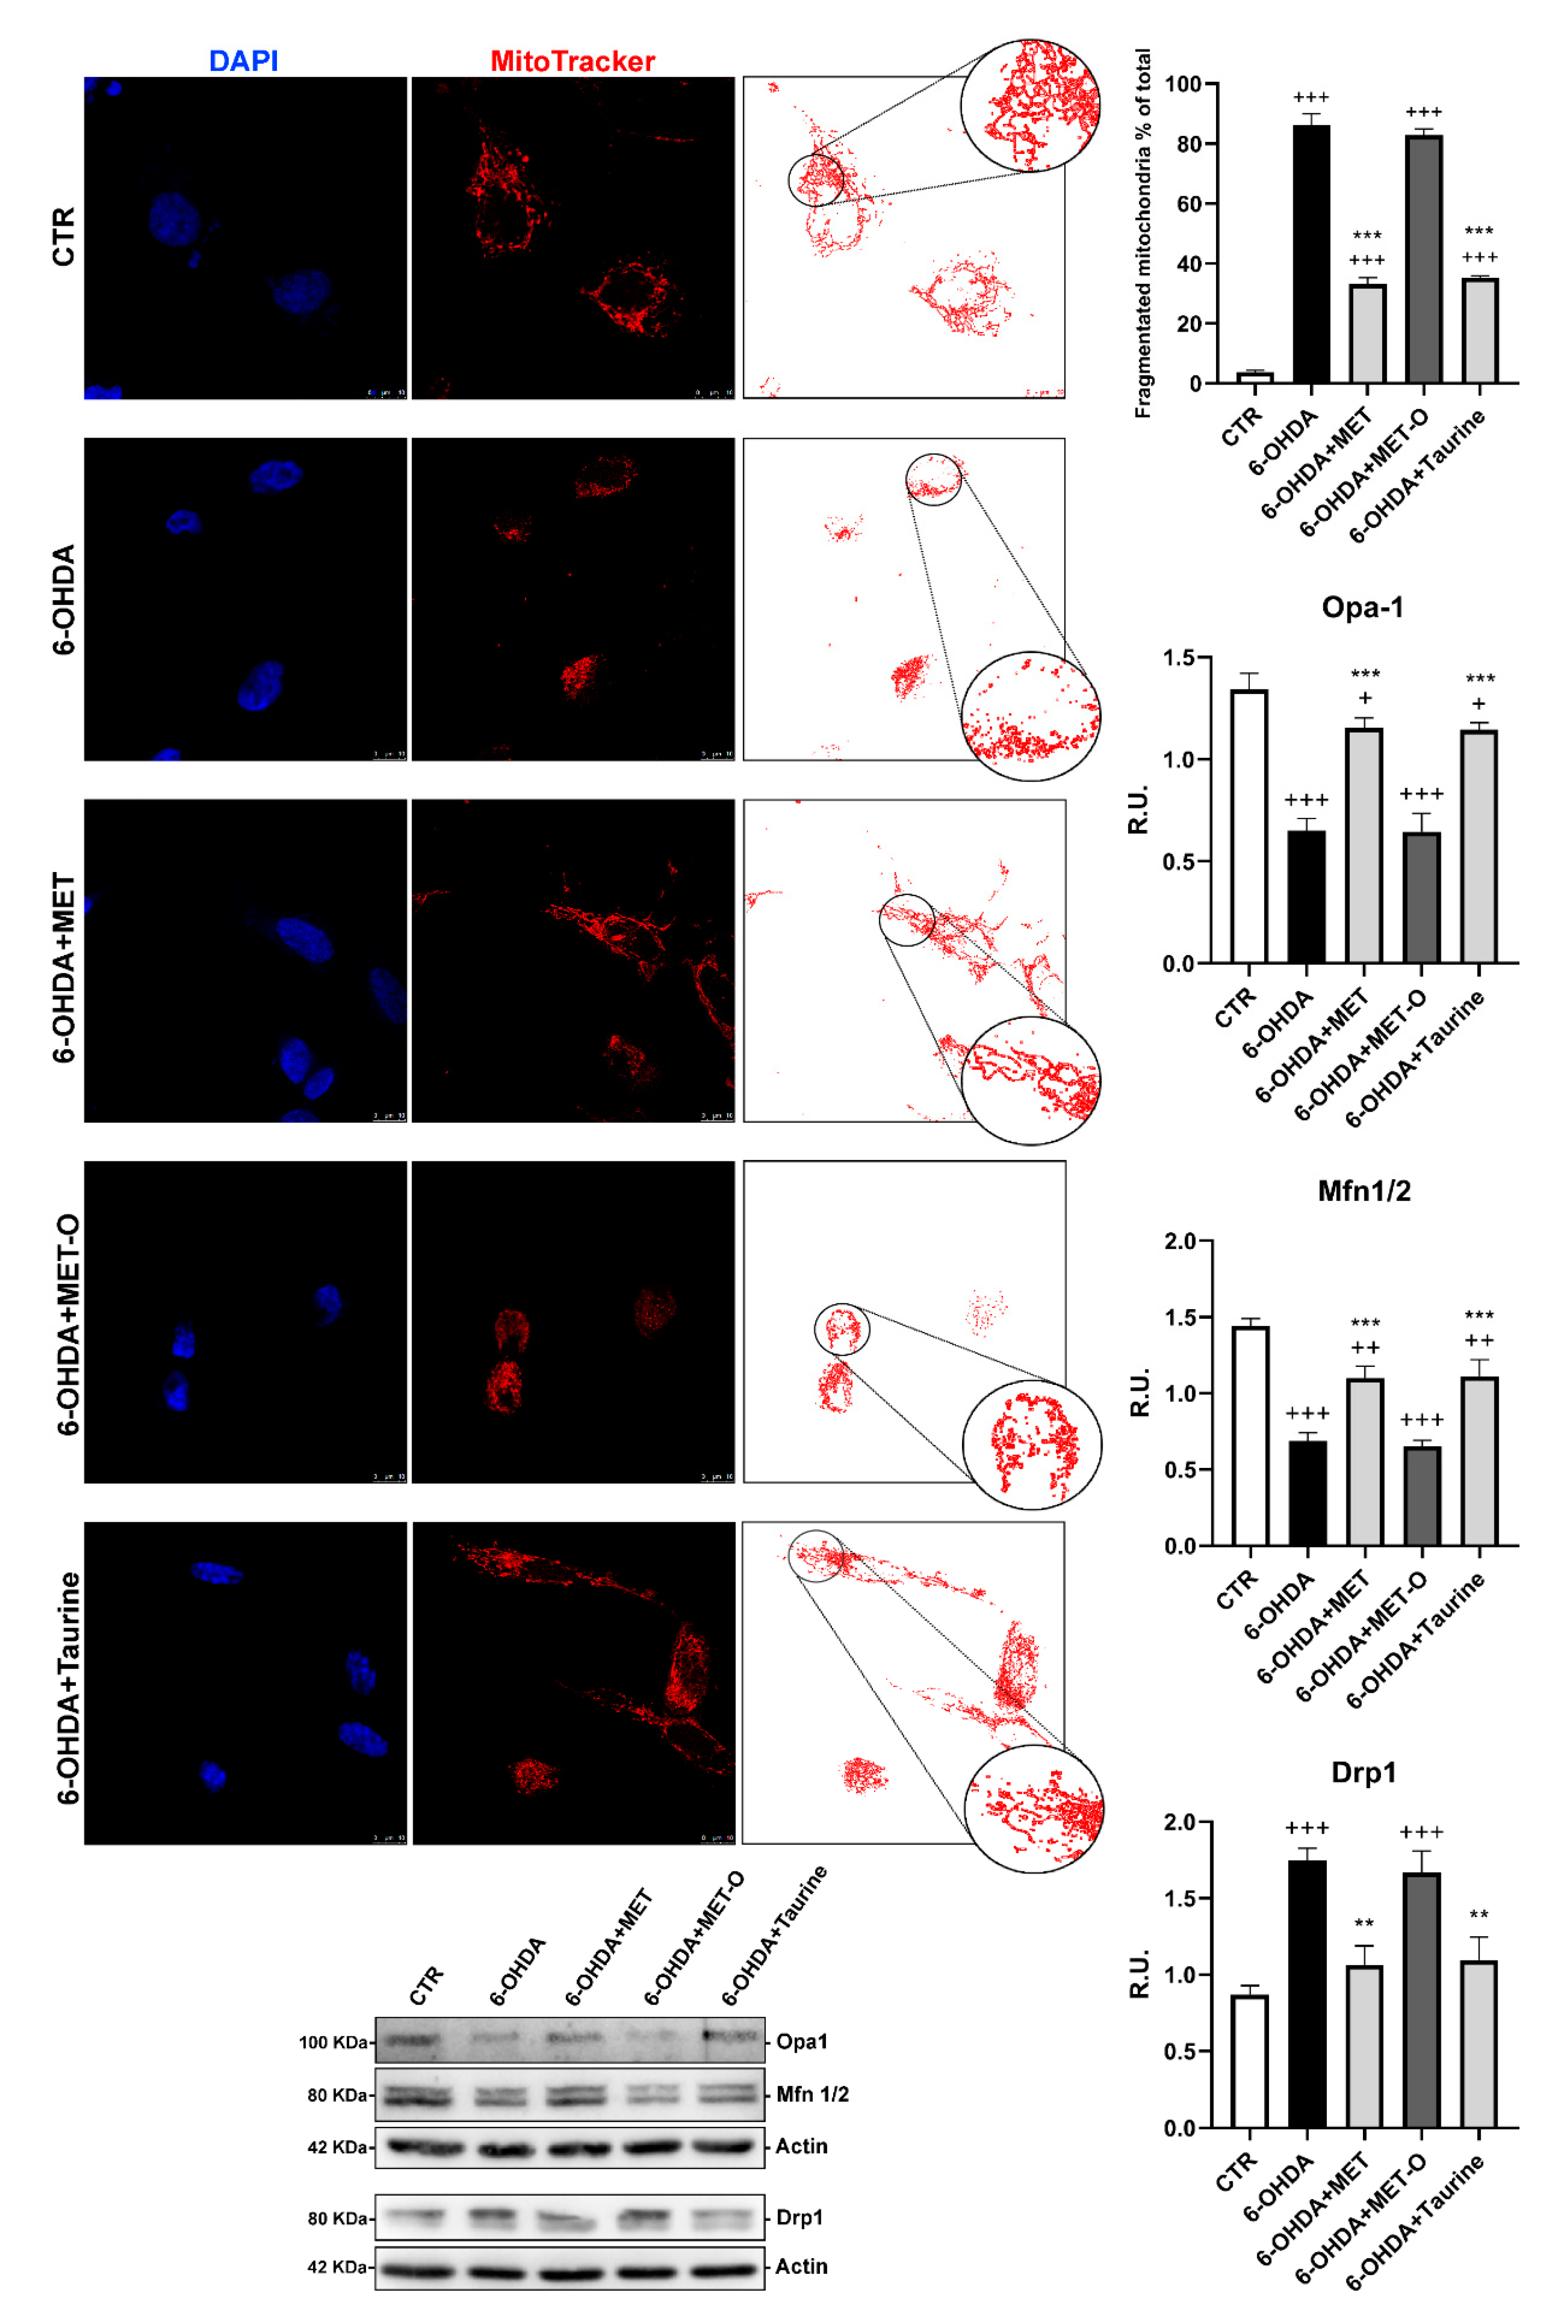
2.6. Mitotracker Deep Red and Quantification of Mitochondrial Fragmentation
2.7. Mitosox
2.8. TMRM
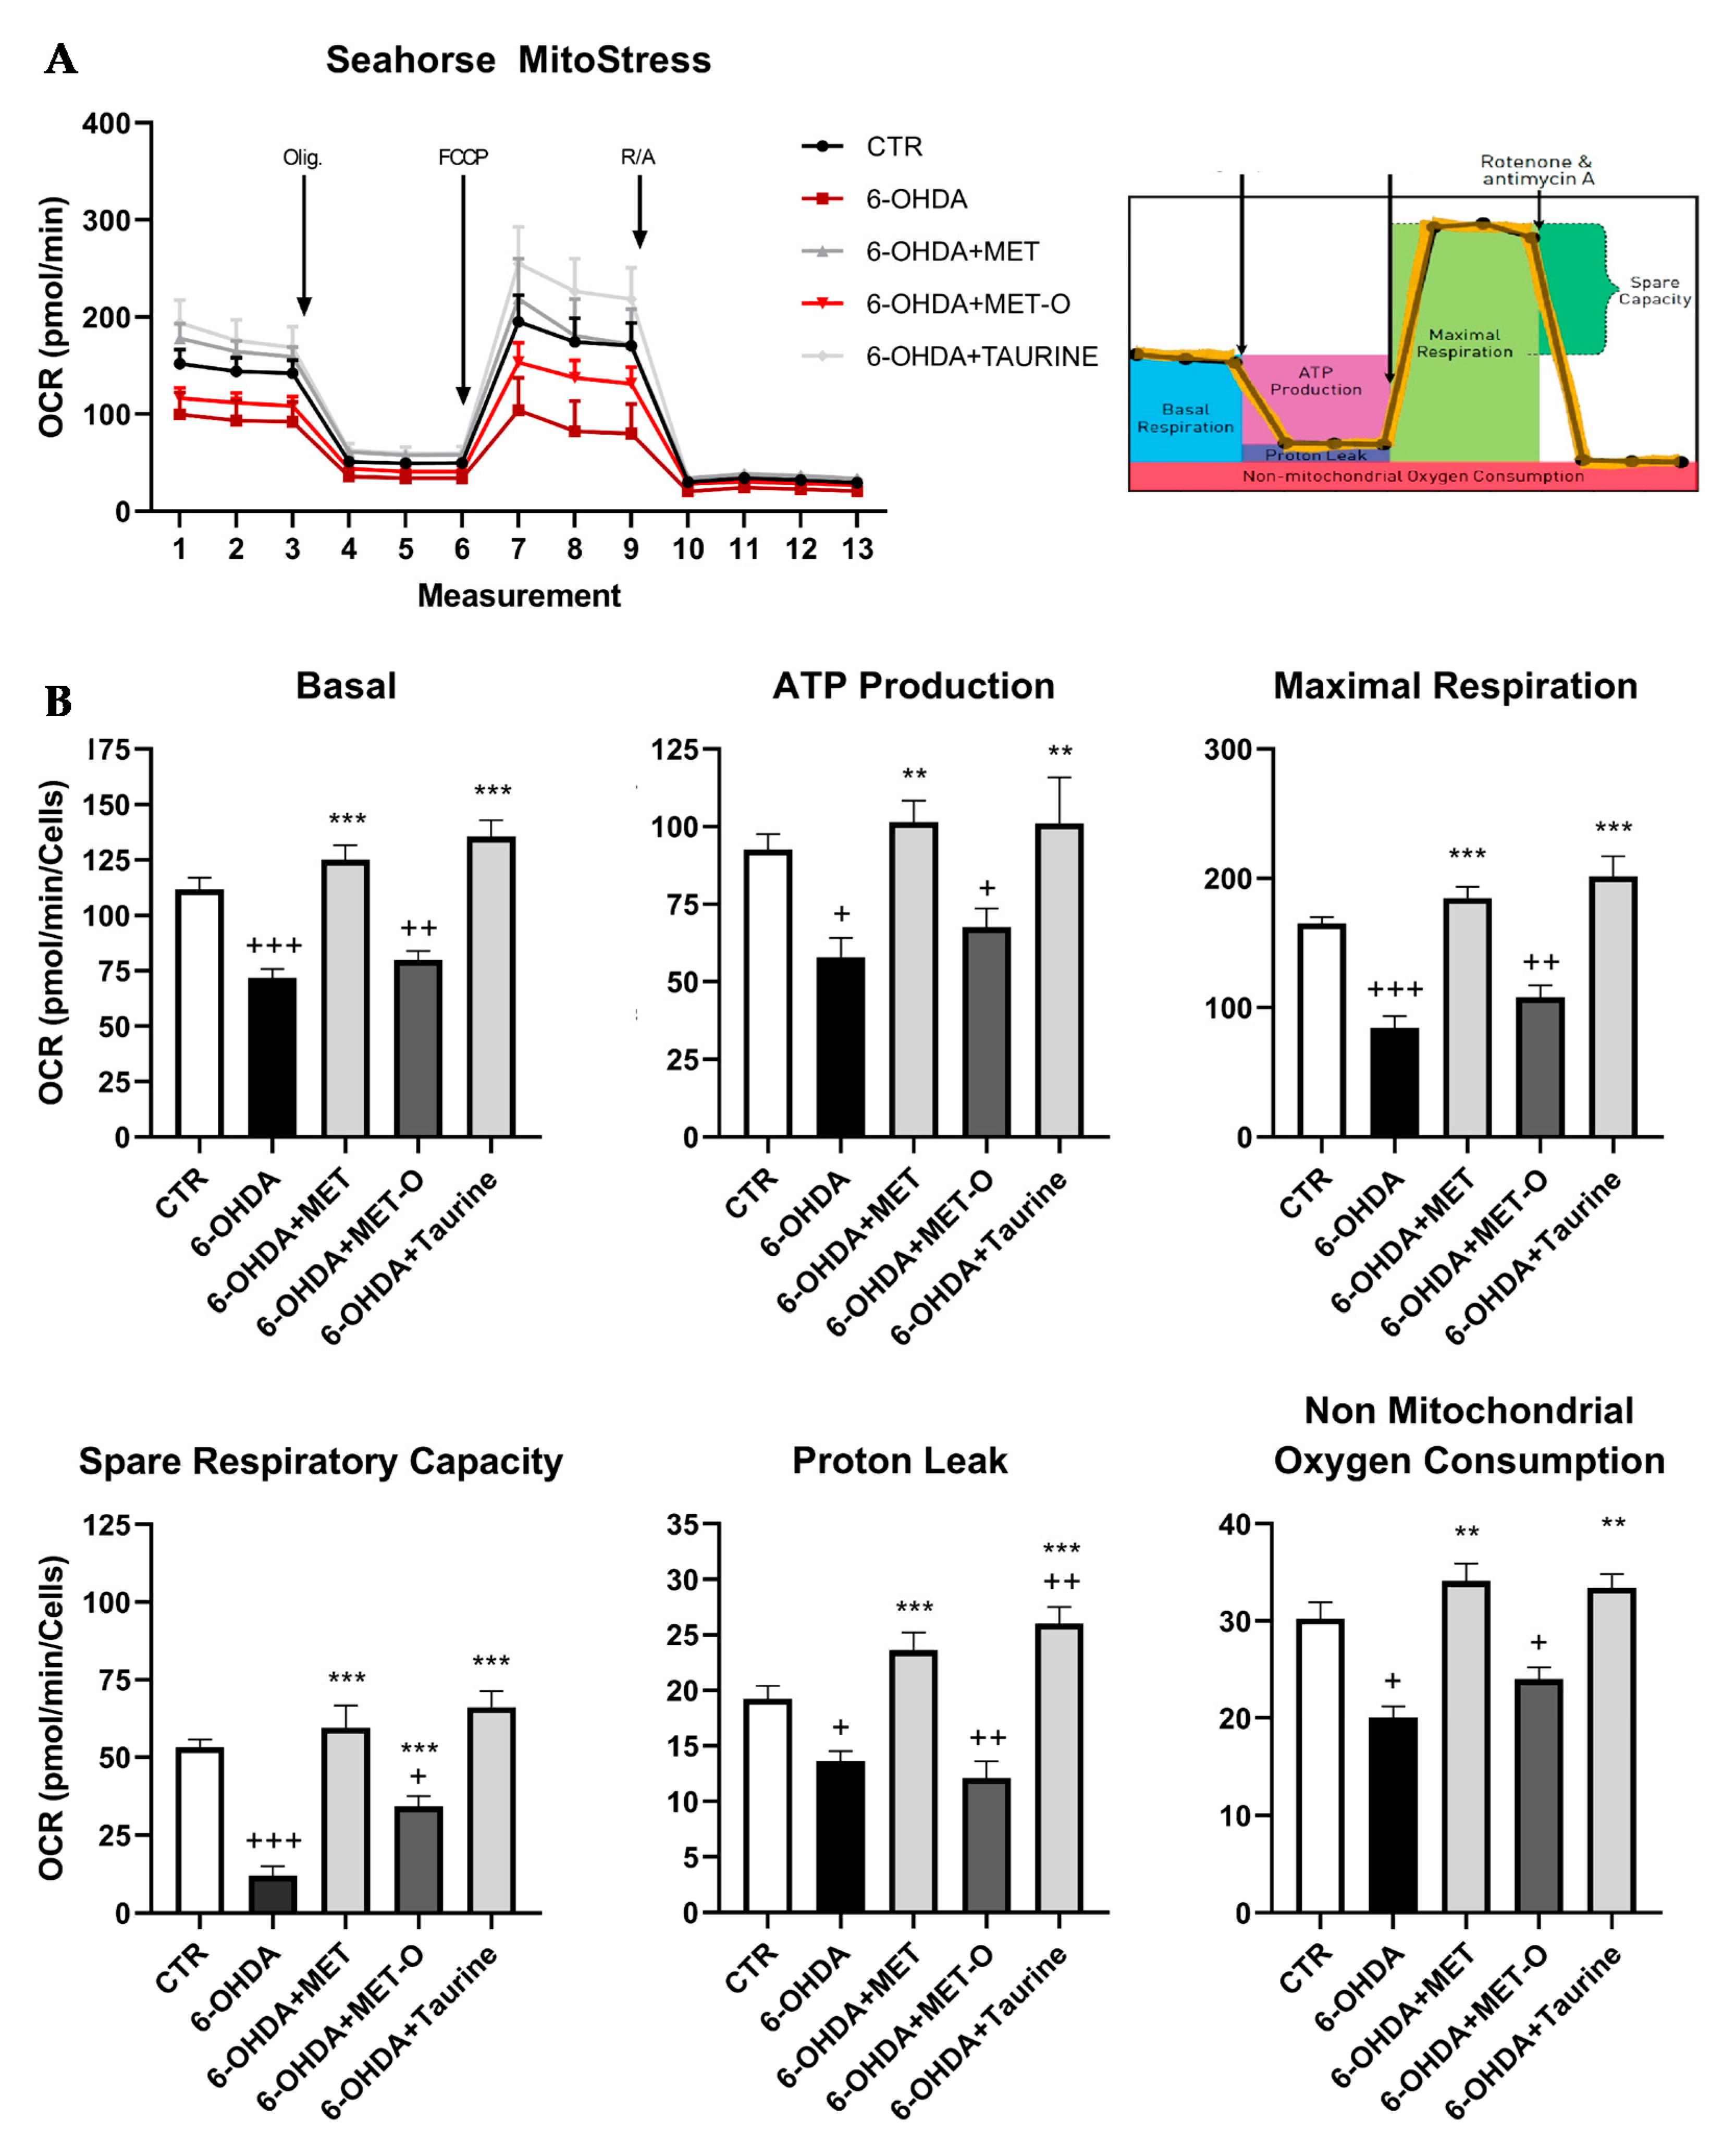
2.9. Seahorse Mito Stress Assay
2.10. SOD Activity Assay Kit
2.11. Expression Analysis: RNA-Seq and Gene Clustering
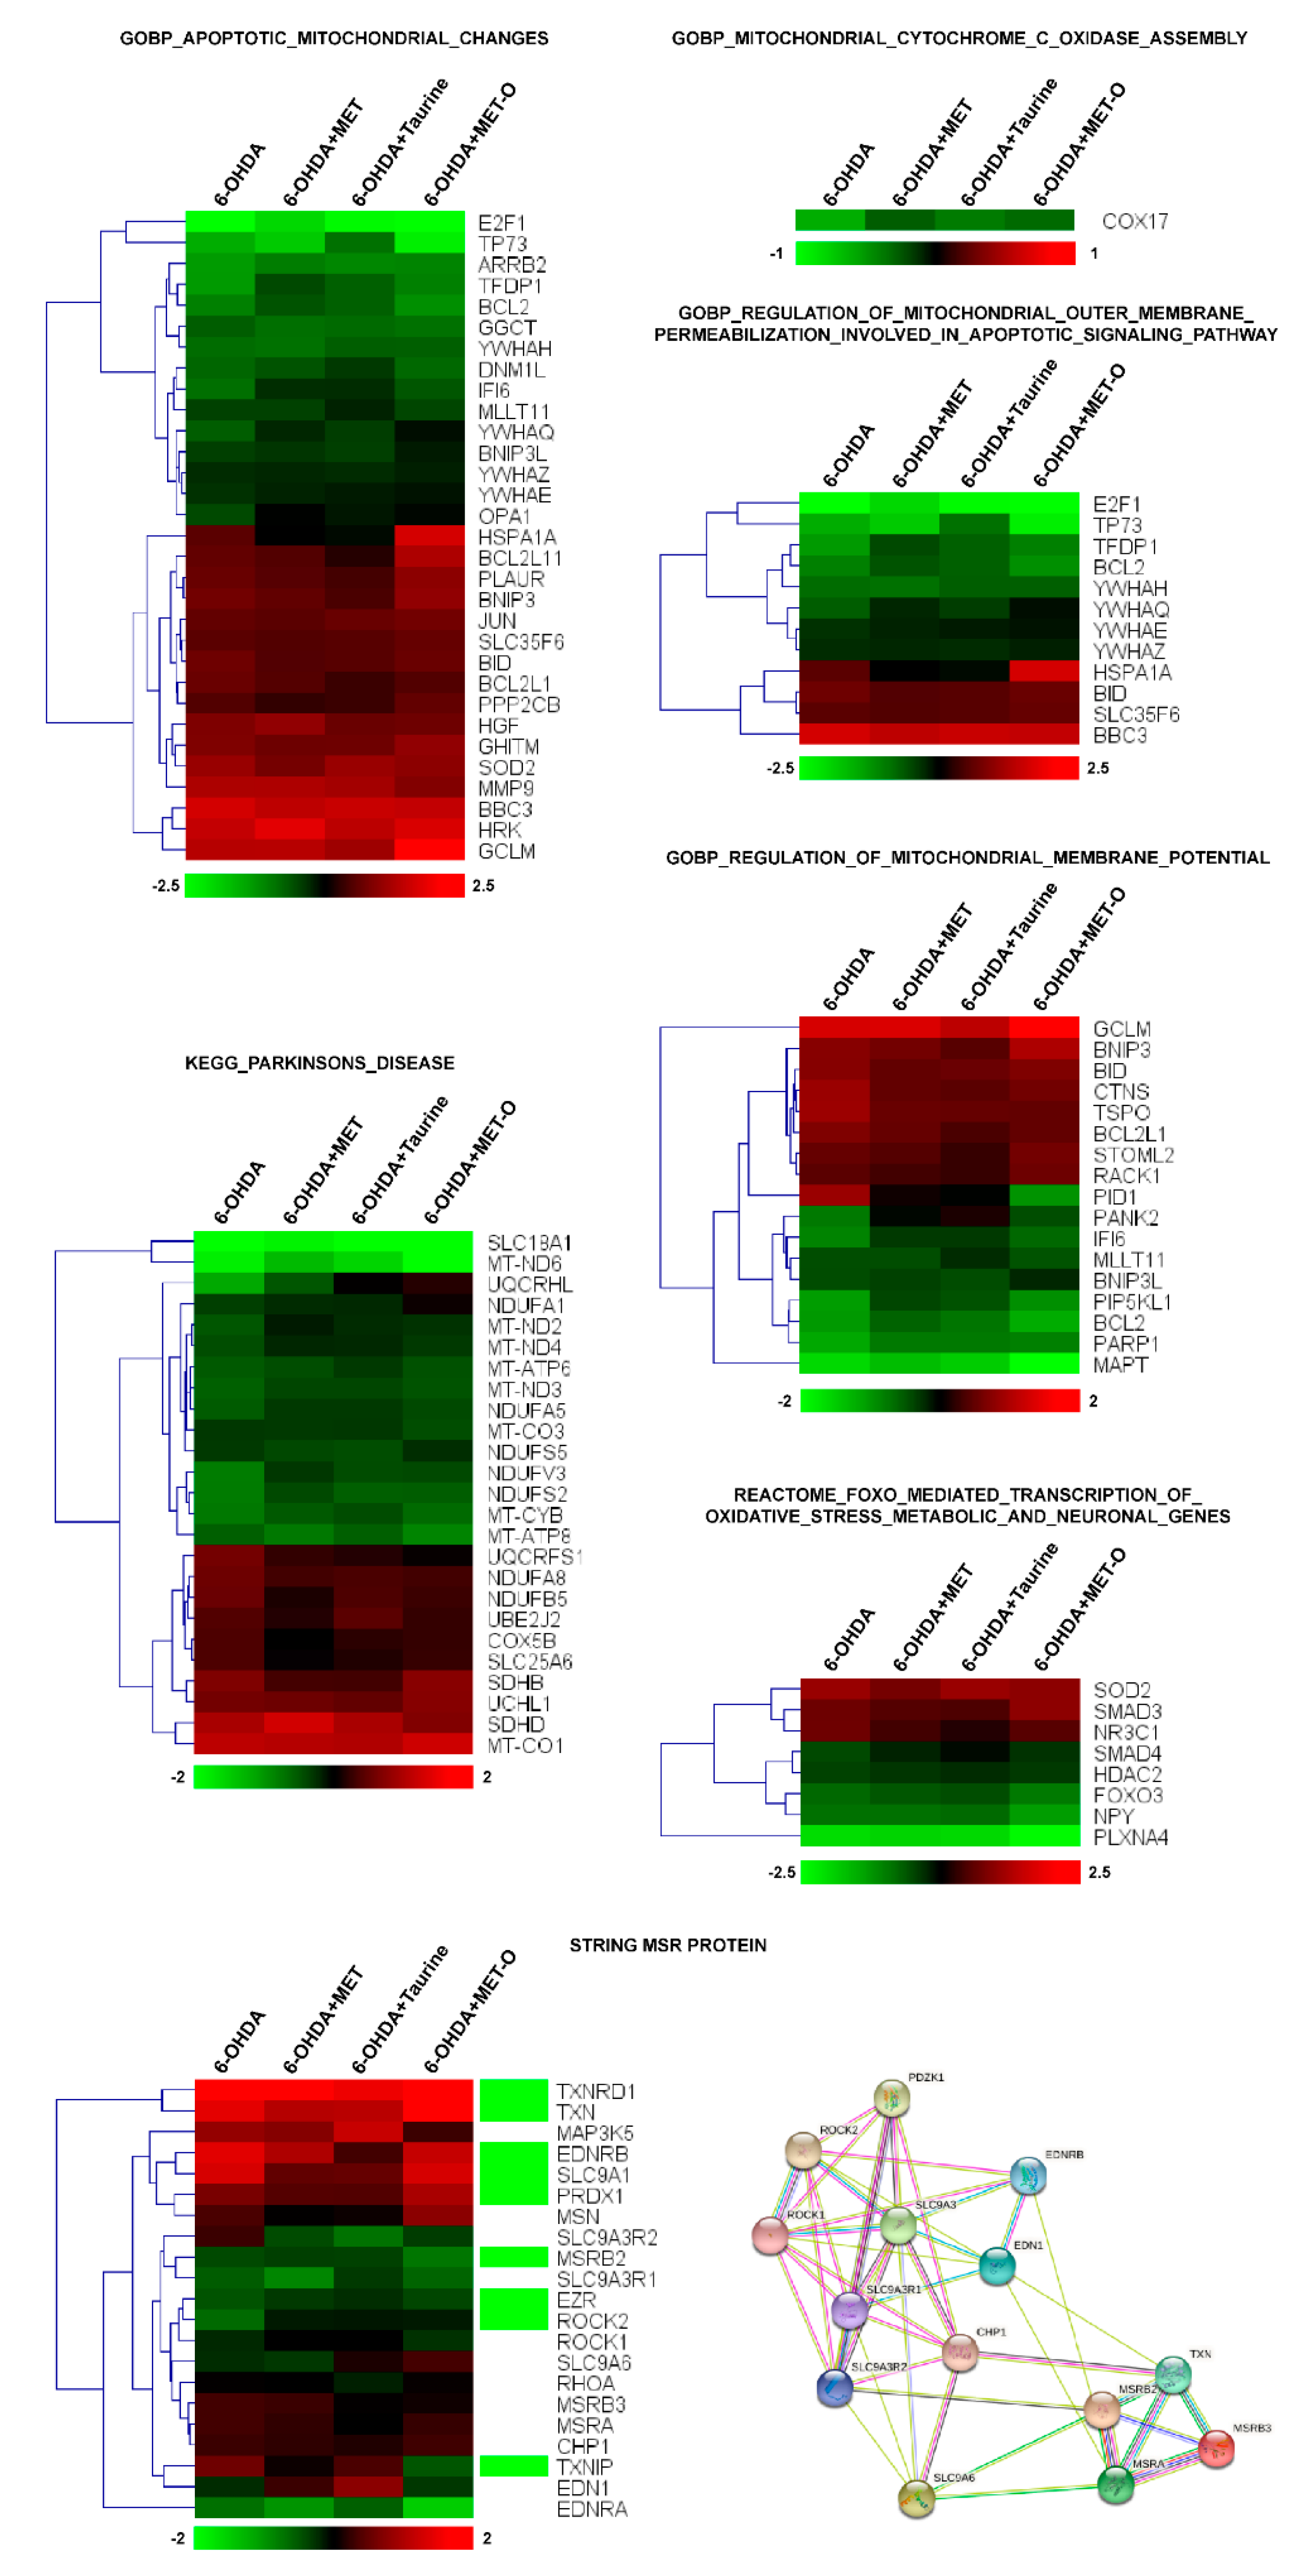
2.12. Bioinformatic Analysis
- -
- Network edges represent data from high-throughput lab experiments, (conserved) co-expression, and previous knowledge in databases.
- -
- The interaction score cutoff used was 0.7 (high confidence).
- -
- The list of proteins used was generated starting from the expression data achieved by RNA-seq. The log(2) of the 6-OHDA+drug (methionine or taurine) compared to 6-OHDA alone was calculated as the difference between log(2) observed in the 6-OHDA+drug and 6-OHDA samples compared to untreated cells, respectively. For the analysis we used the genes with a log(2) >of 0.4 and <−0.4; these genes are mentioned in the text as “recovered”.
2.13. Statistical Analysis
3. Results
3.1. Methionine and Taurine Counteract 6-OHDA Injury
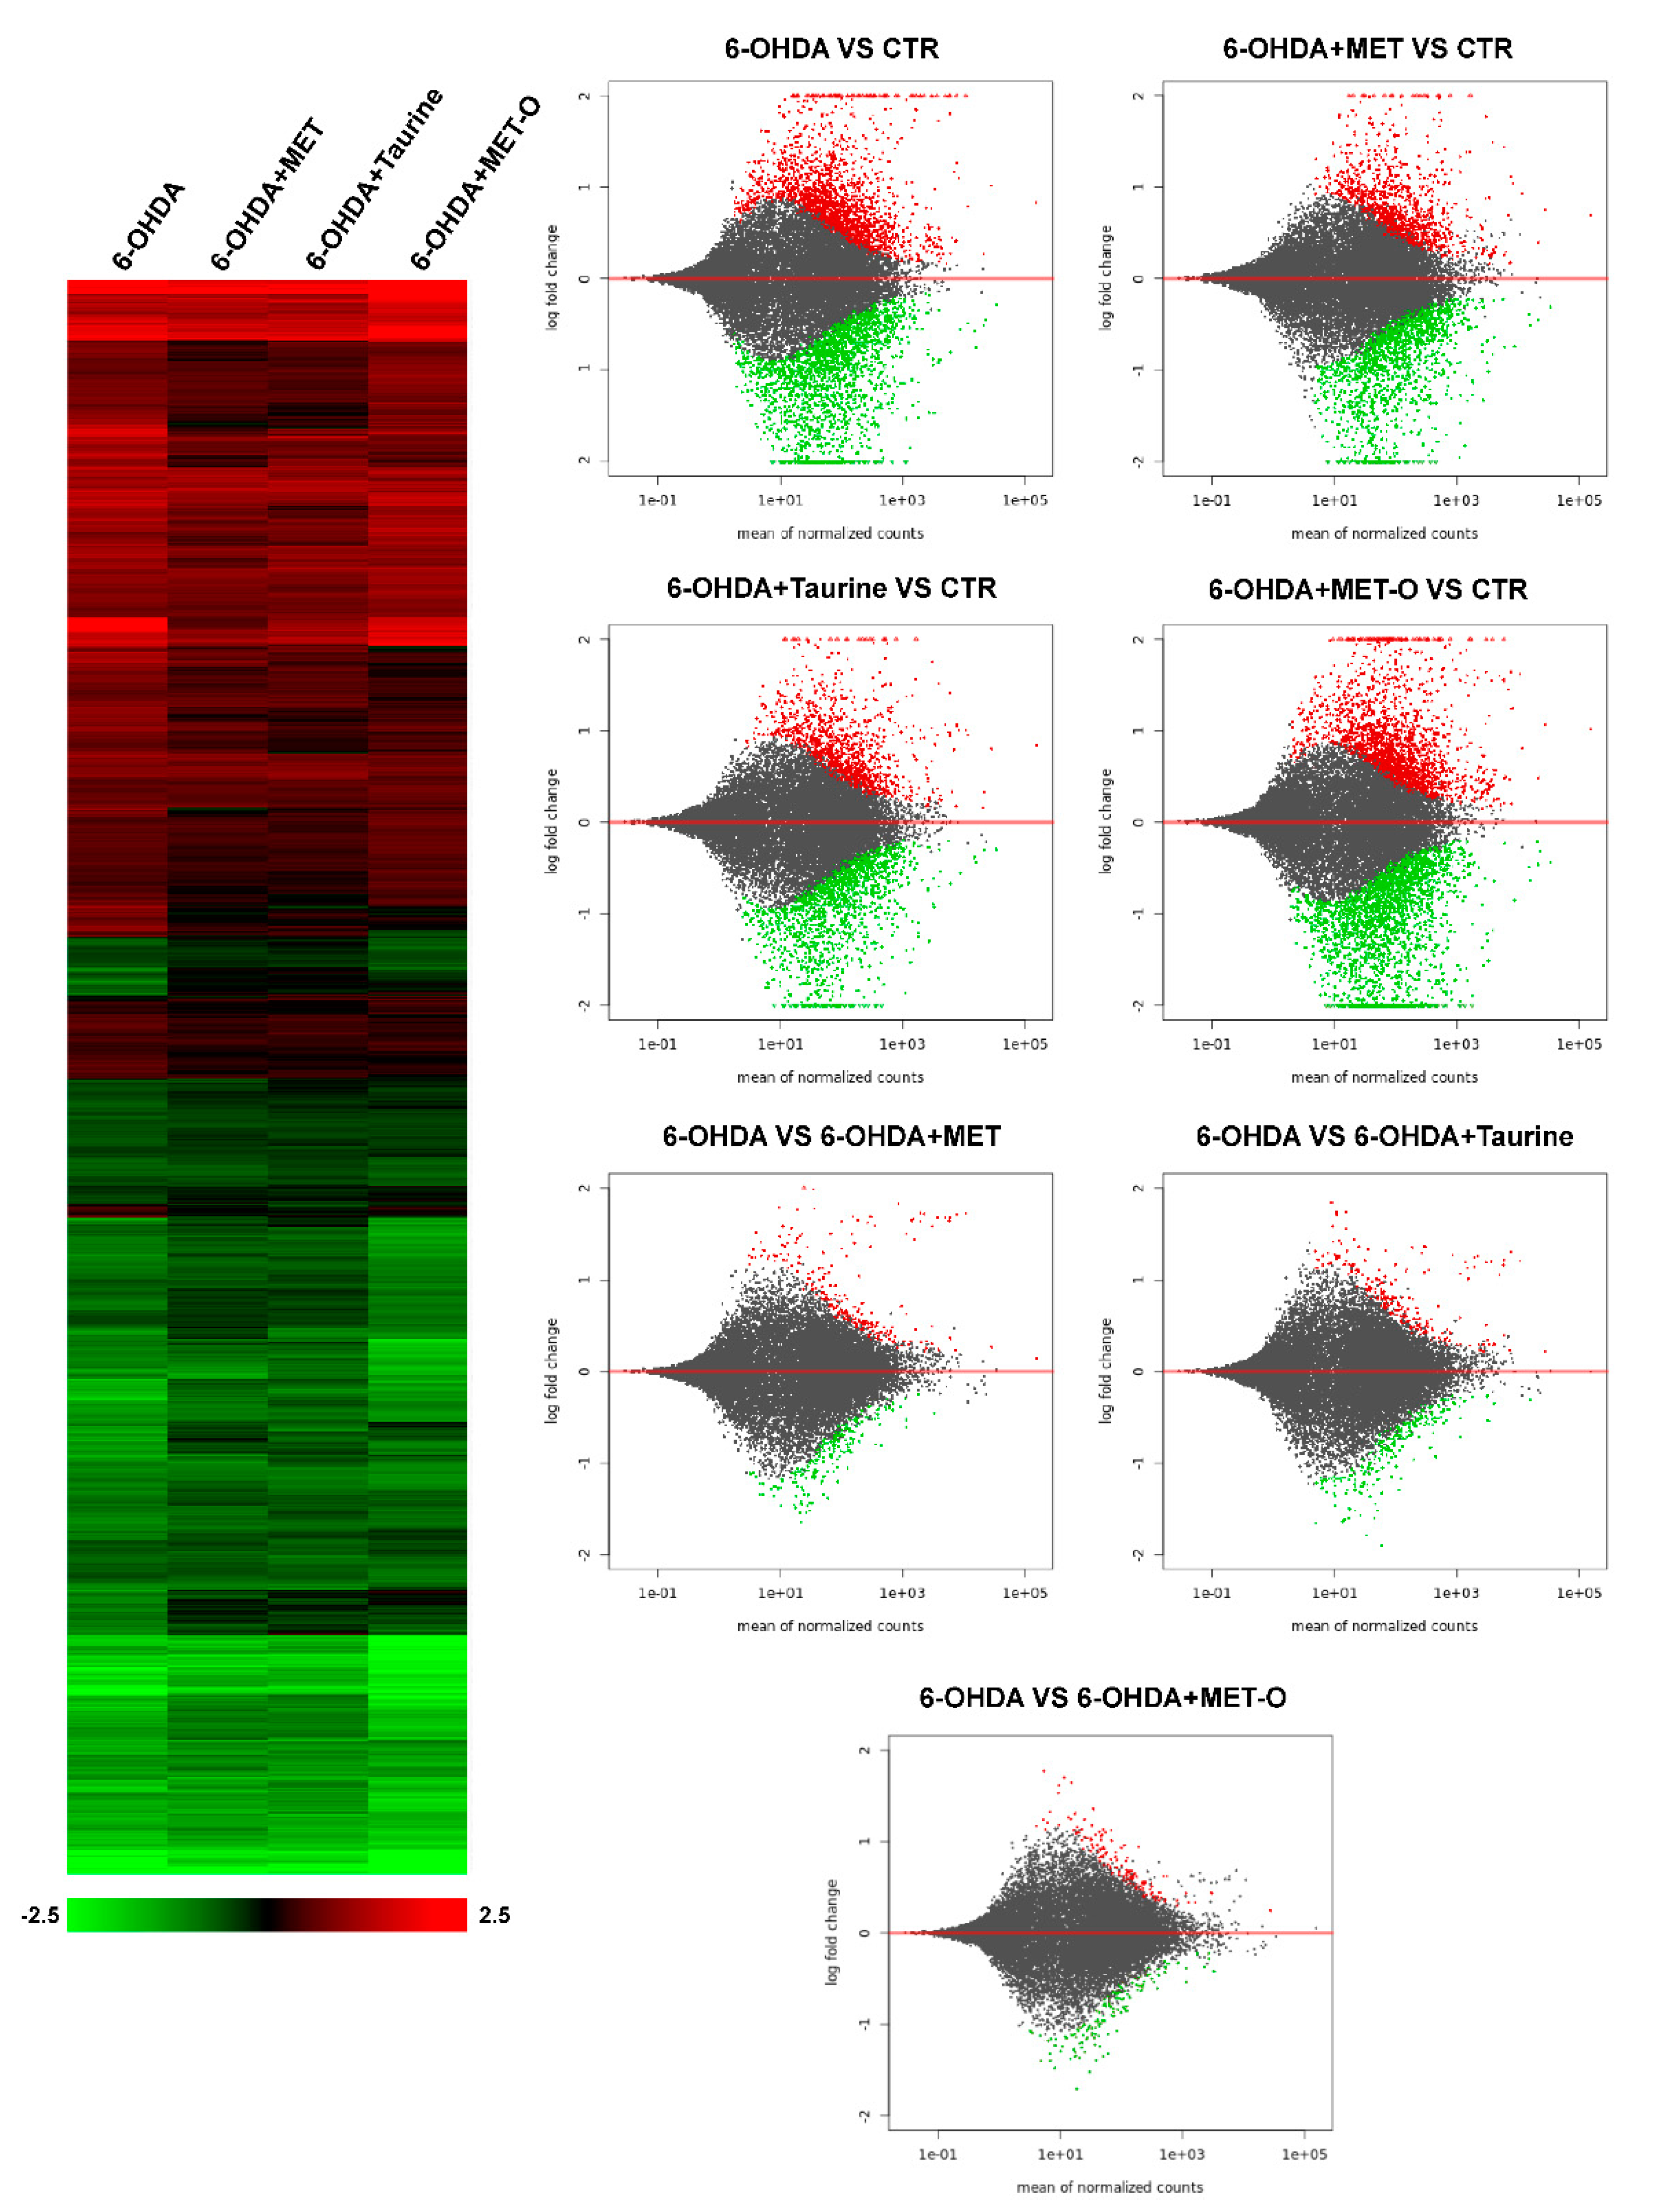
3.2. RNA-Sequencing Analysis
3.3. Methionine and Taurine Counteract 6-OHDA-Induced Apoptosis
3.4. Methionine and Taurine Effects on the Survival and Neuroprotective Pathways
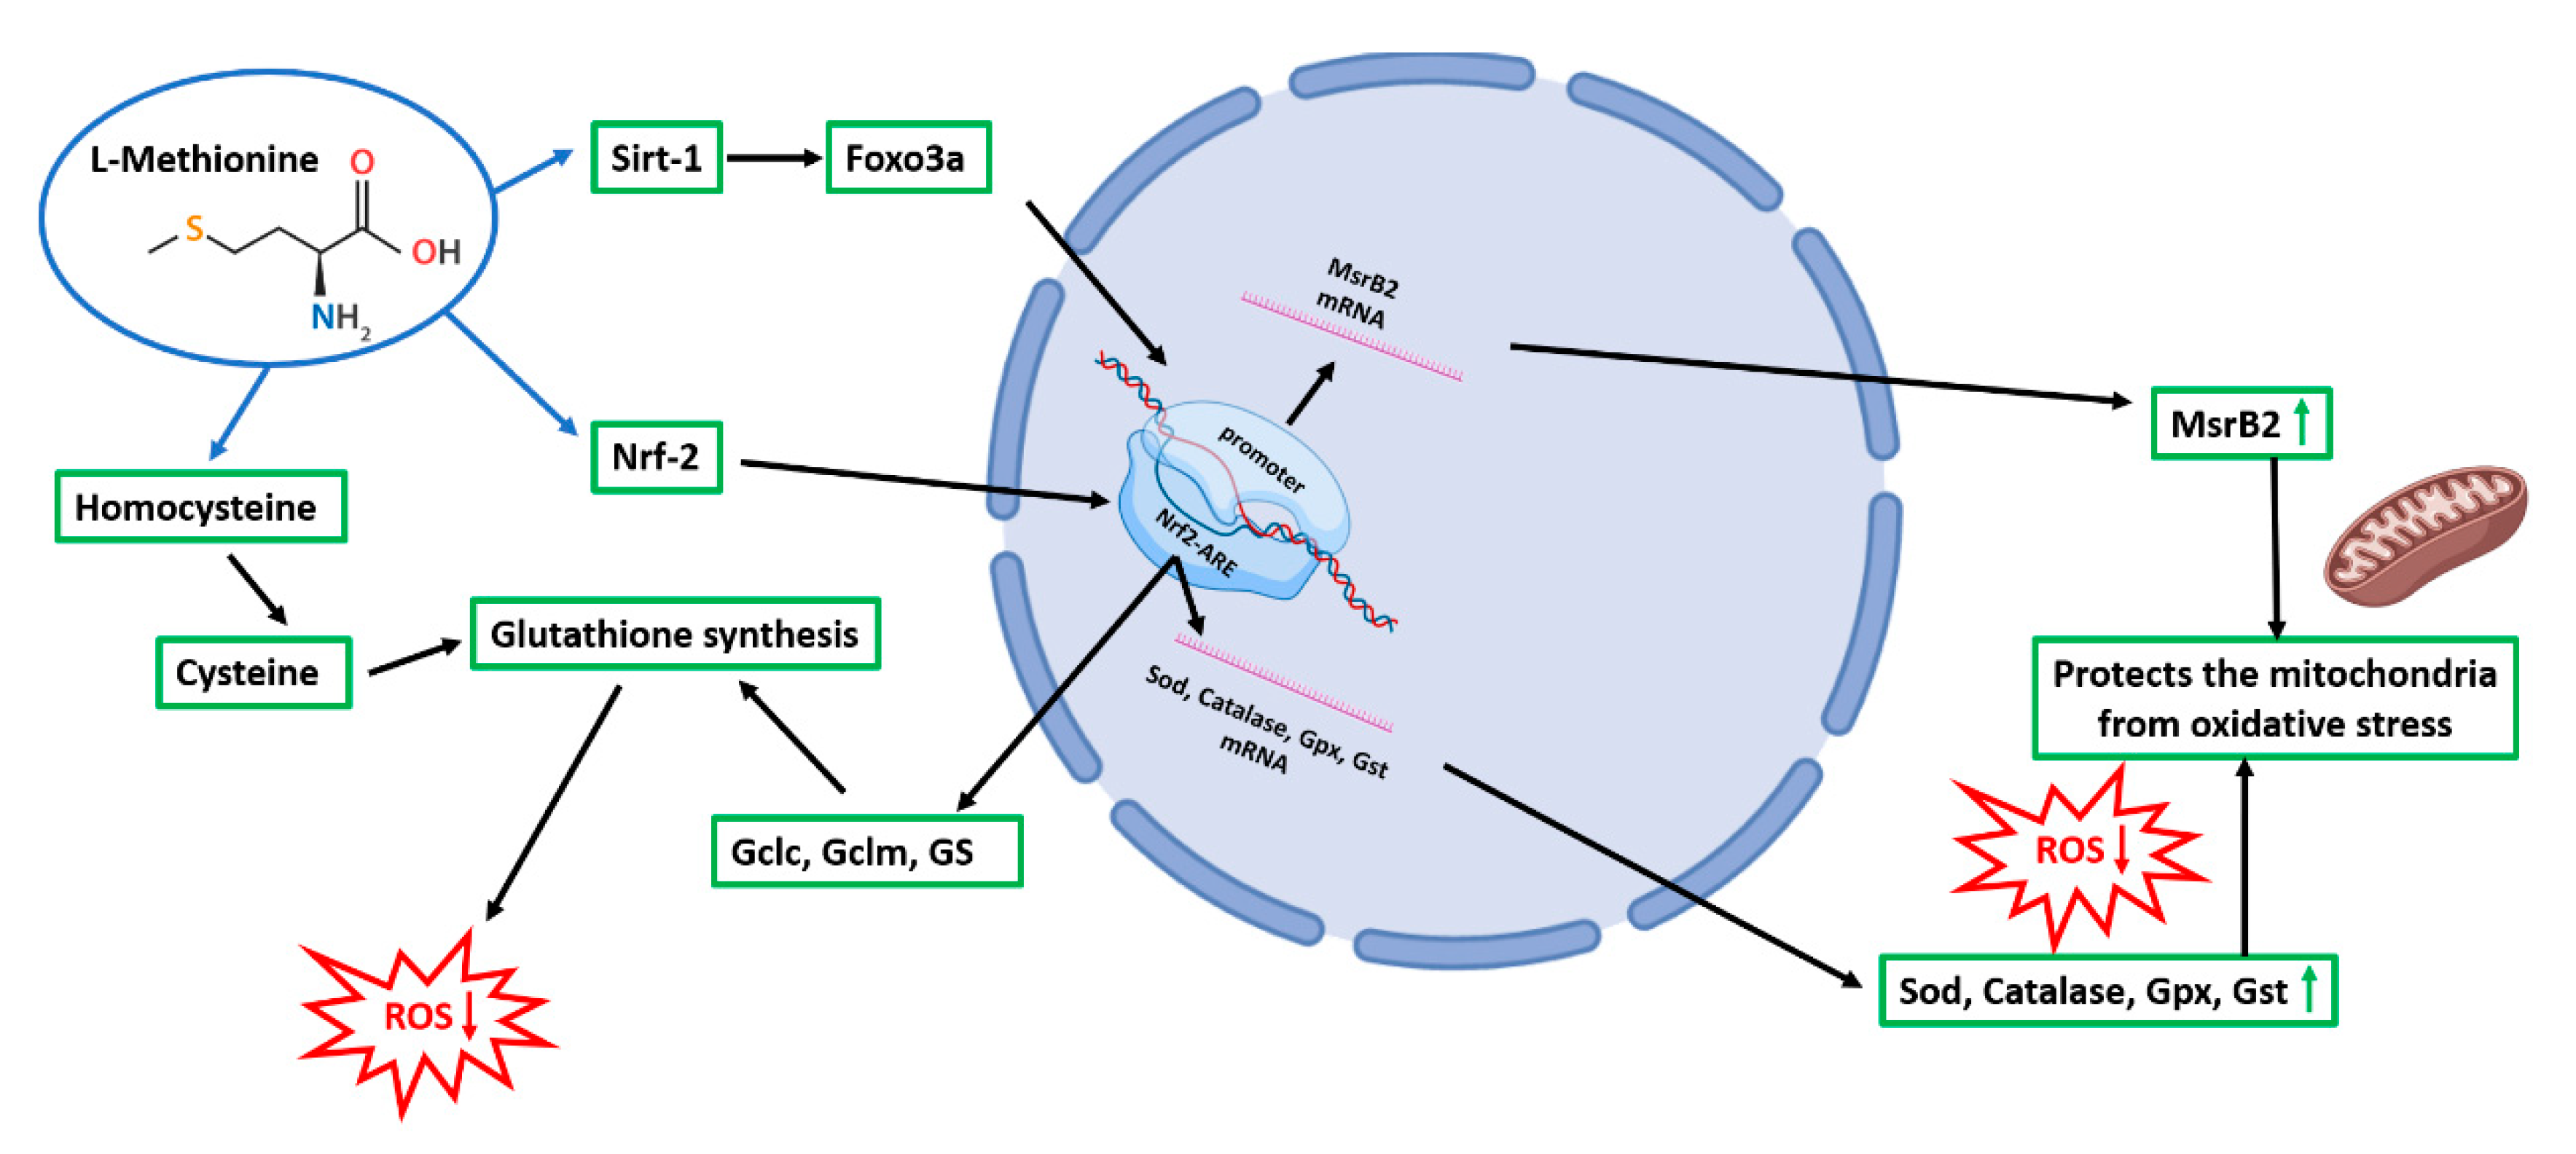
3.5. Methionine and Taurine Effects on the 6-OHDA-Induced Oxidative Stress Signaling Pathways
3.6. Methionine and Taurine Preserve Mitochondrial Functionality and Morphology
3.7. Methionine and Taurine Rescue 6-OHDA-Altered Bioenergetic Profile
4. Discussion and Conclusions
Supplementary Materials
Author Contributions
Funding
Institutional Review Board Statement
Informed Consent Statement
Data Availability Statement
Conflicts of Interest
References
- Dias, V.; Junn, E.; Mouradian, M.M. The role of oxidative stress in Parkinson’s disease. J. Parkinson Dis. 2013, 3, 461–491. [Google Scholar] [CrossRef] [Green Version]
- Wei, Z.; Li, X.; Li, X.; Liu, Q.; Cheng, Y. Oxidative stress in Parkinson’s disease: A systematic review and meta-analysis. Front. Mol. Neurosci. 2018, 11, 236. [Google Scholar] [CrossRef] [PubMed]
- Weissbach, H.; Etiennea, F.; Hoshib, T.; Heinemann, S.H.; Lowtherd, W.T.; Matthewsd, B.; John, G.S.; Nathane, C.; Brotef, N. Peptide methionine sulfoxide reductase: Structure, mechanism of action, and biological function. Arch. Biochem. Biophys. 2002, 397, 172–178. [Google Scholar] [CrossRef]
- Yermolaieva, O.; Xu, R.; Schinstock, C.; Brot, N.; Weissbach, H.; Heinemann, S.H.; Hoshi, T. Methionine sulfoxide reductase A protects neuronal cells against brief hypoxia/reoxygenation. Proc. Natl. Acad. Sci. USA 2004, 101, 1159–1164. [Google Scholar] [CrossRef] [Green Version]
- Ruan, H.; Tang, X.D.; Chen, M.-L.; Joiner, M.-L.; Sun, G.; Brot, N.; Weissbach, H.; Heinemann, S.H.; Iverson, L.; Wu, C.-F.; et al. High-quality life extension by the enzyme peptide methionine sulfoxide reductase. Proc. Natl. Acad. Sci. USA 2002, 99, 2748–2753. [Google Scholar] [CrossRef] [PubMed] [Green Version]
- Moskovitz, J.; Bar-Noy, S.; Williams, W.M.; Requena, J.; Berlett, B.S.; Stadtman, E.R. Methionine sulfoxide reductase (MsrA) is a regulator of antioxidant defense and lifespan in mammals. Proc. Natl. Acad. Sci. USA 2001, 98, 12920–12925. [Google Scholar] [CrossRef] [Green Version]
- Achour, I.; Arel-Dubeau, A.-M.; Renaud, J.; Legrand, M.; Attard, E.; Germain, M.; Martinoli, M.-G. Oleuropein prevents neuronal death, mitigates mitochondrial superoxide production and modulates autophagy in a dopaminergic cellular model. Int. J. Mol. Sci. 2016, 17, 1293. [Google Scholar] [CrossRef] [PubMed] [Green Version]
- Martínez, Y.; Li, X.; Liu, G.; Bin, P.; Yan, W.; Más, D.; Valdivié, M.; Hu, C.-A.A.; Ren, W.; Yin, Y. The role of methionine on metabolism, oxidative stress, and diseases. Amino Acids 2017, 49, 2091–2098. [Google Scholar] [CrossRef] [PubMed]
- Brosnan, J.T.; Brosnan, M.E. The sulfur-containing amino acids: An overview. J. Nutr. 2006, 136, 1636S–1640S. [Google Scholar] [CrossRef] [Green Version]
- Liu, F.; Hindupur, J.; Nguyen, J.L.; Ruf, K.J.; Zhu, J.; Schieler, J.L.; Bonham, C.C.; Wood, K.V.; Davisson, V.J.; Rochet, J.-C. Methionine sulfoxide reductase A protects dopaminergic cells from Parkinson’s disease-related insults. Free Radic. Biol. Med. 2008, 45, 242–255. [Google Scholar] [CrossRef] [Green Version]
- Lourenço, R.; Camilo, M.E. taurine: A conditionally essential amino acid in humans? An overview in health and dis-ease. Nutr. Hosp. 2002, 17, 262–270. [Google Scholar] [PubMed]
- Menzie, J.; Pan, C.; Prentice, H.; Wu, J.-Y. Taurine and central nervous system disorders. Amino Acids 2014, 46, 31–46. [Google Scholar] [CrossRef] [PubMed]
- Liu, X.-Z.; Wang, F.-C.; Wang, Y.; Zhang, J.-X. Efficacy of a combination of taurine and stenosis removing on cognitive impairment induced by carotid artery stenosis in rats. Eur. Rev. Med. Pharmacol. Sci. 2017, 21, 1884–1890. [Google Scholar] [PubMed]
- Paula-Lima, A.C.; De Felice, F.G.; Brito-Moreira, J.; Ferreira, S.T. Activation of GABAA receptors by taurine and muscimol blocks the neurotoxicity of β-amyloid in rat hippocampal and cortical neurons. Neuropharmacology 2005, 49, 1140–1148. [Google Scholar] [CrossRef]
- Saumier, D.; Duong, A.; Haine, D.; Garceau, D.; Sampalis, J. Domain-specific cognitive effects of tramiprosate in patients with mild to moderate Alzheimer’s disease: ADAS-cog subscale results from the Alphase study. J. Nutr. Health Aging 2009, 13, 808–812. [Google Scholar] [CrossRef]
- Neuwirth, L.S.; Volpe, N.P.; Ng, S.; Marsillo, A.; Corwin, C.; Madan, N.; Ferraro, A.M.; El Idrissi, A. Taurine recovers mice emotional learning and memory disruptions associated with fragile X syndrome in context fear and auditory cued-conditioning. Adv. Exp. Med. Biol. 2015, 803, 425–438. [Google Scholar] [CrossRef]
- Che, Y.; Hou, L.; Sun, F.; Zhang, C.; Liu, X.; Piao, F.; Zhang, D.; Li, H.; Wang, Q. Taurine protects dopaminergic neurons in a mouse Parkinson’s disease model through inhibition of microglial M1 polarization. Cell Death Dis. 2018, 9, 435. [Google Scholar] [CrossRef] [Green Version]
- Kumari, N.; Prentice, H.; Wu, J.-Y. Taurine and its neuroprotective role. Adv. Exp. Med. Biol. 2013, 775, 19–27. [Google Scholar] [CrossRef]
- Schaffer, S.; Kim, H.W. Effects and mechanisms of taurine as a therapeutic agent. Biomol. Ther. 2018, 26, 225–241. [Google Scholar] [CrossRef]
- Prentice, H.; Pan, C.; Gharibani, P.M.; Ma, Z.; Price, A.L.; Giraldo, G.S.; Retz, H.M.; Gupta, A.; Chen, P.-C.; Chiu, H.; et al. Analysis of neuroprotection by taurine and taurine combinations in primary neuronal cultures and in neuronal cell lines exposed to glutamate excitotoxicity and to hypoxia/re-oxygenation. Adv. Exp. Med. Biol. 2017, 975, 207–216. [Google Scholar] [CrossRef]
- Pan, C.; Prentice, H.; Price, A.L.; Wu, J.-Y. Beneficial effect of taurine on hypoxia- and glutamate-induced endoplasmic reticulum stress pathways in primary neuronal culture. Amino Acids 2011, 43, 845–855. [Google Scholar] [CrossRef]
- Lee, W.J.; Lee, G.H.; Hur, J.; Lee, H.G.; Kim, E.; Won, J.P.; Cho, Y.; Choi, M.-J.; Seo, H.G. Taurine and ginsenoside Rf induce BDNF expression in SH-SY5Y cells: A potential role of BDNF in corticosterone-triggered cellular damage. Molecules 2020, 25, 2819. [Google Scholar] [CrossRef] [PubMed]
- Takatani, T.; Takahashi, K.; Uozumi, Y.; Shikata, E.; Yamamoto, Y.; Ito, T.; Matsuda, T.; Schaffer, S.W.; Fujio, Y.; Azuma, J. Taurine inhibits apoptosis by preventing formation of the Apaf-1/caspase-9 apoptosome. Am. J. Physiol. Physiol. 2004, 287, C949–C953. [Google Scholar] [CrossRef] [PubMed] [Green Version]
- Hoshi, T.; Heinemann, S.H. Regulation of cell function by methionine oxidation and reduction. J. Physiol. 2001, 531, 1–11. [Google Scholar] [CrossRef] [PubMed]
- Kovalevich, J.; Langford, D. Considerations for the use of SH-SY5Y neuroblastoma cells in neurobiology. In Neuronal Cell Culture: Methods and Protocols; Amini, S., White, M.K., Eds.; Humana Press: Totowa, NJ, USA, 2013; pp. 9–21. [Google Scholar] [CrossRef] [Green Version]
- Zhi, S.-M.; Fang, G.-X.; Xie, X.-M.; Liu, L.-H.; Yan, J.; Liu, D.-B.; Yu, H.-Y. Melatonin reduces OGD/R-induced neuron injury by regulating redox/inflammation/apoptosis signaling. Eur. Rev. Med. Pharmacol. Sci. 2020, 24, 1524–1536. [Google Scholar] [PubMed]
- Castelli, V.; d’Angelo, M.; Lombardi, F.; Alfonsetti, M.; Antonosante, A.; Catanesi, M.; Benedetti, E.; Palumbo, P.; Cifone, M.G.; Giordano, A.; et al. Effects of the probiotic formulation SLAB51 in in vitro and in vivo Parkinson’s disease models. Aging 2020, 12, 4641–4659. [Google Scholar] [CrossRef]
- Castelli, V.; Antonucci, I.; D’Angelo, M.; Tessitore, A.; Zelli, V.; Benedetti, E.; Ferri, C.; Desideri, G.; Borlongan, C.; Stuppia, L.; et al. Neuroprotective effects of human amniotic fluid stem cells-derived secretome in an ischemia/reperfusion model. STEM CELLS Transl. Med. 2021, 10, 251–266. [Google Scholar] [CrossRef]
- Brandolini, L.; D’Angelo, M.; Antonosante, A.; Villa, S.; Cristiano, L.; Castelli, V.; Benedetti, E.; Catanesi, M.; Aramini, A.; Luini, A.; et al. Differential protein modulation by ketoprofen and ibuprofen underlines different cellular response by gastric epithelium. J. Cell. Physiol. 2018, 233, 2304–2312. [Google Scholar] [CrossRef]
- del Campo, A.; Parra, V.; Vásquez-Trincado, C.; Gutiérrez, T.; Morales, P.E.; Lopez-Crisosto, C.; Bravo-Sagua, R.; Navarro-Márquez, M.; Verdejo, H.E.; Ferrat, A.E.C.; et al. Mitochondrial fragmentation impairs insulin-dependent glucose uptake by modulating Akt activity through mitochondrial Ca2+ uptake. Am. J. Physiol. Metab. 2014, 306, E1–E13. [Google Scholar] [CrossRef]
- Szabo, A.; Sumegi, K.; Fekete, K.; Hocsak, E.; Debreceni, B.; Setalo, G.; Kovacs, K.; Deres, L.; Kengyel, A.; Kovacs, D.; et al. Activation of mitochondrial fusion provides a new treatment for mitochondria-related diseases. Biochem. Pharmacol. 2018, 150, 86–96. [Google Scholar] [CrossRef]
- Huang, D.W.; Sherman, B.T.; Lempicki, R. Systematic and integrative analysis of large gene lists using DAVID bioinformatics resources. Nat. Protoc. 2008, 4, 44–57. [Google Scholar] [CrossRef] [PubMed]
- Szklarczyk, D.; Franceschini, A.; Kuhn, M.; Simonovic, M.; Roth, A.; Minguez, P.; Doerks, T.; Stark, M.; Muller, J.; Bork, P.; et al. The STRING database in 2011: Functional interaction networks of proteins, globally integrated and scored. Nucleic Acids Res. 2010, 39, D561–D568. [Google Scholar] [CrossRef] [PubMed]
- Maiese, K. Targeting the core of neurodegeneration: FoxO, mTOR, and SIRT1. Neural Regen. Res. 2021, 16, 448–455. [Google Scholar] [CrossRef]
- Bomba, M.; Granzotto, A.; Castelli, V.; Onofrj, M.; Lattanzio, R.; Cimini, A.; Sensi, S.L. Exenatide reverts the high-fat-diet-induced impairment of BDNF signaling and inflammatory response in an animal model of Alzheimer’s disease. J. Alzheimer Dis. 2019, 70, 793–810. [Google Scholar] [CrossRef]
- Liu, Y.; Zhang, Y.; Zhu, K.; Chi, S.; Wang, C.; Xie, A. Emerging role of Sirtuin 2 in Parkinson’s disease. Front. Aging Neurosci. 2020, 11, 372. [Google Scholar] [CrossRef] [Green Version]
- Ren, Z.; He, H.; Zuo, Z.; Xu, Z.; Wei, Z.; Deng, J. The role of different SIRT1-mediated signaling pathways in toxic injury. Cell. Mol. Biol. Lett. 2019, 24, 1–10. [Google Scholar] [CrossRef] [PubMed] [Green Version]
- de Castro, I.P.; Martins, L.M.; Loh, S.H.Y. Mitochondrial quality control and Parkinson’s disease: A pathway unfolds. Mol. Neurobiol. 2011, 43, 80–86. [Google Scholar] [CrossRef] [Green Version]
- Guo, C.; Sun, L.; Chen, X.; Zhang, D. Oxidative stress, mitochondrial damage and neurodegenerative diseases. Neural Regen. Res. 2013, 8, 2003–2014. [Google Scholar] [CrossRef] [PubMed]
- Cenini, G.; Lloret, A.; Cascella, R. Oxidative stress in neurodegenerative diseases: From a mitochondrial point of view. Oxidative Med. Cell. Longev. 2019, 2019, 1–18. [Google Scholar] [CrossRef] [Green Version]
- Lee, B.C.; Gladyshev, V.N. The biological significance of methionine sulfoxide stereochemistry. Free. Radic. Biol. Med. 2011, 50, 221–227. [Google Scholar] [CrossRef] [PubMed] [Green Version]
- Lee, B.C.; Dikiy, A.; Kim, H.-Y.; Gladyshev, V.N. Functions and evolution of selenoprotein methionine sulfoxide reductases. Biochim. et Biophys. Acta (BBA)-Gen. Subj. 2009, 1790, 1471–1477. [Google Scholar] [CrossRef] [PubMed] [Green Version]
- Colovic, M.; Vasic, V.M.; Djuric, D.M.; Krstić, D. Sulphur-containing Amino Acids: Protective role against free radicals and heavy metals. Curr. Med. Chem. 2018, 25, 324–335. [Google Scholar] [CrossRef] [PubMed]
- Martinov, M.; Vitvitsky, V.; Banerjee, R.; Ataullakhanov, F. The logic of the hepatic methionine metabolic cycle. Biochim. Biophys. Acta Proteins Proteom. 2010, 1804, 89–96. [Google Scholar] [CrossRef] [Green Version]
- McBean, G.J. The transsulfuration pathway: A source of cysteine for glutathione in astrocytes. Amino Acids 2011, 42, 199–205. [Google Scholar] [CrossRef] [Green Version]
- Kantorow, M.; Lee, W.; Chauss, D. Focus on molecules: Methionine sulfoxide reductase A. Exp. Eye Res. 2010, 100, 110–111. [Google Scholar] [CrossRef] [Green Version]
- Wang, Z.; Liang, M.; Li, H.; Cai, L.; He, H.; Wu, Q.; Yang, L. l -Methionine activates Nrf2-ARE pathway to induce endogenous antioxidant activity for depressing ROS-derived oxidative stress in growing rats. J. Sci. Food Agric. 2019, 99, 4849–4862. [Google Scholar] [CrossRef] [PubMed]
- Métayer, S.; Seiliez, I.; Collin, A.; Duchêne, S.; Mercier, Y.; Geraert, P.-A.; Tesseraud, S. Mechanisms through which sulfur amino acids control protein metabolism and oxidative status. J. Nutr. Biochem. 2008, 19, 207–215. [Google Scholar] [CrossRef] [PubMed]
- Dos Santos, S.L.; Petropoulos, I.; Friguet, B. The oxidized protein repair enzymes methionine sulfoxide reductases and their roles in protecting against oxidative stress, in ageing and in regulating protein function. Antioxidants 2018, 7, 191. [Google Scholar] [CrossRef]
- Chondrogianni, N.; Petropoulos, I.; Grimm, S.; Georgila, K.; Catalgol, B.; Friguet, B.; Grune, T.; Gonos, E.S. Protein damage, repair and proteolysis. Mol. Asp. Med. 2014, 35, 1–71. [Google Scholar] [CrossRef]
- Oien, D.B.; Moskovitz, J. Genetic regulation of longevity and age-associated diseases through the methionine sulfoxide reductase system. Biochim. Biophys. Acta Mol. Basis Dis. 2019, 1865, 1756–1762. [Google Scholar] [CrossRef]
- Yang, L.; Li, X.; Jiang, A.; Li, X.; Chang, W.; Chen, J.; Ye, F. Metformin alleviates lead-induced mitochondrial fragmentation via AMPK/Nrf2 activation in SH-SY5Y cells. Redox Biol. 2020, 36, 101626. [Google Scholar] [CrossRef] [PubMed]


Publisher’s Note: MDPI stays neutral with regard to jurisdictional claims in published maps and institutional affiliations. |
© 2021 by the authors. Licensee MDPI, Basel, Switzerland. This article is an open access article distributed under the terms and conditions of the Creative Commons Attribution (CC BY) license (https://creativecommons.org/licenses/by/4.0/).
Share and Cite
Catanesi, M.; Brandolini, L.; d’Angelo, M.; Benedetti, E.; Tupone, M.G.; Alfonsetti, M.; Cabri, E.; Iaconis, D.; Fratelli, M.; Cimini, A.; et al. L-Methionine Protects against Oxidative Stress and Mitochondrial Dysfunction in an In Vitro Model of Parkinson’s Disease. Antioxidants 2021, 10, 1467. https://0-doi-org.brum.beds.ac.uk/10.3390/antiox10091467
Catanesi M, Brandolini L, d’Angelo M, Benedetti E, Tupone MG, Alfonsetti M, Cabri E, Iaconis D, Fratelli M, Cimini A, et al. L-Methionine Protects against Oxidative Stress and Mitochondrial Dysfunction in an In Vitro Model of Parkinson’s Disease. Antioxidants. 2021; 10(9):1467. https://0-doi-org.brum.beds.ac.uk/10.3390/antiox10091467
Chicago/Turabian StyleCatanesi, Mariano, Laura Brandolini, Michele d’Angelo, Elisabetta Benedetti, Maria Grazia Tupone, Margherita Alfonsetti, Enrico Cabri, Daniela Iaconis, Maddalena Fratelli, Annamaria Cimini, and et al. 2021. "L-Methionine Protects against Oxidative Stress and Mitochondrial Dysfunction in an In Vitro Model of Parkinson’s Disease" Antioxidants 10, no. 9: 1467. https://0-doi-org.brum.beds.ac.uk/10.3390/antiox10091467