
Pharmacokinetics and Pharmacodynamics of Key Components of a Standardized Centella asiatica Product in Cognitively Impaired Older Adults: A Phase 1, Double-Blind, Randomized Clinical Trial

 , ,
, ,  , , and
Abstract
:1. Introduction
2. Materials and Methods
2.1. Chemicals
2.2. Centella Asiatica Water Extract Product (CAP)
2.3. Ethical Statement and Informed Consent
2.4. Eligibility Criteria for Participants
2.5. Study Sample Size
2.6. Study Design and Sample Collection
2.7. Safety Assessments
2.8. Sample Preparation and Pharmacokinetic Analysis
2.9. Sample Preparation and NRF2 Gene Expression Analysis
2.10. Data Analysis
3. Results
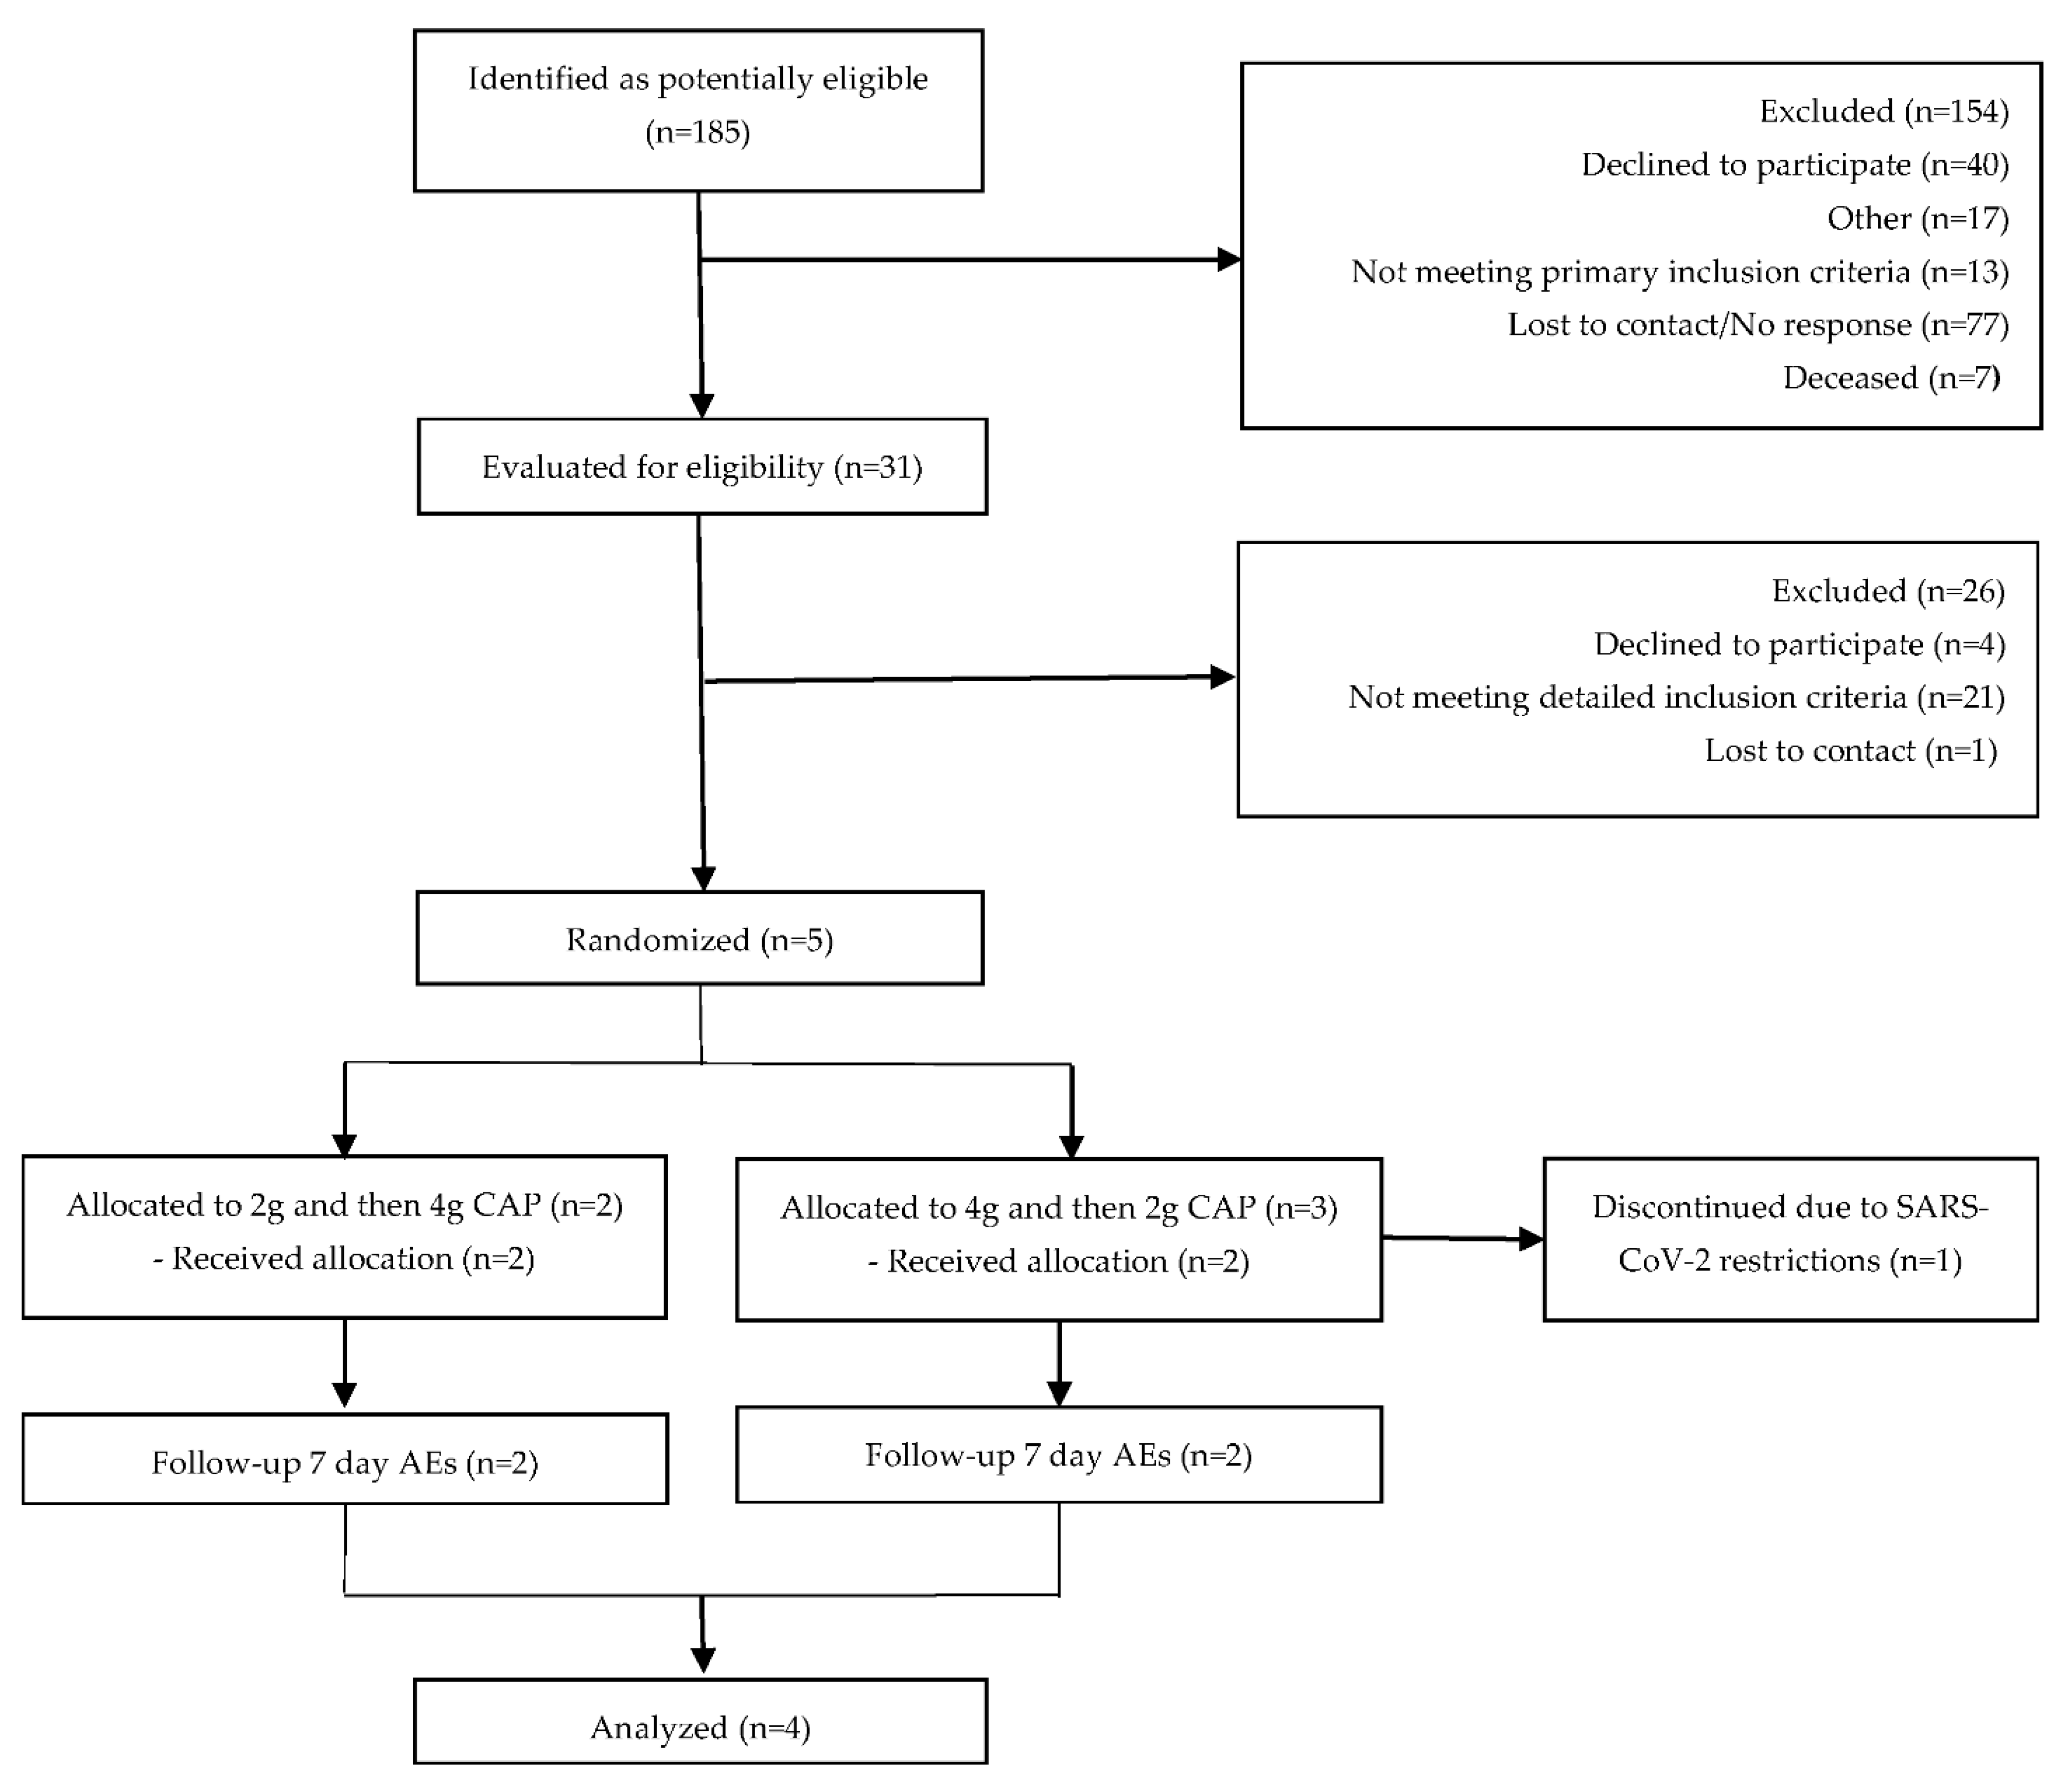
3.1. Participant Baseline Clinical Characteristics
3.2. Pharmacokinetics
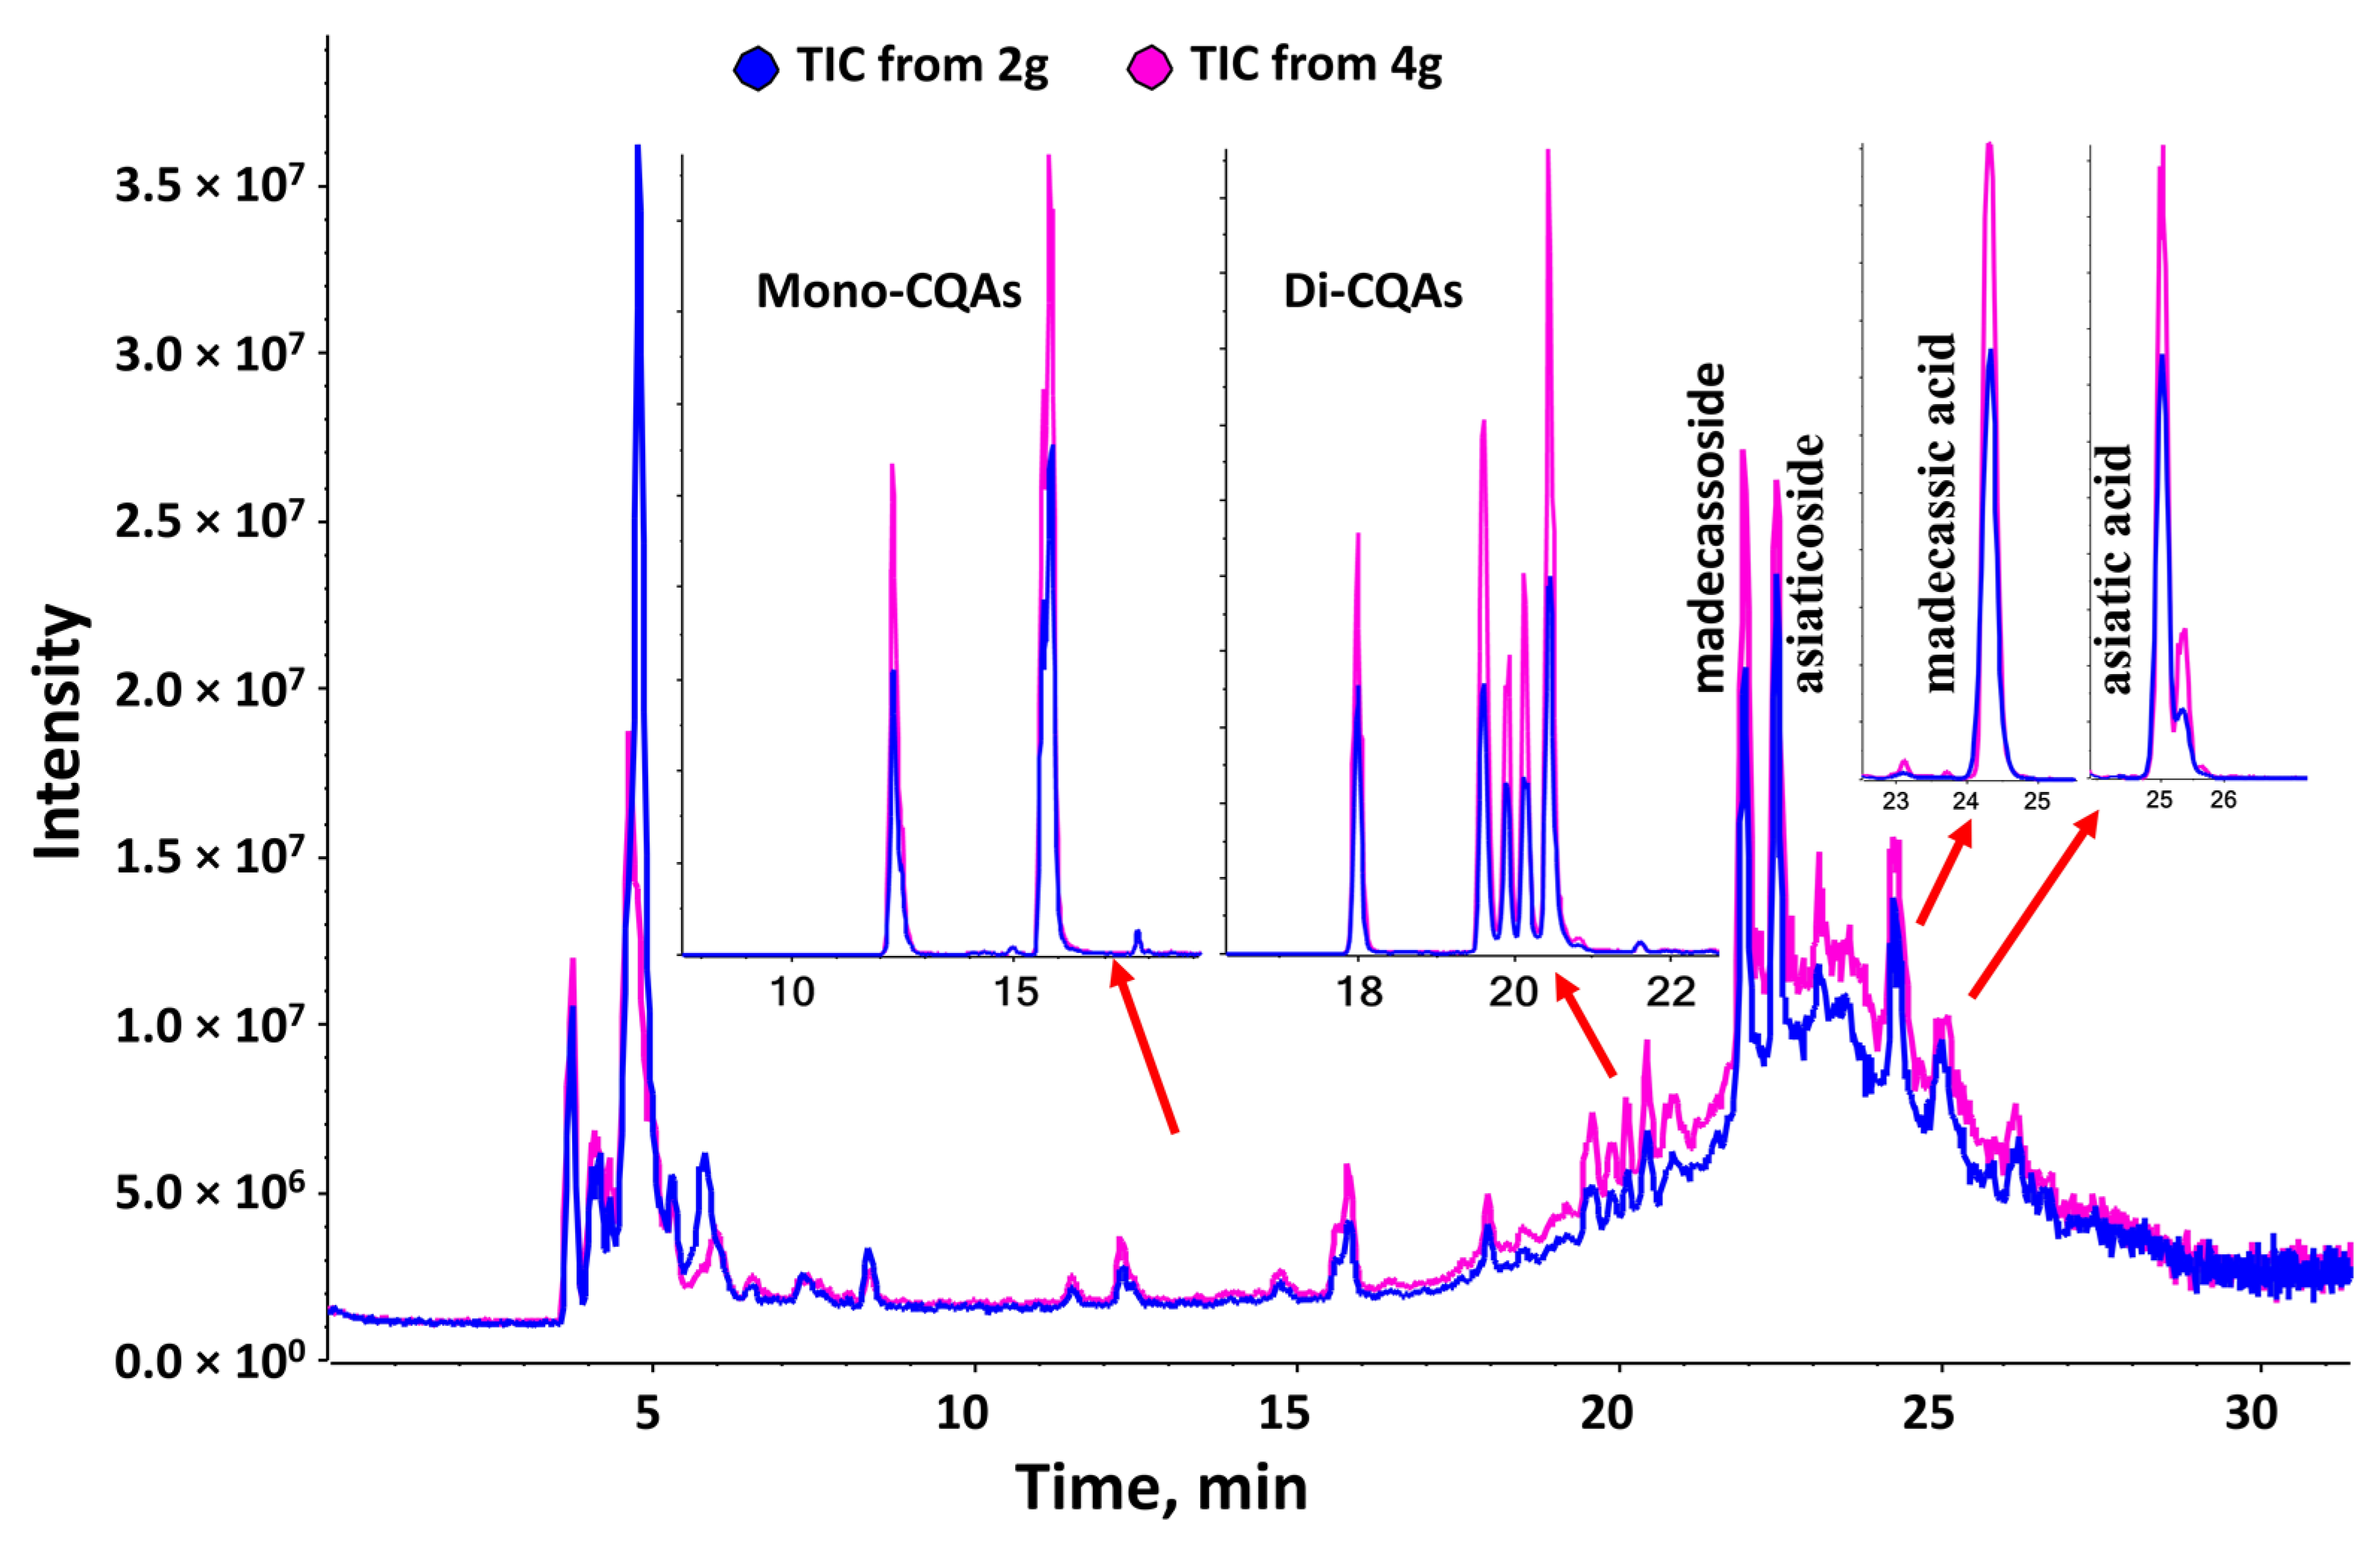
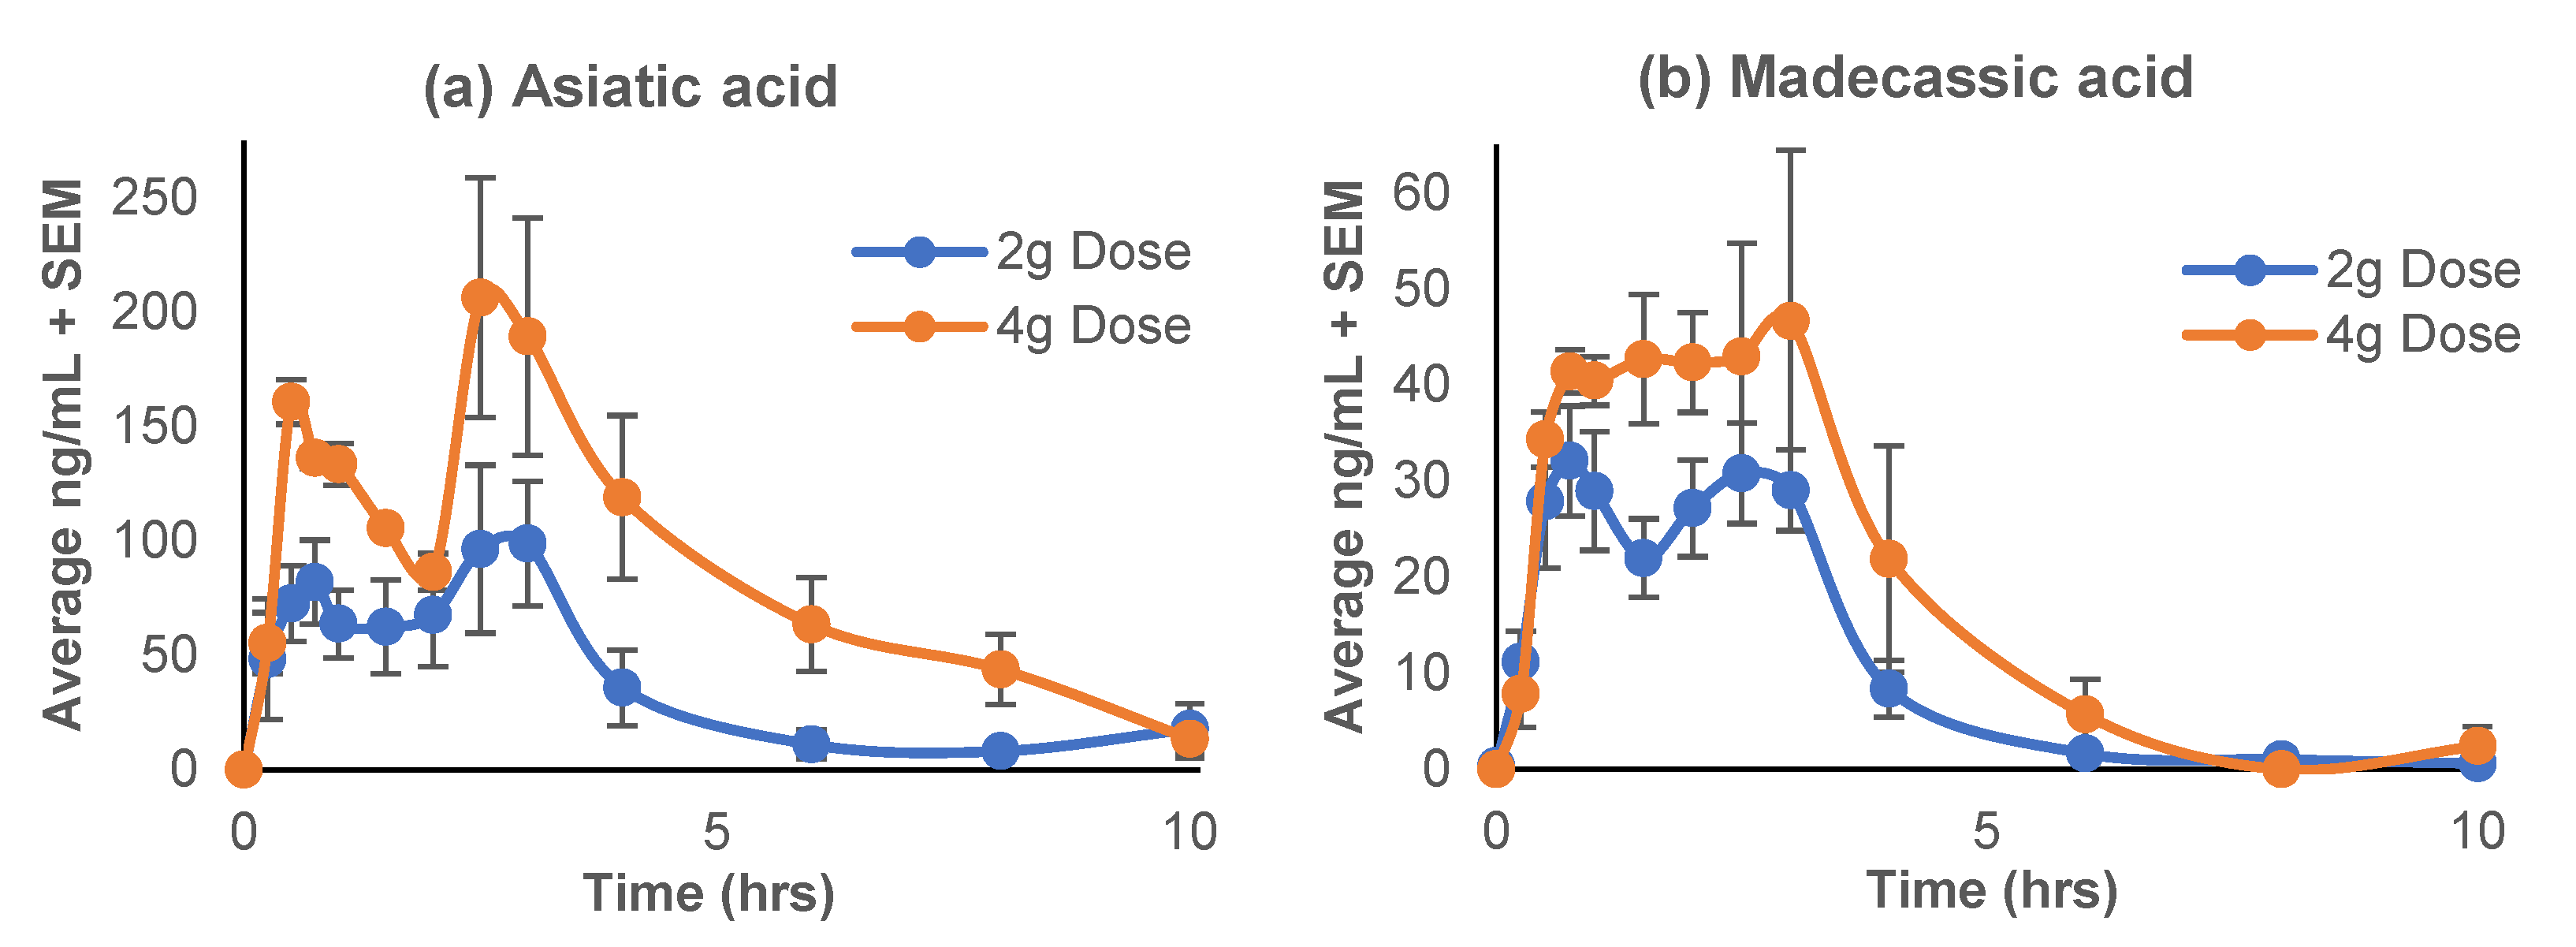
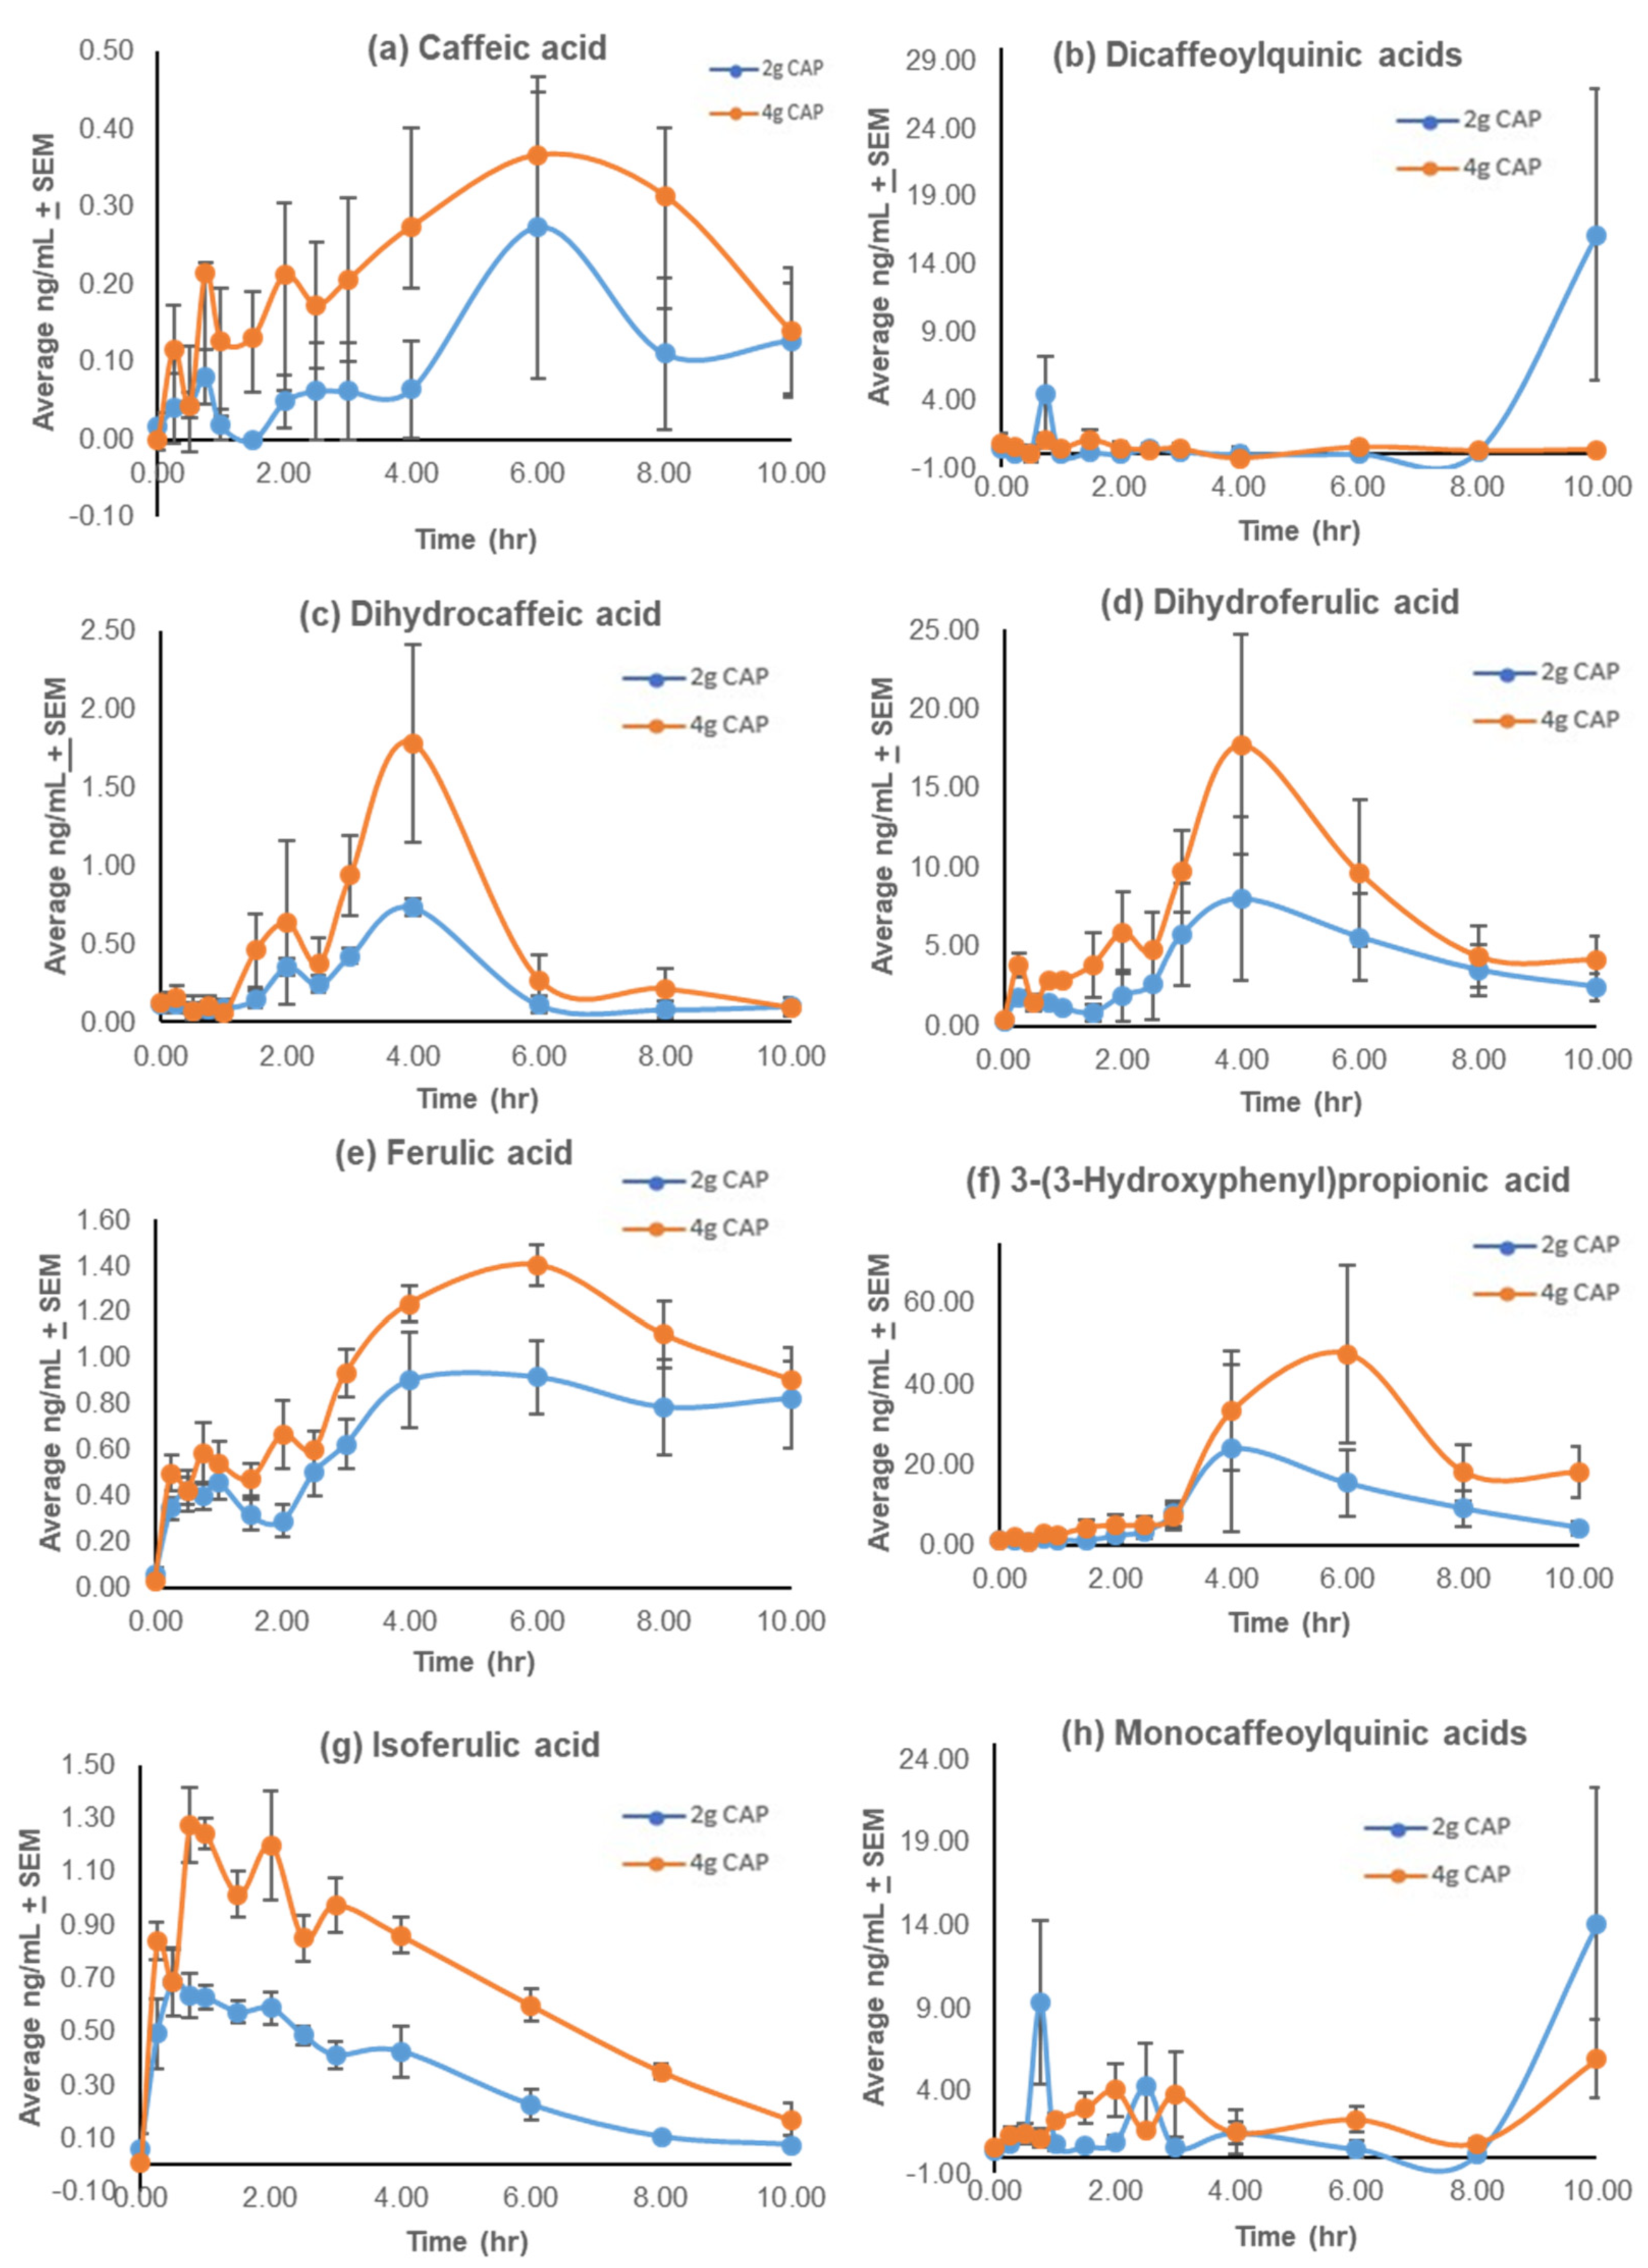
3.2.1. Pharmacokinetic Profiles
3.2.2. Success of the Low Phytochemical Diet
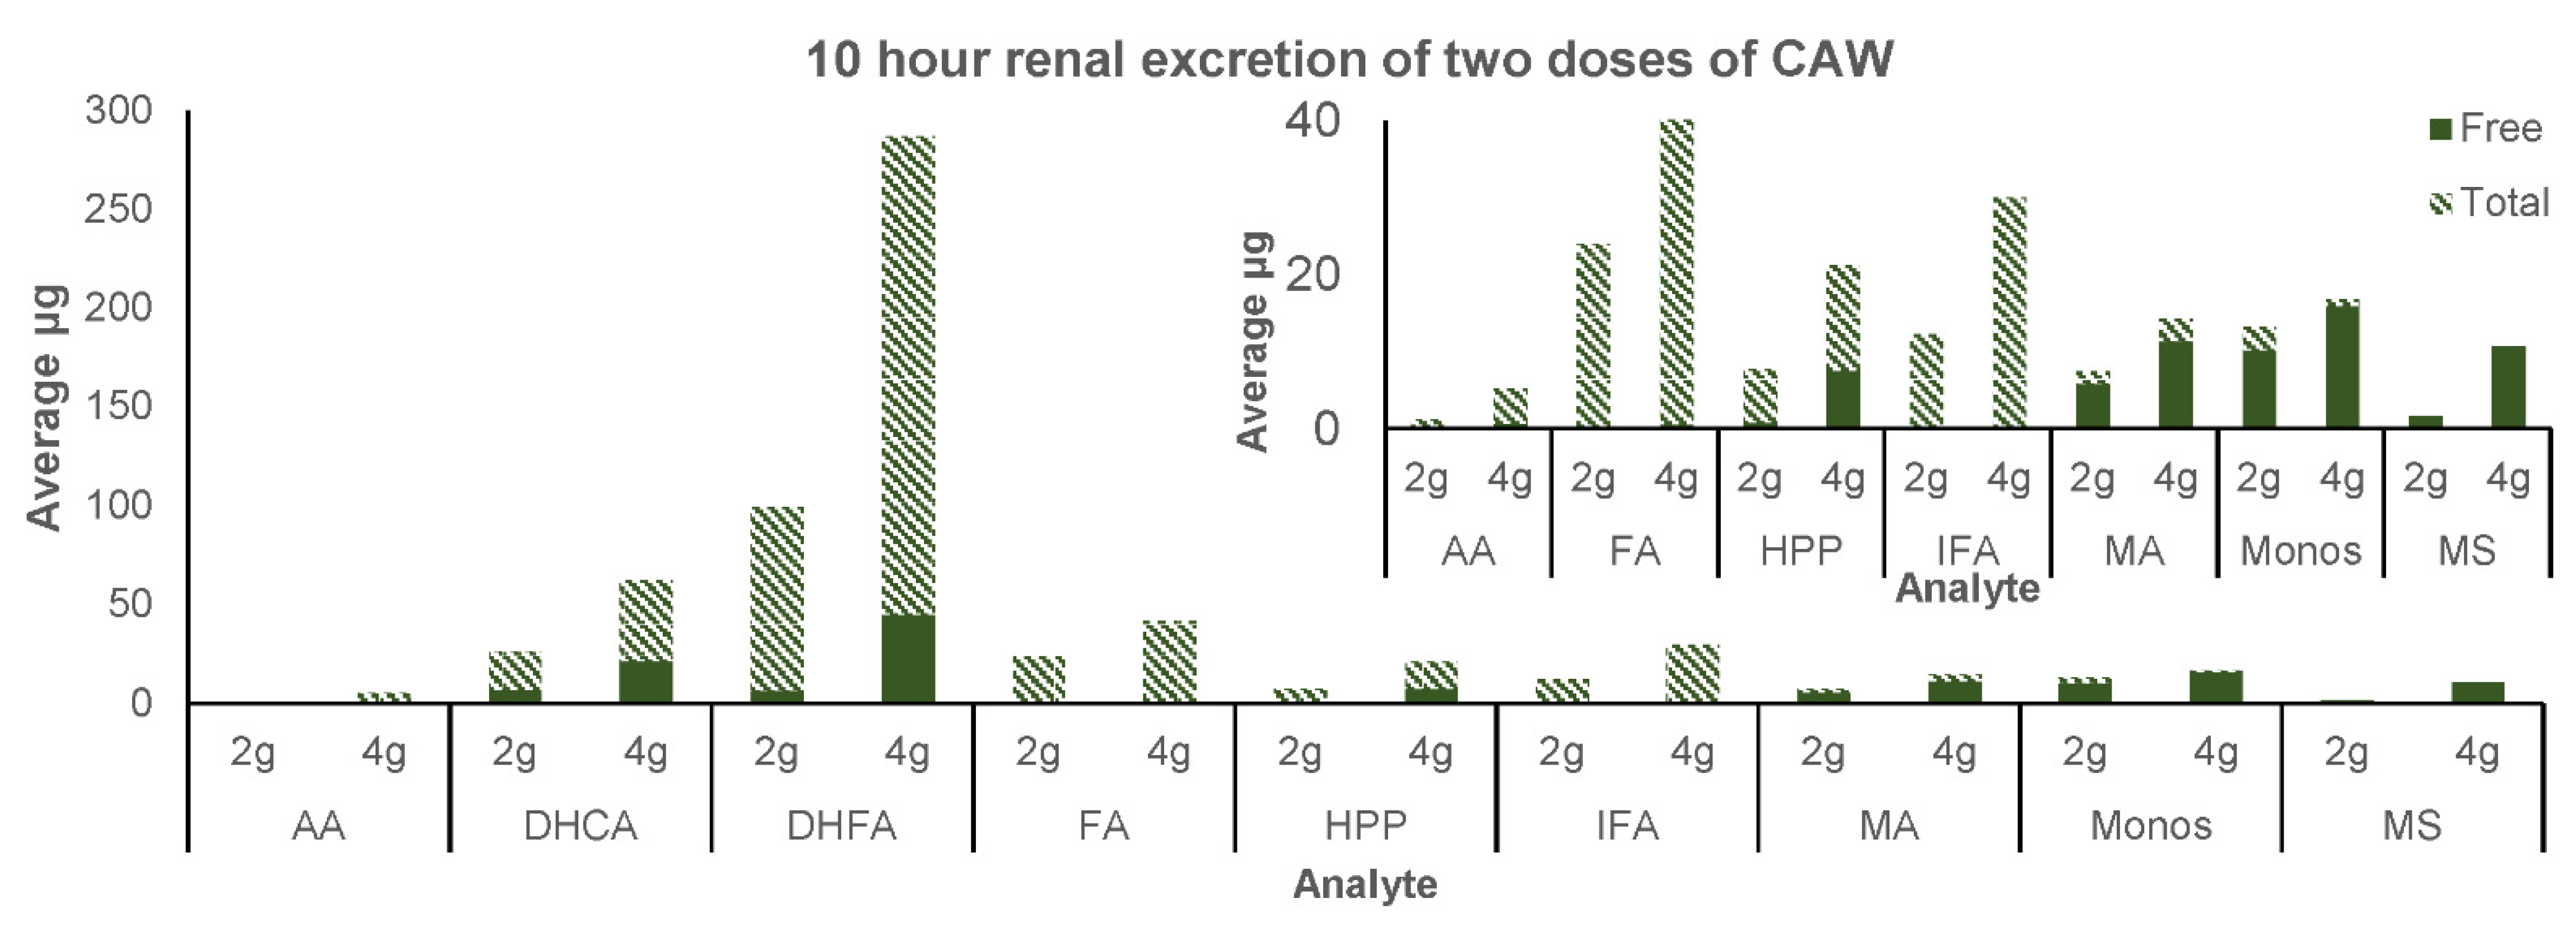
3.2.3. Renal Excretion
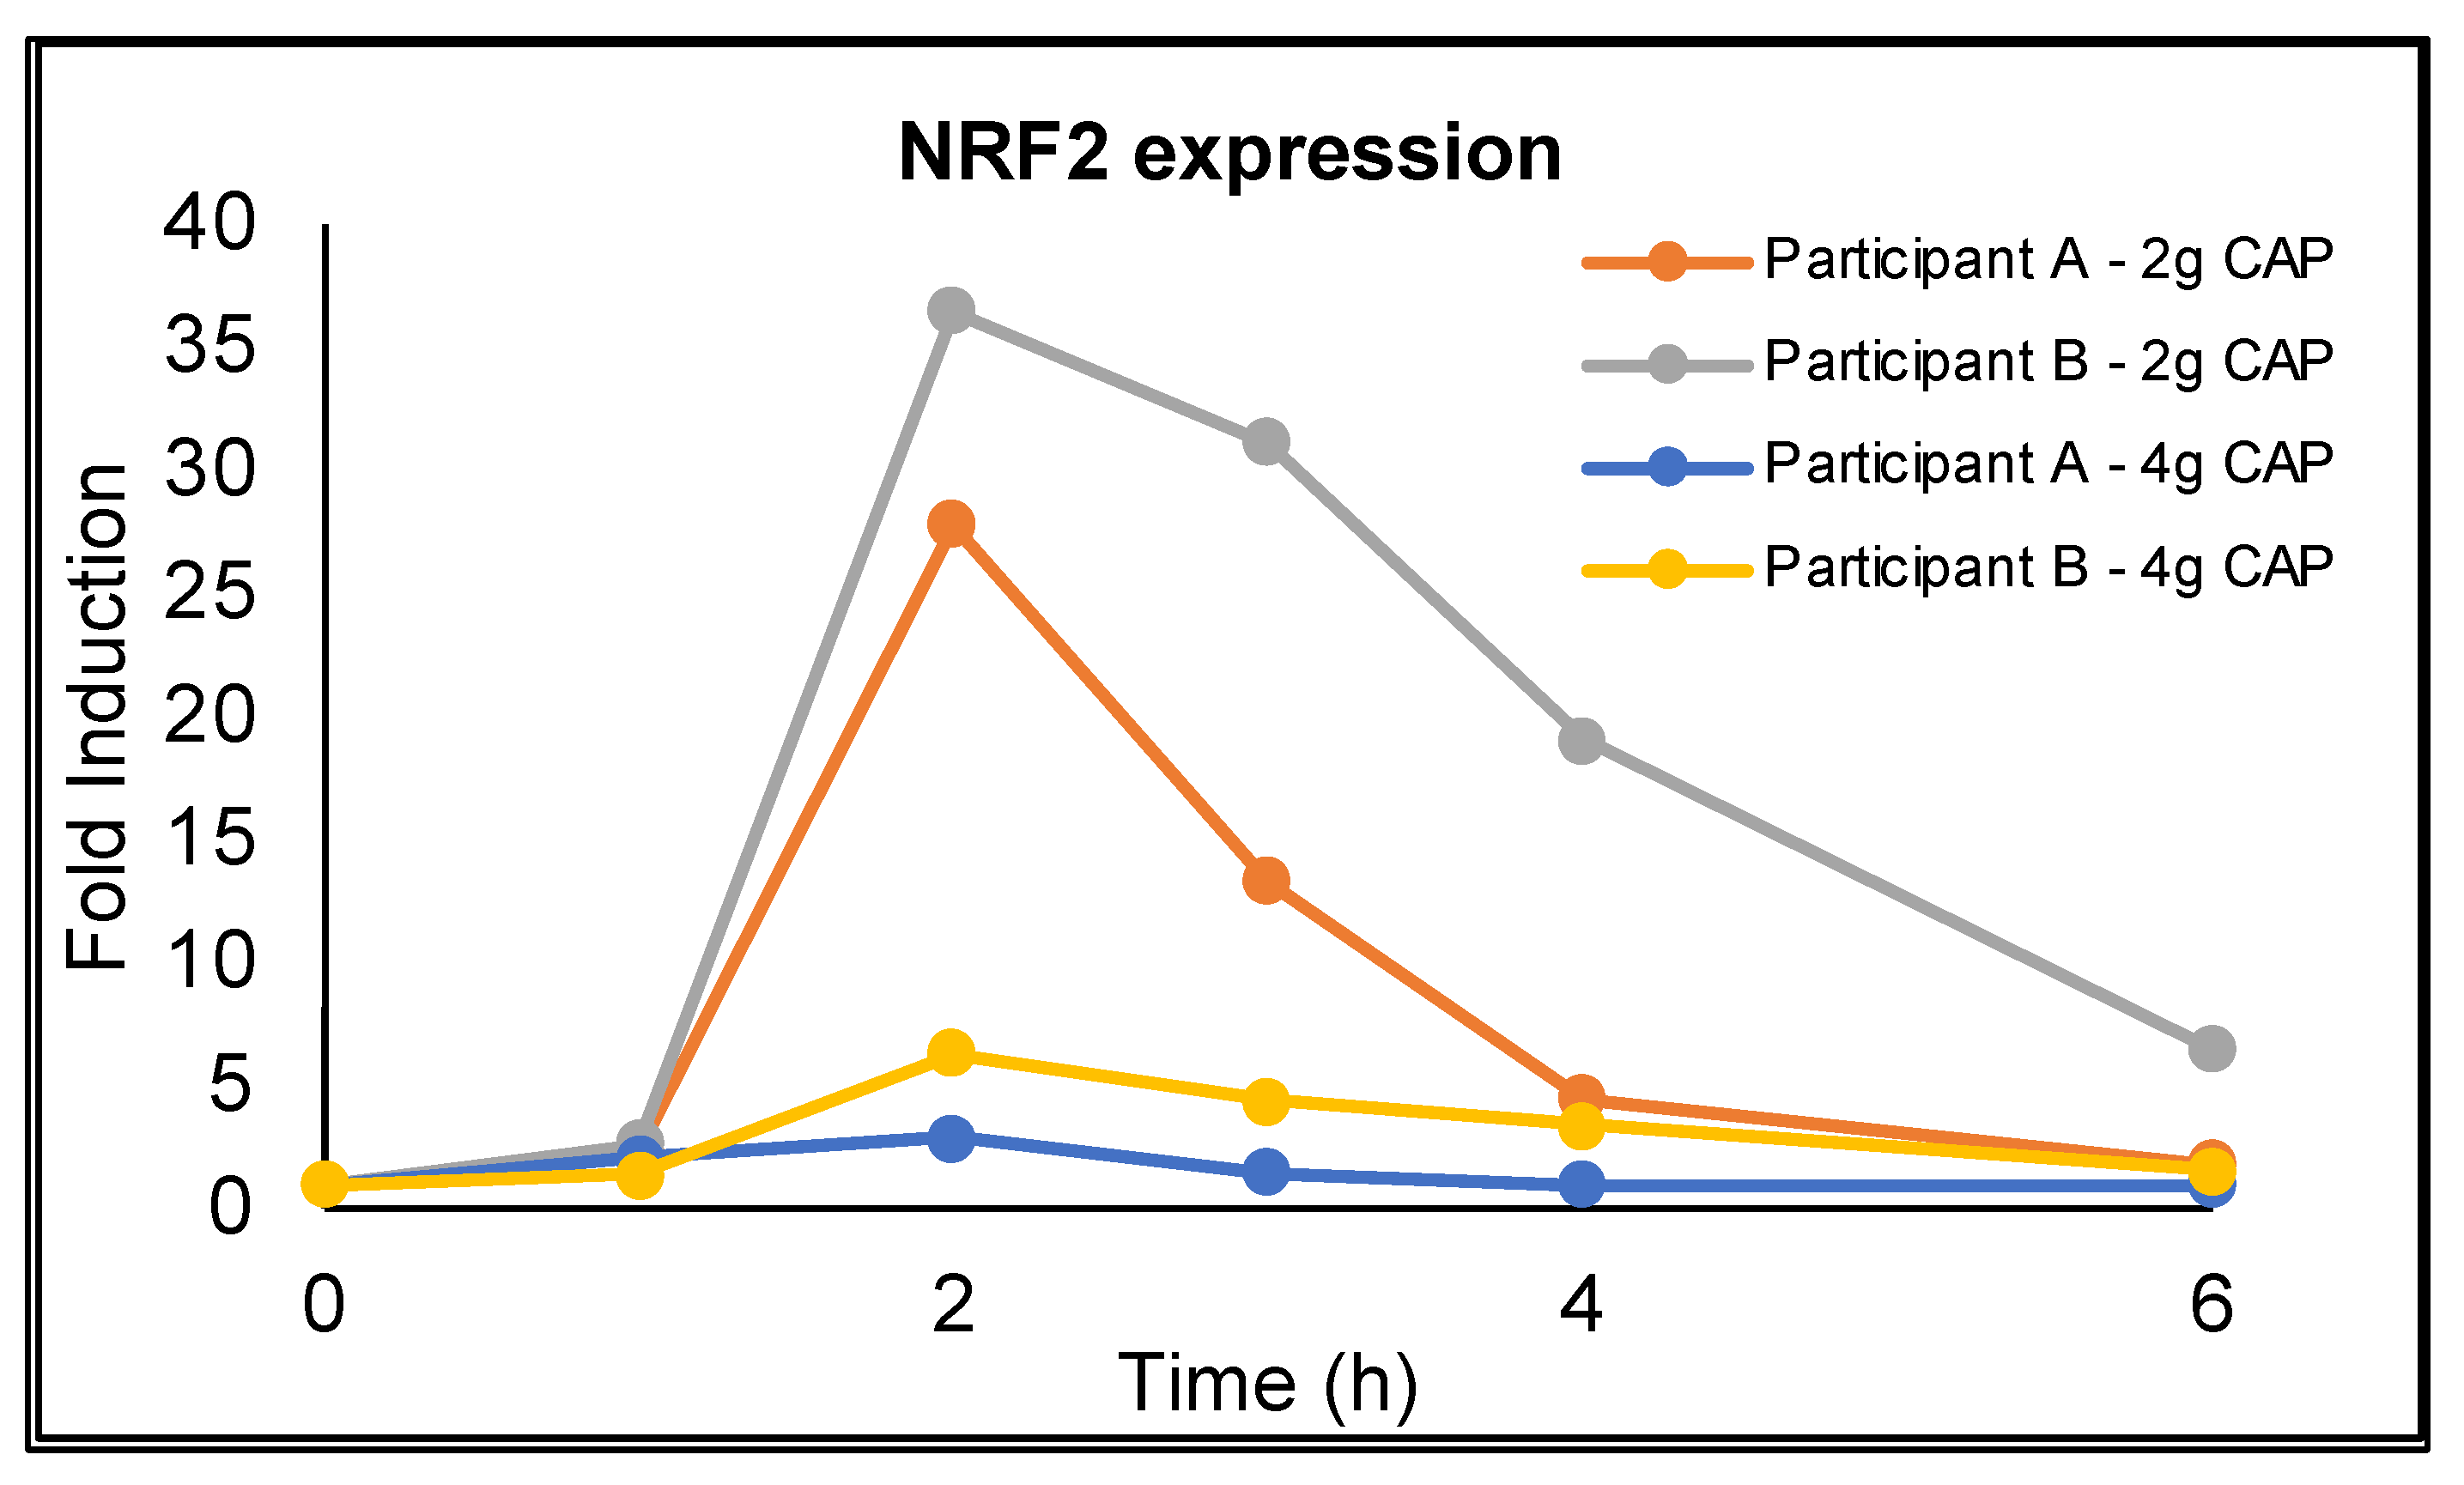
3.3. NRF2 Activation
3.4. Safety and Tolerability
4. Discussion
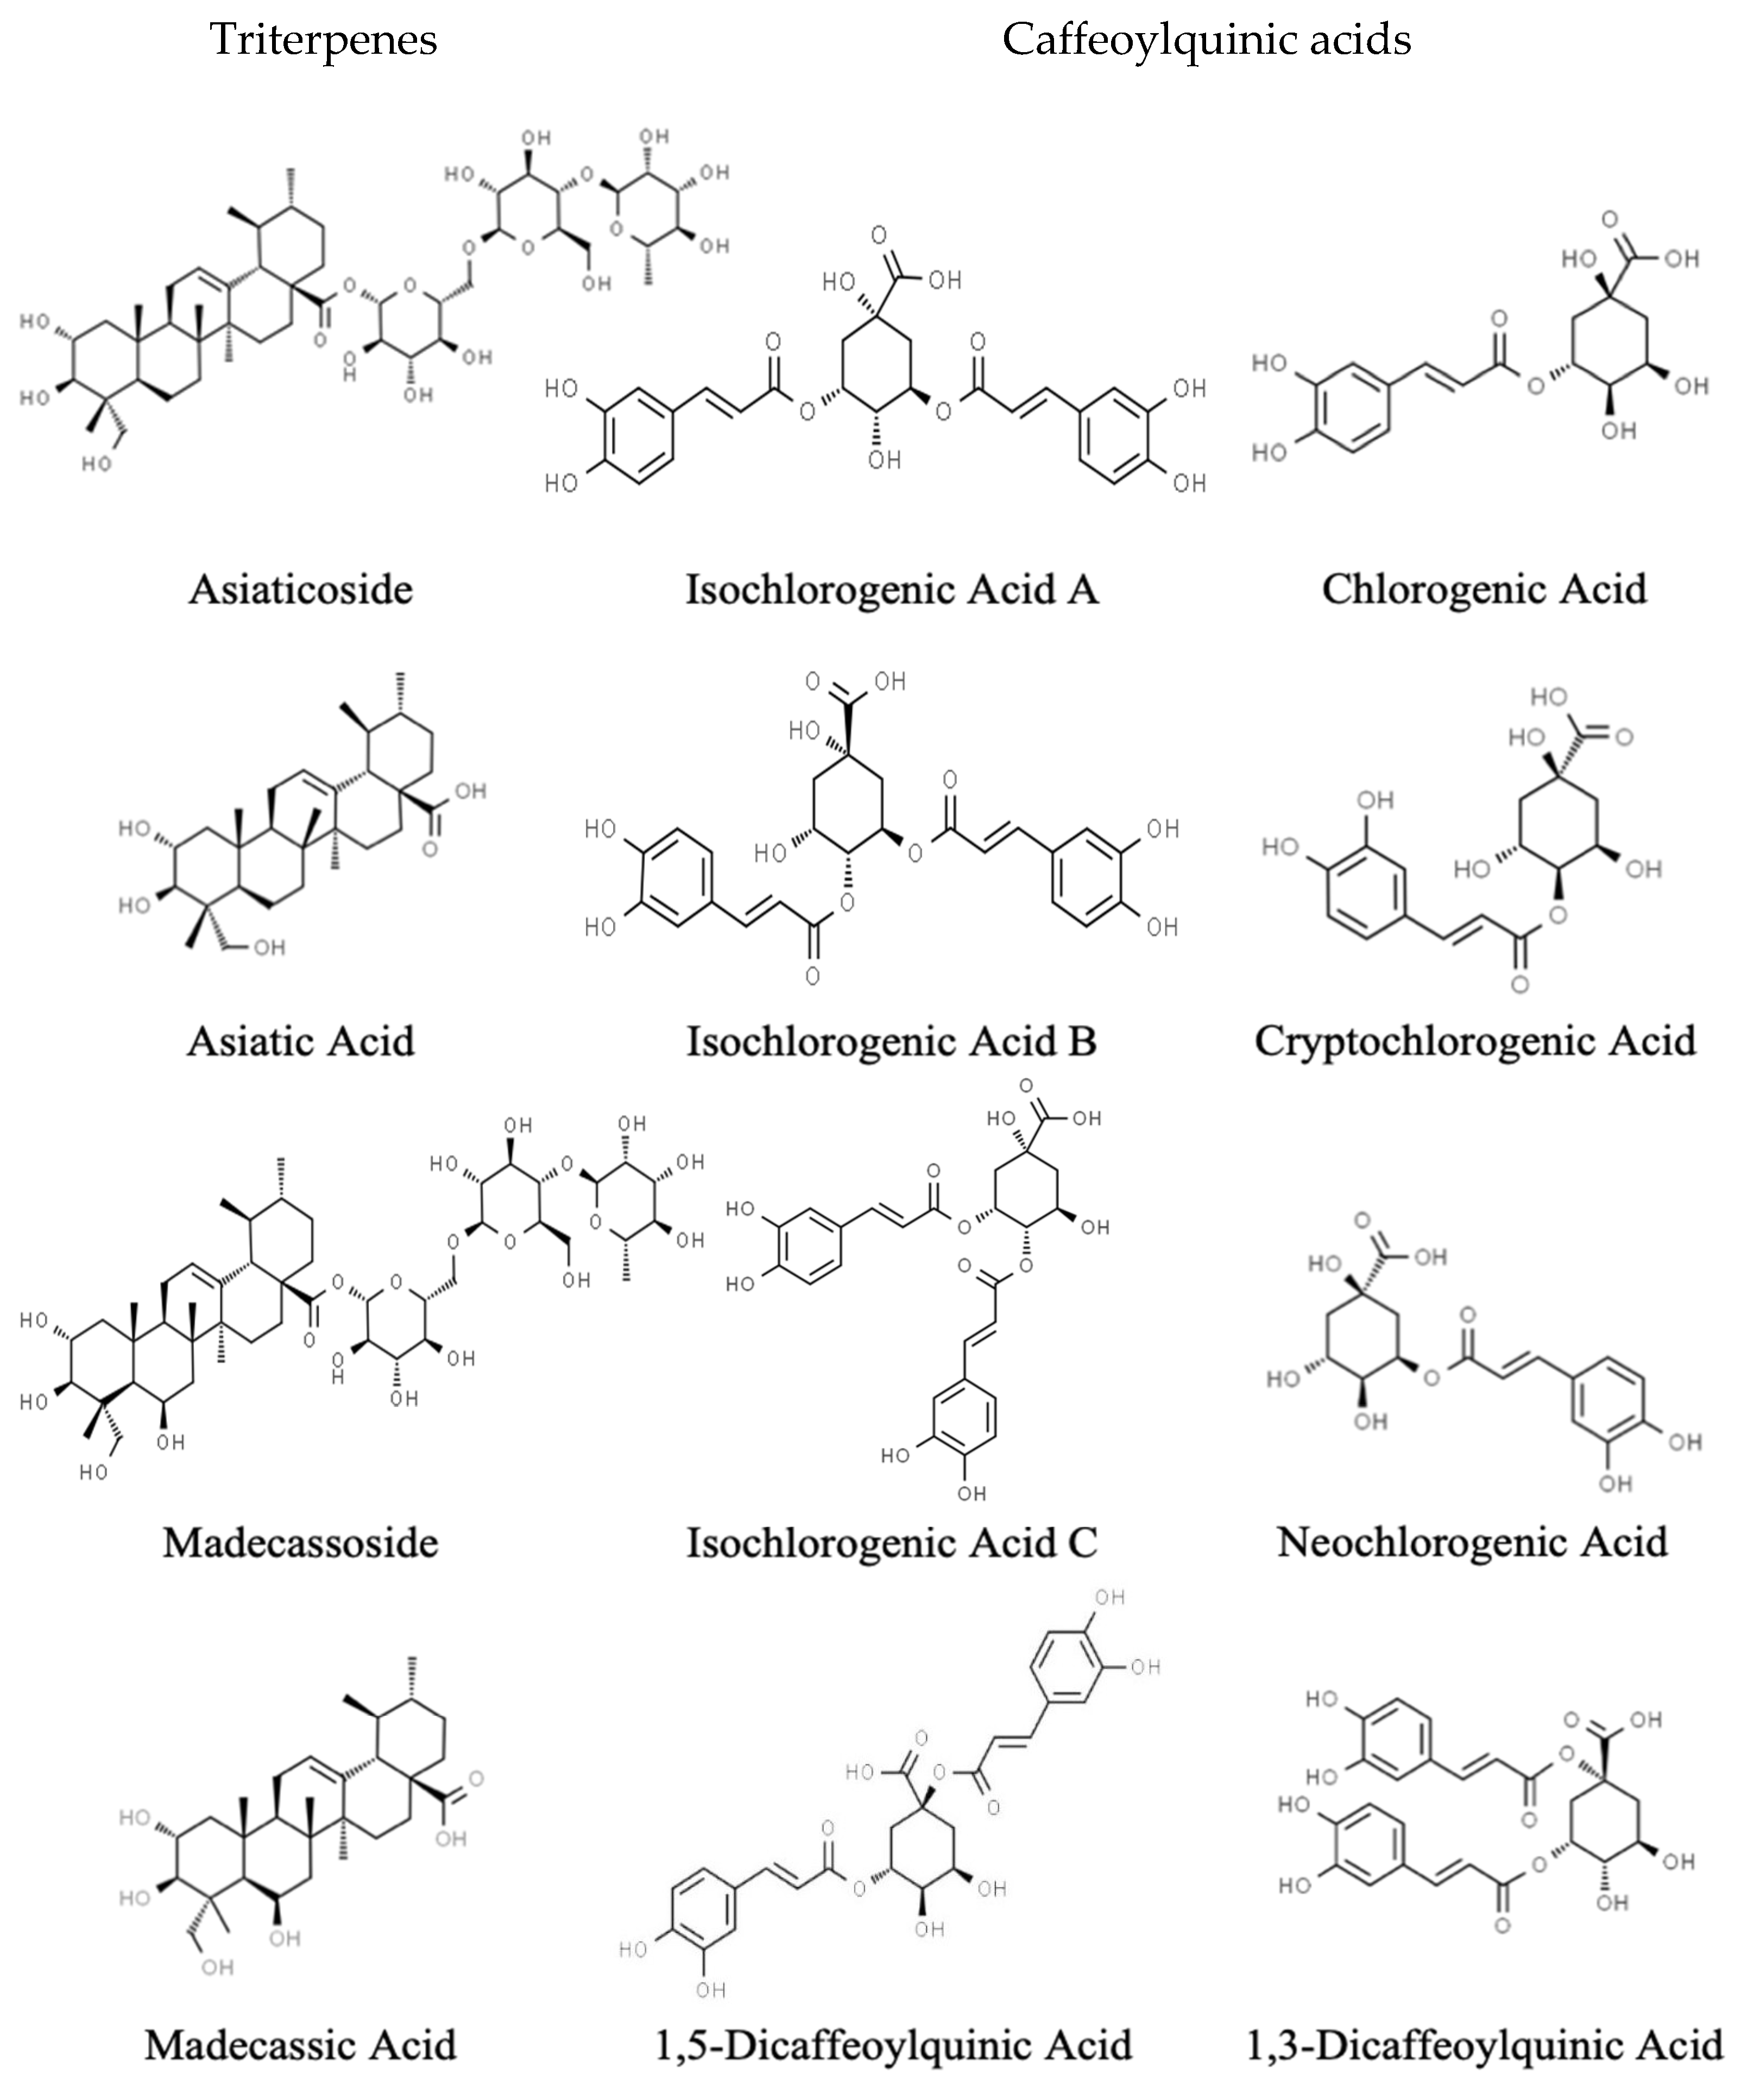
4.1. Triterpenes
4.2. Caffeoylquinic Acids
4.3. Renal Excretion
4.4. NRF2 Expression
4.5. Success of the Low Phytochemical Diet
4.6. Safety
5. Limitations
6. Conclusions
Supplementary Materials
Author Contributions
Funding
Institutional Review Board Statement
Informed Consent Statement
Data Availability Statement
Acknowledgments
Conflicts of Interest
References
- National Institutes of Health, National Institute on Aging. The Alzheimer’s Disease Education and Referral Center Alzheimer’s Disease Fact Sheet. 18 August 2016. Available online: https://www.nia.nih.gov/alzheimers/publication/alzheimers-disease-fact-sheet (accessed on 1 November 2016).
- Alzheimer’s Association. 2021 Alzheimer’s Disease Facts and Figures; Special Report Race, Ethnicity and Alzheimer’s in America. 2021. Available online: https://www.alz.org/media/documents/alzheimers-facts-and-figures.pdf (accessed on 1 November 2021).
- World Health Organization. Dementia. 2 September 2021. Available online: https://www.who.int/news-room/fact-sheets/detail/dementia (accessed on 13 December 2021).
- Jack, C.R.; Knopman, D.S.; Jagust, W.J.; Petersen, R.C.; Weiner, M.W.; Aisen, P.S.; Shaw, L.M.; Vemuri, P.; Wiste, H.J.; Weigand, S.D.; et al. Tracking pathophysiological processes in Alzheimer’s disease: An updated hypothetical model of dynamic biomarkers. Lancet Neurol. 2013, 12, 207–216. [Google Scholar] [CrossRef] [Green Version]
- National Institute on Aging. What Happens to the Brain in Alzheimer’s Disease? 16 May 2017. Available online: http://www.nia.nih.gov/health/what-happens-brain-alzheimers-disease (accessed on 3 November 2020).
- Yao, J.; Irwin, R.W.; Zhao, L.; Nilsen, J.; Hamilton, R.T.; Brinton, R.D. Mitochondrial bioenergetic deficit precedes Alzheimer’s pathology in female mouse model of Alzheimer’s disease. Proc. Natl. Acad. Sci. USA 2009, 106, 14670–14675. [Google Scholar] [CrossRef] [PubMed] [Green Version]
- Manczak, M.; Park, B.S.; Jung, Y.; Reddy, P.H. Differential expression of oxidative phosphorylation genes in patients with Alzheimer’s disease: Implications for early mitochondrial dysfunction and oxidative damage. Neuromol. Med. 2004, 5, 147–162. [Google Scholar] [CrossRef]
- Baloyannis, S.J. Mitochondria are related to synaptic pathology in Alzheimer’s disease. Int. J. Alzheimers Dis. 2011, 2011, 305395. [Google Scholar] [CrossRef] [Green Version]
- Baloyannis, S.J. Mitochondrial alterations in Alzheimer’s disease. J. Alzheimers Dis. 2006, 9, 119–126. [Google Scholar] [CrossRef]
- Gray, N.E.; Zweig, J.A.; Matthews, D.G.; Caruso, M.; Quinn, J.F.; Soumyanath, A. Centella asiatica Attenuates Mitochondrial Dysfunction and Oxidative Stress in Aβ-Exposed Hippocampal Neurons. Oxidative Med. Cell. Longev. 2017, 2017, 7023091. [Google Scholar] [CrossRef] [Green Version]
- Tariot, P.N.; Federoff, H.J. Current treatment for Alzheimer disease and future prospects. Alzheimer Dis. Assoc. Disord. 2003, 17 (Suppl. 4), S105–S113. [Google Scholar] [CrossRef]
- Tariot, P.N.; Farlow, M.R.; Grossberg, G.T.; Graham, S.M.; McDonald, S.; Gergel, I.; Group, M.S. Memantine treatment in patients with moderate to severe Alzheimer disease already receiving donepezil: A randomized controlled trial. JAMA 2004, 291, 317–324. [Google Scholar] [CrossRef]
- Reisberg, B.; Doody, R.; Stöffler, A.; Schmitt, F.; Ferris, S.; Möbius, H.J.; Group, M.S. Memantine in moderate-to-severe Alzheimer’s disease. N. Engl. J. Med. 2003, 348, 1333–1341. [Google Scholar] [CrossRef]
- Walsh, S.; Merrick, R.; Milne, R.; Brayne, C. Aducanumab for Alzheimer’s disease? BMJ 2021, 374, n1682. [Google Scholar] [CrossRef]
- Eli Lilly Company. A Study of Semagacestat for Alzheimer’s Patients (Identity XT). 22 September 2014. Available online: http://clinicaltrials.gov/ct2/show/NCT01035138 (accessed on 15 November 2016).
- Panza, F.; Frisardi, V.; Imbimbo, B.P.; D’Onofrio, G.; Pietrarossa, G.; Seripa, D.; Pilotto, A.; Solfrizzi, V. Bapineuzumab: Anti-β-amyloid monoclonal antibodies for the treatment of Alzheimer’s disease. Immunotherapy 2010, 2, 767–782. [Google Scholar] [CrossRef] [PubMed]
- Wasilewski, A. Johnson & Johnson Announces Discontinuation of Phase 3 Development of Bapineuzumab Intravenous (IV) in Mild to Moderate Alzheimer’s Disease. Available online: http://www.jnj.com/connect/news/all/johnsonandjohnsonannouncesdiscontinuationofphase3developmentofbapineuzumabintravenousivinmildtomoderatealzheimersdisease%3E (accessed on 22 October 2012).
- Eli Lilly Announcement. Eli Lilly and Company Announces TopLine Results on Solanezumab Phase 3 Clinical Trials in Patients with Alzheimer’s Disease. Available online: http://newsroom.lilly.com/releasedetail.cfm?releaseid=702211%3E (accessed on 22 October 2012).
- Migliorelli, R.; Tesón, A.; Sabe, L.; Petracchi, M.; Leiguarda, R.; Starkstein, S.E. Prevalence and correlates of dysthymia and major depression among patients with Alzheimer’s disease. Am. J. Psychiatry 1995, 152, 37–44. [Google Scholar] [CrossRef] [PubMed]
- Ferretti, L.; McCurry, S.M.; Logsdon, R.; Gibbons, L.; Teri, L. Anxiety and Alzheimer’s disease. J. Geriatr. Psychiatry Neurol. 2001, 14, 52–58. [Google Scholar] [CrossRef] [PubMed]
- Cummings, J.; Aisen, P.S.; DuBois, B.; Frölich, L.; Jack, C.R.; Jones, R.W.; Morris, J.C.; Raskin, J.; Dowsett, S.A.; Scheltens, P. Drug development in Alzheimer’s disease: The path to 2025. Alzheimers Res. Ther. 2016, 8, 39. [Google Scholar] [CrossRef] [Green Version]
- Newall, C.; Anderson, L.; Phillipson, J. Herbal Medicines: A Guide for Healthcare Professionals; Pharmaceutical Press: London, UK, 1996. [Google Scholar]
- Gray, N.E.; Magana, A.A.; Lak, P.; Wright, K.M.; Quinn, J.; Stevens, J.F.; Maier, C.S.; Soumyanath, A. Centella asiatica: Phytochemistry and mechanisms of neuroprotection and cognitive enhancement. Phytochem. Rev. 2018, 17, 161–194. [Google Scholar] [CrossRef] [PubMed]
- Puttarak, P.; Dilokthornsakul, P.; Saokaew, S.; Dhippayom, T.; Kongkaew, C.; Sruamsiri, R.; Chuthaputti, A.; Chaiyakunapruk, N. Effects of Centella asiatica (L.) Urb. on cognitive function and mood related outcomes: A Systematic Review and Meta-analysis. Sci. Rep. 2017, 7, 10646. [Google Scholar] [CrossRef]
- Rao, S.B.; Chetana, M.; Uma Devi, P. Centella asiatica treatment during postnatal period enhances learning and memory in mice. Physiol. Behav. 2005, 86, 449–457. [Google Scholar] [CrossRef]
- Gupta, Y.K.; Veerendra Kumar, M.H.; Srivastava, A.K. Effect of Centella asiatica on pentylenetetrazole-induced kindling, cognition and oxidative stress in rats. Pharmacol. Biochem. Behav. 2003, 74, 579–585. [Google Scholar] [CrossRef]
- Matthews, D.G.; Caruso, M.; Murchison, C.F.; Zhu, J.Y.; Wright, K.M.; Harris, C.J.; Gray, N.E.; Quinn, J.F.; Soumyanath, A. Centella asiatica Improves Memory and Promotes Antioxidative Signaling in 5XFAD Mice. Antioxidants 2019, 8, 630. [Google Scholar] [CrossRef] [Green Version]
- Gadahad, M.R.; Rao, M.; Rao, G. Enhancement of hippocampal CA3 neuronal dendritic arborization by Centella asiatica (Linn) fresh leaf extract treatment in adult rats. J. Chin. Med. Assoc. 2008, 71, 6–13. [Google Scholar] [CrossRef] [Green Version]
- Gray, N.E.; Harris, C.J.; Quinn, J.F.; Soumyanath, A. Centella asiatica modulates antioxidant and mitochondrial pathways and improves cognitive function in mice. J. Ethnopharmacol. 2016, 180, 78–86. [Google Scholar] [CrossRef] [PubMed] [Green Version]
- Zweig, J.A.; Brandes, M.S.; Brumbach, B.H.; Caruso, M.; Wright, K.M.; Quinn, J.F.; Soumyanath, A.; Gray, N.E. Prolonged Treatment with Centella asiatica Improves Memory, Reduces Amyloid-β Pathology, and Activates NRF2-Regulated Antioxidant Response Pathway in 5xFAD Mice. J. Alzheimers Dis. 2021, 81, 1453–1468. [Google Scholar] [CrossRef] [PubMed]
- Zweig, J.A.; Brandes, M.S.; Brumbach, B.H.; Caruso, M.; Wright, K.M.; Quinn, J.F.; Soumyanath, A.; Gray, N.E. Loss of NRF2 accelerates cognitive decline, exacerbates mitochondrial dysfunction, and is required for the cognitive enhancing effects of Centella asiatica during aging. Neurobiol. Aging 2021, 100, 48–58. [Google Scholar] [CrossRef]
- Brinkhaus, B.; Lindner, M.; Hentschel, C.; Rauwald, H.; Bilow, F.; Stockhammer, K.; Kruger, S.; Von Massow, F.; Hutarjadi, H.; Hahn, E. Centella asiatica in traditional and modern phytomedicine—A pharmacological and clinical profile—Part I.; Botany, chemistry, preparations. Perfusion 1998, 11, 466–474. [Google Scholar]
- James, J.T.; Dubery, I.A. Pentacyclic triterpenoids from the medicinal herb, Centella asiatica (L.) Urban. Molecules 2009, 14, 3922–3941. [Google Scholar] [CrossRef] [Green Version]
- Soumyanath, A.; Zhong, Y.P.; Gold, S.A.; Yu, X.; Koop, D.R.; Bourdette, D.; Gold, B.G. Centella asiatica accelerates nerve regeneration upon oral administration and contains multiple active fractions increasing neurite elongation in-vitro. J. Pharm. Pharmacol. 2005, 57, 1221–1229. [Google Scholar] [CrossRef]
- Lee, M.K.; Kim, S.R.; Sung, S.H.; Lim, D.; Kim, H.; Choi, H.; Park, H.K.; Je, S.; Ki, Y.C. Asiatic acid derivatives protect cultured cortical neurons from glutamate-induced excitotoxicity. Res. Commun. Mol. Pathol. Pharm. 2000, 108, 75–86. [Google Scholar]
- Jew, S.S.; Yoo, C.H.; Lim, D.Y.; Kim, H.; Mook-Jung, I.; Jung, M.W.; Choi, H.; Jung, Y.H.; Park, H.G. Structure-activity relationship study of asiatic acid derivatives against beta amyloid (A beta)-induced neurotoxicity. Bioorg. Med. Chem. Lett. 2000, 10, 119–121. [Google Scholar] [CrossRef]
- Mook-Jung, I.; Shin, J.E.; Yun, S.H.; Huh, K.; Koh, J.Y.; Park, H.K.; Jew, S.S.; Jung, M.W. Protective effects of asiaticoside derivatives against beta-amyloid neurotoxicity. J. Neurosci. Res. 1999, 58, 417–425. [Google Scholar] [CrossRef]
- Soumyanath, A.; Zhang, Y.; Henson, E.; Wadsworth, T.; Bishop, J.; Gold, B.; Quinn, J. Centella asiatica Extract Improves Behavioral Deficits in a Mouse Model of Alzheimer’s Disease: Investigation of a Possible Mechanism of Action. Int. J. Alzheimers Dis. 2012, 2012, 381974. [Google Scholar]
- Gray, N.E.; Morre, J.; Kelley, J.; Maier, C.S.; Stevens, J.F.; Quinn, J.F.; Soumyanath, A. Caffeoylquinic acids in Centella asiatica protect against amyloid-beta toxicity. J. Alzheimers Dis. 2014, 40, 359–373. [Google Scholar] [CrossRef] [PubMed] [Green Version]
- Mikami, Y.; Yamazawa, T. Chlorogenic acid, a polyphenol in coffee, protects neurons against glutamate neurotoxicity. Life Sci. 2015, 139, 69–74. [Google Scholar] [CrossRef] [PubMed]
- Kim, J.; Lee, H.; Hwang, B.; Kim, S.; Yoo, J.; Seong, Y. Neuroprotection of Ilex latifolia and caffeoylquinic acid derivatives against excitotoxic ad hypoxic damage of cultured rat cortical neurons. Arch. Pharm. Res. 2012, 35, 1115–1122. [Google Scholar] [CrossRef]
- Grimaldi, R.; De Ponti, F.; D’Angelo, L.; Caravaggi, M.; Guidi, G.; Lecchini, S.; Frigo, G.M.; Crema, A. Pharmacokinetics of the total triterpenic fraction of Centella asiatica after single and multiple administrations to healthy volunteers. A new assay for asiatic acid. J. Ethnopharmacol. 1990, 28, 235–241. [Google Scholar] [CrossRef]
- Thongnopnua, P. High-performance liquid chromatographic determination of asiatic acid in human plasma. Thai J. Pharm. Sci. 2008, 32, 10–16. [Google Scholar]
- Yuan, Y.; Zhang, H.; Sun, F.; Sun, S.; Zhu, Z.; Chai, Y. Biopharmaceutical and pharmacokinetic characterization of asiatic acid in Centella asiatica as determined by a sensitive and robust HPLC-MS method. J. Ethnopharmacol. 2015, 163, 31–38. [Google Scholar] [CrossRef] [PubMed]
- Zheng, X.C.; Wang, S.H. Determination of asiatic acid in beagle dog plasma after oral administration of Centella asiatica extract by precolumn derivatization RP-HPLC. J. Chromatogr. B Analyt. Technol. Biomed. Life Sci. 2009, 877, 477–481. [Google Scholar] [CrossRef] [PubMed]
- Wright, K.M.; McFerrin, J.; Alcazar Magana, A.; Roberts, J.; Caruso, M.; Kretzschmar, D.; Stevens, J.F.; Maier, C.M.; Quinn, J.F.; Soumyanath, A. Developing a rational, optimized product of Centella asiatica for examination in clinical trials: Real world challenges. Front. Nutr. Nutr. Methodol. 2021. [Google Scholar] [CrossRef]
- Nair, A.B.; Jacob, S. A simple practice guide for dose conversion between animals and human. J. Basic Clin. Pharm. 2016, 7, 27–31. [Google Scholar] [CrossRef] [Green Version]
- Gray, N.E.; Sampath, H.; Zweig, J.A.; Quinn, J.F.; Soumyanath, A. Centella asiatica Attenuates Amyloid-beta-Induced Oxidative Stress and Mitochondrial Dysfunction. J. Alzheimers Dis. 2015, 45, 933–946. [Google Scholar] [CrossRef] [PubMed] [Green Version]
- Gray, N.E.; Zweig, J.A.; Caruso, M.; Martin, M.D.; Zhu, J.Y.; Quinn, J.F.; Soumyanath, A. Centella asiatica increases hippocampal synaptic density and improves memory and executive function in aged mice. Brain. Behav. 2018, 8, e01024. [Google Scholar] [CrossRef]
- Gray, N.E.; Zweig, J.A.; Caruso, M.; Zhu, J.Y.; Wright, K.M.; Quinn, J.F.; Soumyanath, A. Centella asiatica attenuates hippocampal mitochondrial dysfunction and improves memory and executive function in β-amyloid overexpressing mice. Mol. Cell. Neurosci. 2018, 93, 1–9. [Google Scholar] [CrossRef] [PubMed]
- Gray, N.E.; Zweig, J.A.; Murchison, C.; Caruso, M.; Matthews, D.G.; Kawamoto, C.; Harris, C.J.; Quinn, J.F.; Soumyanath, A. Centella asiatica attenuates Aβ-induced neurodegenerative spine loss and dendritic simplification. Neurosci. Lett. 2017, 646, 24–29. [Google Scholar] [CrossRef] [Green Version]
- Alcázar Magaña, A.; Kamimura, N.; Soumyanath, A.; Stevens, J.F.; Maier, C.S. Caffeoylquinic acids: Chemistry, biosynthesis, occurrence, analytical challenges, and bioactivity. Plant. J. 2021, 107, 1299–1319. [Google Scholar] [CrossRef] [PubMed]
- Adamczyk-Sowa, M.; Pierzchala, K.; Sowa, P.; Mucha, S.; Sadowska-Bartosz, I.; Adamczyk, J.; Hartel, M. Melatonin acts as antioxidant and improves sleep in MS patients. Neurochem. Res. 2014, 39, 1585–1593. [Google Scholar] [CrossRef] [PubMed] [Green Version]
- Alcazar Magana, A.; Wright, K.; Vaswani, A.; Caruso, M.; Reed, R.L.; Bailey, C.F.; Nguyen, T.; Gray, N.E.; Soumyanath, A.; Quinn, J.; et al. Integration of mass spectral fingerprinting analysis with precursor ion (MS1) quantification for the characterisation of botanical extracts: Application to extracts of Centella asiatica (L.) Urban. Phytochem. Anal. 2020, 31, 722–738. [Google Scholar] [CrossRef] [Green Version]
- Cheng, X.; Shin, Y.G.; Levine, B.S.; Smith, A.C.; Tomaszewski, J.E.; van Breemen, R.B. Quantitative analysis of betulinic acid in mouse, rat and dog plasma using electrospray liquid chromatography/mass spectrometry. Rapid Commun. Mass Spectrom. 2003, 17, 2089–2092. [Google Scholar] [CrossRef] [PubMed]
- Nair, S.N.; Menon, S.; Shailajan, S. A liquid chromatography/electrospray ionization tandem mass spectrometric method for quantification of asiatic acid from plasma: Application to pharmacokinetic study in rats. Rapid Commun. Mass Spectrom. 2012, 26, 1899–1908. [Google Scholar] [CrossRef]
- Xue, M.; Shi, H.; Zhang, J.; Liu, Q.Q.; Guan, J.; Zhang, J.Y.; Ma, Q. Stability and Degradation of Caffeoylquinic Acids under Different Storage Conditions Studied by High-Performance Liquid Chromatography with Photo Diode Array Detection and High-Performance Liquid Chromatography with Electrospray Ionization Collision-Induced Dissociation Tandem Mass Spectrometry. Molecules 2016, 21, 948. [Google Scholar] [CrossRef]
- Dawidowicz, A.L.; Typek, R. Transformation of chlorogenic acids during the coffee beans roasting process. Eur. Food Res. Technol. 2017, 243, 379–390. [Google Scholar] [CrossRef]
- Songvut, P.; Anukunwithaya, T.; Chariyavilaskul, P.; Tantisira, M.H.; Khemawoot, P. Interspecies differences in pharmacokinetic and metabolic profiles of triterpenoid glycosides in standardized extract of Centella asiatica, ECa 233. In Proceedings of the 41st Pharmacological and Therapeutic Society of Thailand Meeting, Chiang Mai, Thailand, 14–15 February 2019. [Google Scholar]
- Sorkin, B.C.; Kuszak, A.J.; Bloss, G.; Fukagawa, N.K.; Hoffman, F.A.; Jafari, M.; Barrett, B.; Brown, P.N.; Bushman, F.D.; Casper, S.J.; et al. Improving natural product research translation: From source to clinical trial. FASEB J. 2020, 34, 41–65. [Google Scholar] [CrossRef] [PubMed] [Green Version]
- Sorkin, B.C.; Kuszak, A.J.; Williamson, J.S.; Hopp, D.C.; Betz, J.M. The Challenge of Reproducibility and Accuracy in Nutrition Research: Resources and Pitfalls. Adv. Nutr. 2016, 7, 383–389. [Google Scholar] [CrossRef] [PubMed] [Green Version]
- Lou, J.S.; Dimitrova, D.M.; Murchison, C.; Arnold, G.C.; Belding, H.; Seifer, N.; Le, N.; Andrea, S.B.; Gray, N.E.; Wright, K.M.; et al. triterpenes for diabetic neuropathy: A randomized, double-blind, placebo-controlled, pilot clinical study. Esper. Dermatol. 2018, 20, 12–22. [Google Scholar] [CrossRef] [PubMed]
- Rush, W.R.; Murray, G.R.; Graham, D.J. The comparative steady-state bioavailability of the active ingredients of Madecassol. Eur. J. Drug Metab. Pharm. 1993, 18, 323–326. [Google Scholar] [CrossRef] [PubMed]
- Songvut, P.; Chariyavilaskul, P.; Tantisira, M.H.; Khemawoot, P. Safety and Pharmacokinetics of Standardized Extract of Centella asiatica (ECa 233) Capsules in Healthy Thai Volunteers: A Phase 1 Clinical Study. Planta Med. 2019, 85, 483–490. [Google Scholar] [CrossRef]
- Songvut, P.; Chariyavilaskul, P.; Khemawoot, P.; Tansawat, R. Pharmacokinetics and metabolomics investigation of an orally modified formula of standardized Centella asiatica extract in healthy volunteers. Sci. Rep. 2021, 11, 6850. [Google Scholar] [CrossRef]
- Chassaud, L.F.; Fry, B.J.; Hawkins, D.R.; Lewis, J.D.; Sword, I.P.; Taylor, T.; Hathway, D.E. The metabolism of asiatic acid,-madecassic acid and asiaticoside in the rat. Arzneimittelforschung 1971, 21, 1379–1384. [Google Scholar]
- Leng, D.D.; Han, W.J.; Rui, Y.; Dai, Y.; Xia, Y.F. In vivo disposition and metabolism of madecassoside, a major bioactive constituent in Centella asiatica (L.) Urb. J. Ethnopharmacol. 2013, 150, 601–608. [Google Scholar] [CrossRef]
- Kobashi, K.; Akao, T. Relation of Intestinal Bacteria to Pharmacological Effects of Glycosides. Biosci. Microflora 1997, 16, 1–7. [Google Scholar] [CrossRef] [Green Version]
- Han, W.J.; Xia, Y.F.; Dai, Y. Development and validation of high-performance liquid chromatography/electrospray ionization mass spectrometry for assay of madecassoside in rat plasma and its application to pharmacokinetic study. Biomed. Chromatogr. 2012, 26, 26–32. [Google Scholar] [CrossRef]
- Wang, T.; Leng, D.D.; Gao, F.F.; Jiang, C.J.; Xia, Y.F.; Dai, Y. A LC-ESI-MS method for the simultaneous determination of madecassoside and its metabolite madecassic acid in rat plasma: Comparison pharmacokinetics in normal and collagen-induced arthritic rats. Chin. J. Nat. Med. 2014, 12, 943–951. [Google Scholar] [CrossRef]
- Sun, B.; Wu, L.; Wu, Y.; Zhang, C.; Qin, L.; Hayashi, M.; Kudo, M.; Gao, M.; Liu, T. Therapeutic Potential of. Front. Pharmacol. 2020, 11, 568032. [Google Scholar] [CrossRef] [PubMed]
- Clifford, M.N. Chlorogenic acids and other cinnamates—Nature, occurrence, dietary burden, absorption and metabolism. J. Sci. Food Agric. 2000, 80, 1033–1043. [Google Scholar] [CrossRef]
- Clifford, M.N.; Wu, W.; Kirkpatrick, J.; Kuhnert, N. Profiling the chlorogenic acids and other caffeic acid derivatives of herbal chrysanthemum by LC-MSn. J. Agric. Food Chem. 2007, 55, 929–936. [Google Scholar] [CrossRef] [PubMed]
- Williamson, G.; Dionisi, F.; Renouf, M. Flavanols from green tea and phenolic acids from coffee: Critical quantitative evaluation of the pharmacokinetic data in humans after consumption of single doses of beverages. Mol. Nutr. Food Res. 2011, 55, 864–873. [Google Scholar] [CrossRef]
- Erk, T.; Williamson, G.; Renouf, M.; Marmet, C.; Steiling, H.; Dionisi, F.; Barron, D.; Melcher, R.; Richling, E. Dose-dependent absorption of chlorogenic acids in the small intestine assessed by coffee consumption in ileostomists. Mol. Nutr. Food Res. 2012, 56, 1488–1500. [Google Scholar] [CrossRef]
- Stalmach, A.; Mullen, W.; Barron, D.; Uchida, K.; Yokota, T.; Cavin, C.; Steiling, H.; Williamson, G.; Crozier, A. Metabolite profiling of hydroxycinnamate derivatives in plasma and urine after the ingestion of coffee by humans: Identification of biomarkers of coffee consumption. Drug Metab. Dispos. 2009, 37, 1749–1758. [Google Scholar] [CrossRef] [Green Version]
- Wong, C.C.; Meinl, W.; Glatt, H.R.; Barron, D.; Stalmach, A.; Steiling, H.; Crozier, A.; Williamson, G. In vitro and in vivo conjugation of dietary hydroxycinnamic acids by UDP-glucuronosyltransferases and sulfotransferases in humans. J. Nutr. Biochem. 2010, 21, 1060–1068. [Google Scholar] [CrossRef]
- Senger, D.R.; Li, D.; Jaminet, S.C.; Cao, S. Activation of the Nrf2 Cell Defense Pathway by Ancient Foods: Disease Prevention by Important Molecules and Microbes Lost from the Modern Western Diet. PLoS ONE 2016, 11, e0148042. [Google Scholar] [CrossRef]
- Wittemer, S.M.; Veit, M. Validated method for the determination of six metabolites derived from artichoke leaf extract in human plasma by high-performance liquid chromatography-coulometric-array detection. J. Chromatogr. B Anal. Technol. Biomed. Life Sci. 2003, 793, 367–375. [Google Scholar] [CrossRef]
- Scherbl, D.; Renouf, M.; Marmet, C.; Poquet, L.; Cristiani, I.; Dahbane, S.; Emady-Azar, S.; Sauser, J.; Galan, J.; Dionisi, F.; et al. Breakfast consumption induces retarded release of chlorogenic acid metabolites in humans. Eur. Food Res. Technol. 2016, 243, 791–806. [Google Scholar] [CrossRef]
- Su, D.; Huang, J.; Song, Y.; Feng, Y. Comparative pharmacokinetics and tissue distribution study of mono-, and di-caffeoylquinic acids isomers of Ainsliaea fragrans Champ by a fast UHPLC-MS/MS method. Fitoterapia 2014, 99, 139–152. [Google Scholar] [CrossRef]
- Farah, A.; Monteiro, M.; Donangelo, C.M.; Lafay, S. Chlorogenic acids from green coffee extract are highly bioavailable in humans. J. Nutr. 2008, 138, 2309–2315. [Google Scholar] [CrossRef] [PubMed] [Green Version]
- Monteiro, M.; Farah, A.; Perrone, D.; Trugo, L.C.; Donangelo, C. Chlorogenic acid compounds from coffee are differentially absorbed and metabolized in humans. J. Nutr. 2007, 137, 2196–2201. [Google Scholar] [CrossRef] [Green Version]
- Liu, J.; Dou, G.; Dong, X.; Yuan, D.; Ji, X.; Wu, Z.; Meng, Z. An improved LC-MS/MS method for simultaneous determination of 1,5-dicaffeoylquinic acid and its active metabolites in human plasma and its application to a pharmacokinetic study in patients. Biomed. Chromatogr. 2010, 24, 935–940. [Google Scholar] [CrossRef] [PubMed]
- Wittemer, S.M.; Ploch, M.; Windeck, T.; Muller, S.C.; Drewelow, B.; Derendorf, H.; Veit, M. Bioavailability and pharmacokinetics of caffeoylquinic acids and flavonoids after oral administration of Artichoke leaf extracts in humans. Phytomedicine 2005, 12, 28–38. [Google Scholar] [CrossRef]
- McGuffin, M. (Ed.) American Herbal Products Association’s Botanical Safety Handbook; CRC Press: Boca Raton, FL, USA, 1997. [Google Scholar]
- Wattanathorn, J.; Mator, L.; Muchimapura, S.; Tongun, T.; Pasuriwong, O.; Piyawatkul, N.; Yimtae, K.; Sripanidkulchai, B.; Singkhoraard, J. Positive modulation of cognition and mood in the healthy elderly volunteer following the administration of Centella asiatica. J. Ethnopharmacol. 2008, 116, 325–332. [Google Scholar] [CrossRef]
- Dev, R.D.O.; Mohamed, S.; Hambali, Z.; Samah, B.A. Comparison on cognitive effects of Centella asiatica in healthy middle age female and male volunteers. Eur. J. Sci. Res. 2009, 31, 553–656. [Google Scholar]
- Tiwari, S.; Singh, S.; Patwardhan, K.; Ghlot, S.; Gambhir, I. Effect of Centella asiatica on mild cognitive impairment (MCI) and other common age-related clinical problems. Digst J. Nanomater. Biostruct. 2008, 3, 215–220. [Google Scholar]


| Compound | 2 g (mg/sachet ± SD) | 4 g (mg/sachet ± SD) |
|---|---|---|
| Asiaticoside | 58.98 ± 1.46 | 106.52 ± 4.65 |
| Madecassoside | 36.03 ± 0.48 | 71.93 ± 1.39 |
| Madecassic Acid | 6.29 ± 0.05 | 12.97 ± 0.25 |
| Asiatic acid | 5.93 ± 0.07 | 11.40 ± 1.02 |
| 3-O-Caffeoylquinic acid (Chlorogenic acid) | 1.79 ±0.03 | 3.54 ±0.05 |
| 5-O-Caffeoylquinic acid (Neochlorogenic acid) | 1.32 ± 0.02 | 2.60 ± 0.04 |
| 3,4-Dicaffeoylquinic acid (Isochlorogenic acid B) | 1.03 ± 0.02 | 2.12 ± 0.03 |
| 4,5-Dicaffeoylquinic acid (Isochlorogenic acid C) | 1.07 ± 0.04 | 1.92 ± 0.07 |
| 3,5-Dicaffeoylquinic acid (Isochlorogenic acid A) | 0.84 ± 0.01 | 1.64 ± 0.03 |
| 4-O-Caffeoylquinic acid (Cryptochlorogenic acid) | 0.59 ± 0.02 | 1.20 ± 0.03 |
| 1,3-Dicaffeoylquinic acid | 0.45 ± 0.01 | 0.90 ± 0.02 |
| 1,5-Dicaffeoylquinic acid | 0.36 ± 0.01 | 0.71 ± 0.01 |
| Caffeic acid | 0.09 ± 0.002 | 0.17 ± 0.003 |
| Kaempferol | 0.06 ± 0.002 | 0.10 ± 0.002 |
| Naringin | 0.05 ± 0.002 | 0.09 ± 0.002 |
| Quercetin | 0.04 ± 0.002 | 0.07 ± 0.003 |
| Ferulic acid | 0.03 ± 0.001 | 0.05 ± 0.002 |
| Dihydrocaffeic acid | 0.02 ± 0.001 | 0.04 ± 0.001 |
| Rutin | 0.02 ± 0.001 | 0.04 ± 0.002 |
| Demographic Data | Baseline | 2 g CAW * | 4 g CAW * |
|---|---|---|---|
| Gender, % (n) | |||
| Female | 40% (n = 2) | 25% (n = 1) | 25% (n = 1) |
| Male | 60% (n = 3) | 75% (n = 3) | 75% (n = 3) |
| Age a (year) | 70 [59] | 67.8 [2.8] | 67.8 [2.8] |
| Body mass index b (kg/m2) | 28 ± 2 | 27 ± 2 | 27 ± 2 |
| Systolic blood pressure b (mmHg) | 132 ± 7 | 117 ± 5 | 124 ± 5 |
| Diastolic blood pressure b (mmHg) | 81 ± 3 | 75 ± 3 | 74 ± 3 |
| Body temperature b (°C) | 36.7 ± 0.08 | 36.6 ± 0.03 | 36.9 ± 0.08 |
| Heart rate b (bpm) | 68 ± 5 | 69 ± 3 | 62 ± 5 |
| Race, % (n) | |||
| American Indian/Alaska Native | 0 | 0 | 0 |
| Asian | 0 | 0 | 0 |
| Black or African American | 0 | 0 | 0 |
| Native Hawaiian or Other Pacific Islander | 0 | 0 | 0 |
| White | 100 (5) | 100 (4) | 100 (4) |
| Clinical laboratory screening b | |||
| White blood cell (×103/µL) | 7.28 ± 0.60 | NM | NM |
| Red blood cell (×106/µL) | 4.64 ± 0.21 | NM | NM |
| Hemoglobin (g/dL) | 14.3 ± 0.6 | NM | NM |
| Hematocrit (%) | 44 ± 2 | NM | NM |
| Platelet (×103/µL) | 259 ± 20 | NM | NM |
| Blood glucose (mg/dL) | 81 ± 3 | 92 ± 6 | 89 ± 8 |
| Blood urea nitrogen (mg/dL) | 17 ± 3 | 24 ± 2 ^ | 24 ± 3 ^ |
| Creatinine (mg/dL) | 0.90 ± 0.06 | 0.85 ± 0.06 | 0.83 ± 0.09 |
| Total bilirubin (mg/dL) | 0.6 ± 0.1 | 0.7 ± 0.1 | 0.8 ± 0.1 |
| Aspartate aminotransferase (U/L) | 26 ± 3 | 28 ± 6 | 37 ± 2 |
| Alanine aminotransferase (U/L) | 32 ± 3 | 39 ± 6 | 43 ± 7 |
| Alkaline phosphatase (U/L) | 87 ± 12 | 84 ± 9 | 80 ± 7 |
| Total Protein (g/dL) | 7.7 ± 0.1 | 7.2 ± 0.2 | 7.1 ± 0.2 |
| Albumin (g/dL) | 3.8 ± 0.1 | 3.7 ± 0.1 | 3.6 ± 0.1 |
| Sodium (mmol/L) | 141 ± 1 | 141 ± 1 | 141 ± 1 |
| Chloride (mmol/L) | 108 ± 1 | 109 ± 0.5^ | 110 ± 1 ^ |
| Potassium (mmol/L) | 3.8 ± 0.1 | 3.8 ± 0.2 | 4.1 ± 0.3 |
| Total CO2 (mmol/L) | 29 ± 1 | 28 ± 0.3 | 28 ± 1 |
| Calcium (mg/dL) | 9.3 ± 0.1 | 9.1 ± 0.1 | 9.3 ± 0.9 |
| Anion Gap | 5 ± 1 | 5 ± 1 | 4 ± 1 |
| Pharmacokinetic Parameter | Analyte | 2 g CAW (n = 4) | 4 g CAW (n = 4) | p-Value |
|---|---|---|---|---|
| Cmax (ng/mL) | AA | 124 ± 29 | 259 ± 24 | 0.01 * |
| CA | 0.3 ± 0.2 | 1 ± 0.1 | 0.23 | |
| DHCA | 1 ± 0.4 | 2 ± 0.2 | 0.001 * | |
| DHFA | 11 ± 5 | 20 ± 6 | 0.05 * | |
| Di-CQAs | 18 ± 10 | 3 ± 0.3 | - | |
| FA | 1 ± 0.2 | 1.4 ± 0.1 | 0.07 | |
| HPP | 32 ± 18 | 42 ± 18 | 0.09 | |
| IFA | 0.9 ± 0.3 | 2 ± 0.1 | 0.003 * | |
| MA | 38 ± 3 | 63 ± 10 | 0.10 | |
| Mono-CQAs | 14 ± 7 | 7 ± 2 | 0.11 | |
| Tmax (h) | AA | 2 ± 0.6 | 2 ± 0.6 | 0.82 |
| CA | 4 ± (2) | 4 ± 1 | 0.40 | |
| DHCA | 3.25 ± 0.5 | 3.5 ± 0.5 | 0.20 | |
| DHFA | 3.4 ± 1 | 3.5 ± 0.5 | 0.48 | |
| Di-CQAs | 6 ± 2 | 0.6 ± 0.3 | - | |
| FA | 5 ± 0.6 | 5.5 ± 0.5 | 0.20 | |
| HPP | 6 ± 1.4 | 5.5 ± 1.7 | 0.32 | |
| IFA | 1.3 ± 0.6 | 1 ± 0.4 | 0.35 | |
| MA | 2 ± 0.5 | 2 ± 0.5 | 0.52 | |
| Mono-CQAs | 4 ± 2 | 2 ± 0.4 | 0.13 | |
| t½ (h) | AA | 3.8 ± 1 | 2.2 ± 0.5 | 0.34 |
| CA | 2.6 | 3.5 ± 1.2 | - | |
| DHCA | 4.8 ± 1.3 | 1.1 ± 0.4 | 0.08 | |
| DHFA | 4.5 ± 1.6 | 2.5 ± 0.3 | 0.23 | |
| Di-CQAs | <LLOQ | 3 ± 2 | - | |
| FA | 13.4 ± 5.3 | 7 ± 1.2 | 0.14 | |
| HPP | 2.3 ± 0.3 | 1.8 ± 0.7 | 0.28 | |
| IFA | 8.8 ± 5.7 | 2.9 ± 0.6 | 0.17 | |
| MA | 1.7 ± 0.5 | 1.7 ± 0.9 | 0.98 | |
| Mono-CQAs | 2 ± 0.5 | 3 ± 0.3 | 0.16 | |
| AUC (ng × h/mL) | AA | 364 ± 114 | 935 ± 178 | 0.04 * |
| CA | 1 ± 1 | 3 ± 0.3 | 0.01 * | |
| DHCA | 3 ± 0.4 | 6 ± 1 | 0.06 | |
| DHFA | 42 ± 18 | 77 ± 25 | 0.08 | |
| Di-CQAs | 18 ± 10 | 6 ± 4 | 0.56 | |
| FA | 7 ± 2 | 10 ± 1 | 0.21 | |
| HPP | 100 ± 46 | 189 ± 77 | 0.05 * | |
| IFA | 5 ± 2 | 8 ± 0.4 | 0.05 * | |
| MA | 101 ± 16 | 187 ± 48 | 0.23 | |
| Mono-CQAs | 18 ± 6 | 23 ± 4 | 0.16 |
| Analyte | Screening Total ng/mL | Screening Unconjugated ng/mL | Baseline Total ng/mL | Baseline Unconjugated ng/mL | Screening Total: Baseline Total |
|---|---|---|---|---|---|
| AA | 0.5 ± 5 | ND | ND | ND | p = 0.4 |
| AS | ND | ND | ND | ND | NA |
| CA | 260 ± 140 | 184 ± 144 | ND | ND | p = 0.02 * |
| DHCA | 117 ± 64 | 46 ± 36 | 9 ± 3 | 0.9 ± 2 | p = 0.03 * |
| DHFA | 939 ± 507 | 179 ± 74 | 273 ± 131 | 8 ± 6 | p = 0.1 |
| Di-CQAs | ND | ND | ND | ND | NA |
| FA | 372 ± 78 | 7 ± 3 | 17 ± 7 | 0.1 ± 0.1 | p = 0.0001 * |
| HPP | 91 ± 48 | 23 ± 14 | 2 ± 2 | ND | p = 0.02 * |
| IFA | 472 ± 246 | 4 ± 3 | 5 ± 2 | ND | p = 0.02 * |
| MA | ND | ND | ND | ND | NA |
| Mono-CQAs | 812 ± 749 | 507 ± 475 | ND | ND | p = 0.1 |
| MS | ND | ND | ND | ND | NA |
| Adverse Event | 2 g CAW | 4 g CAW | Relation to Medication |
|---|---|---|---|
| Psychological/General | |||
| Anxiety | 1/4 (25%) Mild | Not related | |
| Drowsiness | 1/4 (25%) Mild | 1/4 (25%) Mild | Not related |
| Neurological/Muscle | |||
| Headache | 1/4 (25%) Mild | Possibly related | |
| Inability to sit still | 1/4 (25%) Mild | Not related | |
| Rigidity of any body part | 1/4 (25%) Moderate | Not related | |
| Head, Eyes, Ears, Nose, and Throat | |||
| Blurred vision | 1/4 (25%) Mild | Not related | |
| Sore throat | 1/4 (25%) Mild | Not related | |
| Allergy symptoms | 2/4 (50%) Mild | Not related | |
| Nasal congestion/sinusitis | 1/4 (25%) Mild | 1/4 (25%) Moderate | Not related |
| Cardiopulmonary | |||
| Heart racing or irregular beating | 1/4 (25%) | 1/4 (25%) | Not related |
| Hypertension/Elevated blood pressure | 1/4 (25%) | 1/4 (25%) | Not related |
| Gastrointestinal | |||
| Increased appetite | 1/4 (25%) Mild | 2/4 (50%) Mild-Moderate | Not related |
| Dry mouth | 1/4 (25%) Mild | Possibly related | |
| Genitourinary | |||
| Increased urination | 2/4 (50%) Mild | Not related | |
| Skin | |||
| Sunburn or sensitivity of skin to light | 1/4 (25%) Mild | Not related | |
| Whole Body | |||
| Generalized pain | 1/4 (25%) Mild | 1/4 (25%) Mild | Not related |
Publisher’s Note: MDPI stays neutral with regard to jurisdictional claims in published maps and institutional affiliations. |
© 2022 by the authors. Licensee MDPI, Basel, Switzerland. This article is an open access article distributed under the terms and conditions of the Creative Commons Attribution (CC BY) license (https://creativecommons.org/licenses/by/4.0/).
Share and Cite
Wright, K.M.; Bollen, M.; David, J.; Speers, A.B.; Brandes, M.S.; Gray, N.E.; Alcázar Magaña, A.; McClure, C.; Stevens, J.F.; Maier, C.S.; et al. Pharmacokinetics and Pharmacodynamics of Key Components of a Standardized Centella asiatica Product in Cognitively Impaired Older Adults: A Phase 1, Double-Blind, Randomized Clinical Trial. Antioxidants 2022, 11, 215. https://0-doi-org.brum.beds.ac.uk/10.3390/antiox11020215
Wright KM, Bollen M, David J, Speers AB, Brandes MS, Gray NE, Alcázar Magaña A, McClure C, Stevens JF, Maier CS, et al. Pharmacokinetics and Pharmacodynamics of Key Components of a Standardized Centella asiatica Product in Cognitively Impaired Older Adults: A Phase 1, Double-Blind, Randomized Clinical Trial. Antioxidants. 2022; 11(2):215. https://0-doi-org.brum.beds.ac.uk/10.3390/antiox11020215
Chicago/Turabian StyleWright, Kirsten M., Melissa Bollen, Jason David, Alex B. Speers, Mikah S. Brandes, Nora E. Gray, Armando Alcázar Magaña, Christine McClure, Jan F. Stevens, Claudia S. Maier, and et al. 2022. "Pharmacokinetics and Pharmacodynamics of Key Components of a Standardized Centella asiatica Product in Cognitively Impaired Older Adults: A Phase 1, Double-Blind, Randomized Clinical Trial" Antioxidants 11, no. 2: 215. https://0-doi-org.brum.beds.ac.uk/10.3390/antiox11020215