Article

Levels of Plasma Coenzyme Q10 Are Associated with Physical Capacity and Cardiovascular Risk in the Elderly

by
Rocío de la Bella-Garzón
1,
Cristina Fernández-Portero
2,
David Alarcón
2,
Josué G. Amián
2 and
Guillermo López-Lluch
1,3,4,*
1
Department of Physiology, Anatomy and Cell Biology, Andalusian Centre of Developmental Biology, Universidad Pablo de Olavide, 41013 Seville, Spain
2
Department of Social Antropology, Psychology and Public Health, Universidad Pablo de Olavide, 41013 Sevilla, Spain
3
Centro de Investigación Biomédica en Red de Enfermedades Raras (CIBERER, U729), Instituto de Salud Carlos III-Madrid, Av. Monforte de Lemos, 3-5. Pabellón 11. Planta 0, 28029 Madrid, Spain
4
Centro de Investigación en Rendimiento Físico y Deportivo, Universidad Pablo de Olavide, 41013 Sevilla, Spain
*
Author to whom correspondence should be addressed.
Submission received: 4 January 2022 / Revised: 26 January 2022 / Accepted: 27 January 2022 / Published: 29 January 2022
(This article belongs to the Special Issue CoQ10 and Aging and Age-Related Diseases)

Abstract

:
Coenzyme Q10 (CoQ10) is an essential factor for mitochondrial activity and antioxidant protection of cells, tissues and plasma lipoproteins. Its deficiency has been associated with aging progression in animals and humans. To determine if CoQ10 levels in plasma can be associated with frailty in elderly people (aged > 65), we studied the relationship of CoQ10 levels in blood with other parameters in plasma and with the physical activity and capacity in aged people. Our results indicate that high CoQ10 levels are directly associated with lower cardiovascular risk measured by the quotient total cholesterol/HDL cholesterol. Furthermore, high CoQ10 levels were found in people showing higher physical activity, stronger muscle capacity. CoQ10 also showed a strong inverse relationship with sedentarism and the up and go test, which is considered to be a frailty index. Interestingly, we found gender differences, indicating stronger correlations in women than in men. The importance of the maintenance of CoQ10 levels in elderly people to avoid sarcopenia and frailty in elderly people is discussed.

1. Introduction

Coenzyme Q10 (CoQ10) is a key component for cell metabolism and antioxidant protection [1]. In mitochondria, CoQ10 is located into the inner mitochondrial membrane in which it acts as essential component of the electron transport chain (ETC) [2]. In mitochondria, and in the rest of the membranes, CoQ10 is the main antioxidant for the lipidic milieu reducing oxidative damage of phospholipids and controlling by this mechanism cell survival [3,4,5,6]. Furthermore, in plasma lipoproteins, CoQ10 is the main protective agent reducing the peroxidation of these proteins, reducing cardiovascular risk by decreasing oxidation of low-density lipoproteins (oxLDLs), especially in elderly people [7].
Because of these essential activities, CoQ10 can be consider a key component for the physiology of cells that play an important role in the progression of aging [1,8,9]. In fact, decreasing levels of CoQ10 have been associated with the dysfunction of several organs in aged people. CoQ is synthesized by a synthome comprising at least 11 different proteins acting between the endoplasmic reticulum and mitochondria [9]. The inability of cells to synthesize CoQ produces many severe symptoms, mainly affecting the cerebellum, the kidneys, and muscle [10]. This indicates the importance of the maintenance of CoQ levels for correct physiological activity in many organs.
In previous studies, we determined that CoQ10 levels showed a different behavior in young from that in old people, representing a different physiological response that is probably associated with the levels of oxidative damage [11]. Furthermore, CoQ10 levels showed an inverse relationship with obesity and with oxidative damage in plasma [12]. CoQ10 can be obtained from the diet although the amount obtained seems to be very low from this source. In blood plasma, CoQ10 levels have been studied in aging to determine whether they can be considered to be aging-related biomarkers [9,13].
Taking into consideration the essential role of CoQ10 in many metabolic and antioxidant activities in the organism, the present work tries to determine whether CoQ10 levels in plasma can be associated with frailty risk in elderly people, and if CoQ10 can be considered a therapeutic target to reduce sarcopenia and improve functional capacity during aging.

2. Materials and Methods

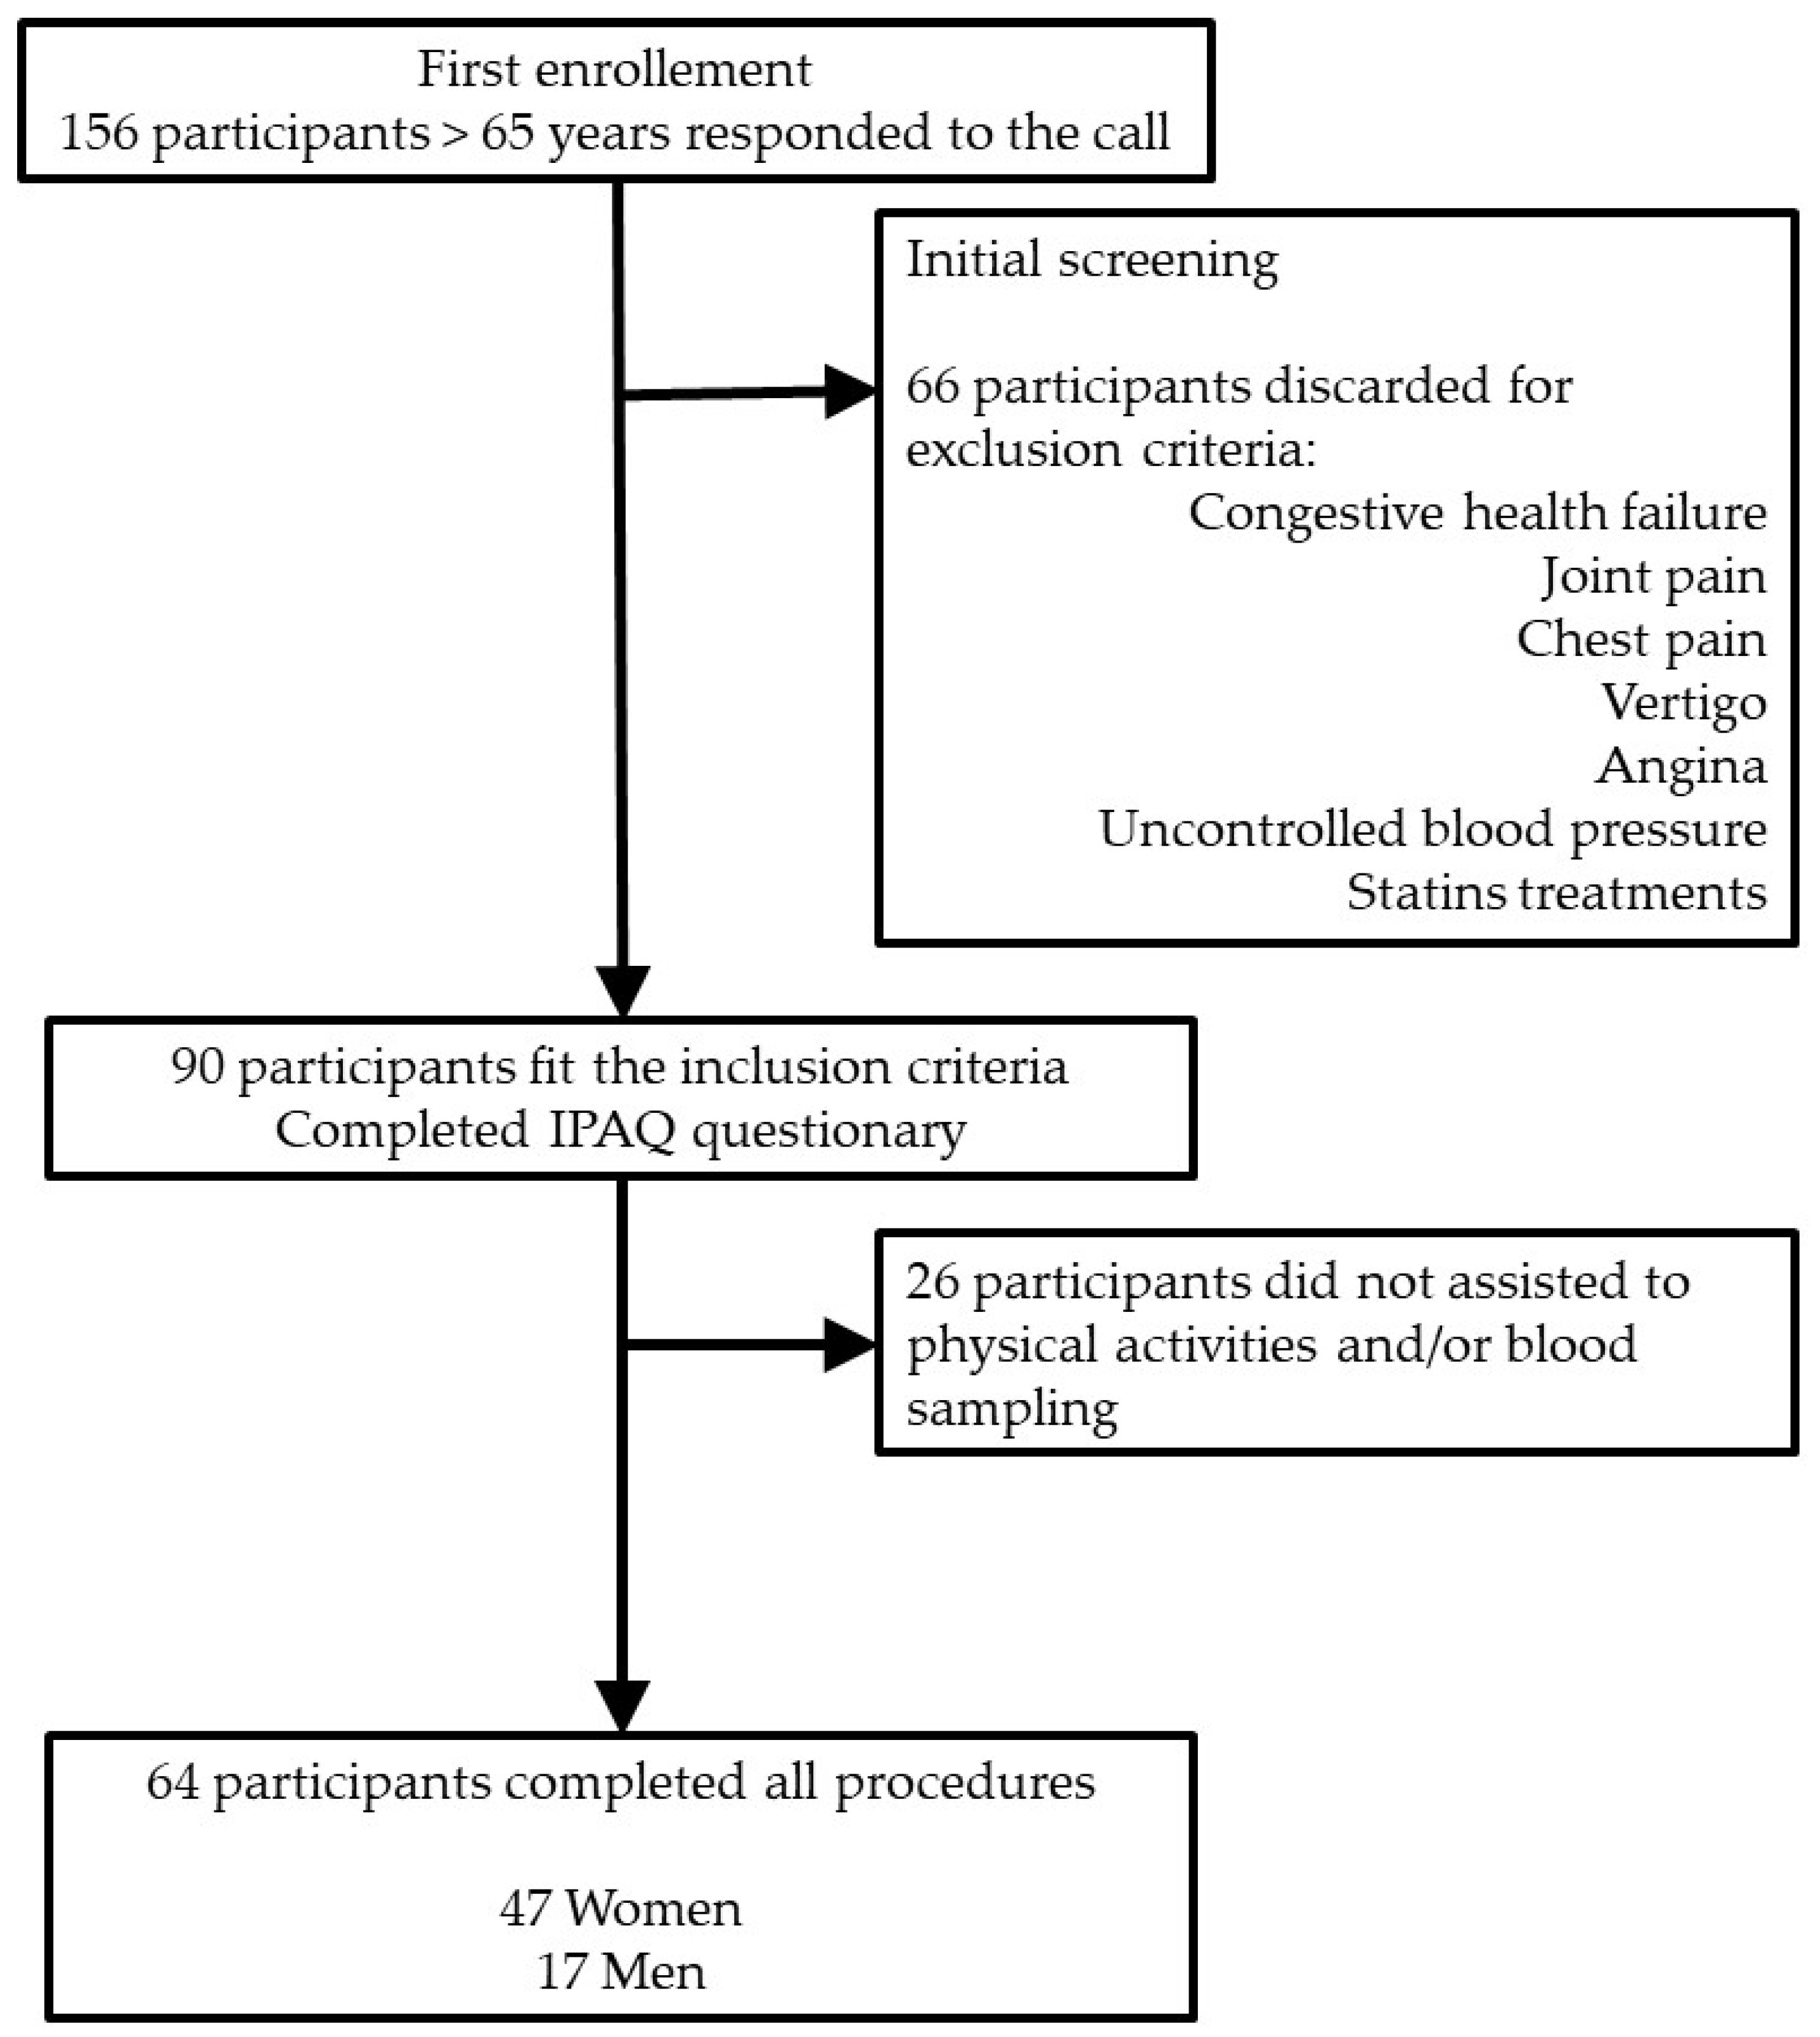
2.1. Study Design and Subjects

We conducted a cross-sectional study. Volunteers were recruited between 1 February and March and tests and sampling were performed until 30 June 2019 from a nursing home and two APC (Active Participation Centers) located in Seville, in the south of Spain. A total of 64 volunteers from three different day centers finally completed the study. The nursing home is a publicly owned center for valid and assisted patients. The medical service of the nursing home was responsible for randomly providing us subjects who voluntarily wanted to participate in the study. At the APC, the study was announced on the bulletin board, and the users accepted participation in the study voluntarily.
First, all the participants were informed about the objective of the project and the procedures, and signed an informed consent before starting any procedure. All the procedures performed in this study were approved by the Ethic Committee for Biomedical Research of the Andalusian Government with the number 2355-N-19, follow the indications of the International Conference of Good Clinical Practices and were conducted in accordance with the 1975 Declaration of Helsinki guidelines.

2.2. Participants

The criteria for inclusion in the study were being 65 years old or older and being ready to participate in physical tests and in blood extraction. The exclusion criteria were: being under 65 years old, subjects who for medical reasons were contraindicated to perform physical exercise, had suffered congestive heart failure, had suffered around the time of the study joint pain, chest pain, vertigo, or angina, and those who had uncontrolled high blood pressure (160/100). Furthermore, participants receiving therapies for hypercholesterolemia and other diseases needing statin treatments that can affect plasma CoQ10 levels were also discarded.
A total of 156 subjects initiated the process of selection. After a first screening in which subjects were asked for their health, diseases and treatments, only 90 of them did not fit the exclusion criteria, and were considered able to perform physical activity tests and blood extraction procedures. During physical activity tests and blood testing, 26 participants did not attend to the session or had problems completing the physical activities. Finally, only 64 participants, 17 men and 47 women, fulfilled all the conditions and participated in all the procedures (Figure 1). Procedures were always carried out in the mornings.
The smoking and moderate drinking habits of the participants are included in Table 1. In general, a significant number of men maintained smoking habits during the study, whereas no woman maintained this habit. Most of the women did not smoke actively, whereas most of the men did. Regarding drinking habits, both men and women maintained moderate drinking habits at the time of the study, with sporadic consumption of beer and wine.
Most of the participants received treatments against hypertension, mainly enalapril and vasartan, inflammation, such as paracetamol or aspirin, as well as gut protective compounds such as omeprazole. Most of the men received metformin treatment against type II diabetes. In general, these treatments have not been associated with the decrease of CoQ10 levels in plasma. Thus, we can consider the clinical conditions of the participants to reflect the normal situation of elderly people in the Spanish population.

2.3. Anthropometric Determinations

Anthropometric study was carried out by determining subjects’ height and weight. BMI was estimated by dividing weight (kg) by height squared (m2). Bio-electrical impedance (Tanita BF 350) was used to determine total body fat mass, kg of muscle and the percentage of fat, basal calories and metabolic age. Blood pressure was determined by an OMROM monitor. Data from the whole population and separated by gender is indicated in (Table 2).
Metabolic age was calculated comparing the particular basal metabolic rate (BMR) of a participant with the BMR of a chronological age group. The Difference in Age (DIA) is considered the difference between the chronological age and the metabolic age. Both metabolic age and DIA are considered to be parameters that predict individuals that are at high risk of developing metabolic syndrome [14].

2.4. Determination of the Physical Capacity

The senior fitness battery of tests (SFT) was used to assess major functional fitness components of elderly people [15]. All procedures were carried out in the morning (between 9 and 11 a.m.) in a room with a pleasant temperature for the time of year (23 ± 2 °C). Tests were carried out by same-sex couples, with the exception of those who expressly communicated no problems. Each participant completed six exercise tests in the following order: 30 s chair stand, arm curl, 2 min step, chair sit and reach, back scratch and up and go tests accordingly with the indications previously published [15,16].
The 30 s chair stand test measured functional lower body strength. The arm curl test evaluated functional upper body strength. The 2-min step test (TMST) is one of many alternatives to 6 min walking test for determining exercise capacity [17]. The sit and reach test assessed the flexibility of lower back and hamstring muscles. The back scratch test measured the flexibility of the upper body and shoulders. In addition, the timed up and go test determined the risk of fall [18].

2.5. Determination of the Level of Physical Activity (IPAQ)

To evaluate the level of physical activity, we used the International Physical Activity Questionnaire (IPAQ) [19]. We used the short, self-administered last-week version of the questionnaire, which includes seven items. The IPAQ considers the time spent being physically active during the last 7 days, including computation of minutes of sitting, walking at moderate intensity, and vigorous-intensity activities. Total METs were calculated as follows: (daily minutes of vigorous walking x days per week practicing walking × 3.3) + (daily minutes of moderate-intensity activity x days practicing moderate-intensity activity × 4.0) + (daily minutes of vigorous activity x days per week practicing vigorous activity × 8.0). Level of physical activity was then classified into three categories, representing active (IPAQ3), moderate activity (IPAQ2) or insufficiently active (IPAQ1) as previously indicated [11,12].

2.6. Blood Sampling

In the blood sampling session, blood was collected after overnight fasting (10 h) by venipuncture in Vacutainer tubes containing heparin or EDTA as anticoagulants always between 8 and 10 a.m. After centrifuging at 3000× g at room temperature, plasma was collected, transferred to several Eppendorf tubes, and stored at −80 °C until measurements as previously indicated [11,12].

2.7. CoQ10 Determination in Plasma

CoQ10 plasma levels were quantified using a protocol described elsewhere [20]. A mixture of ethanol: isopropanol (95:5) was added to 100 μL of blood plasma and mixture vortexed for 1 min. As internal standard to control extraction, 100 pmol of CoQ6 were used. After adding 1 mL of hexane, samples were centrifuged at 1000× g for 5 min at 4 °C. The upper phases from three consecutive extractions were recovered and dried using a Speed Vac. The dried lipid extract obtained was dissolved in 1 mL of ethanol, dried again in a Speed-Vac, and residue stored at −80 °C until analysis.
Dried samples were dissolved in the suitable volume of ethanol prior to HPLC injection. Lipid components were separated by a Beckman 166-126 HPLC system equipped with a 15-cm Kromasil C-18 column maintained at 40 °C in a column oven. Separation was performed using a mobile phase containing 65:35 methanol/n-propanol and 1.42 mM lithium perchlorate at aflow rate of 1 mL/min and. CoQ10 levels were analyzed with ultraviolet (System Gold 168, Beckman-Coulter, Indianapolis, IN, USA)-based detectors and an electrochemical detector Coulochem III (ESA, Chelmsford, MA, USA). CoQ10 content was determined as nmol/mL (μM).

2.8. Determination of Other Parameters in Plasma

The lipid profile of subjects (total cholesterol, HDL, and triglycerides), general biochemical profile (glucose, transaminases (glutamate-pyruvate transaminase or alanine transaminase (GPT), gamma-glutamyl transferase (GGT) and glutamyl oxaloacetic transaminase or aspartate transaminase (GOT)), and creatinine, uric acid, urea, and bilirubin), as well as muscle damage (creatine kinase, CK), were determined by using the Reflotron Plus systems (Roche Diagnostics, S.L, Barcelona Spain.). Low-density lipoproteins (LDL) were determined using the Friedewald’s formula [21]. VLDL levels were calculated as triglyceride levels/5. Non-HDL levels were determined as total cholesterol-HDL.
LDL oxidation levels were determined by ELISA by using the Oxidized LDL ELISA kit as indicated by the manufacturer (Mercodia, Sweden).

2.9. Statistical Analysis

All results are expressed as mean ± standard deviation (SD). After confirming the normal distribution of the data for all variables, differences between groups were determined using Student’s t-test for two groups comparisons or two-way ANOVA with Bonferroni’s post hoc test for comparisons of more than 3 groups. Statistical analysis and Figures were performed by using the GraphPad Prism version 7.00 program (GraphPad Software Inc, San Diego, CA, USA). For correlations, the Pearson’s r analysis was performed. Levels of relationship were determined based on the recommendations of Cohen [22]; an r between 0.1 and 0.29 was considered low, an r between 0.2 and 0.49 was considered moderate, and an r more than 0.5 was considered to be indicative of high correlation. The critical significance level α was established at 0.050 and then, statistical significance was defined as p < 0.05.

3. Results

3.1. Biochemical Characterization of the Participants

All participants were older than 65, with the group of women being a bit older than the group of men. As expected, gender differences were found between the participants being men significantly taller and heavier than women are. In general, the group showed high BMI in men being a bit lower than in women, but into the overweight range in both cases. Interestingly, although the percentage of fat was higher in women than in men, the amount of visceral fat was higher in men. This indicates a different distribution of the fat in the body that can affect physical capacity.
Metabolic age of the participants was similar in both groups, although, interestingly, in men the mean of this parameter was higher than the chronological age, whereas in women it was lower. However, in any case, this difference was not significant (Table 2). No differences in blood pressure between the groups were found.
Regarding biochemical parameters in plasma, no differences between men and women were found except in parameters related to muscle damage, such as CK or GGT, which showed significantly lower levels in women in comparison with men. On the other hand, GOT showed an opposite trend. Furthermore, creatinine levels were also higher in men in comparison with women (Table 3). Regarding cardiovascular risk, determined as the quotient between total cholesterol levels and HDL levels > 4 or the levels of non-HDL cholesterol, no differences were found between genders, although in men a tendency to show higher levels was found. In the case of the ratio total cholesterol/HDL > 4, 59% (10/17) of men and 51% (24/47) of women were considered at risk.
As expected, plasma CoQ10 levels strongly correlated with total cholesterol (Pearson’s r = 0.5594, p < 0.0001) and non-HDL cholesterol (Pearson’s r = 0.5346, p < 0.001) in the whole population (Figure 2). However, when analyzed separately by gender, in men, this correlation was absent for both total cholesterol (Pearson’s r = 0.3716, p = 0.1419) and non-HDLL cholesterol (Pearson’s r = 0.3902, p = 0.1215), whereas it was maintained in women with a stronger correlation coefficient, for total cholesterol (Pearson’s r = 0.6349, p < 0.001) and non-HDL cholesterol (Pearson’s r = 0.5894, p < 0.001). No significant correlation was found with any of the other parameters determined, indicating no clear relationship with other metabolic parameters, even with oxidized LDL cholesterol (Table 4).
We considered that this lack of significance could be due to the smaller size of the male sample in comparison to the female sample. Unfortunately, we could not increase the size of the sample, since there were no more men that participated in all of the procedures involved in the study. However, in a previous study, another cohort of volunteers aged more than 65 years was also analyzed [11,12], and we calculated the relationship between CoQ10 and cholesterol in the blood of this group (unpublished results). In these studies, performed during 2013–2014, the same gender-dependent correlation was found, stronger for women, and lower or null for men. We consider this fact to be very interesting for further experiments, and, at least in elderly people, gender differences in CoQ10/cholesterol and related compounds in elderly people must be considered.
Some studies have reported that cardiovascular risk can be measured as the quotient between total cholesterol and HDL higher than 4 [23]. Interestingly, when we associated the levels of CoQ10 in plasma of the participants depending on their cardiovascular risk, people with low risk showed higher CoQ10 levels in plasma than participants with cardiovascular risk. Interestingly, this relationship was not significant in men, probably due to the lower amount of participants, but it was clearly significant in women (Figure 3).

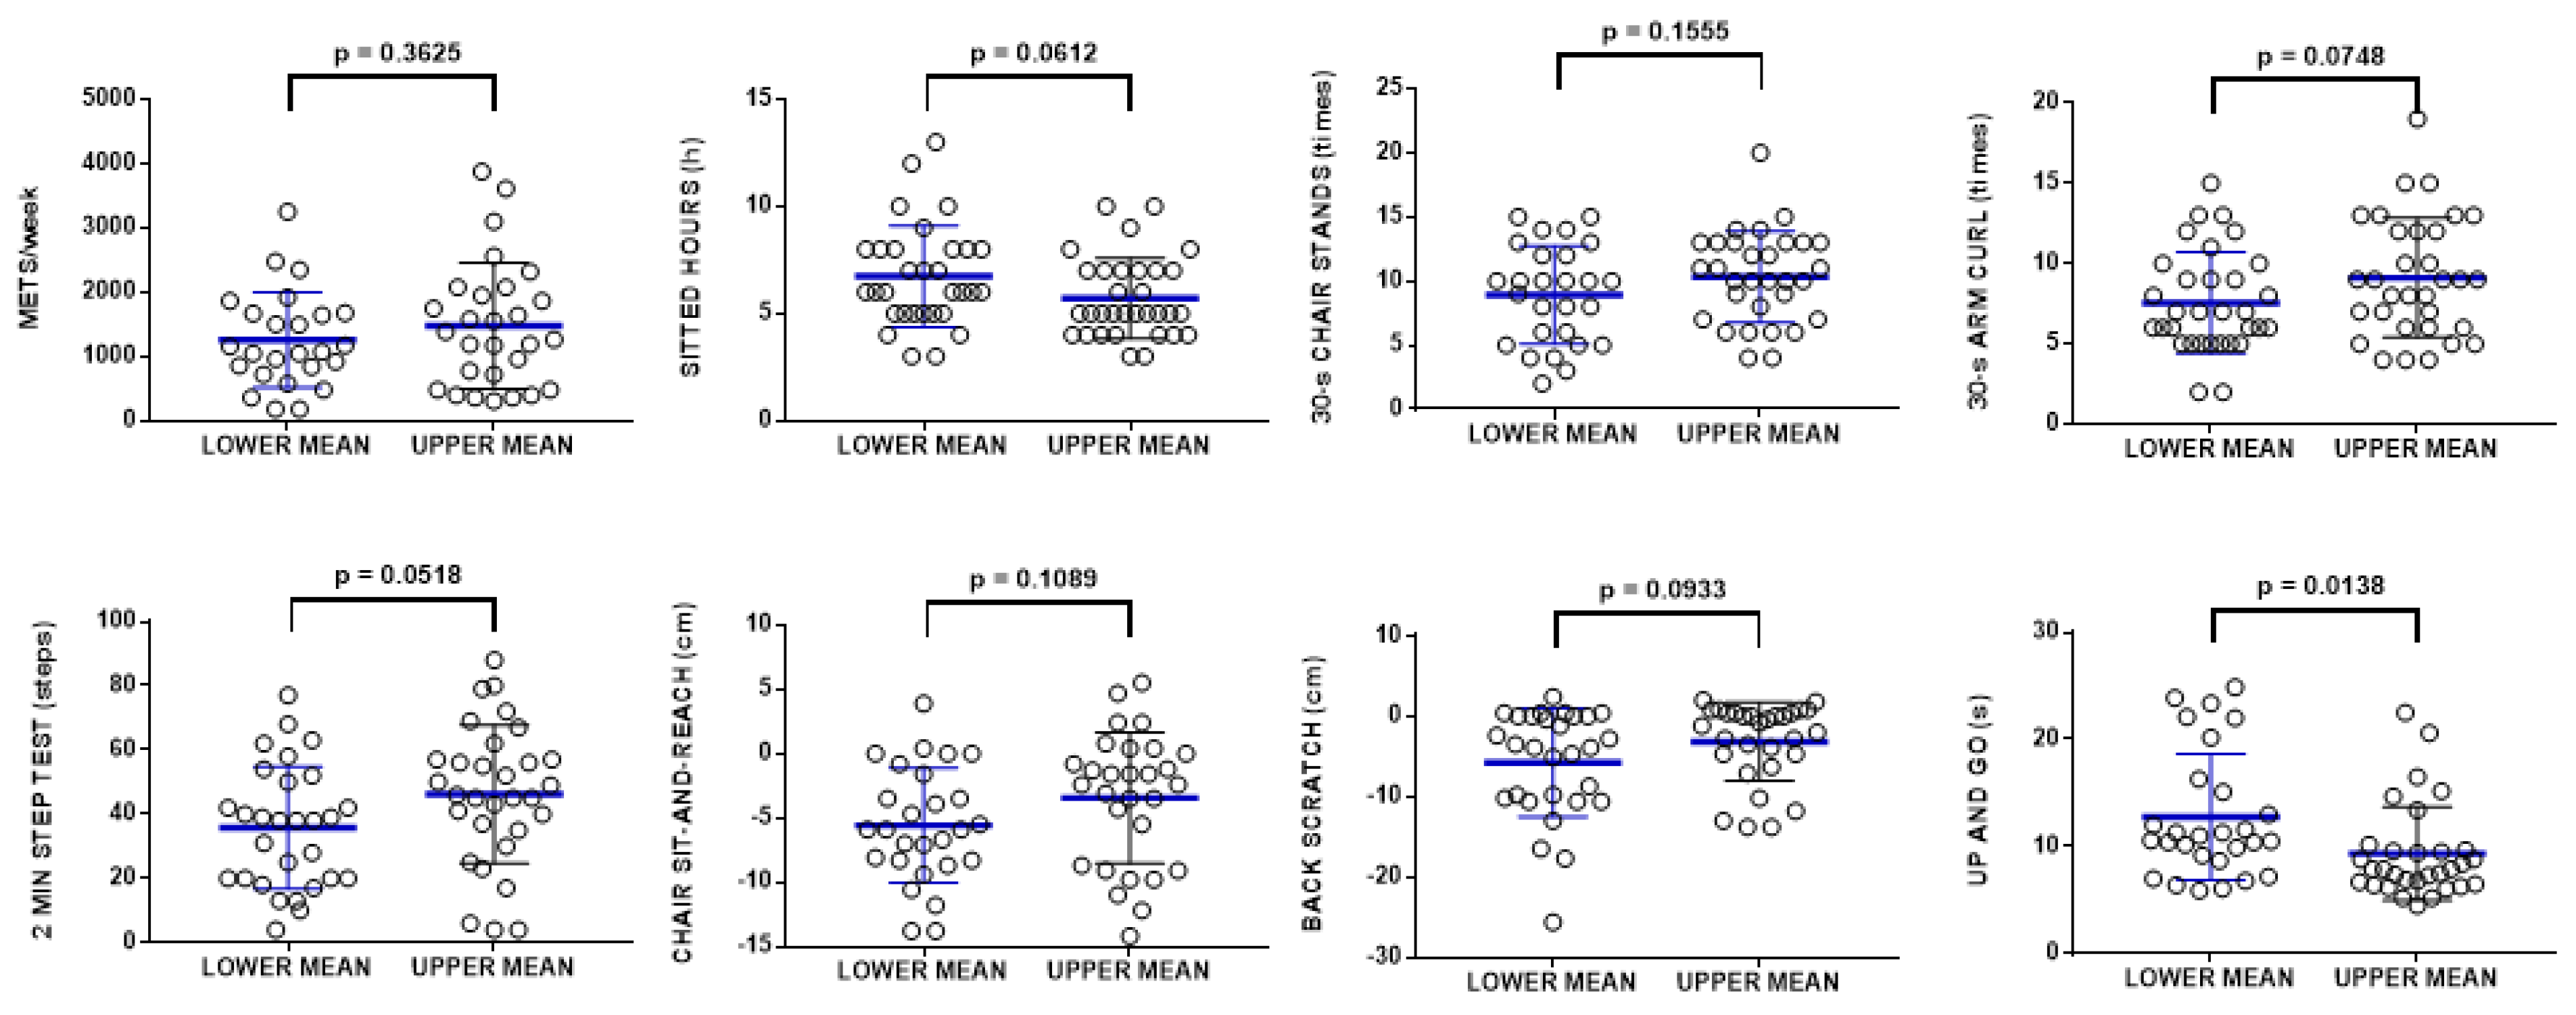
3.2. CoQ10 Levels in Plasma Correlates with Physical Activity

Regarding the physical activity of the participants, the range of activity showed a high dispersion. We found participants with a very low activity and others showing higher activity, as determined by METS/week. Interestingly, men showed more active behavior than women in this study. However, when tests from the SFT were performed, no differences between men and women were found, although men showed a tendency to obtain better scores in all the tests except in flexibility. Furthermore, the sitting time was also nearly significantly higher in women than in men (Table 5).
Interestingly, in the whole population, plasma CoQ10 levels moderately or strongly correlated with many of the scores of the tests, except in the case of flexibility tests (chair sit-and-reach and back scratch). In men, this correlation disappeared, whereas in women, all the scores showed moderate or high correlation with CoQ10 in plasma. In the case of the up and go test, the correlation was negative, since a higher time to return to the chair indicates a lower performance. Thus, this negative correlation indicates that high levels of CoQ10 in plasma are associated with lower time to return to chair, and therefore, lower frailty risk (Table 6).
On the other hand, a negative correlation between CoQ10 and sitting time was also found. In general, it is clear that higher activity and performance is associated with higher levels of CoQ10 in plasma.
Taking these relationships into consideration, we divided the population according to the risk of frailty depending on the score of the tests of the SFT and determined the levels of CoQ10 in plasma [24] (Figure 4). Participants were considered to be at risk of frailty if they scored fewer than eight repetitions for the 30-s chair stand test, fewer than 11 movements for the 30-s arm curl test, fewer than 40 steps for the 2-min step test, or more than 9 s for the up and go test. With respect to all of these procedures, CoQ10 levels were higher in the population showing a score indicating low or no risk. This relationship was statistically significant in the case of the 30-s arm curl test, the 2 min step test, and the up and go test (Figure 4).
Furthermore, we also performed an analysis of the score in all the tests included in the SFT with respect to the mean of the levels of CoQ10 in plasma. We analyzed the score in the tests of people showing CoQ10 levels below the mean in comparison with people above the mean. This analysis indicated that, in general, people showing higher levels of CoQ10 in plasma score better in all the tests included in the SFT, although this relationship did not reach statistical significance except in the case of the 8 foot up and go test, in which people showing high CoQ10 levels were able to perform this test faster. Furthermore, sedentarism was also lower and near significant in the group showing higher CoQ10 levels (Figure 5).
With respect to the common activity performed by the participants during the week before the procedure (IPAQ), no correlation was found between the levels of CoQ10 in plasma and strong or moderate physical activity. However, we did find a moderate correlation between plasma CoQ10 levels and intense marching activity (Pearson’s r = 0.364, p = 0.031).

4. Discussion

Frailty is a key dysfunction in elderly people that severely affects the capacity of individuals to maintain their independence. Frailty is also associated with comorbidities occurring in aging that impair the health of elderly people [25]. In human skeletal muscle, aging is associated with the accumulation of mitochondrial DNA damage, which contributes to a reduced function of cells and organs. This is reflected in skeletal muscle by changes in the fiber type profile and in the number and size of the fibers in clear relationship with sarcopenia [26]. Other studies demonstrate that mitochondrial function is impaired in skeletal muscle of elderly people at pre-frail condition [27], and that a decrease in the activity of the mitochondrial respiratory chain is associated with lower physical performance and sarcopenia [28]. Moreover, mitochondrial dysfunction, oxidative stress, and DNA damage are associated with the decay in muscle capacity and sarcopenia [29]. It seems now clear that mitochondrial activity and turnover affects many aspects of muscle physiology associated with sarcopenia and the loss of capacity in older individuals [30].
It is known that levels of CoQ10 decrease in many tissues and organs during aging [31]. We can then also consider CoQ10 levels as a probable factor affecting frailty by accelerating sarcopenia by reducing the activity of mitochondria in muscle. In fact, in aged animals, the amount of CoQ in mitochondria is reduced in skeletal muscle, suggesting a direct relationship of this decrease with the mitochondrial dysfunction associated with aging [31].
Furthermore, indirect evidence indicates the importance of CoQ10 in the maintenance of physical activity in several diseases, many of them associated with aging [2]. In animal studies, CoQ10 supplementation improved plasma parameters associated with acute exercise such as lactate, ammonium and CK, and also increased liver and muscle glycogen content, improving exercise performance and reducing fatigue [32]. Additionally, animal studies have also shown a clear decrease of CoQ levels in muscle in aged individuals [33]. Supplementation with CoQ10 prevented mitochondrial dysfunction in muscle [34], indicating a clear role of CoQ10 in mitochondrial activity and probably in muscle capacity during aging.
In humans, patients suffering osteoarthritis and healthy elderly people showed a negative significant correlation between oxidative stress and muscle function [35]. In this study, plasma CoQ10 levels were positively associated with antioxidant capacity, muscle mass, strength and endurance in these patients, indicating a relationship with physical capacity. On the other hand, the amount of CoQ10 is frequently reduced in muscle of patients suffering mitochondrial myopathies, and supplementation has been suggested to improve motor function [36]. Furthermore, CoQ10 levels in plasma have been associated with the control of motor activity in multiple system atrophy patients. In these patients, lower CoQ10 levels in plasma are associated with higher severity of motor control dysfunction [37].
Our results agree with the relationship of plasma CoQ10 levels and pathological conditions. In agreement with cardiovascular studies such as Q-SYMBIO [38,39,40], we found that high CoQ10 levels are associated with lower cardiovascular disease risk. This reinforces the evidence indicating the thereapeutic use of CoQ10 in the prevention of cardiovascular diseases [41]. The relationship of high CoQ10 with higher physical activity is also related to better cardiovascular health [42], and heightens the importance of this compound in the function of the cardiovascular system and the protection of endothelial vasculature.
On the other hand, although muscle cannot incorporate plasma CoQ10 easily [43], vascular endothelium does incorporate this compound [44]. Therefore, we cannot discard a direct role of high plasma CoQ10 levels in the endothelial function of arteries feeding skeletal muscle [45]. High CoQ10 levels could maintain the mitochondrial activity of the vasculature, and by this mechanism improve muscle capacity. In fact, long-term CoQ10 supplementation in rats improves endothelial function in aged rats [46]. In humans, mitochondrial antioxidants such as CoQ10 improve endothelial function and the activity of antioxidant enzymes increasing exercise tolerance in patients with peripheral artery diseases [47]. These results suggest that the maintenance of high levels of plasma CoQ10 in active people contributes to the protection of the vascular endothelium against oxidative damage, preventing cardiovascular diseases such atherosclerosis by this mechanism.
Regarding physical performance, our results are in agreement with previous studies demonstrating a positive correlation between CoQ10/cholesterol levels and hand grip capacity in elderly people [48]. Furthermore, in the Fisher’s group study, low levels of the reduced form of CoQ10 were associated with lower muscle capacity, indicating that low levels of CoQ10 can be considered a plasma indicator of higher risk of sarcopenia [48]. Our results also indicate that high levels of plasma CoQ10 are associated with lower risk for suffering muscle dysfunction, reinforcing the relationship between plasma CoQ10 levels and muscle capacity.
Our previous studies also demonstrated that high physical activity is associated with higher CoQ10 levels in plasma and lower levels of lipid peroxidation, increasing antioxidant protection [12]. Furthermore, sedentarism and obesity are associated with lower CoQ10 levels [12], which can also aggravate the oxidative damage produced by higher resting and exercise-induced intramuscular free radical release in aged muscle [49]. Furthermore, we recently demonstrated that in professional soccer players, high CoQ10 levels are associated with low stress and damage markers and with higher performance during competition [50].
Animal studies have also demonstrated that supplementation with CoQ10 improves antioxidant capacity, especially in aged animals [51], reducing lipid peroxidation damage [52]. Furthermore, exercise can induce CoQ-dependent antioxidant activities in aged muscle, preventing oxidative damage [53]. This could be the reason the combination of moderate physical activity with CoQ10 supplementation counteracts mitochondrial dysfunction in the accelerated aging SAMP8 mouse model [54]. Accordingly, in humans, the combination of exercise with CoQ10 has been suggested to counteract sarcopenia in the elderly [55]. For this reason, CoQ10 supplementation has been be suggested to decrease many dysfunctions associated with aging and age-related diseases [9,56,57].
Some important aspects remain to be studied. The different behavior of the ratio CoQ10/cholesterol in men and women need further research to confirm this fact, at least in elderly people. On the other hand, it has recently been shown that older adults suffering physical frailty and sarcopenia show a release of small extracellular vesicles with mitochondrial signatures [58]. The presence of these vesicles is associated with the senescence secretory phenotype associated with aging [59]. To date, few articles have studied the role of CoQ10 in the evolution of this characteristic of aging, although none of them have been studied in muscle. Supplementation with CoQ10 reduces senescence phenotype in culture fibroblasts [60]. Interestingly, CoQ10 protects endothelial cells against inflammatory response and the secretory phenotype preventing the release of IL-6 [61], a known cytokine that affects muscle sarcopenia [62]. The effect of CoQ10 has been directly related with its antioxidant activity [63].
Our study shows correlations between CoQ10 levels in plasma and physical activity in elderly people. Obviously, its main limitation is the lack of correlation of CoQ10 levels in muscle with its capacity, but due to obvious ethical aspects, this determination cannot be performed. However, our results and many other studies suggest that high plasma CoQ10 levels could be associated with the maintenance of physical capacity in elderly people. It is probable that supplementation with CoQ10 could improve physical capacity in addition to the known effects in the cardiovascular system. These relationships suggest that CoQ10 could be considered an important component for maintaining independence and health in aged individuals.
Furthermore, due to the difference in the number of men and women that participated in this study, gender differences must be considered with caution. Nevertheless, previous studies by our group also found gender differences in plasma [12]. Our results suggest that gender may be an important factor in CoQ10 distribution in plasma, and studies must consider this fact in order to clarify whether these differences are relevant for aging and age-related diseases [64]. Interestingly, recent studies have also demonstrated a gender-dependent bioavailability in response to a single dose of CoQ10 supplementation. This aspect must also be considered in further studies [65].

5. Conclusions

It is clear that maintenance of active physical capacity during aging is essential for avoiding frailty [66]. Many studies support the positive effect of CoQ10 on physical activity. Combination of CoQ10 with physical activity could be an important therapy for avoiding sarcopenia and maintaining higher capacity during aging. Importantly, gender differences found in this study must be studied in depth in order to determine whether the effect of CoQ10 is stronger in women than in men and to design therapeutic strategies in accordance with these differences. Moreover, the relationship between CoQ10 and cholesterol found in elderly people will be a subject for future works in order to determine whether age is a factor in the correlation between cholesterol and CoQ10 in plasma. Furthermore, the association of physical activity in elderly people with high CoQ10 levels could not only improve endothelial capacity, but also reduce the release of vesicles and factors involved in inflammation and the senescence phenotype. Further studies are needed to determine whether CoQ10 can also reduce this phenotype in muscle, since in the case of positive relationship CoQ10 could be considered a senolitic compound for muscle.

Author Contributions

Conceptualization, C.F.-P., D.A., J.G.A. and G.L.-L.; methodology, R.d.l.B.-G. and C.F.-P.; validation, C.F.-P. and G.L.-L.; formal analysis, D.A. and J.G.A.; investigation, all the authors; writing—original draft preparation, all the authors; writing—review and editing, all the authors. All authors have read and agreed to the published version of the manuscript.

Funding

This work was supported by the Operative Program FEDER Andalucía 2014–2020 grant UPO-1259581.

Institutional Review Board Statement

The study was conducted according to the guidelines of the Declaration of Helsinki, and approved by Ethics Committee of the Andalusian Autonomy (protocol code 2355-N-19 final version approved, April 2020).

Informed Consent Statement

Informed consent was obtained from all subjects involved in the study.

Data Availability Statement

All of the data is contained within the article.

Acknowledgments

We want to acknowledge the help of Ana María Gallardo Flores and Ana Sánchez Cuesta for her technical assistance.

Conflicts of Interest

The authors declare no conflict of interest or state.

References

  1. López-Lluch, G.; Lluch, L. The Important Role of CoQ10 in Aging. Antioxidants 2019, 8, 570. [Google Scholar] [CrossRef] [PubMed] [Green Version]
  2. López-Lluch, G.; Rodríguez-Aguilera, J.C.; Santos-Ocaña, C.; Navas, P. Is coenzyme Q a key factor in aging? Mech. Ageing Dev. 2010, 131, 225–235. [Google Scholar] [CrossRef] [PubMed]
  3. Barroso, M.P.; Gómez-Díaz, C.; Villalba, J.M.; Burón, M.I.; López-Lluch, G.; Navas, P. Plasma Membrane Ubiquinone Controls Ceramide Production and Prevents Cell Death Induced by Serum Withdrawal. J. Bioenerg. Biomembr. 1997, 29, 259–267. [Google Scholar] [CrossRef] [PubMed]
  4. Crane, F.L.; Navas, P. The diversity of coenzyme Q function. Mol. Asp. Med. 1997, 18, 1–6. [Google Scholar] [CrossRef]
  5. López-Lluch, G.; Barroso, M.P.; Martín, S.F.; Fernández-Ayala, D.J.M.; Gómez-Díaz, C.; Villalba, J.M.; Navas, P. Role of plasma membrane coenzyme Q on the regulation of apoptosis. BioFactors 1999, 9, 171–177. [Google Scholar] [CrossRef]
  6. Villalba, J.; Navarro, F.; Gómez-Díaz, C.; Arroyo, A.; Bello, R.; Navas, P. Role of cytochrome b5 reductase on the antioxidant function of coenzyme Q in the plasma membrane. Mol. Asp. Med. 1997, 18, 7–13. [Google Scholar] [CrossRef]
  7. Yubero-Serrano, E.M.; Delgado-Casado, N.; Gomez-Delgado, F.; Perez-Martinez, P.; Tasset-Cuevas, I.; Santos-Gonzalez, M.; Caballero-Villarraso, J.; Garcia-Rios, A.; Marín, C.; Gutierrez-Mariscal, F.M.; et al. Postprandial antioxidant effect of the Mediterranean diet supplemented with coenzyme Q10 in elderly men and women. Age 2010, 33, 579–590. [Google Scholar] [CrossRef] [Green Version]
  8. De Barcelos, I.P.; Haas, R.H. CoQ10 and Aging. Biology 2019, 8, 28. [Google Scholar] [CrossRef] [PubMed] [Green Version]
  9. Hernández-Camacho, J.D.; García-Corzo, L.; Fernández-Ayala, D.J.M.; Navas, P.; López-Lluch, G. Coenzyme Q at the Hinge of Health and Metabolic Diseases. Antioxidants 2021, 10, 1785. [Google Scholar] [CrossRef]
  10. Santos-Ocaña, C.; Cascajo, M.V.; Alcázar-Fabra, M.; Staiano, C.; López-Lluch, G.; Brea-Calvo, G.; Navas, P. Cellular Models for Primary CoQ Deficiency Pathogenesis Study. Int. J. Mol. Sci. 2021, 22, 10211. [Google Scholar] [CrossRef]
  11. del Pozo-Cruz, J.; Rodríguez-Bies, E.; Ballesteros-Simarro, M.; Navas-Enamorado, I.; Tung, B.T.; Navas, P.; López-Lluch, G. Physical activity affects plasma coenzyme Q10 levels differently in young and old humans. Biogerontology 2014, 15, 199–211. [Google Scholar] [CrossRef] [PubMed]
  12. del Pozo-Cruz, J.; Rodríguez-Bies, E.; Navas-Enamorado, I.; Cruz, B.D.P.; Navas, P.; López-Lluch, G. Relationship between functional capacity and body mass index with plasma coenzyme Q10 and oxidative damage in community-dwelling elderly-people. Exp. Gerontol. 2014, 52, 46–54. [Google Scholar] [CrossRef] [PubMed]
  13. Niklowitz, P.; Scherer, J.; Döring, F.; Paulussen, M.; Menke, T. Oxidized proportion of muscle coenzyme Q10 increases with age in healthy children. Pediatr. Res. 2015, 78, 365–370. [Google Scholar] [CrossRef]
  14. Vásquez-Alvarez, S.; Bustamante-Villagomez, S.K.; Vazquez-Marroquin, G.; Porchia, L.M.; Pérez-Fuentes, R.; Torres-Rasgado, E.; Herrera-Fomperosa, O.; Montes-Arana, I.; Gonzalez-Mejia, M.E. Metabolic Age, an Index Based on Basal Metabolic Rate, Can Predict Individuals That are High Risk of Developing Metabolic Syndrome. High Blood Press. Cardiovasc. Prev. 2021, 28, 263–270. [Google Scholar] [CrossRef] [PubMed]
  15. Daďová, K.; Petr, M.; Šteffl, M.; Sontáková, L.; Chlumský, M.; Matouš, M.; Štich, V.; Štěpán, M.; Šiklová, M. Effect of Calanus Oil Supplementation and 16 Week Exercise Program on Selected Fitness Parameters in Older Women. Nutrients 2020, 12, 481. [Google Scholar] [CrossRef] [Green Version]
  16. Rikli, R.E.; Jones, C.J. Senior Fitness Test Manual; Human Kinetics: Champaign, IL, USA, 2001. [Google Scholar]
  17. Bohannon, R.W.; Crouch, R.H. Two-Minute Step Test of Exercise Capacity: Systematic Review of Procedures, Performance, and Clinimetric Properties. J. Geriatr. Phys. Ther. 2019, 42, 105–112. [Google Scholar] [CrossRef]
  18. Schoene, D.; Wu, S.M.-S.; Mikolaizak, A.S.; Menant, J.C.; Smith, S.; Delbaere, K.; Lord, S.R. Discriminative Ability and Predictive Validity of the Timed Up and Go Test in Identifying Older People Who Fall: Systematic Review and Meta-Analysis. J. Am. Geriatr. Soc. 2013, 61, 202–208. [Google Scholar] [CrossRef]
  19. Craig, C.L.; Marshall, A.L.; Sjöström, M.; Bauman, A.E.; Booth, M.L.; Ainsworth, B.E.; Pratt, M.; Ekelund, U.; Yngve, A.; Sallis, J.F.; et al. International Physical Activity Questionnaire: 12-Country Reliability and Validity. Med. Sci. Sports Exerc. 2003, 35, 1381–1395. [Google Scholar] [CrossRef] [Green Version]
  20. Rodríguez-Aguilera, J.C.; Cortés, A.B.; Fernández-Ayala, D.J.M.; Navas, P. Biochemical Assessment of Coenzyme Q10 Deficiency. J. Clin. Med. 2017, 6, 27. [Google Scholar] [CrossRef] [Green Version]
  21. Friedewald, W.T.; Levy, R.I.; Fredrickson, D.S. Estimation of the Concentration of Low-Density Lipoprotein Cholesterol in Plasma, Without Use of the Preparative Ultracentrifuge. Clin. Chem. 1972, 18, 499–502. [Google Scholar] [CrossRef]
  22. Cohen, J. Statistical Power Analysis for the Behavioral Sciences; Lawrence Erlbaum Associates: Hillsdale, NJ, USA, 1988. [Google Scholar]
  23. Lu, W.; Resnick, H.E.; Jablonski, K.A.; Jones, K.L.; Jain, A.K.; Howard, W.J.; Robbins, D.C.; Howard, B.V. Non-HDL Cholesterol as a Predictor of Cardiovascular Disease in Type 2 Diabetes. Diabetes Care 2003, 26, 16–23. [Google Scholar] [CrossRef] [PubMed] [Green Version]
  24. Rikli, R.E.; Jones, C.J. Development and Validation of Criterion-Referenced Clinically Relevant Fitness Standards for Maintaining Physical Independence in Later Years. Gerontologist 2013, 53, 255–267. [Google Scholar] [CrossRef] [PubMed]
  25. Hanlon, P.; Nicholl, B.I.; Jani, B.D.; Lee, D.; McQueenie, R.; Mair, F.S. Frailty and pre-frailty in middle-aged and older adults and its association with multimorbidity and mortality: A prospective analysis of 493 737 UK Biobank participants. Lancet Public Health 2018, 3, e323–e332. [Google Scholar] [CrossRef]
  26. Linnane, A.W.; Zhang, C.; Yarovaya, N.; Kopsidas, G.; Kovalenko, S.; Papakostopoulos, P.; Eastwood, H.; Graves, S.; Richardson, M. Human aging and global function of coenzyme Q10. Ann. N. Y. Acad. Sci. 2002, 959, 396–411. [Google Scholar] [CrossRef] [PubMed]
  27. Andreux, P.A.; Van Diemen, M.P.J.; Heezen, M.R.; Auwerx, J.; Rinsch, C.; Groeneveld, G.J.; Singh, A. Mitochondrial function is impaired in the skeletal muscle of pre-frail elderly. Sci. Rep. 2018, 8, 8548. [Google Scholar] [CrossRef] [PubMed]
  28. Rygiel, K.A.; Dodds, R.M.; Patel, H.P.; Syddall, H.E.; Westbury, L.D.; Granic, A.; Cooper, C.; Cliff, J.; Rocha, M.; Turnbull, D.M.; et al. Mitochondrial respiratory chain deficiency in older men and its relationship with muscle mass and performance. JCSM Clin. Rep. 2017, 2, 1–10. [Google Scholar] [CrossRef] [Green Version]
  29. Pilotto, A.; Custodero, C.; Maggi, S.; Polidori, M.C.; Veronese, N.; Ferrucci, L. A multidimensional approach to frailty in older people. Ageing Res. Rev. 2020, 60, 101047. [Google Scholar] [CrossRef]
  30. Romanello, V. The Interplay between Mitochondrial Morphology and Myomitokines in Aging Sarcopenia. Int. J. Mol. Sci. 2020, 22, 91. [Google Scholar] [CrossRef]
  31. Lass, A.; Kwong, L.; Sohal, P.R.S. Mitochondrial coenzyme Q content and aging. BioFactors 1999, 9, 199–205. [Google Scholar] [CrossRef]
  32. Chen, H.-C.; Huang, C.-C.; Lin, T.-J.; Hsu, M.-C.; Hsu, Y.-J. Ubiquinol Supplementation Alters Exercise Induced Fatigue by Increasing Lipid Utilization in Mice. Nutrients 2019, 11, 2550. [Google Scholar] [CrossRef] [Green Version]
  33. Beyer, R.E.; Burnett, B.-A.; Cartwright, K.J.; Edington, D.W.; Falzon, M.J.; Kreitman, K.R.; Kuhn, T.W.; Ramp, B.J.; Rhee, S.Y.S.; Rosenwasser, M.J.; et al. Tissue coenzyme Q (ubiquinone) and protein concentrations over the life span of the laboratory rat. Mech. Ageing Dev. 1985, 32, 267–281. [Google Scholar] [CrossRef] [Green Version]
  34. Sugiyama, S.; Yamada, K.; Ozawa, T. Preservation of mitochondrial respiratory function by coenzyme Q10 in aged rat skeletal muscle. Biochem. Mol. Biol. Int. 1995, 37, 1111–1120. [Google Scholar] [PubMed]
  35. Chang, P.-S.; Yen, C.-H.; Huang, Y.-Y.; Chiu, C.-J.; Lin, P.-T. Associations between Coenzyme Q10 Status, Oxidative Stress, and Muscle Strength and Endurance in Patients with Osteoarthritis. Antioxidants 2020, 9, 1275. [Google Scholar] [CrossRef] [PubMed]
  36. Trevisson, E.; DiMauro, S.; Navas, P.; Salviati, L. Coenzyme Q deficiency in muscle. Curr. Opin. Neurol. 2011, 24, 449–456. [Google Scholar] [CrossRef] [PubMed]
  37. Du, J.; Wang, T.; Huang, P.; Cui, S.; Gao, C.; Lin, Y.; Fu, R.; Shen, J.; He, Y.; Tan, Y.; et al. Clinical correlates of decreased plasma coenzyme Q10 levels in patients with multiple system atrophy. Park. Relat. Disord. 2018, 57, 58–62. [Google Scholar] [CrossRef] [PubMed]
  38. Mortensen, A.L.; Rosenfeldt, F.; Filipiak, K.J. Effect of coenzyme Q10 in Europeans with chronic heart failure: A sub-group analysis of the Q-SYMBIO randomized double-blind trial. Cardiol. J. 2013, 26, 147–156. [Google Scholar] [CrossRef] [PubMed] [Green Version]
  39. Mortensen, S.A.; Rosenfeldt, F.; Kumar, A.; Dolliner, P.; Filipiak, K.J.; Pella, D.; Alehagen, U.; Steurer, G.; Littarru, G.P. The Effect of Coenzyme Q 10 on Morbidity and Mortality in Chronic Heart Failure. JACC Hear. Fail. 2014, 2, 641–649. [Google Scholar] [CrossRef]
  40. Raizner, A.E.; Quiñones, M.A. Coenzyme Q10 for Patients With Cardiovascular Disease. J. Am. Coll. Cardiol. 2021, 77, 609–619. [Google Scholar] [CrossRef] [PubMed]
  41. Martelli, A.; Testai, L.; Colletti, A.; Cicero, A.F.G. Coenzyme Q10: Clinical Applications in Cardiovascular Diseases. Antioxidants 2020, 9, 341. [Google Scholar] [CrossRef] [Green Version]
  42. Nilsson, M.I.; Tarnopolsky, M.A. Mitochondria and Aging—The Role of Exercise as a Countermeasure. Biology 2019, 8, 40. [Google Scholar] [CrossRef] [Green Version]
  43. Turunen, M.; Olsson, J.; Dallner, G. Metabolism and function of coenzyme Q. Biochim. Biophys. Acta (BBA)-Biomembr. 2004, 1660, 171–199. [Google Scholar] [CrossRef] [PubMed] [Green Version]
  44. Sabbatinelli, J.; Orlando, P.; Galeazzi, R.; Silvestri, S.; Cirilli, I.; Marcheggiani, F.; Dludla, P.V.; Giuliani, A.; Bonfigli, A.R.; Mazzanti, L.; et al. Ubiquinol Ameliorates Endothelial Dysfunction in Subjects with Mild-to-Moderate Dyslipidemia: A Randomized Clinical Trial. Nutrients 2020, 12, 1098. [Google Scholar] [CrossRef] [PubMed] [Green Version]
  45. Park, S.-Y.; Kwon, O.S.; Andtbacka, R.H.I.; Hyngstrom, J.R.; Reese, V.; Murphy, M.P.; Richardson, R.S. Age-related endothelial dysfunction in human skeletal muscle feed arteries: The role of free radicals derived from mitochondria in the vasculature. Acta Physiol. 2018, 222, e12893. [Google Scholar] [CrossRef] [PubMed] [Green Version]
  46. Lönnrot, K.; Pörsti, I.; Alho, H.; Wu, X.; Hervonen, A.; Tolvanen, J.-P. Control of arterial tone after long-term coenzyme Q10supplementation in senescent rats. J. Cereb. Blood Flow Metab. 1998, 124, 1500–1506. [Google Scholar] [CrossRef] [PubMed] [Green Version]
  47. Park, S.-Y.; Pekas, E.J.; Headid, R.J., 3rd; Son, W.-M.; Wooden, T.K.; Song, J.; Layec, G.; Yadav, S.K.; Mishra, P.K.; Pipinos, I.I. Acute mitochondrial antioxidant intake improves endothelial function, antioxidant enzyme activity, and exercise tolerance in patients with peripheral artery disease. Am. J. Physiol. Heart Circ. Physiol. 2020, 319, H456–H467. [Google Scholar] [CrossRef] [PubMed]
  48. Fischer, A.; Onur, S.; Niklowitz, P.; Menke, T.; Laudes, M.; Rimbach, G.; Döring, F. Coenzyme Q10 Status as a Determinant of Muscular Strength in Two Independent Cohorts. PLoS ONE 2016, 11, e0167124. [Google Scholar] [CrossRef] [PubMed]
  49. Bailey, D.M.; McEneny, J.; Mathieu-Costello, O.; Henry, R.R.; James, P.E.; Mccord, J.M.; Pietri, S.; Young, I.S.; Richardson, R.S. Sedentary aging increases resting and exercise-induced intramuscular free radical formation. J. Appl. Physiol. 2010, 109, 449–456. [Google Scholar] [CrossRef] [Green Version]
  50. Sánchez-Cuesta, A.; Cortés-Rodríguez, A.B.; Navas-Enamorado, I.; Lekue, J.A.; Viar, T.; Axpe, M.; Navas, P.; López-Lluch, G. High coenzyme Q10 plasma levels improve stress and damage markers in professional soccer players during competition. Int. J. Vitam. Nutr. Res. 2020, 1–12. [Google Scholar] [CrossRef]
  51. Belviranlı, M.; Okudan, N. Effect of Coenzyme Q10 Alone and in Combination with Exercise Training on Oxidative Stress Biomarkers in Rats. Int. J. Vitam. Nutr. Res. 2018, 88, 126–136. [Google Scholar] [CrossRef]
  52. Ochoa, J.J.; Quiles, J.L.; Frias, M.L.; Huertas, J.R.; Mataix, J. Effect of Lifelong Coenzyme Q10 Supplementation on Age-Related Oxidative Stress and Mitochondrial Function in Liver and Skeletal Muscle of Rats Fed on a Polyunsaturated Fatty Acid (PUFA)-Rich Diet. J. Gerontol. Ser. A 2007, 62, 1211–1218. [Google Scholar] [CrossRef] [Green Version]
  53. Rodríguez-Bies, E.; Navas, P.; López-Lluch, G. Age-Dependent Effect of Every-Other-Day Feeding and Aerobic Exercise in Ubiquinone Levels and Related Antioxidant Activities in Mice Muscle. J. Gerontol. Ser. A 2015, 70, 33–43. [Google Scholar] [CrossRef] [PubMed] [Green Version]
  54. Andreani, C.; Bartolacci, C.; Guescini, M.; Battistelli, M.; Stocchi, V.; Orlando, F.; Provinciali, M.; Amici, A.; Marchini, C.; Tiano, L.; et al. Combination of Coenzyme Q10 Intake and Moderate Physical Activity Counteracts Mitochondrial Dysfunctions in a SAMP8 Mouse Model. Oxidative Med. Cell. Longev. 2018, 2018, 8936251. [Google Scholar] [CrossRef] [PubMed] [Green Version]
  55. Guescini, M.; Tiano, L.; Genova, M.L.; Polidori, E.; Silvestri, S.; Orlando, P.; Fimognari, C.; Calcabrini, C.; Stocchi, V.; Sestili, P. The Combination of Physical Exercise with Muscle-Directed Antioxidants to Counteract Sarcopenia: A Biomedical Rationale for Pleiotropic Treatment with Creatine and Coenzyme Q10. Oxidative Med. Cell. Longev. 2017, 2017, 7083049. [Google Scholar] [CrossRef] [PubMed] [Green Version]
  56. Aaseth, J.; Alexander, J.; Alehagen, U. Coenzyme Q10 supplementation—In ageing and disease. Mech. Ageing Dev. 2021, 197, 111521. [Google Scholar] [CrossRef] [PubMed]
  57. López-Lluch, G. Coenzyme Q homeostasis in aging: Response to non-genetic interventions. Free Radic. Biol. Med. 2021, 164, 285–302. [Google Scholar] [CrossRef] [PubMed]
  58. Picca, A.; Beli, R.; Calvani, R.; Coelho-Júnior, H.J.; Landi, F.; Bernabei, R.; Bucci, C.; Guerra, F.; Marzetti, E. Older Adults with Physical Frailty and Sarcopenia Show Increased Levels of Circulating Small Extracellular Vesicles with a Specific Mitochondrial Signature. Cells 2020, 9, 973. [Google Scholar] [CrossRef] [Green Version]
  59. Habiballa, L.; Salmonowicz, H.; Passos, J.F. Mitochondria and cellular senescence: Implications for musculoskeletal ageing. Free Radic. Biol. Med. 2019, 132, 3–10. [Google Scholar] [CrossRef]
  60. Marcheggiani, F.; Kordes, S.; Cirilli, I.; Orlando, P.; Silvestri, S.; Vogelsang, A.; Möller, N.; Blatt, T.; Weise, J.M.; Damiani, E.; et al. Anti-ageing effects of ubiquinone and ubiquinol in a senescence model of human dermal fibroblasts. Free Radic. Biol. Med. 2021, 165, 282–288. [Google Scholar] [CrossRef]
  61. Olivieri, F.; Lazzarini, R.; Babini, L.; Prattichizzo, F.; Rippo, M.R.; Tiano, L.; Di Nuzzo, S.; Graciotti, L.; Festa, R.; Brugè, F.; et al. Anti-inflammatory effect of ubiquinol-10 on young and senescent endothelial cells via miR-146a modulation. Free Radic. Biol. Med. 2013, 63, 410–420. [Google Scholar] [CrossRef]
  62. Rong, Y.-D.; Bian, A.-L.; Hu, H.-Y.; Ma, Y.; Zhou, X.-Z. Study on relationship between elderly sarcopenia and inflammatory cytokine IL-6, anti-inflammatory cytokine IL-10. BMC Geriatr. 2018, 18, 308. [Google Scholar] [CrossRef] [Green Version]
  63. Huo, J.; Xu, Z.; Hosoe, K.; Kubo, H.; Miyahara, H.; Dai, J.; Mori, M.; Sawashita, J.; Higuchi, K. Coenzyme Q10 Prevents Senescence and Dysfunction Caused by Oxidative Stress in Vascular Endothelial Cells. Oxidative Med. Cell. Longev. 2018, 2018, 3181759. [Google Scholar] [CrossRef] [PubMed]
  64. Hargreaves, I.; Heaton, R.A.; Mantle, D. Disorders of Human Coenzyme Q10 Metabolism: An Overview. Int. J. Mol. Sci. 2020, 21, 6695. [Google Scholar] [CrossRef] [PubMed]
  65. Beaulieu, S.; Vachon, A.; Plourde, M. Women have higher levels of CoQ10 than men when supplemented with a single dose of CoQ10 with monoglycerides omega-3 or rice oil and followed for 48 h: A crossover randomised triple blind controlled study. J. Nutr. Sci. 2022, 1, 1–9. [Google Scholar] [CrossRef]
  66. Brivio, P.; Paladini, M.S.; Racagni, G.; Riva, M.A.; Calabrese, F.; Molteni, R. From Healthy Aging to Frailty: In Search of the Underlying Mechanisms. Curr. Med. Chem. 2019, 26, 3685–3701. [Google Scholar] [CrossRef] [PubMed]
Figure 1. Flow chart of the study selection.
Antioxidants 11 00279 g001
Figure 2. Correlation among plasma CoQ10 levels (μM) and total cholesterol, HDL cholesterol and non-HDL cholesterol in plasma. Pearson’s r correlation (r) and statistical significance are indicated.
Antioxidants 11 00279 g002
Figure 3. Blood plasma CoQ10 levels (μM) in the participants in relationship with their respective cardiovascular risk determined by a total cholesterol/HDL quotient higher than 4 (risk) or lower than or equal to 4 (no risk). Data represent the mean ± SD of the whole population (n = 64), men (n = 17) and women (n = 47).
Antioxidants 11 00279 g003
Figure 4. Relationship of blood plasma CoQ10 levels with frailty risk. Blood plasma CoQ10 levels (μM) are related to frailty risk, based on the four tests included in the SFT, which showed a direct relationship with CoQ10 levels. Data represent the mean ± SD of the whole population (n = 64).
Antioxidants 11 00279 g004
Figure 5. Score of the different test of the SFT depending on the levels of CoQ10 in plasma. Mean CoQ10 levels were designated as 0.8 μM, and the scores of the participants grouped depending on whether their CoQ10 levels in plasma were above or below this mean. Data represent the mean ± SD of the whole population (n = 64).
Antioxidants 11 00279 g005
Table 1. Age, social and clinical characteristics of the participants in the study.
ParameterTotal Population (n = 64)MEN (n = 17)WOMEN (n = 47)
Mean ± SDMean ± SDMean ± SD
Age
  From 65 to 7532 (50.0%)11 (64.7%)21 (44.68%)
  More than 7632 (50.0%)6 (35.3%)26 (55.32%)
Pharmacological treatments
59 (92.2%)16 (94.1%)43 (91.5%)
  Hypertension30 (46.9%)10 (58.8%)20 (42.6%)
  Diabetes8 (12.5%)5 (29.4%)3 (6.4%)
  Others47 (73.4%)11 (64.7%)35 (74.5%)
Smoking habits
  Never38 (59.3%)1 (5.9%)37 (78.7%)
  Before20 (31.3%)10 (58.8%)10 (21.3%)
  During study6 (9.4%)6 (35.3%)0 (0.0%)
Drinking habits
  Never19 (29.7%) 0 (0.0%)19 (40.4%)
  Before13 (20.31%)9 (52.9%)4 (2.5%)
  During study32 (50.0%)8 (47.1%)24 (51.1%)
Table 2. Characteristics of the participants in the study.
ParameterTotal Population (n = 64)MEN (n = 17)WOMEN (n = 47)Significance
Mean ± SDRangeMean ± SDRangeMean ± SDRangep
Age (y)77.0 ± 8.065–9973.4 ± 6.365–8478.3 ± 8.266–900.0381 *
Metabolic age (y)76.5 ± 11.048–9076.4 ± 13.148–9076.5 ± 10.255–900.9803
DIA (y)0.5 ± 12.6−20–30−3 ± 16.1−20–301.8 ± 11.0−15–150.1847
BP Systolic134 ± 1789–167134 ± 1789–164134 ± 17.694–1670.9617
BP Diastolic72.9± 9.648–9370.4 ± 10.648–9374.8± 12.452–1320.1976
Height (cm)154.1 ± 7.4138–173160.6 ± 5.6149–173151.8 ± 6.6138–167<0.0001 *
Weigth (kg)70.6 ± 8.649.2–90.774.2 ± 7.960.0–88.469.2 ± 8.649.2–90.70.0426 *
BMI29.8 ± 3.922.6–40.828.7 ± 3.123.4–35.530.2 ± 4.519.9–40.90.2277
Fat (%)40.4 ± 7.821.7–61.732.5 ± 5.421.7–40.143.3 ± 6.424.1–61.7<0.0001 *
Muscle (kg)39.7 ± 6.625–6147.4 ± 5.538.4–6136.9 ± 4.525–49.6<0.0001 *
Visceral fat (kg)14.7 ± 4.07–30.418.8 ± 4.212–30.413.2 ± 2.37–19<0.0001 *
Data represent the mean ± SD of each parameter and the range in the population. DIA = Difference in age; BP: Blood Pressure; BMI: Body Mass Index. * Significant differences between gender are indicated for each parameter, SD: standard deviation.
Table 3. Blood plasma biochemical parameters of the participants in this study.
ParameterTotal Population (n = 64)MEN (n = 17)WOMEN (n = 47)Significance
Mean ± SDRangeMean ± SDRangeMean ± SDRangep
Total CoQ10 (μM)0.818 ± 0.2380.306–1.4160.862 ± 0.2470.378–1.4160.806 ± 0.2360.306–1.2690.3859
Chol (mg/dL)196.1 ± 42.999–296197.0 ± 45.1115–271195.8 ± 42.699–2960.9214
HDL-chol (mg/dL)48.0 ± 12.318.6–75.344.8 ± 10.729–70.649.1 ± 12.818.6–75.30.2166
LDL-chol (mg/dL)128 ± 4251–215132 ± 4658.1–205126.5 ± 40.951–2150.6451
VLDL-chol (mg/dL)20.2 ± 6.714–4120.2 ± 6.914–3620.2 ± 6.614–410.9931
Non-HDL-chol (mg/dL)148 ± 42.271.1–236152 ± 45.474.7–227.3146 ± 41.471.1–2350.6458
Chol/HDL-chol4.3 ± 1.32.3–7.94.6 ± 1.32.3–6.64.2 ± 1.32.3–7.90.3239
TGs (mg/dL)100.8 ± 33.369.9–205100.9 ± 34.669.9–180100.8 ± 33.269.9–2050.9917
CoQ10/Chol (nmol/mmol)163.2 ± 44.585.6–316.3172.7 ± 50.3114–264159.8 ± 42.285.6–3160.3059
CoQ10/HDL-chol (nmol/mmol/705 ± 303273–1746791 ± 346363–1746674 ± 284273–16840.1744
CoQ10/LDL-chol (nmol/mmol)265 ± 92.6127–538275 ± 105158–538261 ± 88.5127–5380.5821
CoQ10/VLDL-chol (nmol/mmol)1690 ± 638596–32191773 ± 644881–29901661 ± 640596–32190.5383
CoQ10/non-HDL-chol (nmol/mmol)222 ± 67.4113.8–398.7231 ± 75.4145–399219 ± 64.8114–3900.5436
oxLDL (U/L)75.6 ± 17.134.6–10577.8 ± 19.534.6–10975.5 ± 16.446.4–1050.6316
CK (U/L)69.8 ± 36.824.3–226.086.0 ± 49.624.3–226.064.0 ± 29.424.3–1590.0335 *
GGT (U/L)18.1 ± 23.40.49–14429.1 ± 36.10.5–14413.8 ± 15.10.5–82.40.0196 *
GOT (U/L)21.2 ± 6.55–37.418.0 ± 6.75–29.222.4 ± 6.012–37.40.0153 *
GPT (U/L)15.1 ± 5.16.5–32.816.7 ± 5.66.5–25.214.5 ± 4.87.5–32.80.122
BILIRRUBIN (mg/dL)0.76 ± 0.190.49–1.280.72 ± 0.200.49–1.280.78 ± 0.190.5–1.30.3505
CREATININE (mg/dL)1.16 ± 0.280.63–2.181.28 ± 0.430.49–2.181.09 ± 0.220.49–1.860.0302 *
URIC ACID (mg/dL)5.75 ± 1.751.99–10.16.25 ± 1.793.23–9.705.57 ± 1.711.99–10.10.1719
UREA (mg/dL35.5 ± 14.219–87.534.1 ± 15.719–76.536.0 ± 13.719–87.50.6314
GLUCOSE (mg/dL)113.6 ± 34.838.5–218123.2 ± 46.148.9–218110.2 ± 29.538.5–2050.189
Data represent the mean ± SD for each parameter. * Significant differences between genders are indicated. Chol: cholesterol; HDL-chol: high density lipoprotein-cholesterol; LDL-chol: low density lipoprotein-cholesterol; VLDL-chol: very low density lipoprotein-cholesterol, TG: triglycerides; oxLDL:oxidated LDL; CK: creatine kinase; GPT: glutamate-pyruvate transaminase or alanine transaminase; GGT: gamma-glutamyl transferase; GOT: glutamyl oxaloacetic transaminase or aspartate transaminase.
Table 4. Correlation between CoQ10 levels and blood plasma biochemical parameters.
ParameterTotal Population (n = 64)MEN (n = 17)WOMEN (n = 47)
Pearson rpPearson rpPearson rp
Chol (mg/dL)0.56<0.00010.3720.14190.635<0.0001
HDL-chol (mg/dL)0.1180.3549−0.090.73030.2080.1613
LDL-chol (mg/dL)0.509<0.00010.3470.1720.571<0.0001
VLDL.chol (mg/dL)0.1720.17250.2530.32660.1560.2942
Non-HDL-chol (mg/dL)0.535<0.00010.390.12150.589<0.0001
TC/HDL-chol0.328<0.00800.4660.05930.2650.0719
oxLDL (U/L)0.0730.5642−0.0050.9856−0.0010.9953
TGs (mg/dL)0.1820.14950.2530.32660.1570.2934
CK (U/L)−0.0090.94440.0000.9995−0.0660.6586
GGT (U/L)−0.0060.96340.0010.9693−0.0890.5517
GOT (U/L)0.180.1540.3310.19370.180.154
GPT (U/L)0.1280.31310.1100.67380.1090.4662
BILIRRUBIN (mg/dL)−0.0090.9444−0.0650.80450.1580.2876
CREATININE (mg/dL)−0.0130.3130.1640.5295−0.0950.5259
URIC ACID (mg/dL)−0.0580.64660.0310.9057−0.1210.4172
UREA (mg/Dl0.0850.5050.3970.115−0.0350.8153
GLUCOSE (mg/dL)−0.1430.2589−0.1990.4433−0.150.3143
Chol: cholesterol; HDL-chol: high density lipoprotein-cholesterol; LDL-chol: low density lipoprotein-cholesterol; VLDL-chol: very low density lipoprotein-cholesterol, TG: triglycerides; oxLDL: oxidated LDL; CK: creatine kinase; GPT: glutamate-pyruvate transaminase or alanine transaminase; GGT: gamma-glutamyl transferase; GOT: glutamyl oxaloacetic transaminase or aspartate transaminase.
Table 5. Physical activity parameters.
ParameterTotal Population (n = 64)MEN (n = 17)WOMEN (n = 47)Significance
Mean ± SDRangeMean ± SDRangeMean ± SDRangep
METS/week1374 ± 874180–38792129 ± 857918–38791103 ± 714180–3252<0.0001 *
30 s CHAIR STAND (times)9.67 ± 3.722–2010.57 ± 3.784–159.39 ± 3.702–200.3033
30 s ARM CURL (times)8.34 ± 3.512–198.47 ± 3.204–158.30 ± 3.652–190.8636
2 MIN STEP TEST (steps)41.2 ± 20.94–8848.0 ± 27.04–8839.0 ± 18.34–790.1492
CHAIR SIT-AND-REACH (cm)−4.48 ± 6.89−14.2–5.5−3.70 ± 5.09−12.2–3.9−4.68 ± 4.87−14.2–5.50.5403
BACK SCRATCH (cm)−4.43 ± 5.96−25.6–2.4−2.85 ± 4.31−13–1.8−4.82 ± 6.31−25.6–2.40.2806
UP AND GO (s)10.9 ± 5.44.5–24.910.3 ± 5.75.2–22.511.2 ± 5.34.5–24.90.5796
SITTING TIME (h)6.22 ± 2.173–135.35 ± 1.843–106.54 ± 2.223–130.0529
Data represent the mean ± SD for each parameter. * Significant differences between genders are indicated.
Table 6. Correlation between blood plasma CoQ10 and scores in the SFT.
ParameterTotal Population (n = 64)MEN (n = 17)WOMEN (n = 47)
Pearson rpPearson rpPearson rp
METS/week0.1480.29020.5230.0551−0.0230.8883
30 s CHAIR STAND (times)0.3720.00410.1910.51380.3440.02
30 s ARM CURL (times)0.450.00020.3440.17660.4280.0027
2 MIN STEP TEST (steps)0.4730.00010.4160.12330.4510.0019
CHAIR SIT-AND-REACH (cm)0.2140.114−0.0790.80870.3250.0314
BACK SCRATCH (cm)0.1280.33340.16280.57820.1580.2929
UP AND GO (s)−0.513<0.0001−0.3630.1838−0.5140.0004
SITTING TIME (h)−0.4050.001−0.1570.5473−0.3990.006
Publisher’s Note: MDPI stays neutral with regard to jurisdictional claims in published maps and institutional affiliations.

