
Loss of KEAP1 Causes an Accumulation of Nondegradative Organelles

 , , , and
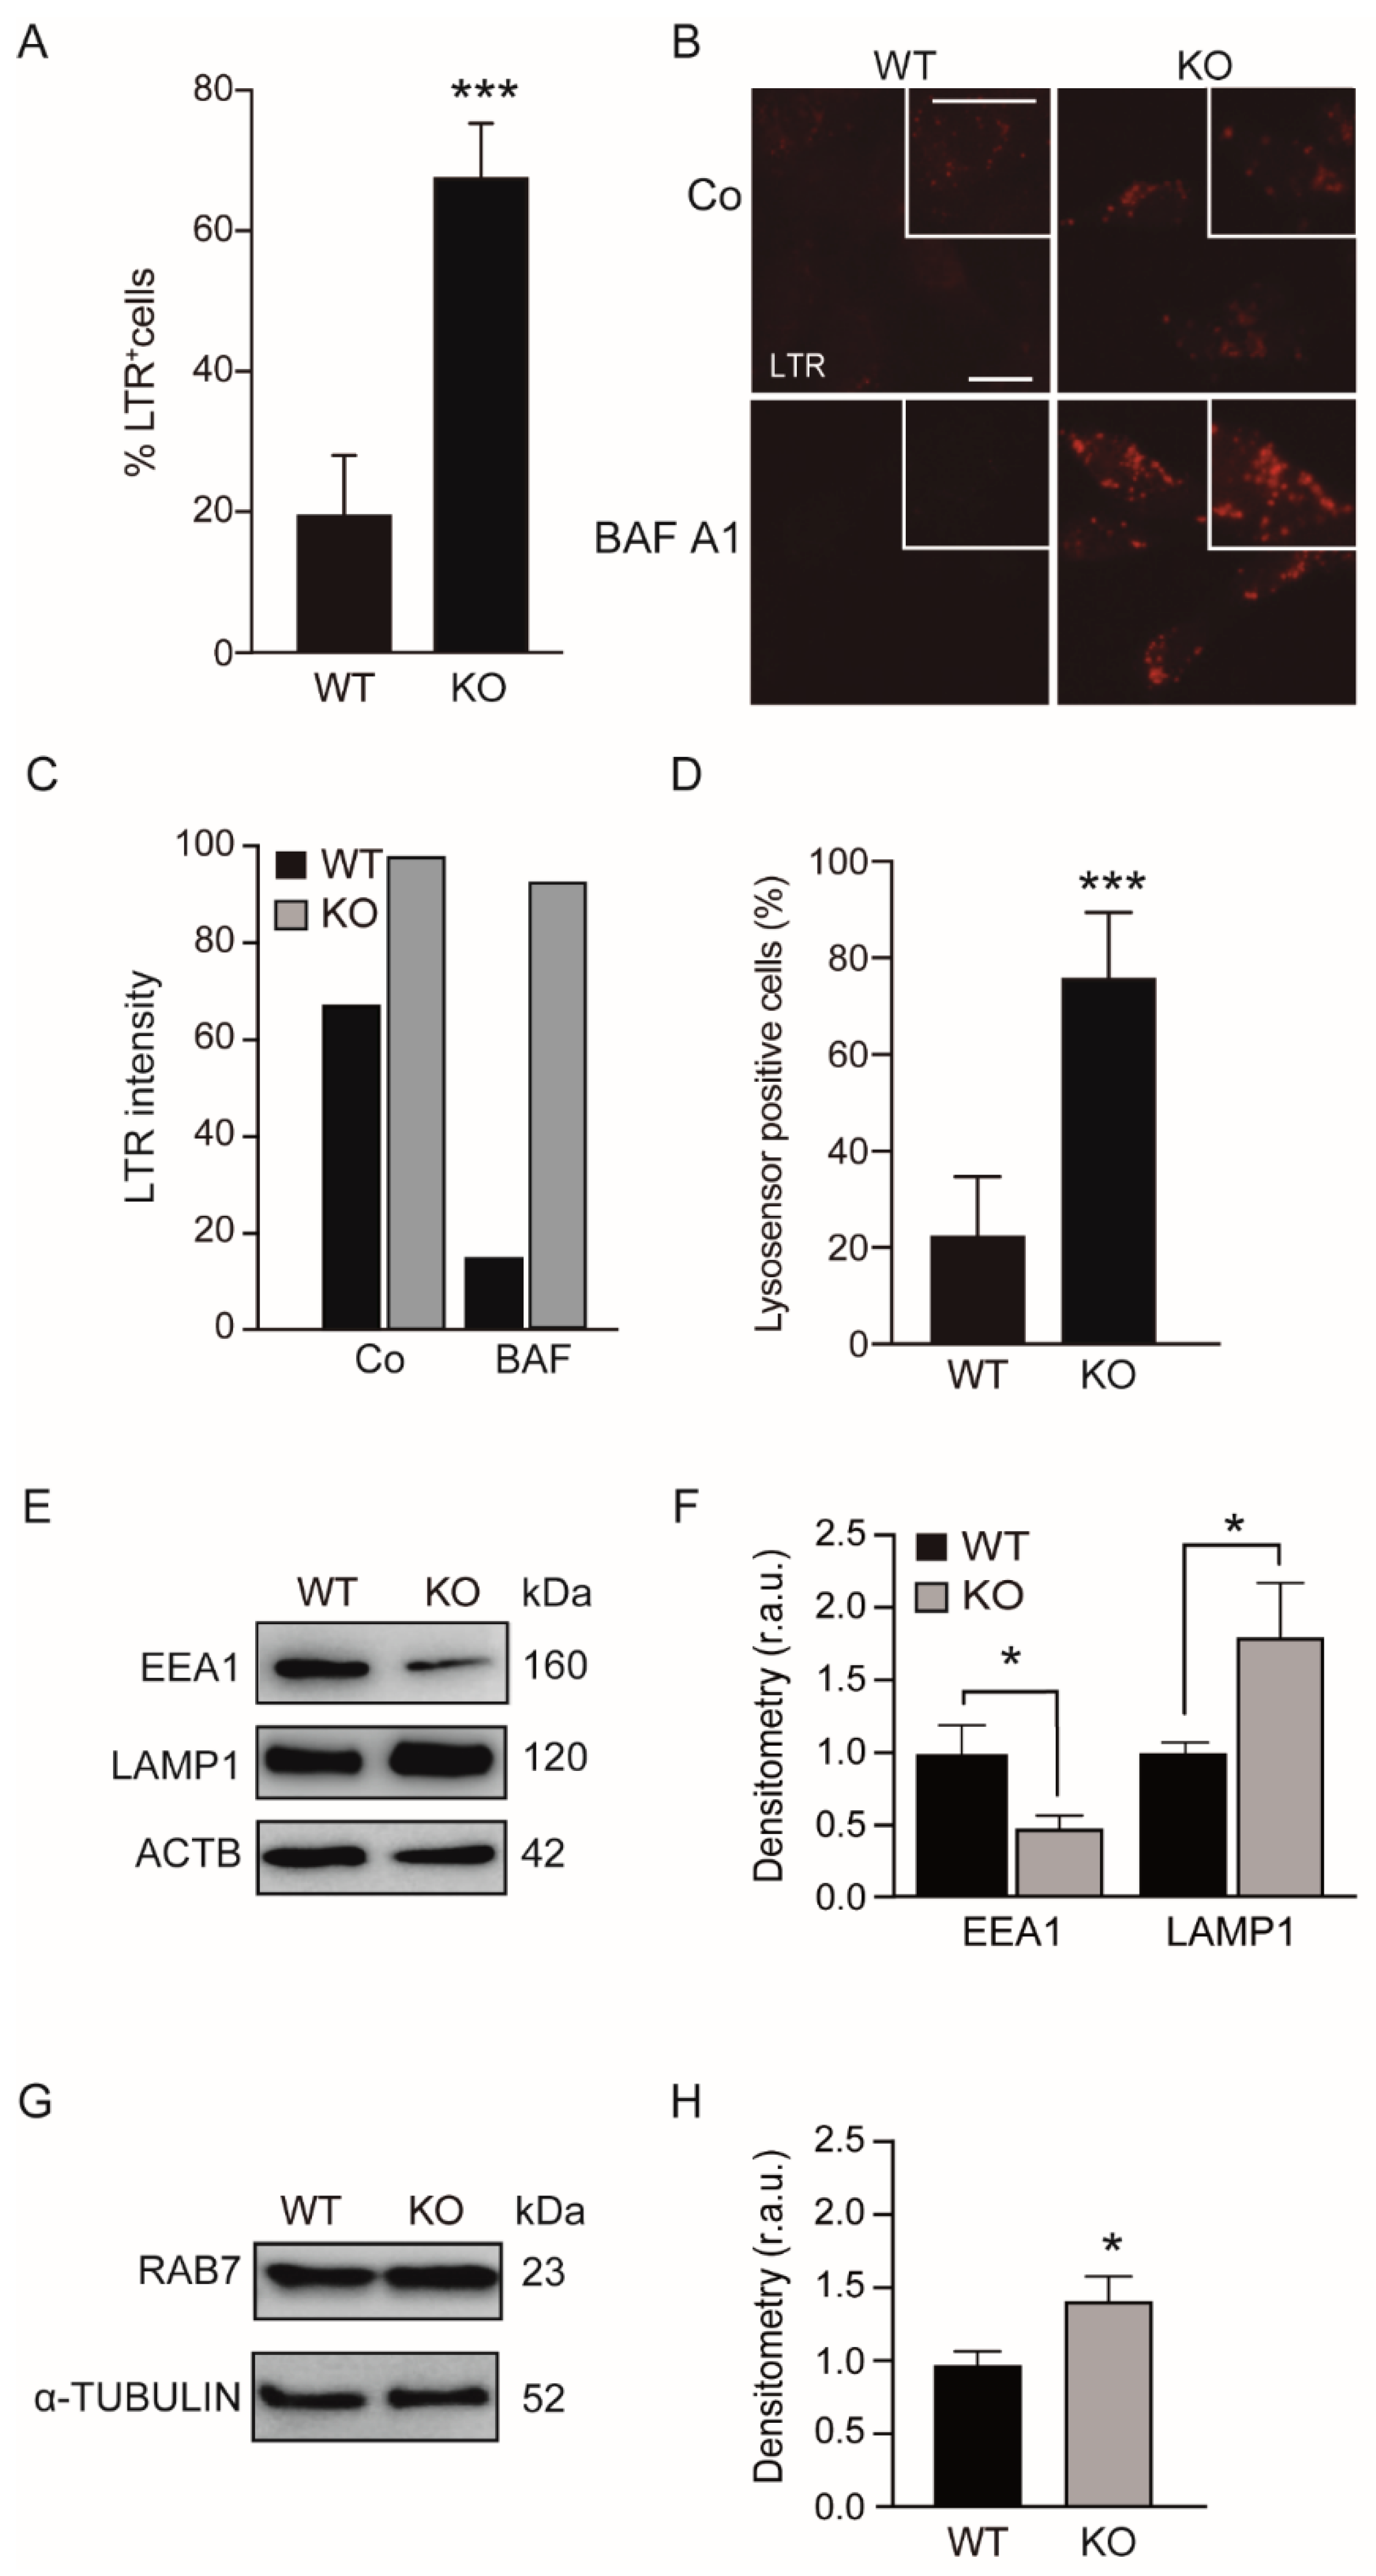
Abstract
:1. Introduction
2. Materials and Methods
2.1. Cell Culture
2.2. Reagent and Chemical Treatments
2.3. Protein Extraction and Western Blot Analysis
2.4. Immunofluorescence
2.5. Long-Lived Protein Degradation Assay
2.6. Protease Activity Assays
2.7. Flow Cytometry
2.8. Electron Microscopy
2.9. RT-PCR
2.10. Statistical Analysis
3. Results
3.1. KEAP1 Deficiency Enhanced the Number of Acidic Vesicles
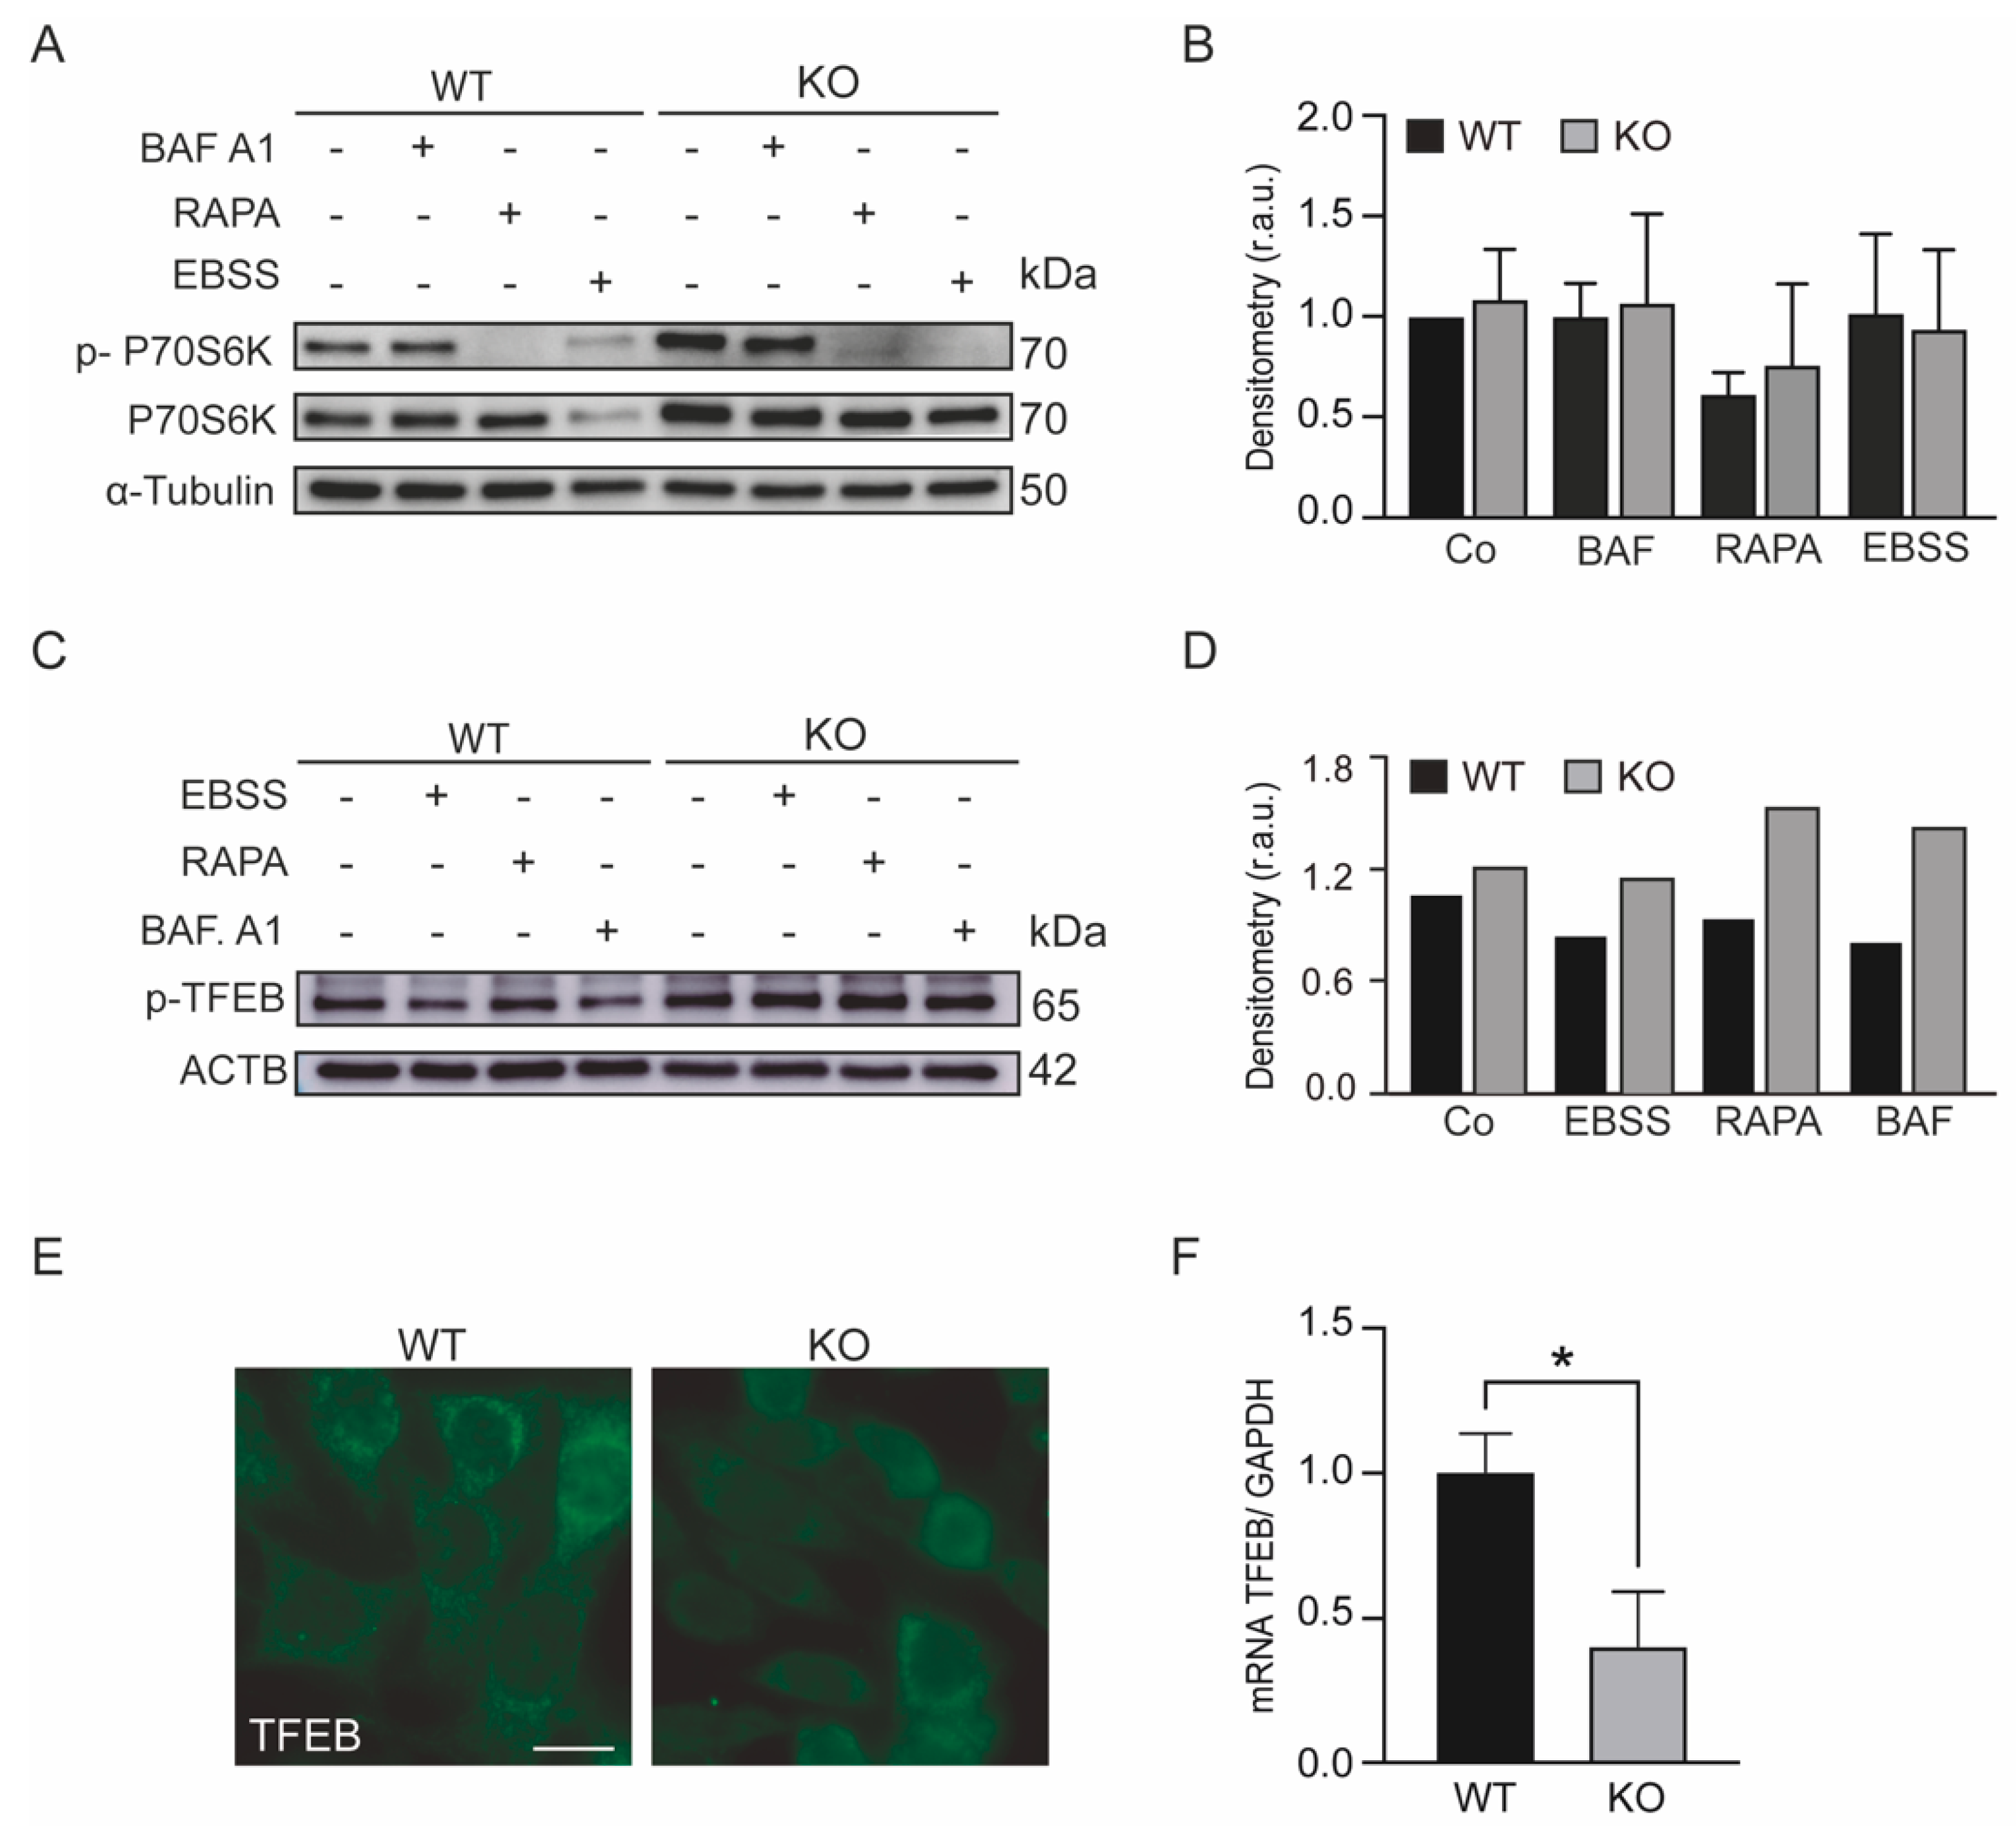
3.2. The mTOR Pathway Is Activated in KEAP1-Deficient Cells
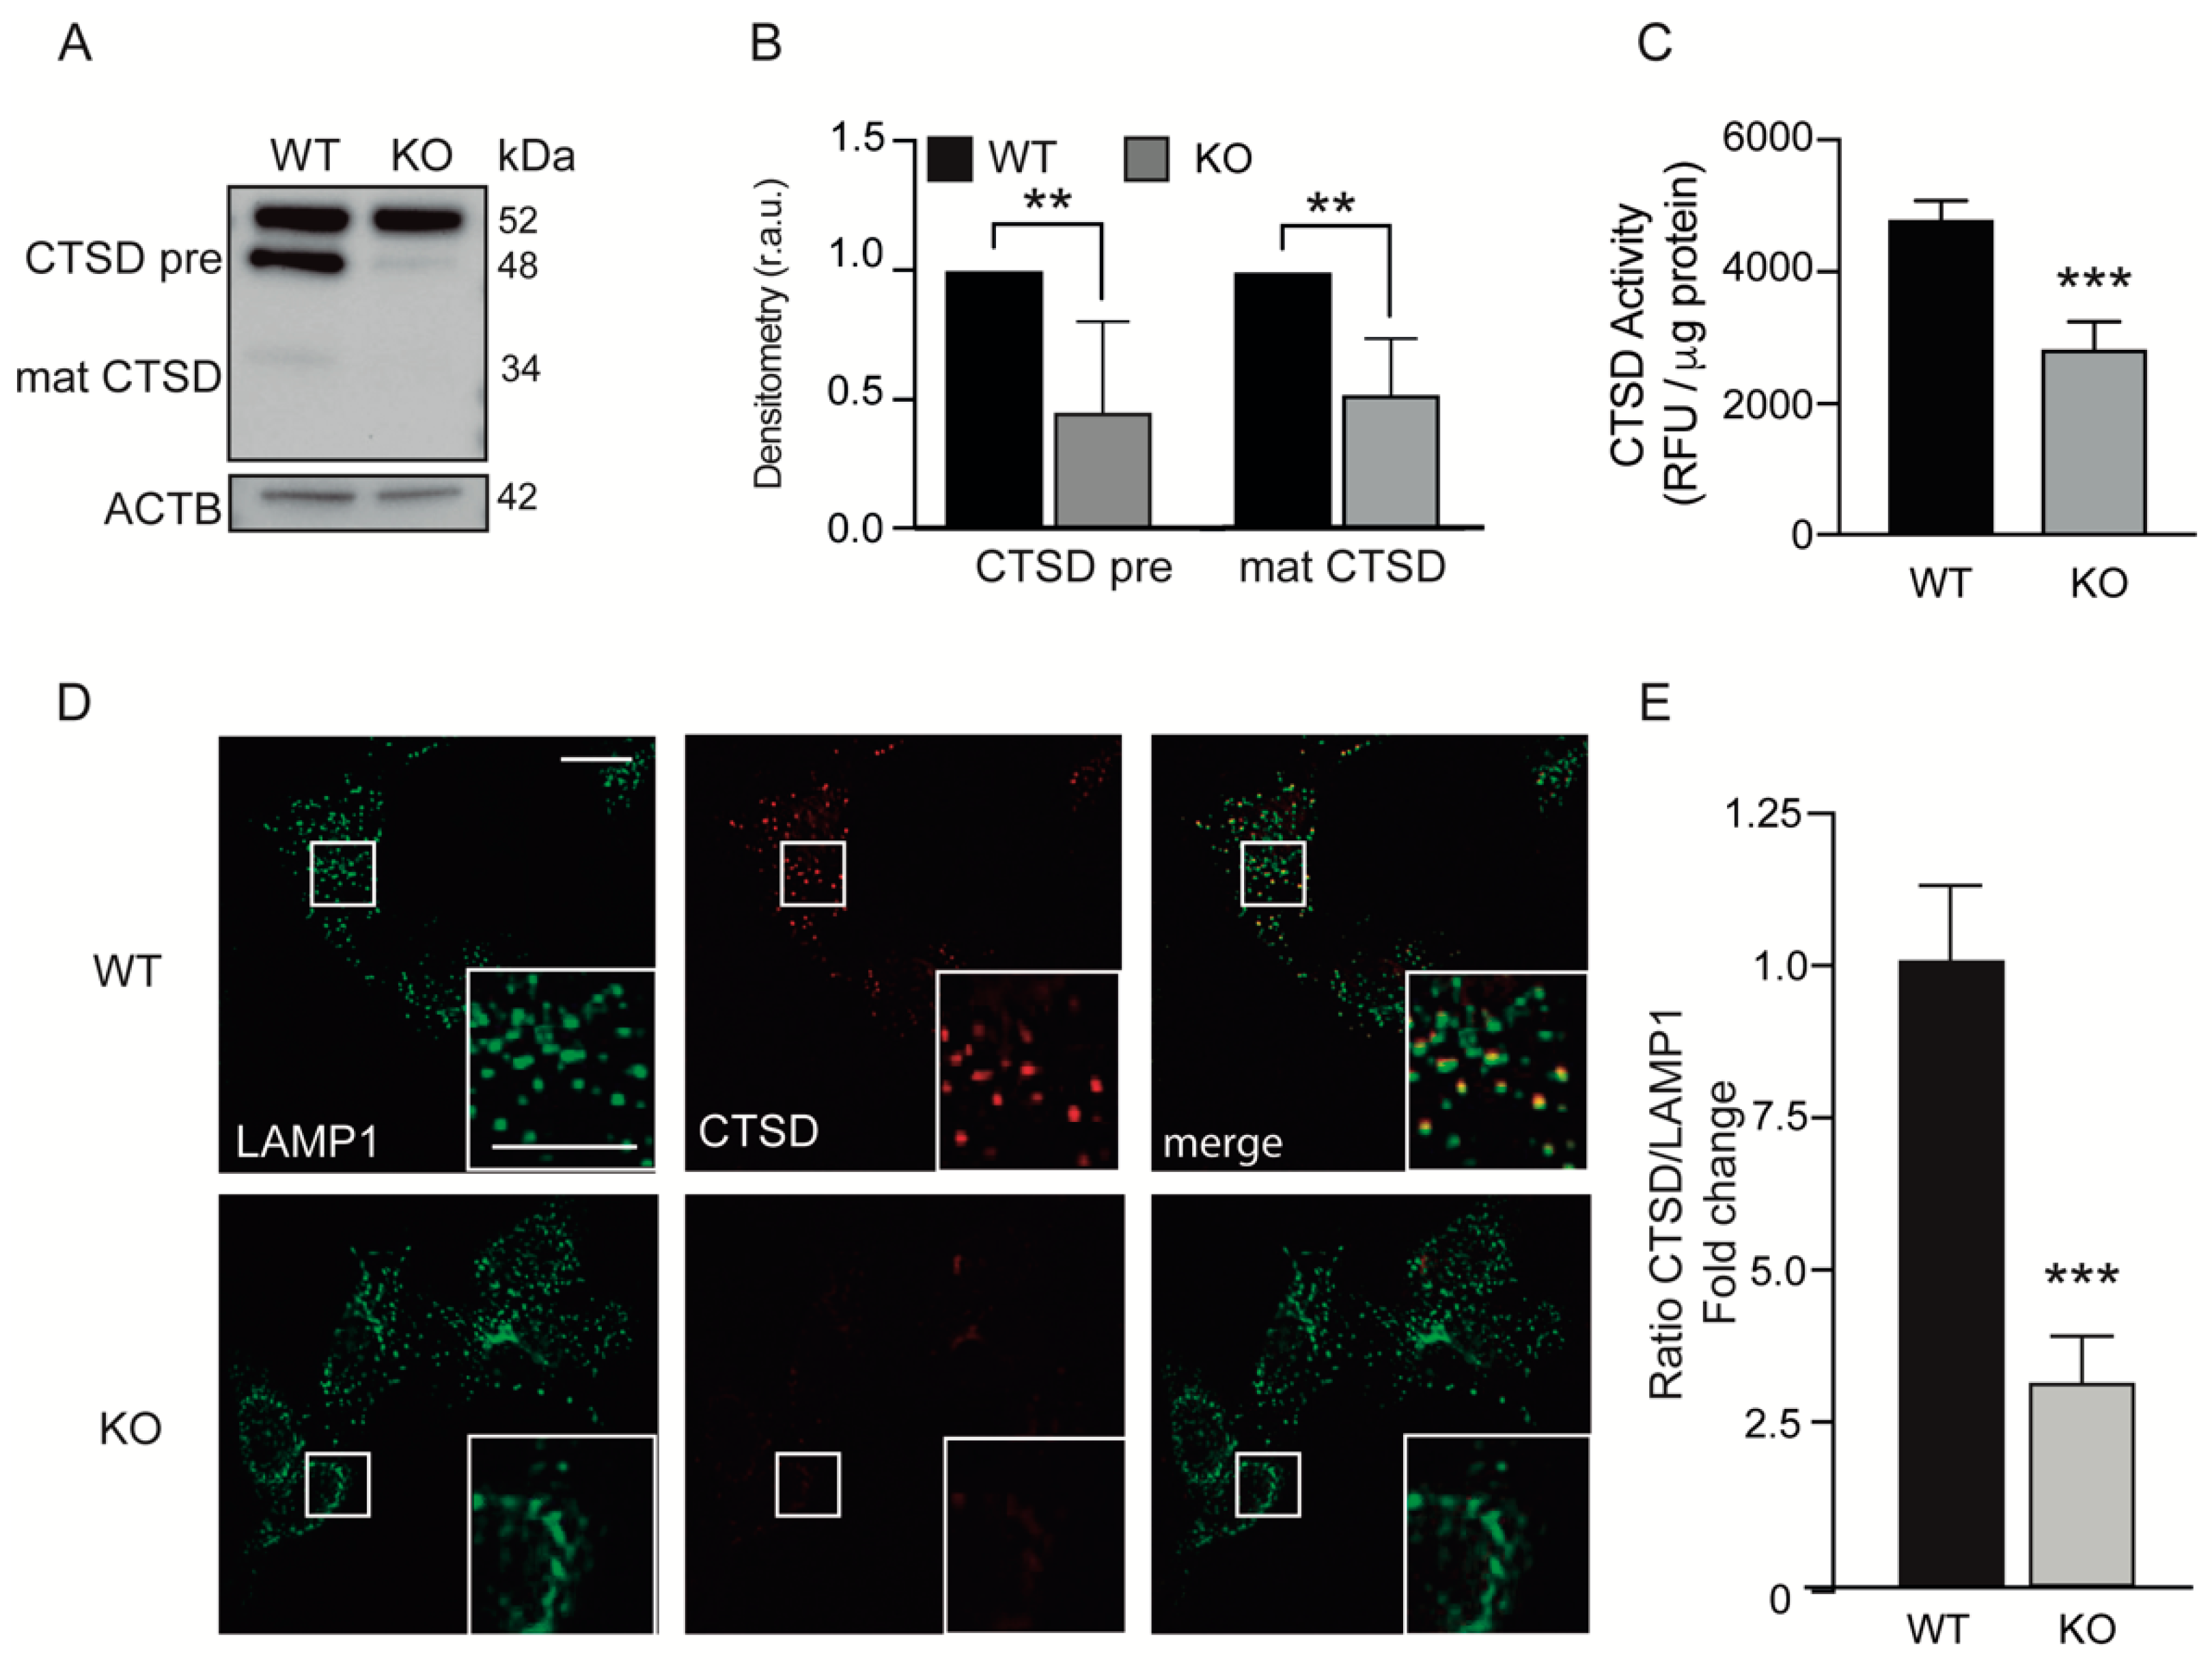
3.3. Loss of KEAP1 Led to Decreased Cathepsin D Activity
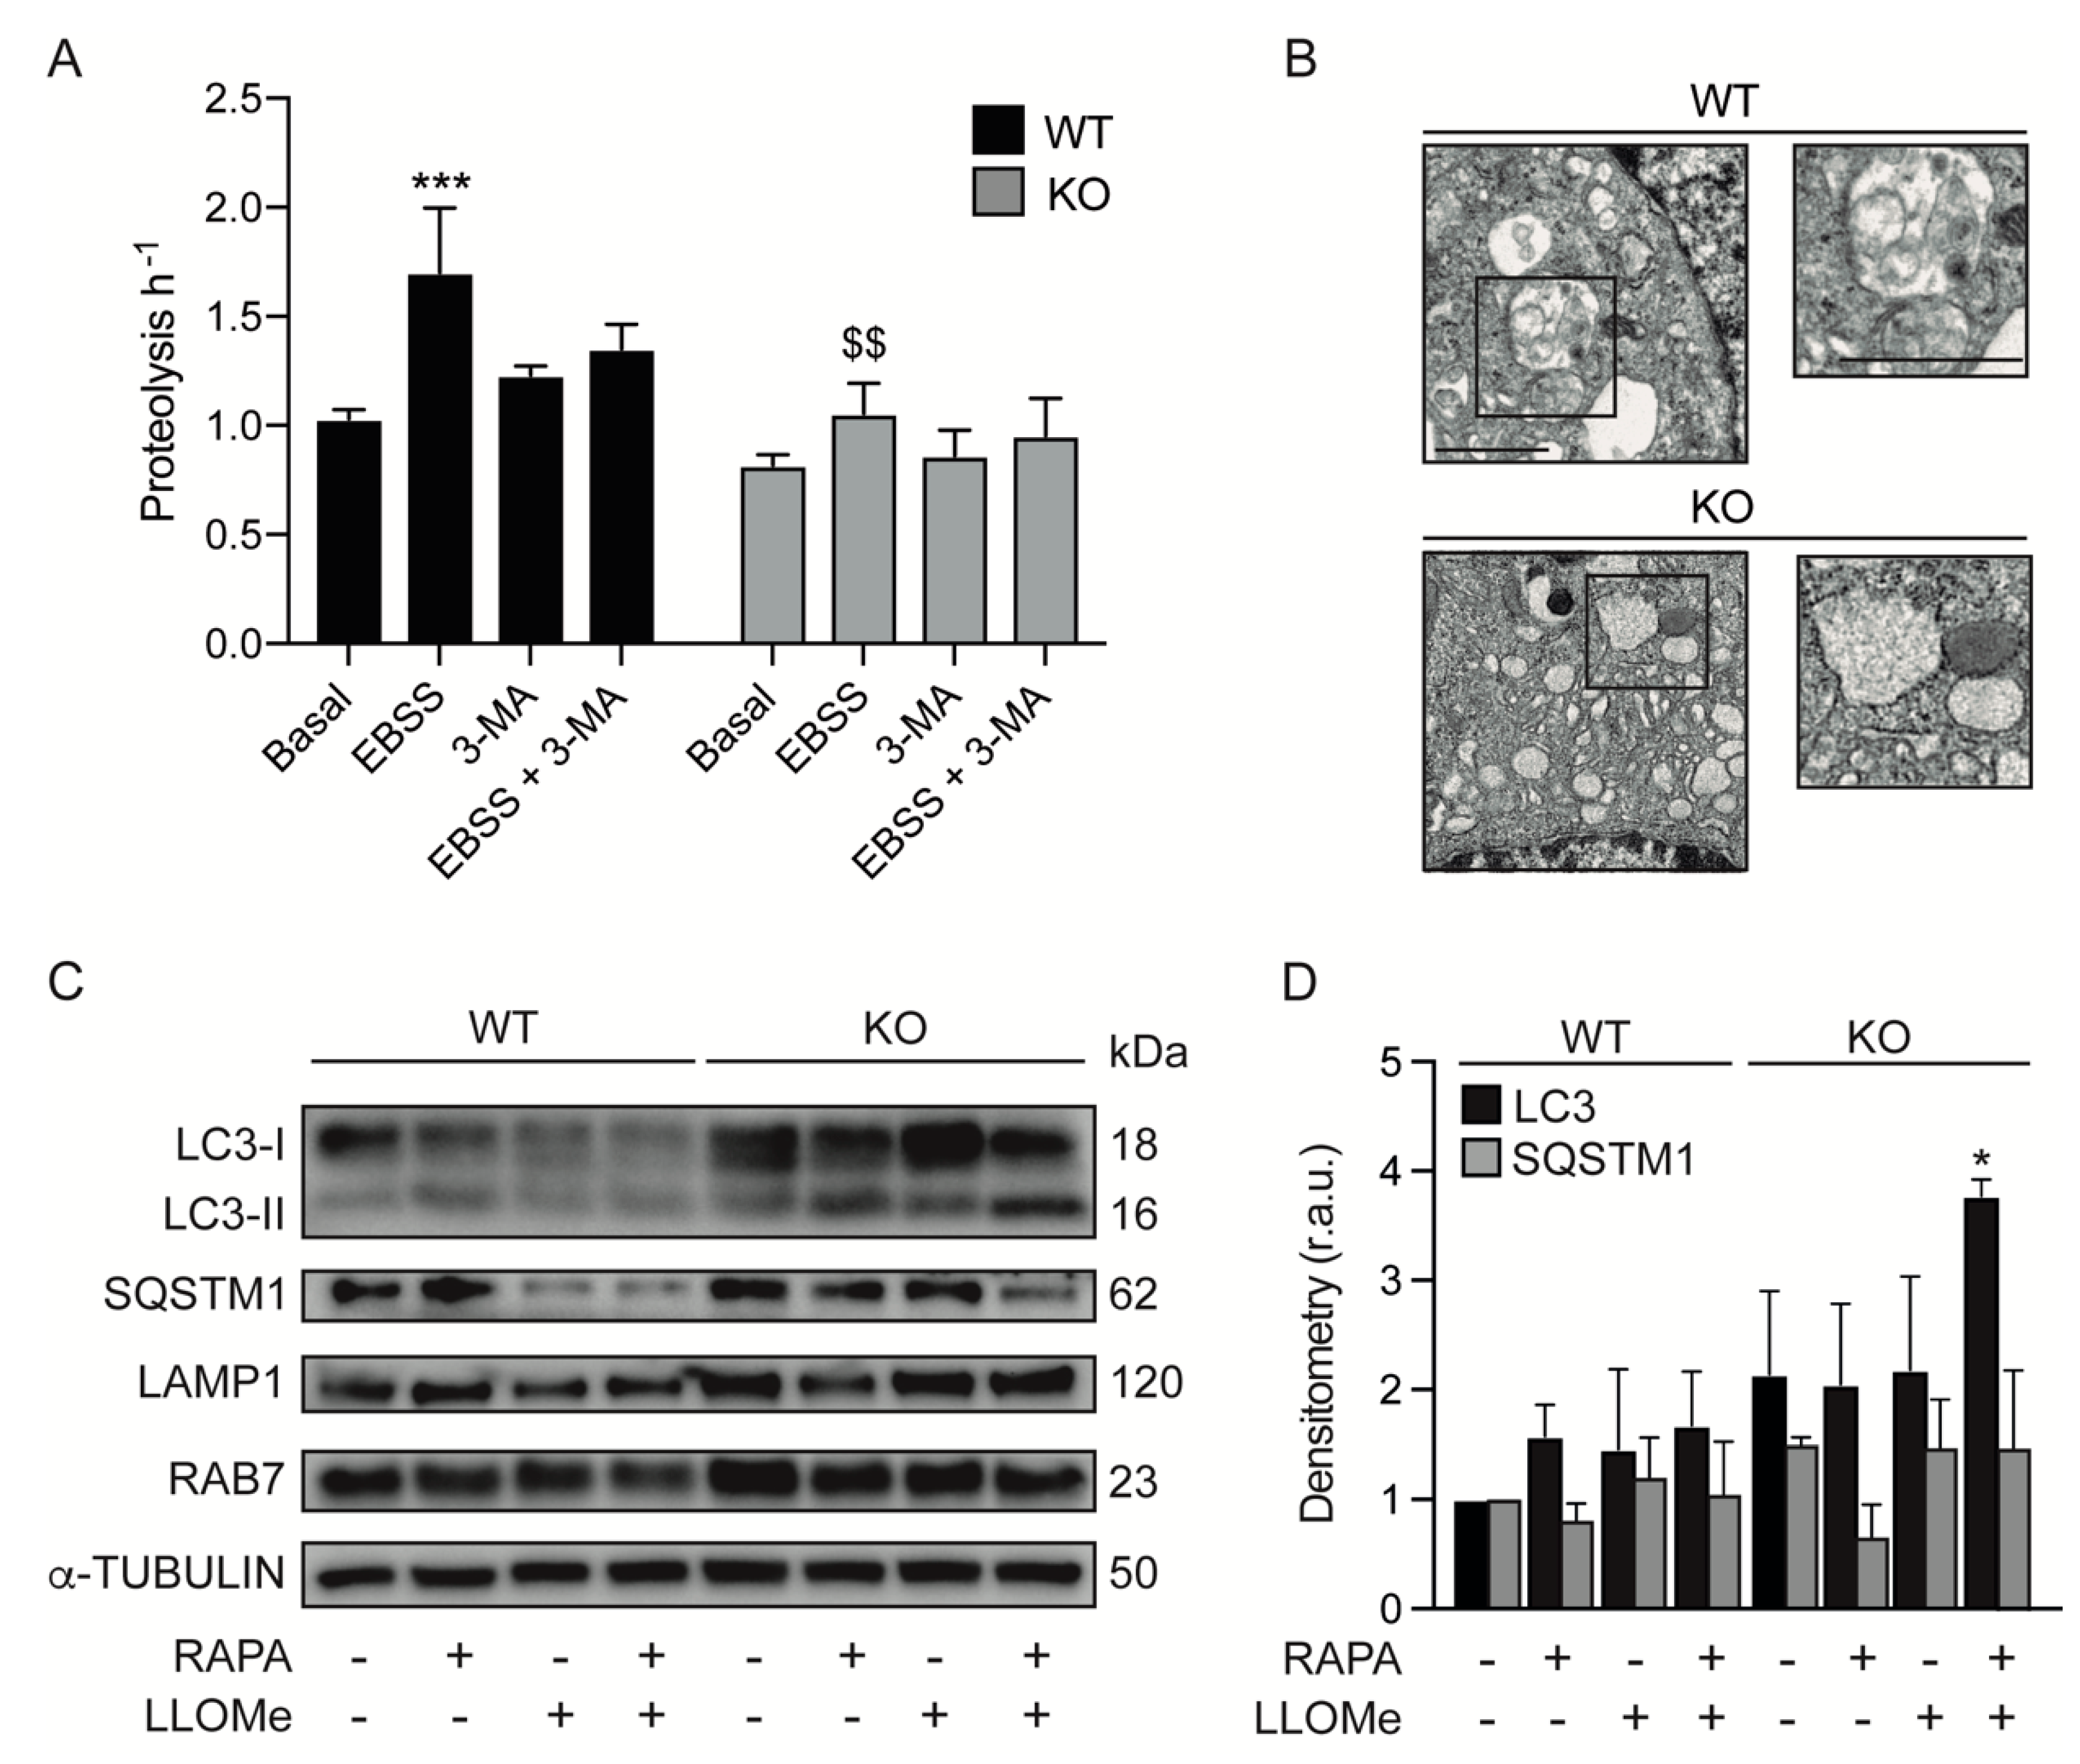
3.4. KEAP1 Deficiency Induces Autophagic Changes
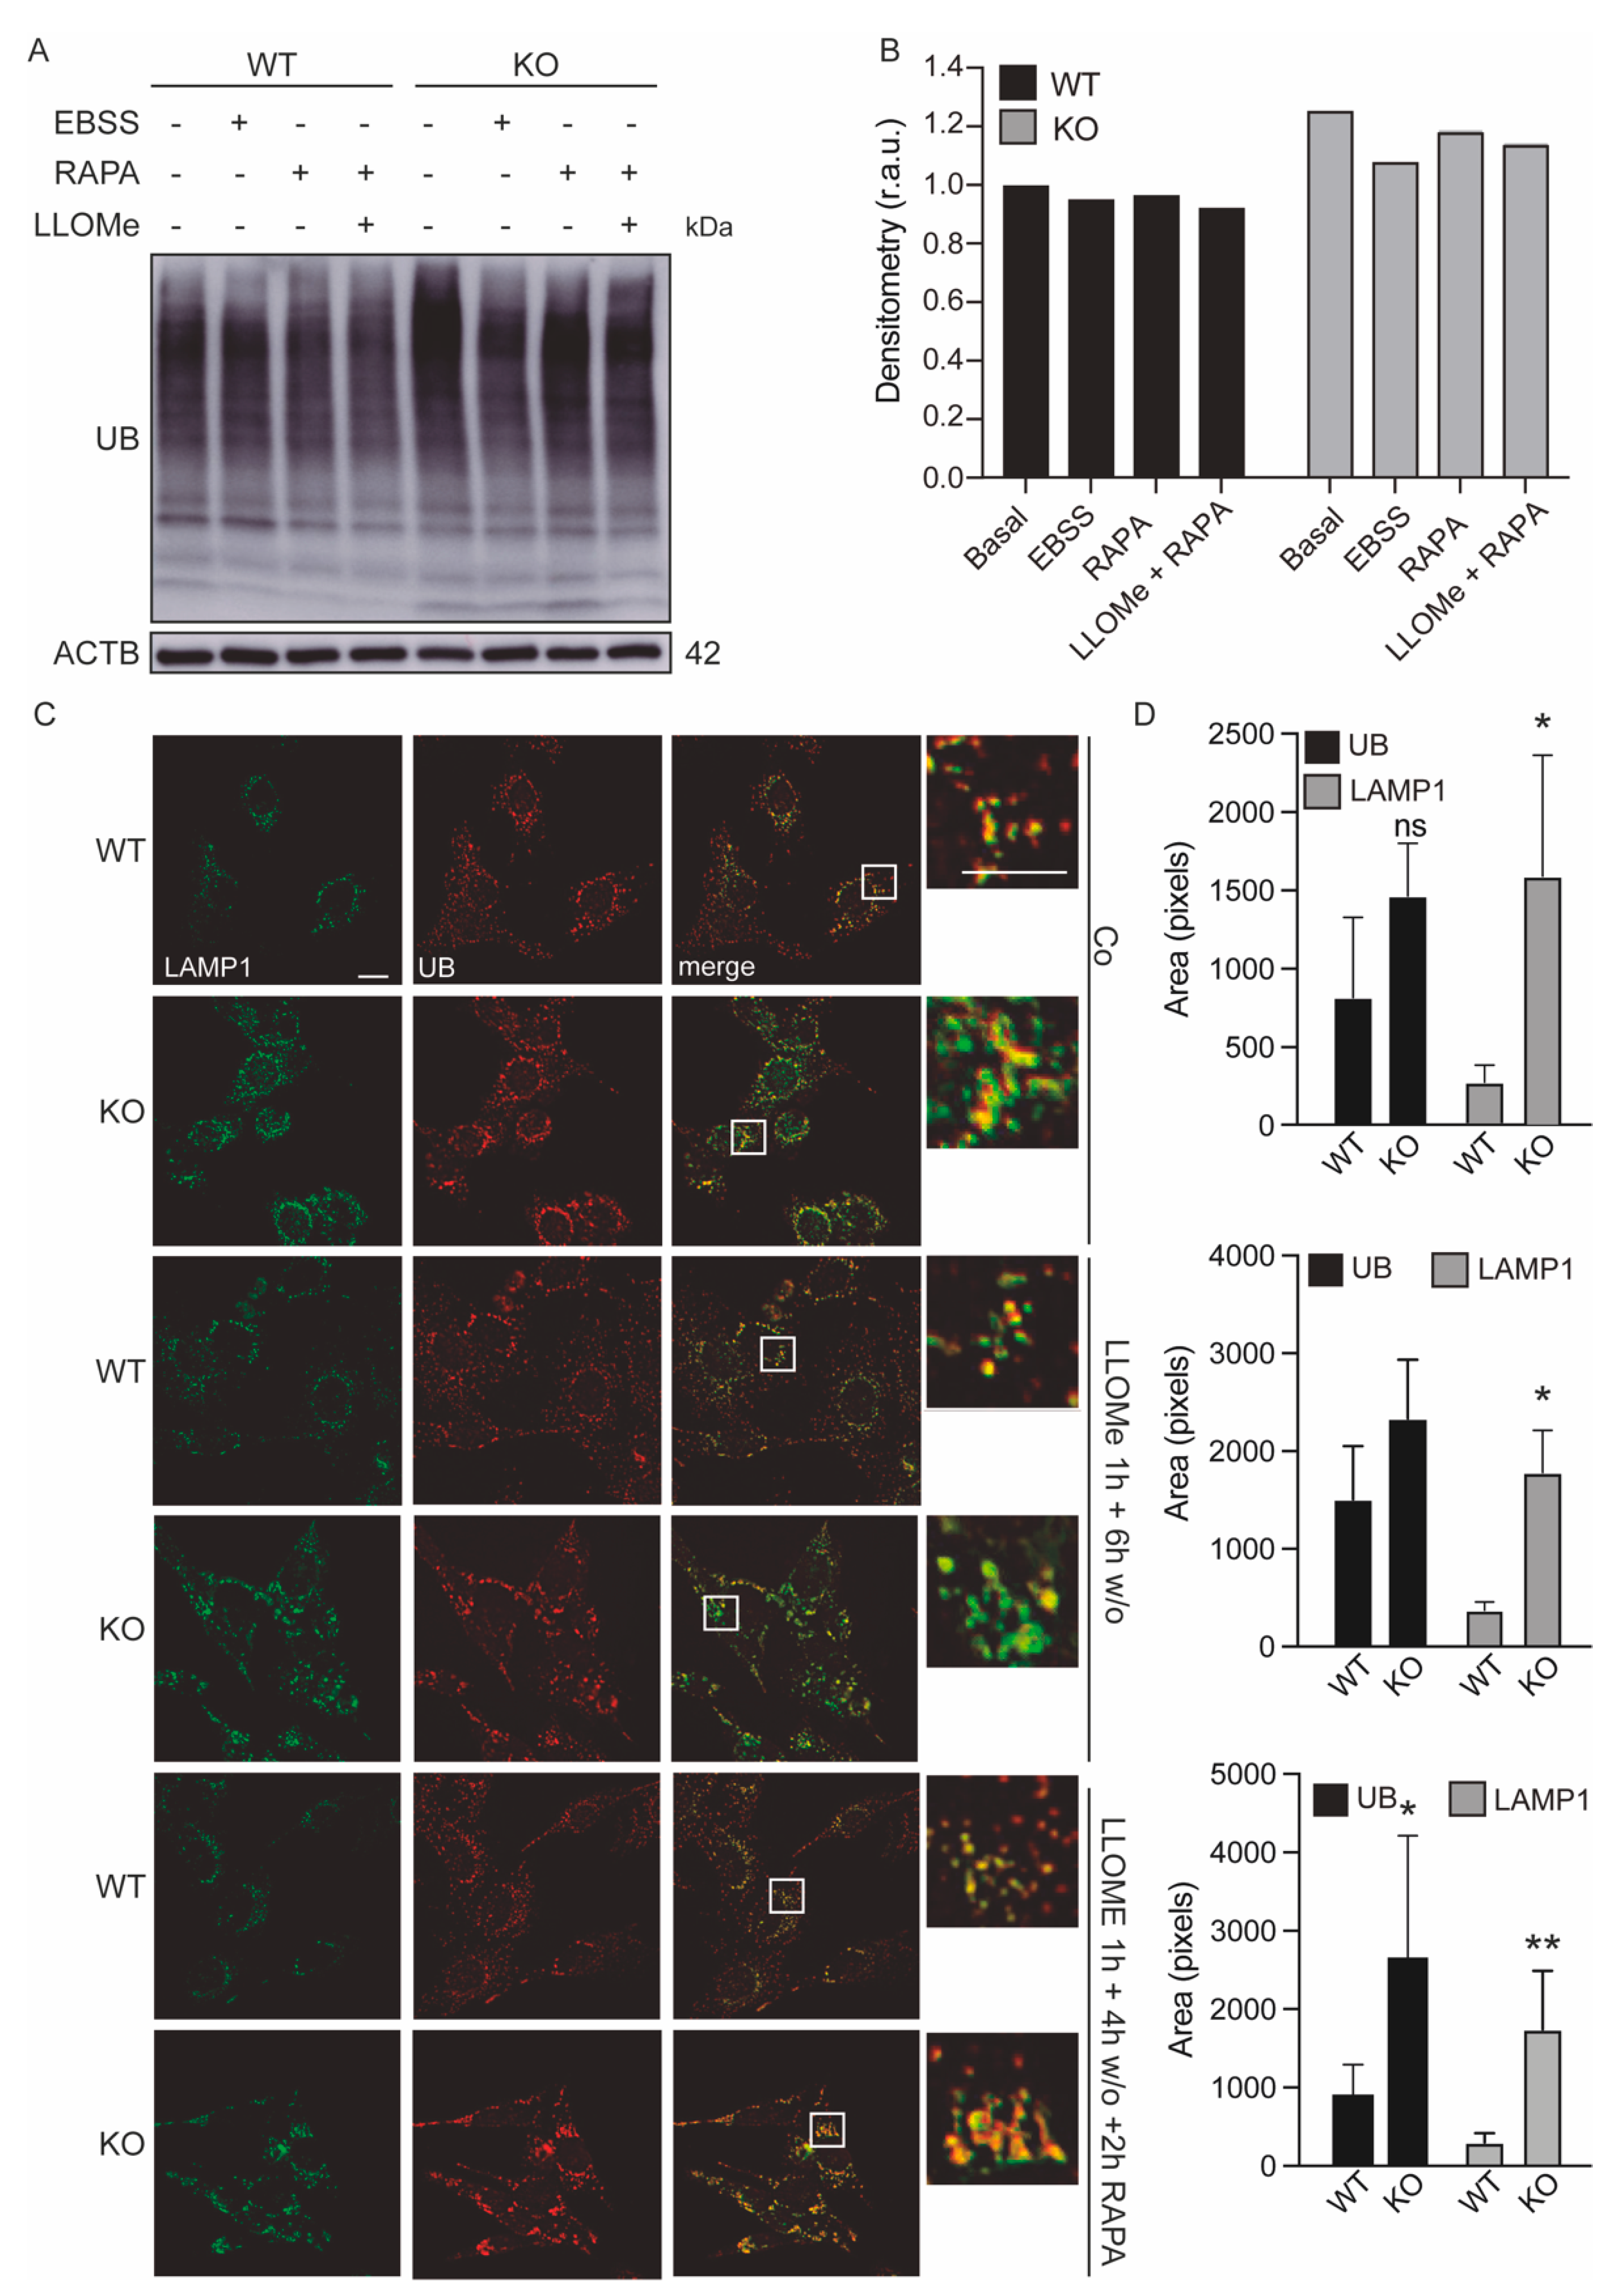
3.5. Lysosomes of Keap1KO Cells Are More Sensitive to Damage
4. Discussion
Supplementary Materials
Author Contributions
Funding
Institutional Review Board Statement
Informed Consent Statement
Data Availability Statement
Acknowledgments
Conflicts of Interest
References
- Itoh, K.; Wakabayashi, N.; Katoh, Y.; Ishii, T.; O’Connor, T.; Yamamoto, M. Keap1 regulates both cytoplasmic-nuclear shuttling and degradation of Nrf2 in response to electrophiles. Genes Cells 2003, 8, 379–391. [Google Scholar] [CrossRef]
- Kim, J.E.; You, D.J.; Lee, C.; Ahn, C.; Seong, J.Y.; Hwang, J.I. Suppression of NF-kappaB signaling by KEAP1 regulation of IKKbeta activity through autophagic degradation and inhibition of phosphorylation. Cell Signal 2010, 22, 1645–1654. [Google Scholar] [CrossRef] [PubMed]
- Lu, K.; Alcivar, A.L.; Ma, J.; Foo, T.K.; Zywea, S.; Mahdi, A.; Huo, Y.; Kensler, T.W.; Gatza, M.L.; Xia, B. NRF2 Induction Supporting Breast Cancer Cell Survival Is Enabled by Oxidative Stress-Induced DPP3-KEAP1 Interaction. Cancer Res. 2017, 77, 2881–2892. [Google Scholar] [CrossRef] [PubMed] [Green Version]
- O’Mealey, G.B.; Plafker, K.S.; Berry, W.L.; Janknecht, R.; Chan, J.Y.; Plafker, S.M. A PGAM5-KEAP1-Nrf2 complex is required for stress-induced mitochondrial retrograde trafficking. J. Cell Sci. 2017, 130, 3467–3480. [Google Scholar] [CrossRef] [Green Version]
- Kobayashi, A.; Kang, M.I.; Okawa, H.; Ohtsuji, M.; Zenke, Y.; Chiba, T.; Igarashi, K.; Yamamoto, M. Oxidative stress sensor Keap1 functions as an adaptor for Cul3-based E3 ligase to regulate proteasomal degradation of Nrf2. Mol. Cell Biol. 2004, 24, 7130–7139. [Google Scholar] [CrossRef] [PubMed] [Green Version]
- Kopacz, A.; Kloska, D.; Forman, H.J.; Jozkowicz, A.; Grochot-Przeczek, A. Beyond repression of Nrf2: An update on Keap1. Free Radic. Biol. Med. 2020, 157, 63–74. [Google Scholar] [CrossRef] [PubMed]
- Hast, B.E.; Goldfarb, D.; Mulvaney, K.M.; Hast, M.A.; Siesser, P.F.; Yan, F.; Hayes, D.N.; Major, M.B. Proteomic analysis of ubiquitin ligase KEAP1 reveals associated proteins that inhibit NRF2 ubiquitination. Cancer Res. 2013, 73, 2199–2210. [Google Scholar] [CrossRef] [Green Version]
- Komatsu, M.; Kurokawa, H.; Waguri, S.; Taguchi, K.; Kobayashi, A.; Ichimura, Y.; Sou, Y.S.; Ueno, I.; Sakamoto, A.; Tong, K.I.; et al. The selective autophagy substrate p62 activates the stress responsive transcription factor Nrf2 through inactivation of Keap1. Nat. Cell Biol. 2010, 12, 213–223. [Google Scholar] [CrossRef]
- Fan, W.; Tang, Z.; Chen, D.; Moughon, D.; Ding, X.; Chen, S.; Zhu, M.; Zhong, Q. Keap1 facilitates p62-mediated ubiquitin aggregate clearance via autophagy. Autophagy 2010, 6, 614–621. [Google Scholar] [CrossRef] [Green Version]
- Bonam, S.R.; Wang, F.; Muller, S. Lysosomes as a therapeutic target. Nat. Rev. Drug Discov. 2019, 18, 923–948. [Google Scholar] [CrossRef] [Green Version]
- Lim, C.Y.; Zoncu, R. The lysosome as a command-and-control center for cellular metabolism. J. Cell Biol. 2016, 214, 653–664. [Google Scholar] [CrossRef] [Green Version]
- Platt, F.M. Emptying the stores: Lysosomal diseases and therapeutic strategies. Nat. Rev. Drug Discov. 2018, 17, 133–150. [Google Scholar] [CrossRef]
- Colacurcio, D.J.; Nixon, R.A. Disorders of lysosomal acidification-The emerging role of v-ATPase in aging and neurodegenerative disease. Ageing Res. Rev. 2016, 32, 75–88. [Google Scholar] [CrossRef] [Green Version]
- Whyte, L.S.; Lau, A.A.; Hemsley, K.M.; Hopwood, J.J.; Sargeant, T.J. Endo-lysosomal and autophagic dysfunction: A driving factor in Alzheimer’s disease? J. Neurochem. 2017, 140, 703–717. [Google Scholar] [CrossRef] [Green Version]
- Menzies, F.M.; Fleming, A.; Caricasole, A.; Bento, C.F.; Andrews, S.P.; Ashkenazi, A.; Fullgrabe, J.; Jackson, A.; Sanchez, M.J.; Karabiyik, C.; et al. Autophagy and Neurodegeneration: Pathogenic Mechanisms and Therapeutic Opportunities. Neuron 2017, 93, 1015–1034. [Google Scholar] [CrossRef] [PubMed] [Green Version]
- Sardiello, M.; Palmieri, M.; di Ronza, A.; Medina, D.L.; Valenza, M.; Gennarino, V.A.; di Malta, C.; Donaudy, F.; Embrione, V.; Polishchuk, R.S.; et al. A gene network regulating lysosomal biogenesis and function. Science 2009, 325, 473–477. [Google Scholar] [CrossRef] [PubMed] [Green Version]
- Yu, L.; McPhee, C.K.; Zheng, L.; Mardones, G.A.; Rong, Y.; Peng, J.; Mi, N.; Zhao, Y.; Liu, Z.; Wan, F.; et al. Termination of autophagy and reformation of lysosomes regulated by mTOR. Nature 2010, 465, 942–946. [Google Scholar] [CrossRef]
- di Ronza, A.; Bajaj, L.; Sharma, J.; Sanagasetti, D.; Lotfi, P.; Adamski, C.J.; Collette, J.; Palmieri, M.; Amawi, A.; Popp, L.; et al. CLN8 is an endoplasmic reticulum cargo receptor that regulates lysosome biogenesis. Nat. Cell Biol. 2018, 20, 1370–1377. [Google Scholar] [CrossRef]
- Perera, R.M.; Zoncu, R. The Lysosome as a Regulatory Hub. Annu. Rev. Cell Dev. Biol. 2016, 32, 223–253. [Google Scholar] [CrossRef] [PubMed] [Green Version]
- Eskelinen, E.L.; Tanaka, Y.; Saftig, P. At the acidic edge: Emerging functions for lysosomal membrane proteins. Trends Cell Biol. 2003, 13, 137–145. [Google Scholar] [CrossRef]
- Masson, O.; Bach, A.S.; Derocq, D.; Prebois, C.; Laurent-Matha, V.; Pattingre, S.; Liaudet-Coopman, E. Pathophysiological functions of cathepsin D: Targeting its catalytic activity versus its protein binding activity? Biochimie 2010, 92, 1635–1643. [Google Scholar] [CrossRef] [Green Version]
- Benes, P.; Vetvicka, V.; Fusek, M. Cathepsin D—Many functions of one aspartic protease. Crit. Rev. Oncol. Hematol. 2008, 68, 12–28. [Google Scholar] [CrossRef] [Green Version]
- Appelqvist, H.; Waster, P.; Kagedal, K.; Ollinger, K. The lysosome: From waste bag to potential therapeutic target. J. Mol. Cell Biol. 2013, 5, 214–226. [Google Scholar] [CrossRef] [Green Version]
- Fuentes, J.M.; Lompre, A.M.; Moller, J.V.; Falson, P.; le Maire, M. Clean Western blots of membrane proteins after yeast heterologous expression following a shortened version of the method of Perini et al. Anal. Biochem. 2000, 285, 276–278. [Google Scholar] [CrossRef] [PubMed]
- Alvarado-Kristensson, M. A simple and fast method for fixation of cultured cell lines that preserves cellular structures containing gamma-tubulin. MethodsX 2018, 5, 227–233. [Google Scholar] [CrossRef] [PubMed]
- Dupont, N.; Leroy, C.; Hamai, A.; Codogno, P. Long-Lived Protein Degradation During Autophagy. Methods Enzymol. 2017, 588, 31–40. [Google Scholar] [PubMed]
- Lin, H.J.; Herman, P.; Kang, J.S.; Lakowicz, J.R. Fluorescence lifetime characterization of novel low-pH probes. Anal. Biochem. 2001, 294, 118–125. [Google Scholar] [CrossRef] [PubMed]
- Saftig, P.; Puertollano, R. How Lysosomes Sense, Integrate, and Cope with Stress. Trends Biochem. Sci. 2021, 46, 97–112. [Google Scholar] [CrossRef]
- Martina, J.A.; Chen, Y.; Gucek, M.; Puertollano, R. MTORC1 functions as a transcriptional regulator of autophagy by preventing nuclear transport of TFEB. Autophagy 2012, 8, 903–914. [Google Scholar] [CrossRef] [PubMed] [Green Version]
- Settembre, C.; Zoncu, R.; Medina, D.L.; Vetrini, F.; Erdin, S.; Erdin, S.; Huynh, T.; Ferron, M.; Karsenty, G.; Vellard, M.C.; et al. A lysosome-to-nucleus signalling mechanism senses and regulates the lysosome via mTOR and TFEB. EMBO J. 2012, 31, 1095–1108. [Google Scholar] [CrossRef] [PubMed] [Green Version]
- Yim, W.W.; Mizushima, N. Lysosome biology in autophagy. Cell Discov. 2020, 6, 6. [Google Scholar] [CrossRef] [PubMed] [Green Version]
- Thiele, D.L.; Lipsky, P.E. Mechanism of L-leucyl-L-leucine methyl ester-mediated killing of cytotoxic lymphocytes: Dependence on a lysosomal thiol protease, dipeptidyl peptidase I, that is enriched in these cells. Proc. Natl. Acad. Sci. USA 1990, 87, 83–87. [Google Scholar] [CrossRef] [Green Version]
- Settembre, C.; Fraldi, A.; Medina, D.L.; Ballabio, A. Signals from the lysosome: A control centre for cellular clearance and energy metabolism. Nat. Rev. Mol. Cell Biol. 2013, 14, 283–296. [Google Scholar] [CrossRef] [PubMed] [Green Version]
- Vukoja, A.; Rey, U.; Petzoldt, A.G.; Ott, C.; Vollweiter, D.; Quentin, C.; Puchkov, D.; Reynolds, E.; Lehmann, M.; Hohensee, S.; et al. Presynaptic Biogenesis Requires Axonal Transport of Lysosome-Related Vesicles. Neuron 2018, 99, 1216–1232 e7. [Google Scholar] [CrossRef] [PubMed] [Green Version]
- Settembre, C.; di Malta, C.; Polito, V.A.; Arencibia, M.G.; Vetrini, F.; Erdin, S.; Erdin, S.U.; Huynh, T.; Medina, D.; Colella, P.; et al. TFEB links autophagy to lysosomal biogenesis. Science 2011, 332, 1429–1433. [Google Scholar] [CrossRef] [Green Version]
- Li, D.; Shao, R.; Wang, N.; Zhou, N.; Du, K.; Shi, J.; Wang, Y.; Zhao, Z.; Ye, X.; Zhang, X.; et al. Sulforaphane Activates a lysosome-dependent transcriptional program to mitigate oxidative stress. Autophagy 2021, 17, 872–887. [Google Scholar] [CrossRef] [PubMed]
- Park, J.Y.; Kim, S.; Sohn, H.Y.; Koh, Y.H.; Jo, C. TFEB activates Nrf2 by repressing its E3 ubiquitin ligase DCAF11 and promoting phosphorylation of p62. Sci. Rep. 2019, 9, 14354. [Google Scholar] [CrossRef]
- Ballabio, A.; Bonifacino, J.S. Lysosomes as dynamic regulators of cell and organismal homeostasis. Nat. Rev. Mol. Cell Biol. 2020, 21, 101–118. [Google Scholar] [CrossRef]
- Cheng, X.T.; Xie, Y.X.; Zhou, B.; Huang, N.; Farfel-Becker, T.; Sheng, Z.H. Characterization of LAMP1-labeled nondegradative lysosomal and endocytic compartments in neurons. J. Cell Biol. 2018, 217, 3127–3139. [Google Scholar] [CrossRef] [Green Version]
- Lau, A.; Wang, X.J.; Zhao, F.; Villeneuve, N.F.; Wu, T.; Jiang, T.; Sun, Z.; White, E.; Zhang, D.D. A noncanonical mechanism of Nrf2 activation by autophagy deficiency: Direct interaction between Keap1 and p62. Mol. Cell Biol. 2010, 30, 3275–3285. [Google Scholar] [CrossRef] [PubMed] [Green Version]
- Jain, A.; Lamark, T.; Sjottem, E.; Larsen, K.B.; Awuh, J.A.; Overvatn, A.; McMahon, M.; Hayes, J.D.; Johansen, T. p62/SQSTM1 is a target gene for transcription factor NRF2 and creates a positive feedback loop by inducing antioxidant response element-driven gene transcription. J. Biol. Chem. 2010, 285, 22576–22591. [Google Scholar] [CrossRef] [PubMed] [Green Version]
- Taguchi, K.; Fujikawa, N.; Komatsu, M.; Ishii, T.; Unno, M.; Akaike, T.; Motohashi, H.; Yamamoto, M. Keap1 degradation by autophagy for the maintenance of redox homeostasis. Proc. Natl. Acad. Sci. USA 2012, 109, 13561–13566. [Google Scholar] [CrossRef] [PubMed] [Green Version]
- Korolchuk, V.I.; Saiki, S.; Lichtenberg, M.; Siddiqi, F.H.; Roberts, E.A.; Imarisio, S.; Jahreiss, L.; Sarkar, S.; Futter, M.; Menzies, F.M.; et al. Lysosomal positioning coordinates cellular nutrient responses. Nat. Cell Biol. 2011, 13, 453–460. [Google Scholar] [CrossRef]
- Johnson, D.E.; Ostrowski, P.; Jaumouille, V.; Grinstein, S. The position of lysosomes within the cell determines their luminal pH. J. Cell Biol. 2016, 212, 677–692. [Google Scholar] [CrossRef] [Green Version]
- Cheng, X.T.; Xie, Y.X.; Zhou, B.; Huang, N.; Farfel-Becker, T.; Sheng, Z.H. Revisiting LAMP1 as a marker for degradative autophagy-lysosomal organelles in the nervous system. Autophagy 2018, 14, 1472–1474. [Google Scholar] [CrossRef]


Publisher’s Note: MDPI stays neutral with regard to jurisdictional claims in published maps and institutional affiliations. |
© 2022 by the authors. Licensee MDPI, Basel, Switzerland. This article is an open access article distributed under the terms and conditions of the Creative Commons Attribution (CC BY) license (https://creativecommons.org/licenses/by/4.0/).
Share and Cite
Uribe-Carretero, E.; Martinez-Chacón, G.; Yakhine-Diop, S.M.S.; Duque-González, G.; Rodríguez-Arribas, M.; Alegre-Cortés, E.; Paredes-Barquero, M.; Canales-Cortés, S.; Pizarro-Estrella, E.; Cuadrado, A.; et al. Loss of KEAP1 Causes an Accumulation of Nondegradative Organelles. Antioxidants 2022, 11, 1398. https://0-doi-org.brum.beds.ac.uk/10.3390/antiox11071398
Uribe-Carretero E, Martinez-Chacón G, Yakhine-Diop SMS, Duque-González G, Rodríguez-Arribas M, Alegre-Cortés E, Paredes-Barquero M, Canales-Cortés S, Pizarro-Estrella E, Cuadrado A, et al. Loss of KEAP1 Causes an Accumulation of Nondegradative Organelles. Antioxidants. 2022; 11(7):1398. https://0-doi-org.brum.beds.ac.uk/10.3390/antiox11071398
Chicago/Turabian StyleUribe-Carretero, Elisabet, Guadalupe Martinez-Chacón, Sokhna M. S. Yakhine-Diop, Gema Duque-González, Mario Rodríguez-Arribas, Eva Alegre-Cortés, Marta Paredes-Barquero, Saray Canales-Cortés, Elisa Pizarro-Estrella, Antonio Cuadrado, and et al. 2022. "Loss of KEAP1 Causes an Accumulation of Nondegradative Organelles" Antioxidants 11, no. 7: 1398. https://0-doi-org.brum.beds.ac.uk/10.3390/antiox11071398