
Co-Treatment with Phlorotannin and Extracellular Vesicles from Ecklonia cava Inhibits UV-Induced Melanogenesis

 and
and 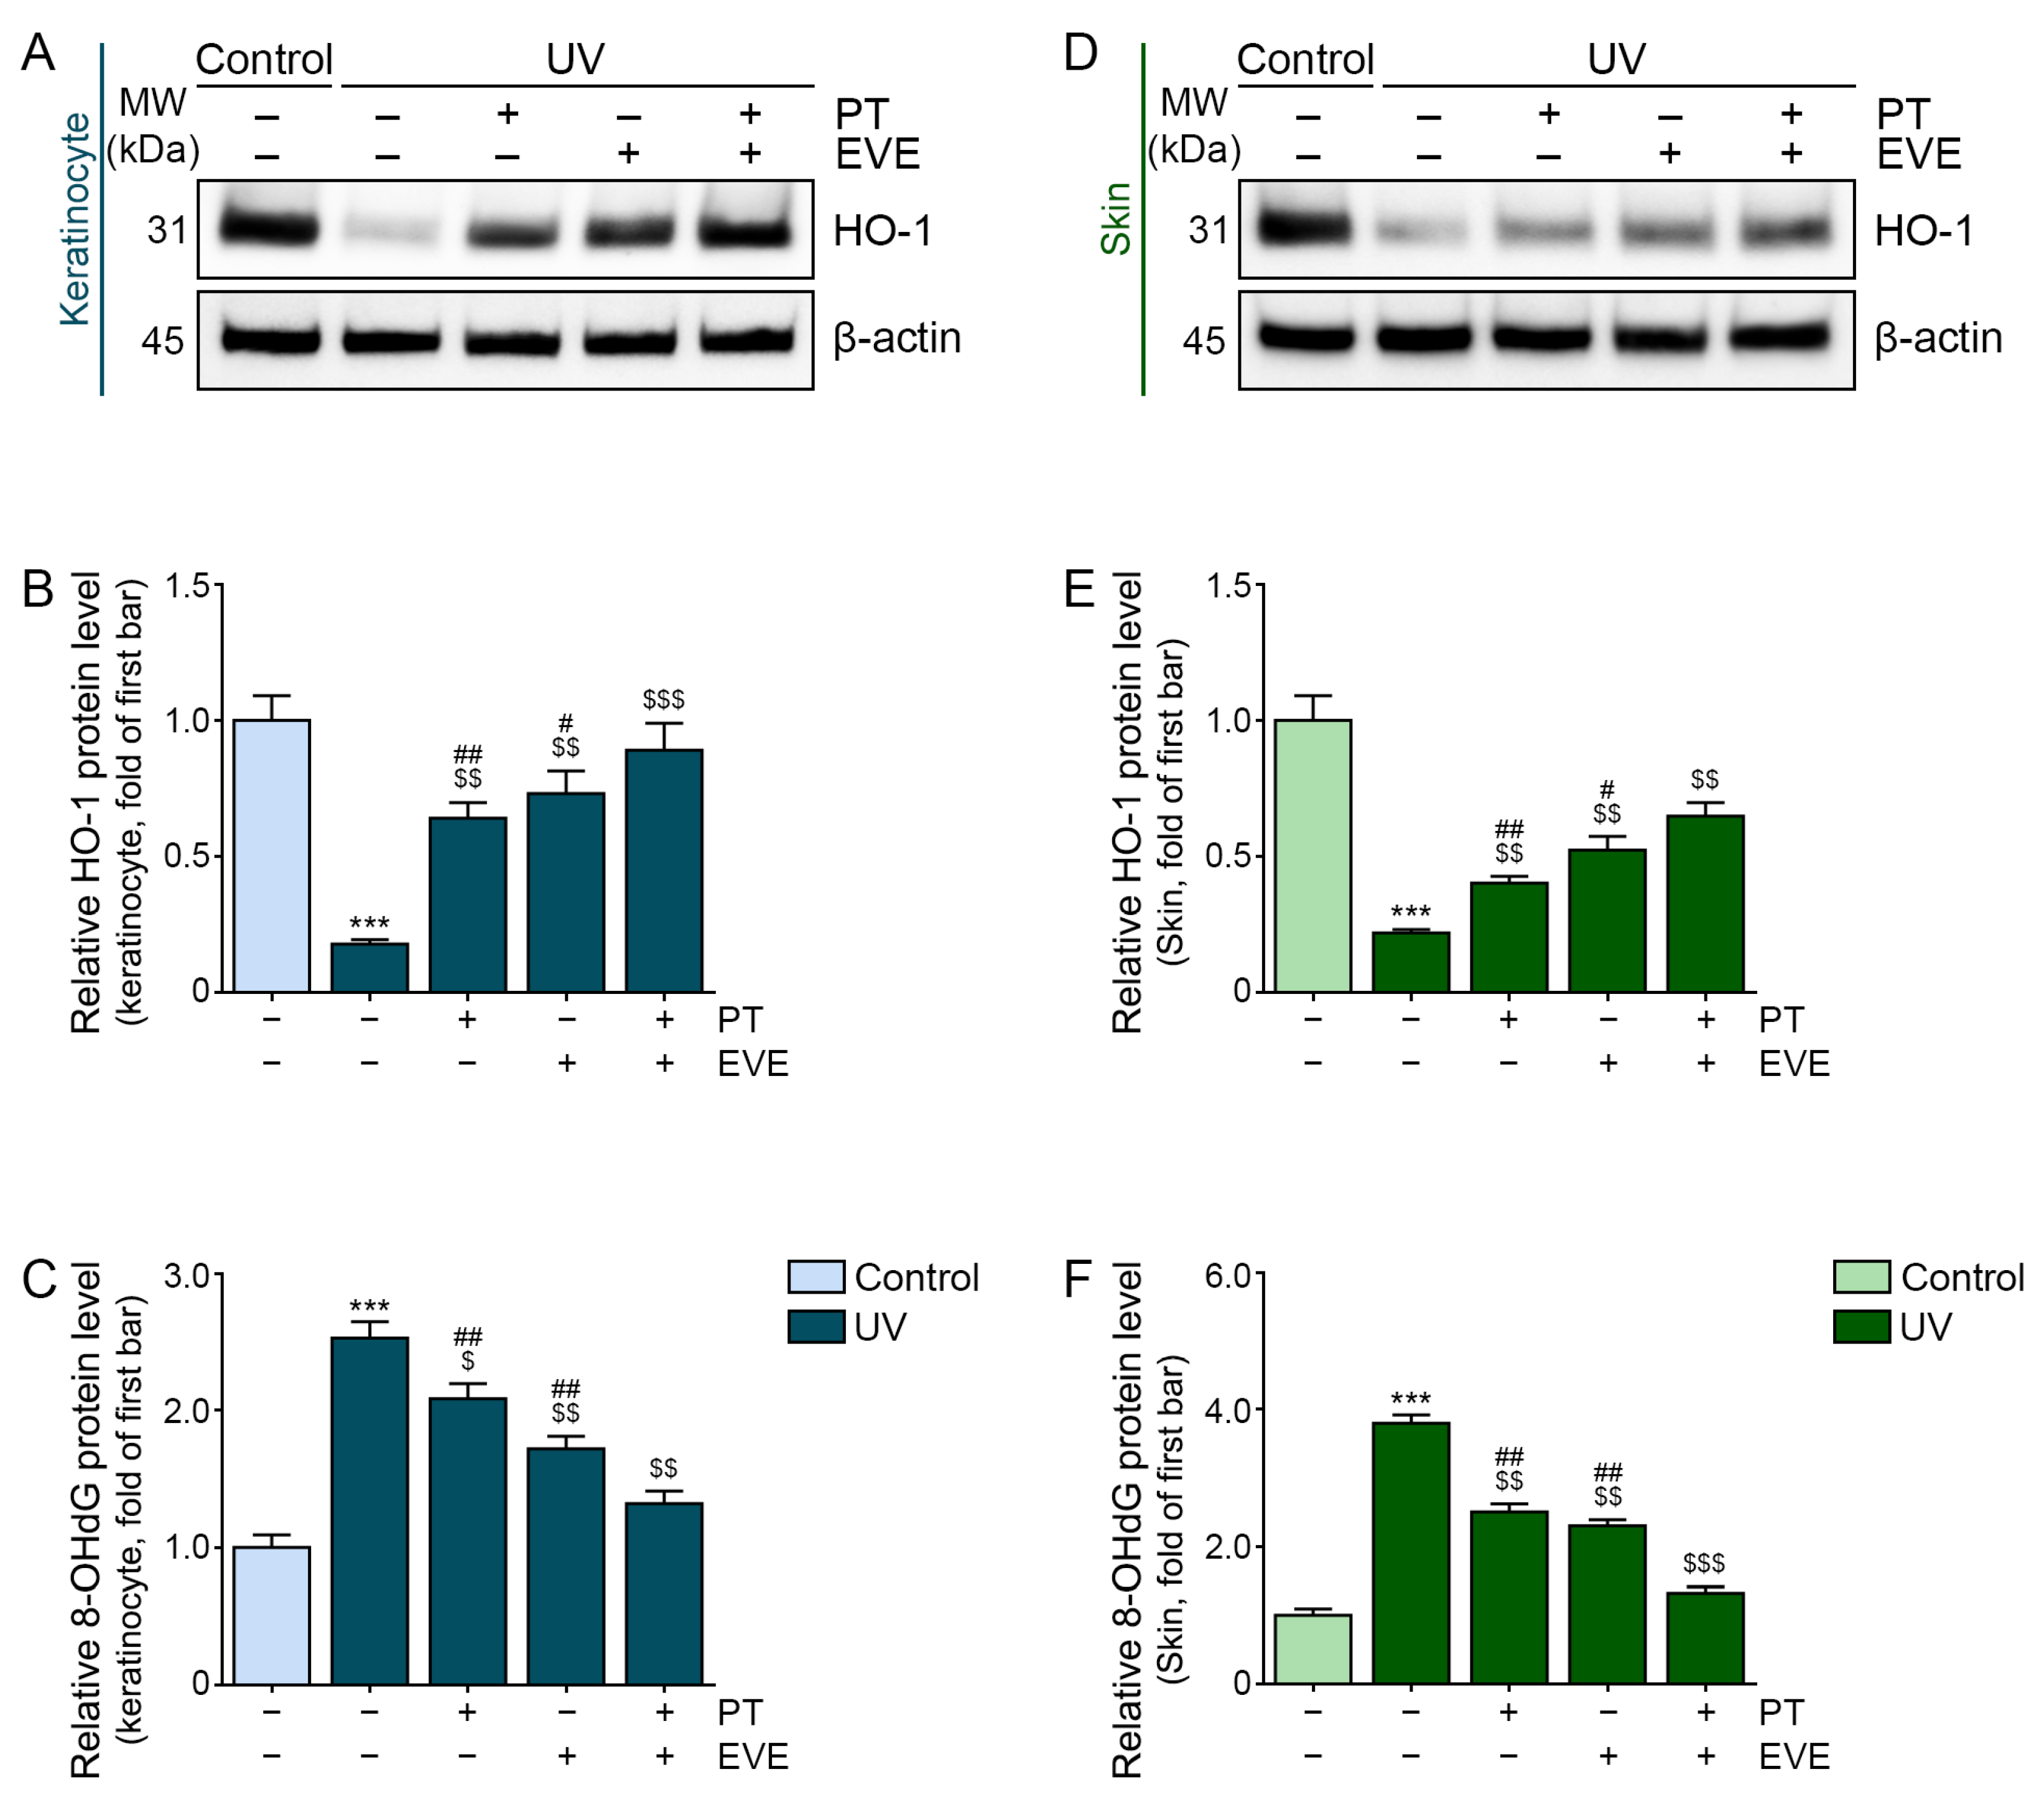
Abstract
:1. Introduction
2. Materials and Methods
2.1. PT Preparation
2.2. EVE Preparation and Analysis
2.2.1. EVE Preparation
2.2.2. Nanoparticle-Tracking Analysis
2.3. In Vitro Experiments
2.3.1. Cell Culture
2.3.2. Experimental Design
2.4. In Vivo Experiments
2.4.1. Mouse Model and Maintenance
2.4.2. Experimental Design
2.4.3. Skin Lightness
2.5. Sample Preparation
2.5.1. Transmission Electron Microscopy (TEM)
2.5.2. RNA Extraction
2.5.3. cDNA Synthesis
2.5.4. Protein Isolation
2.5.5. Co-Immunoprecipitation (Co-IP)
2.5.6. Paraffin-Embedded Skin Tissue Block
2.6. TEM
2.7. Cell Proliferation and Cell Viability
2.8. Quantitative Reverse Transcription–Polymerase Chain Reaction (qRT-PCR)
2.9. Western Blot
2.10. Enzyme-Linked Immunosorbent Assay (ELISA)
2.11. Co-IP
2.12. Staining
2.12.1. Immunohistochemistry
2.12.2. Fontana Masson
2.13. Statistical Analysis
3. Results
3.1. Characterization of EVE and PT Solutions
3.2. EVE Reduced the Expression of the Alpha-Melanocyte Stimulating Hormone (α-MSH) in Keratinocytes without Cytotoxicity
3.3. PT and EVE Reduced Oxidative Stress in UV-Exposed Keratinocytes and Animal Skin
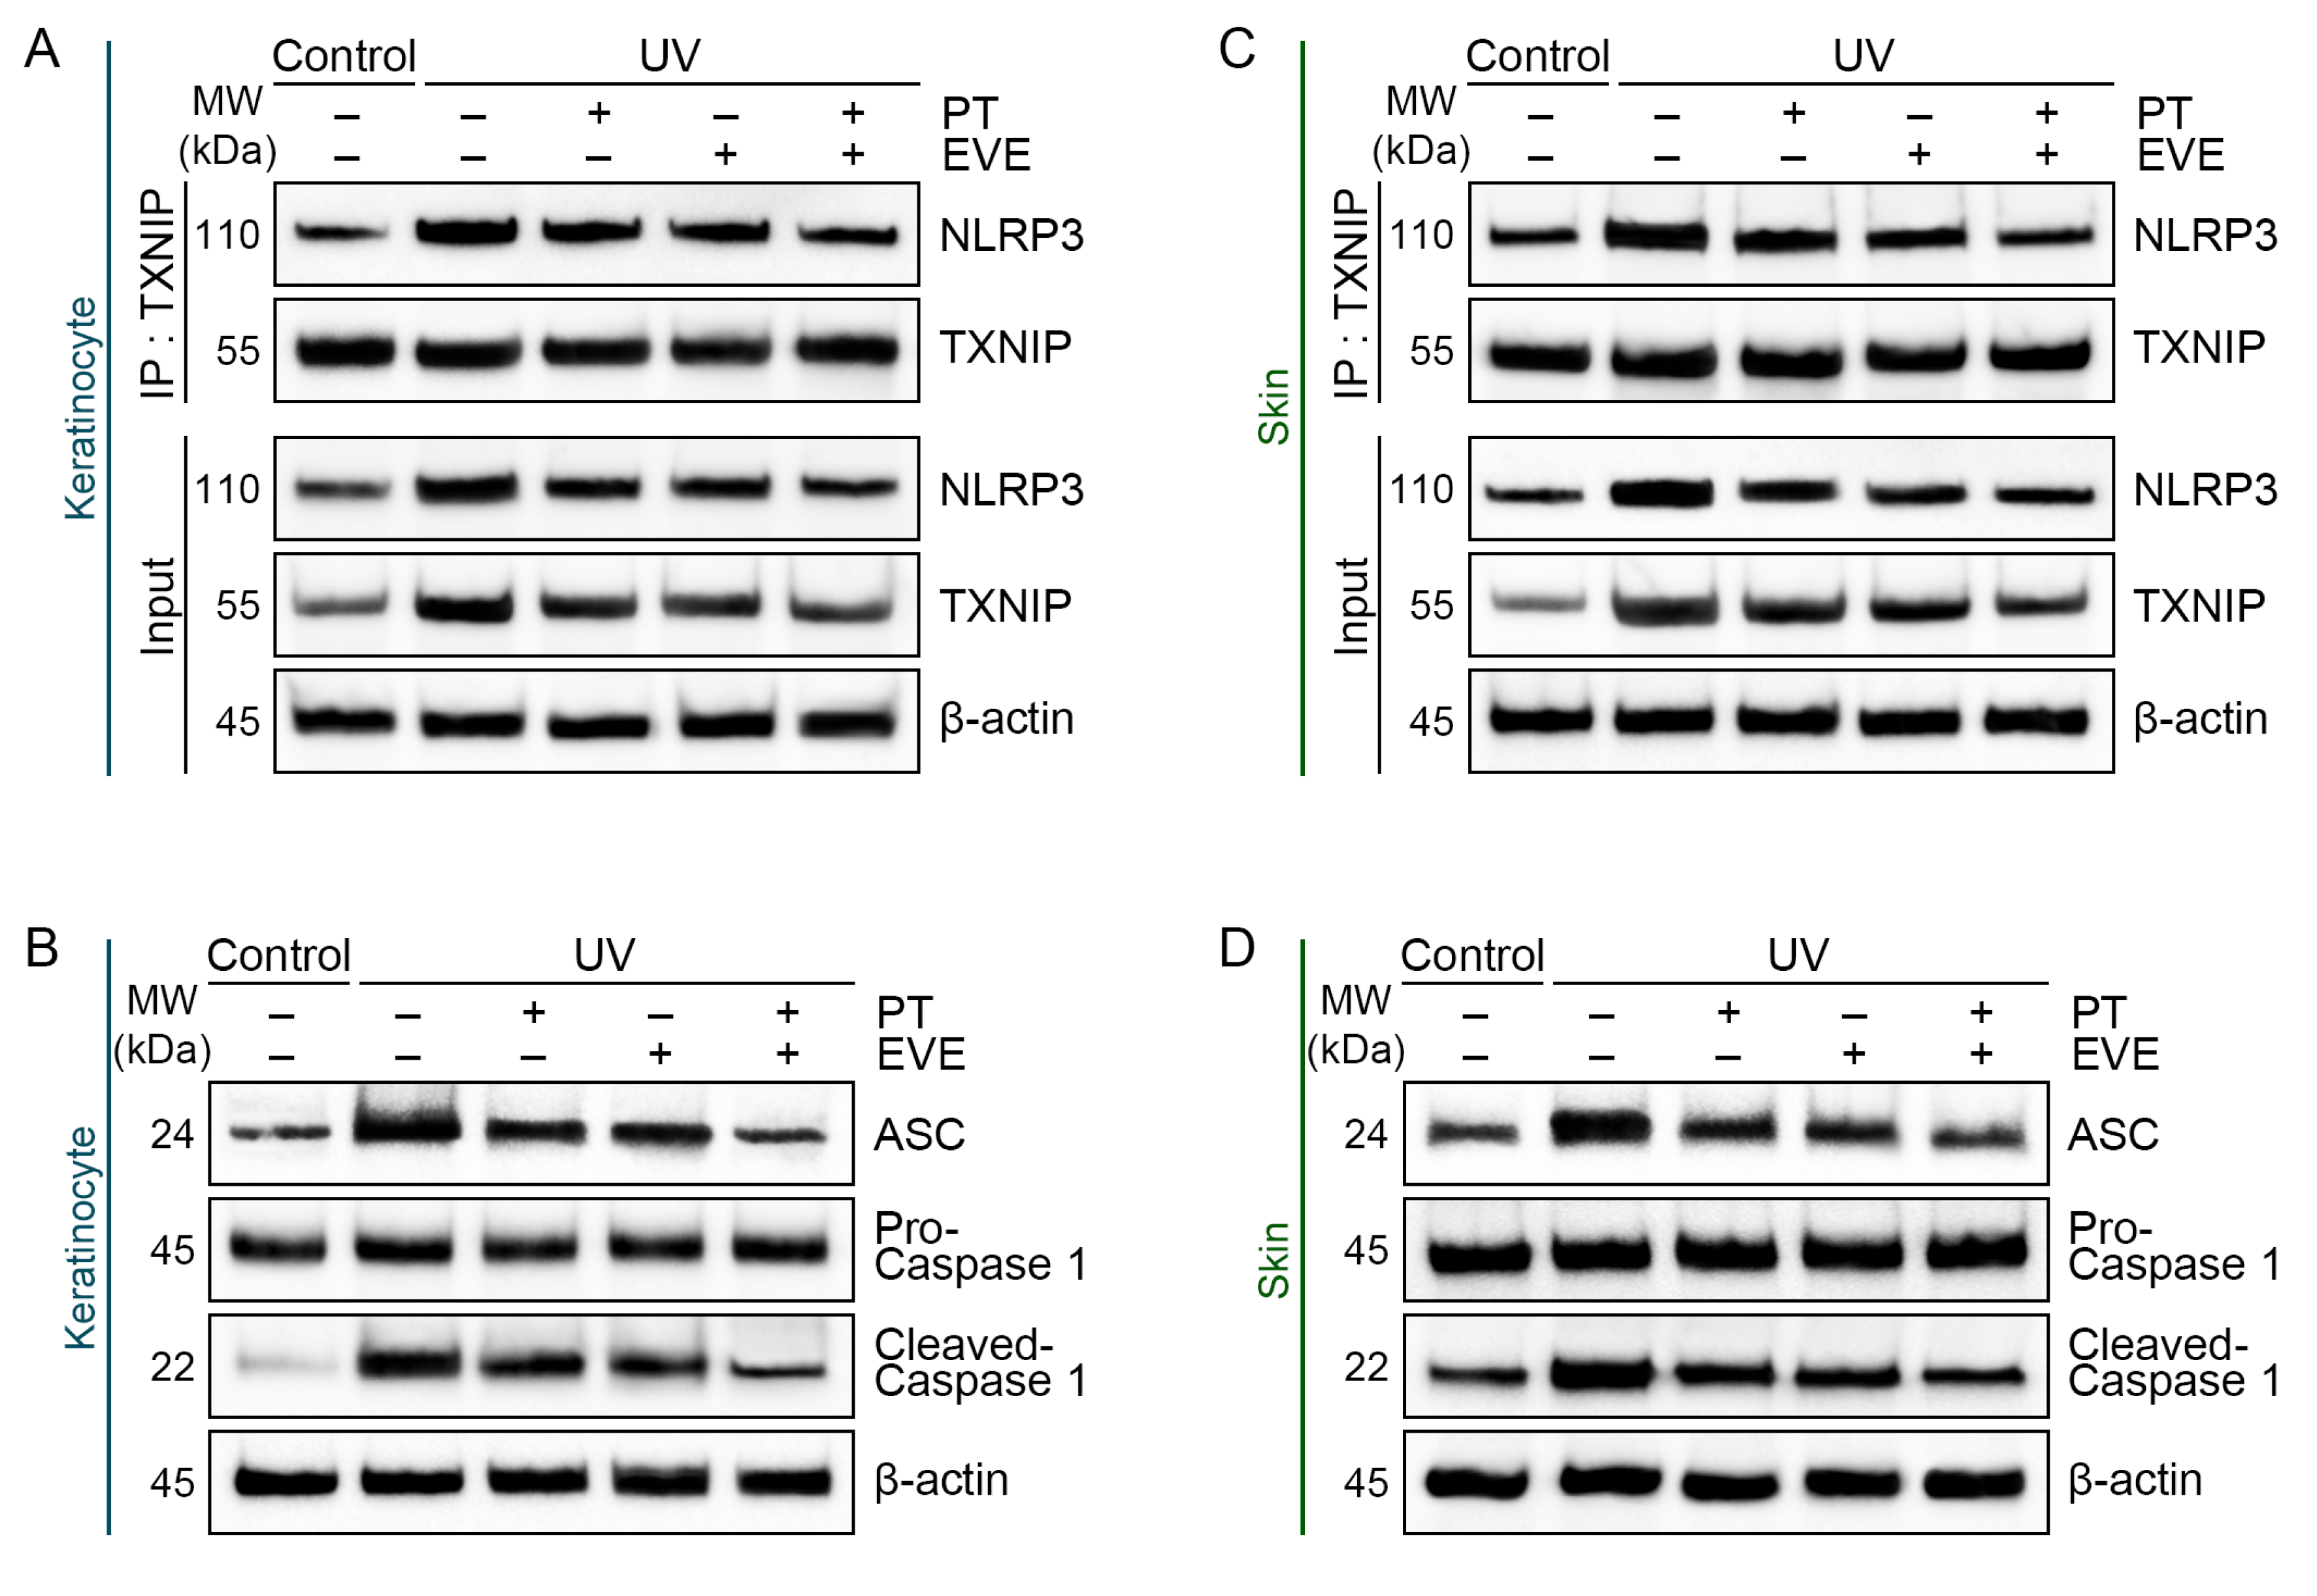
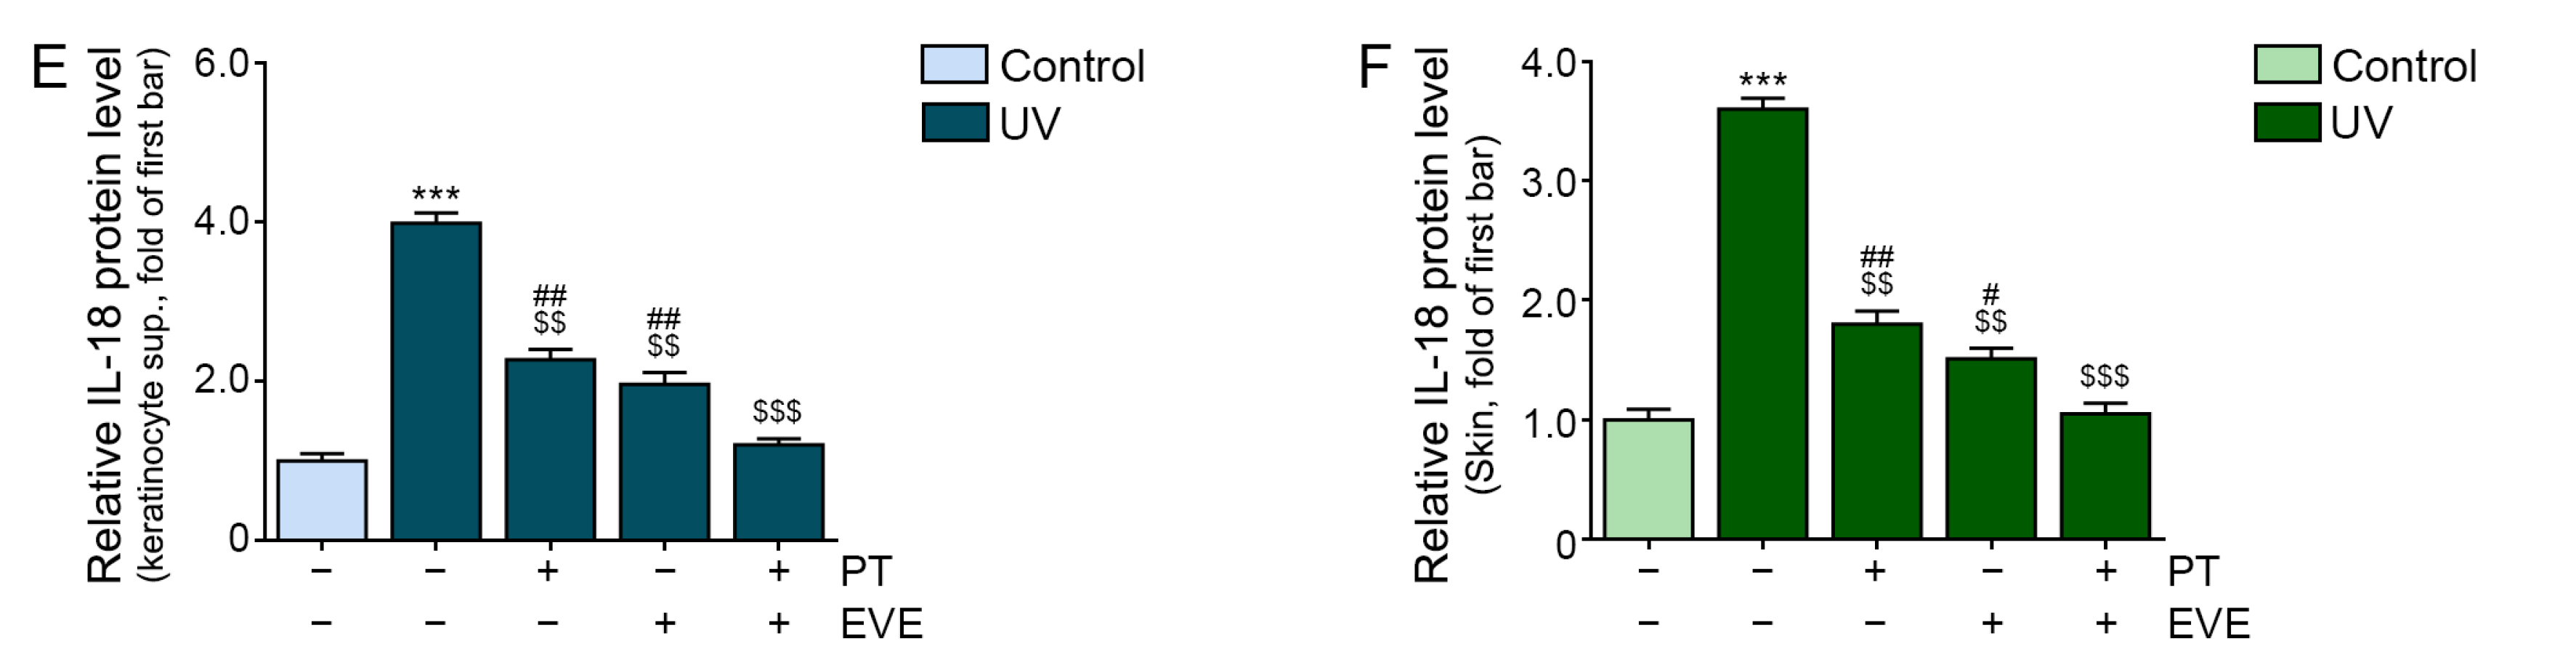
3.4. PT and EVE Reduced NLRP3 and IL-18 Levels in UV-Exposed Keratinocytes and Animal Skin
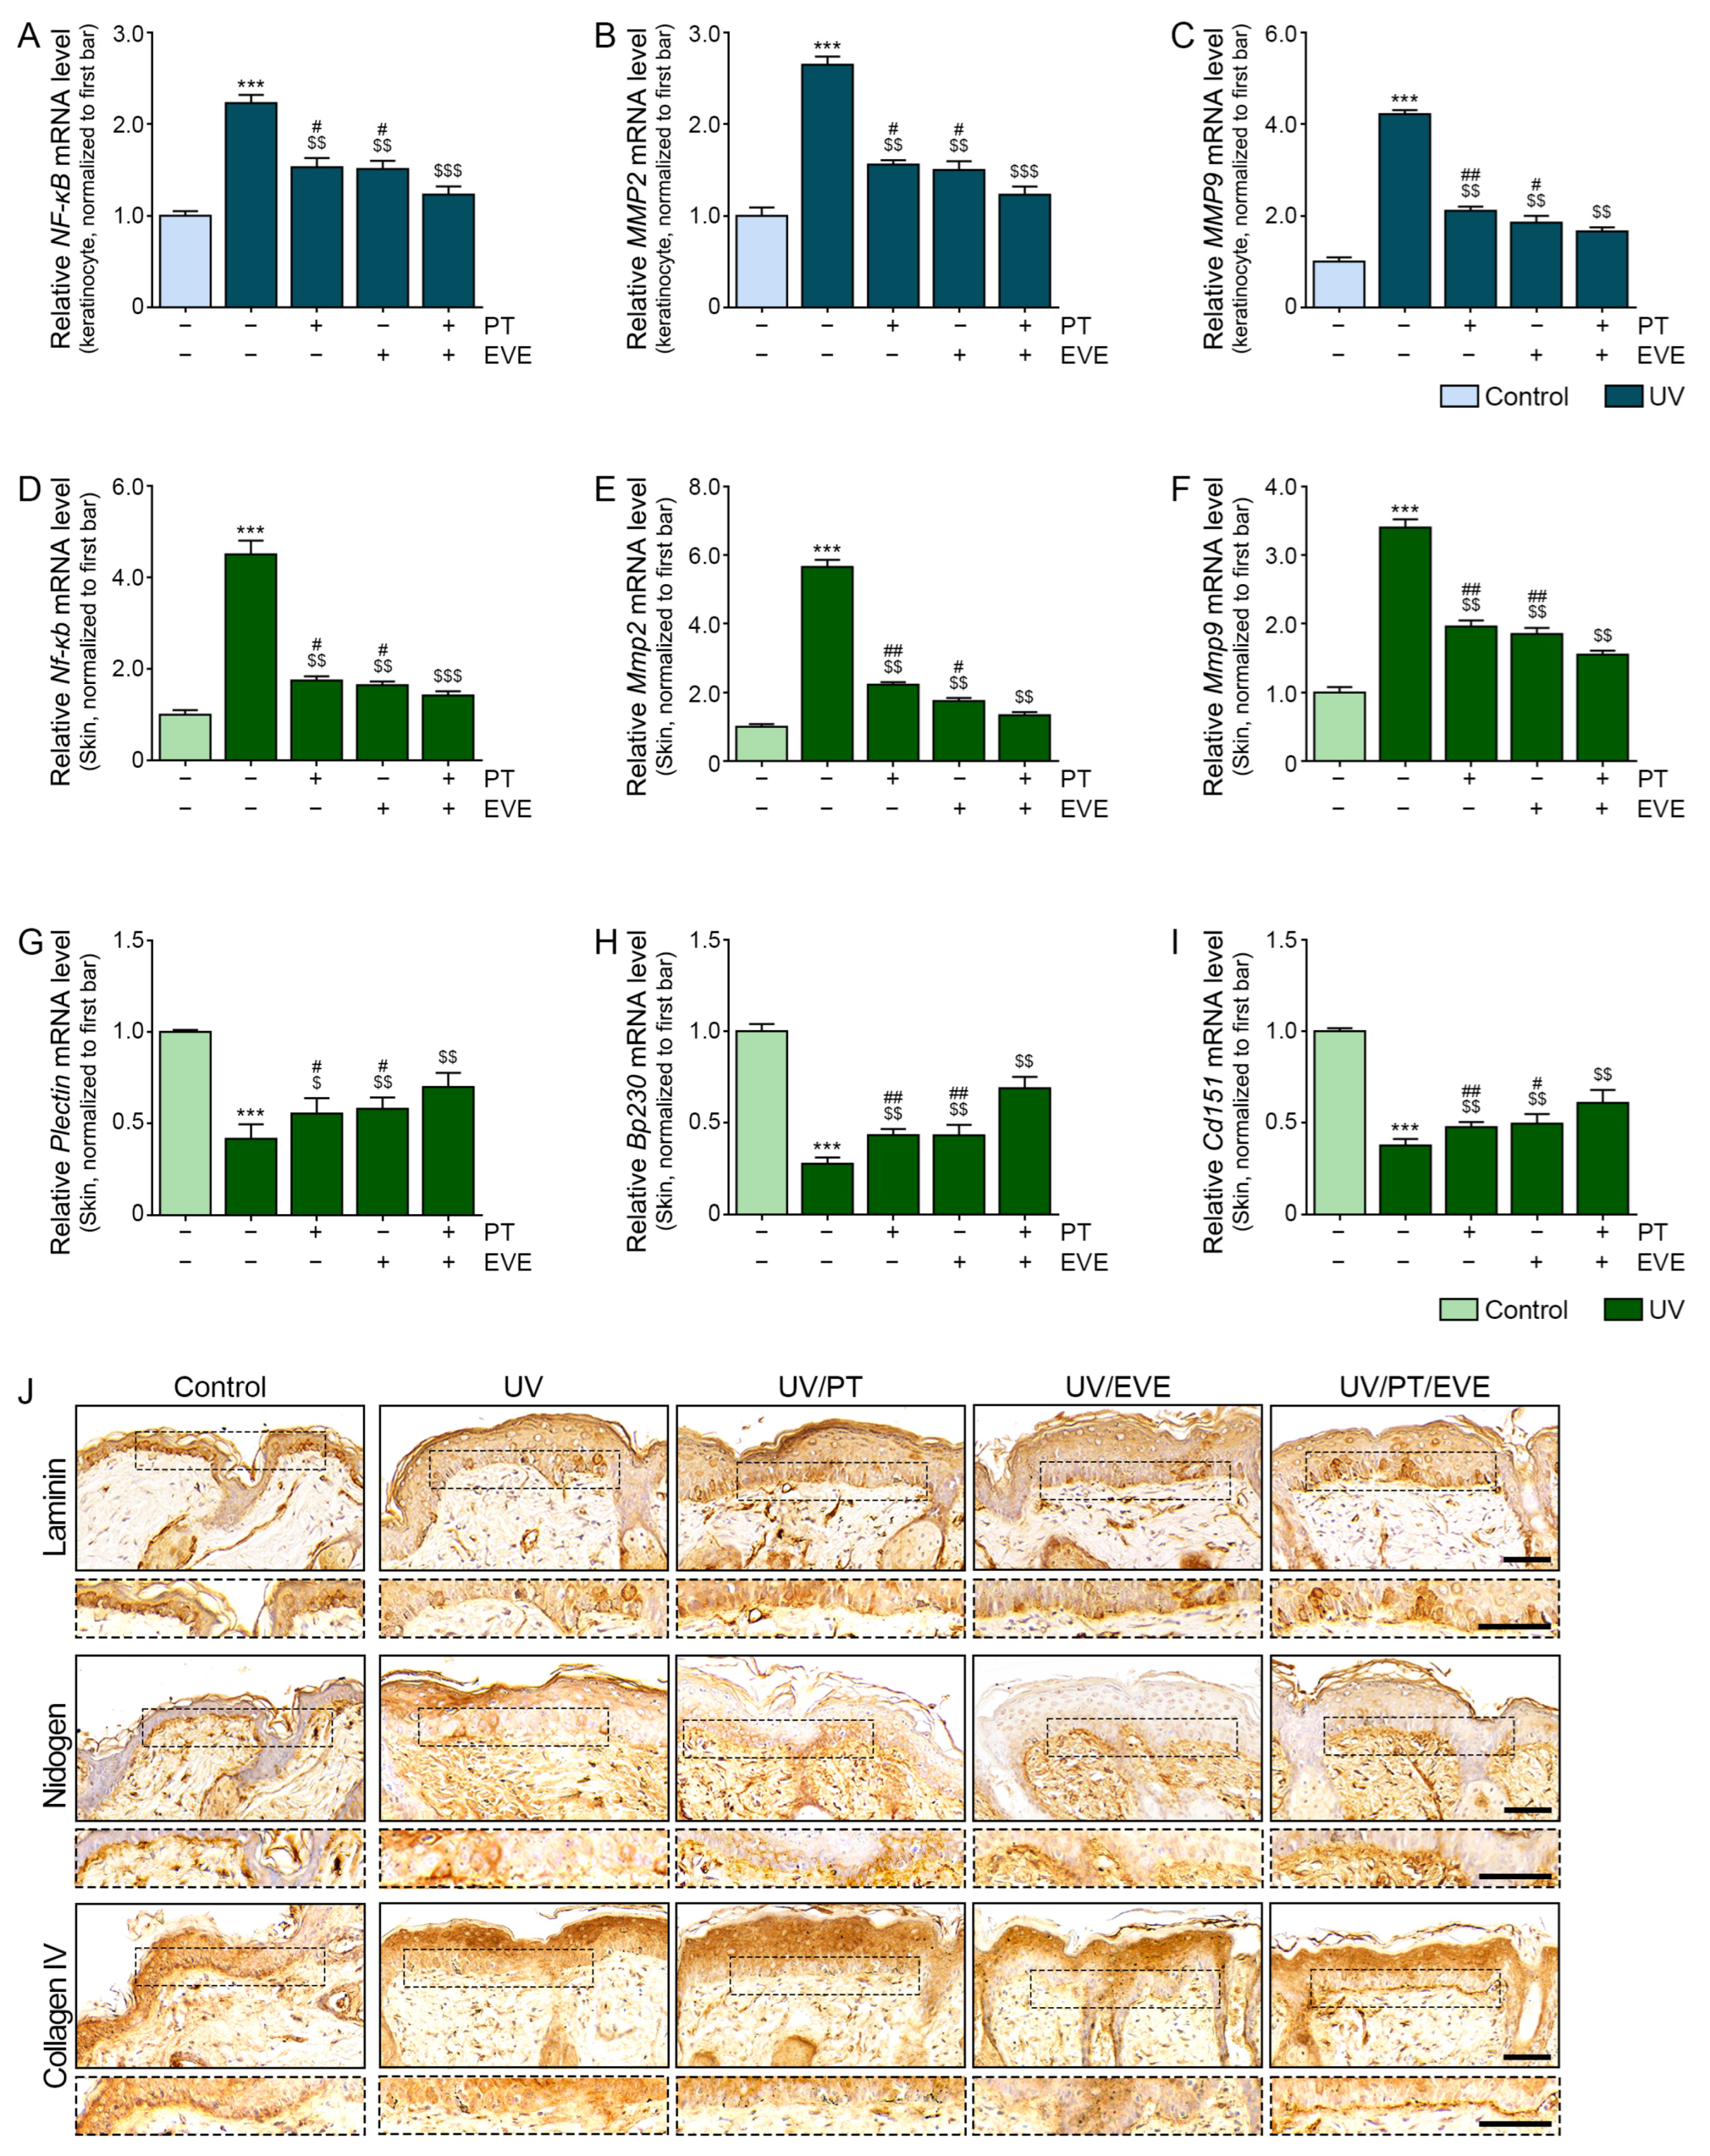
3.5. PT and EVE Reduced Expression of NF-κB and MMPs in UV-Exposed Keratinocytes and Animal Skin
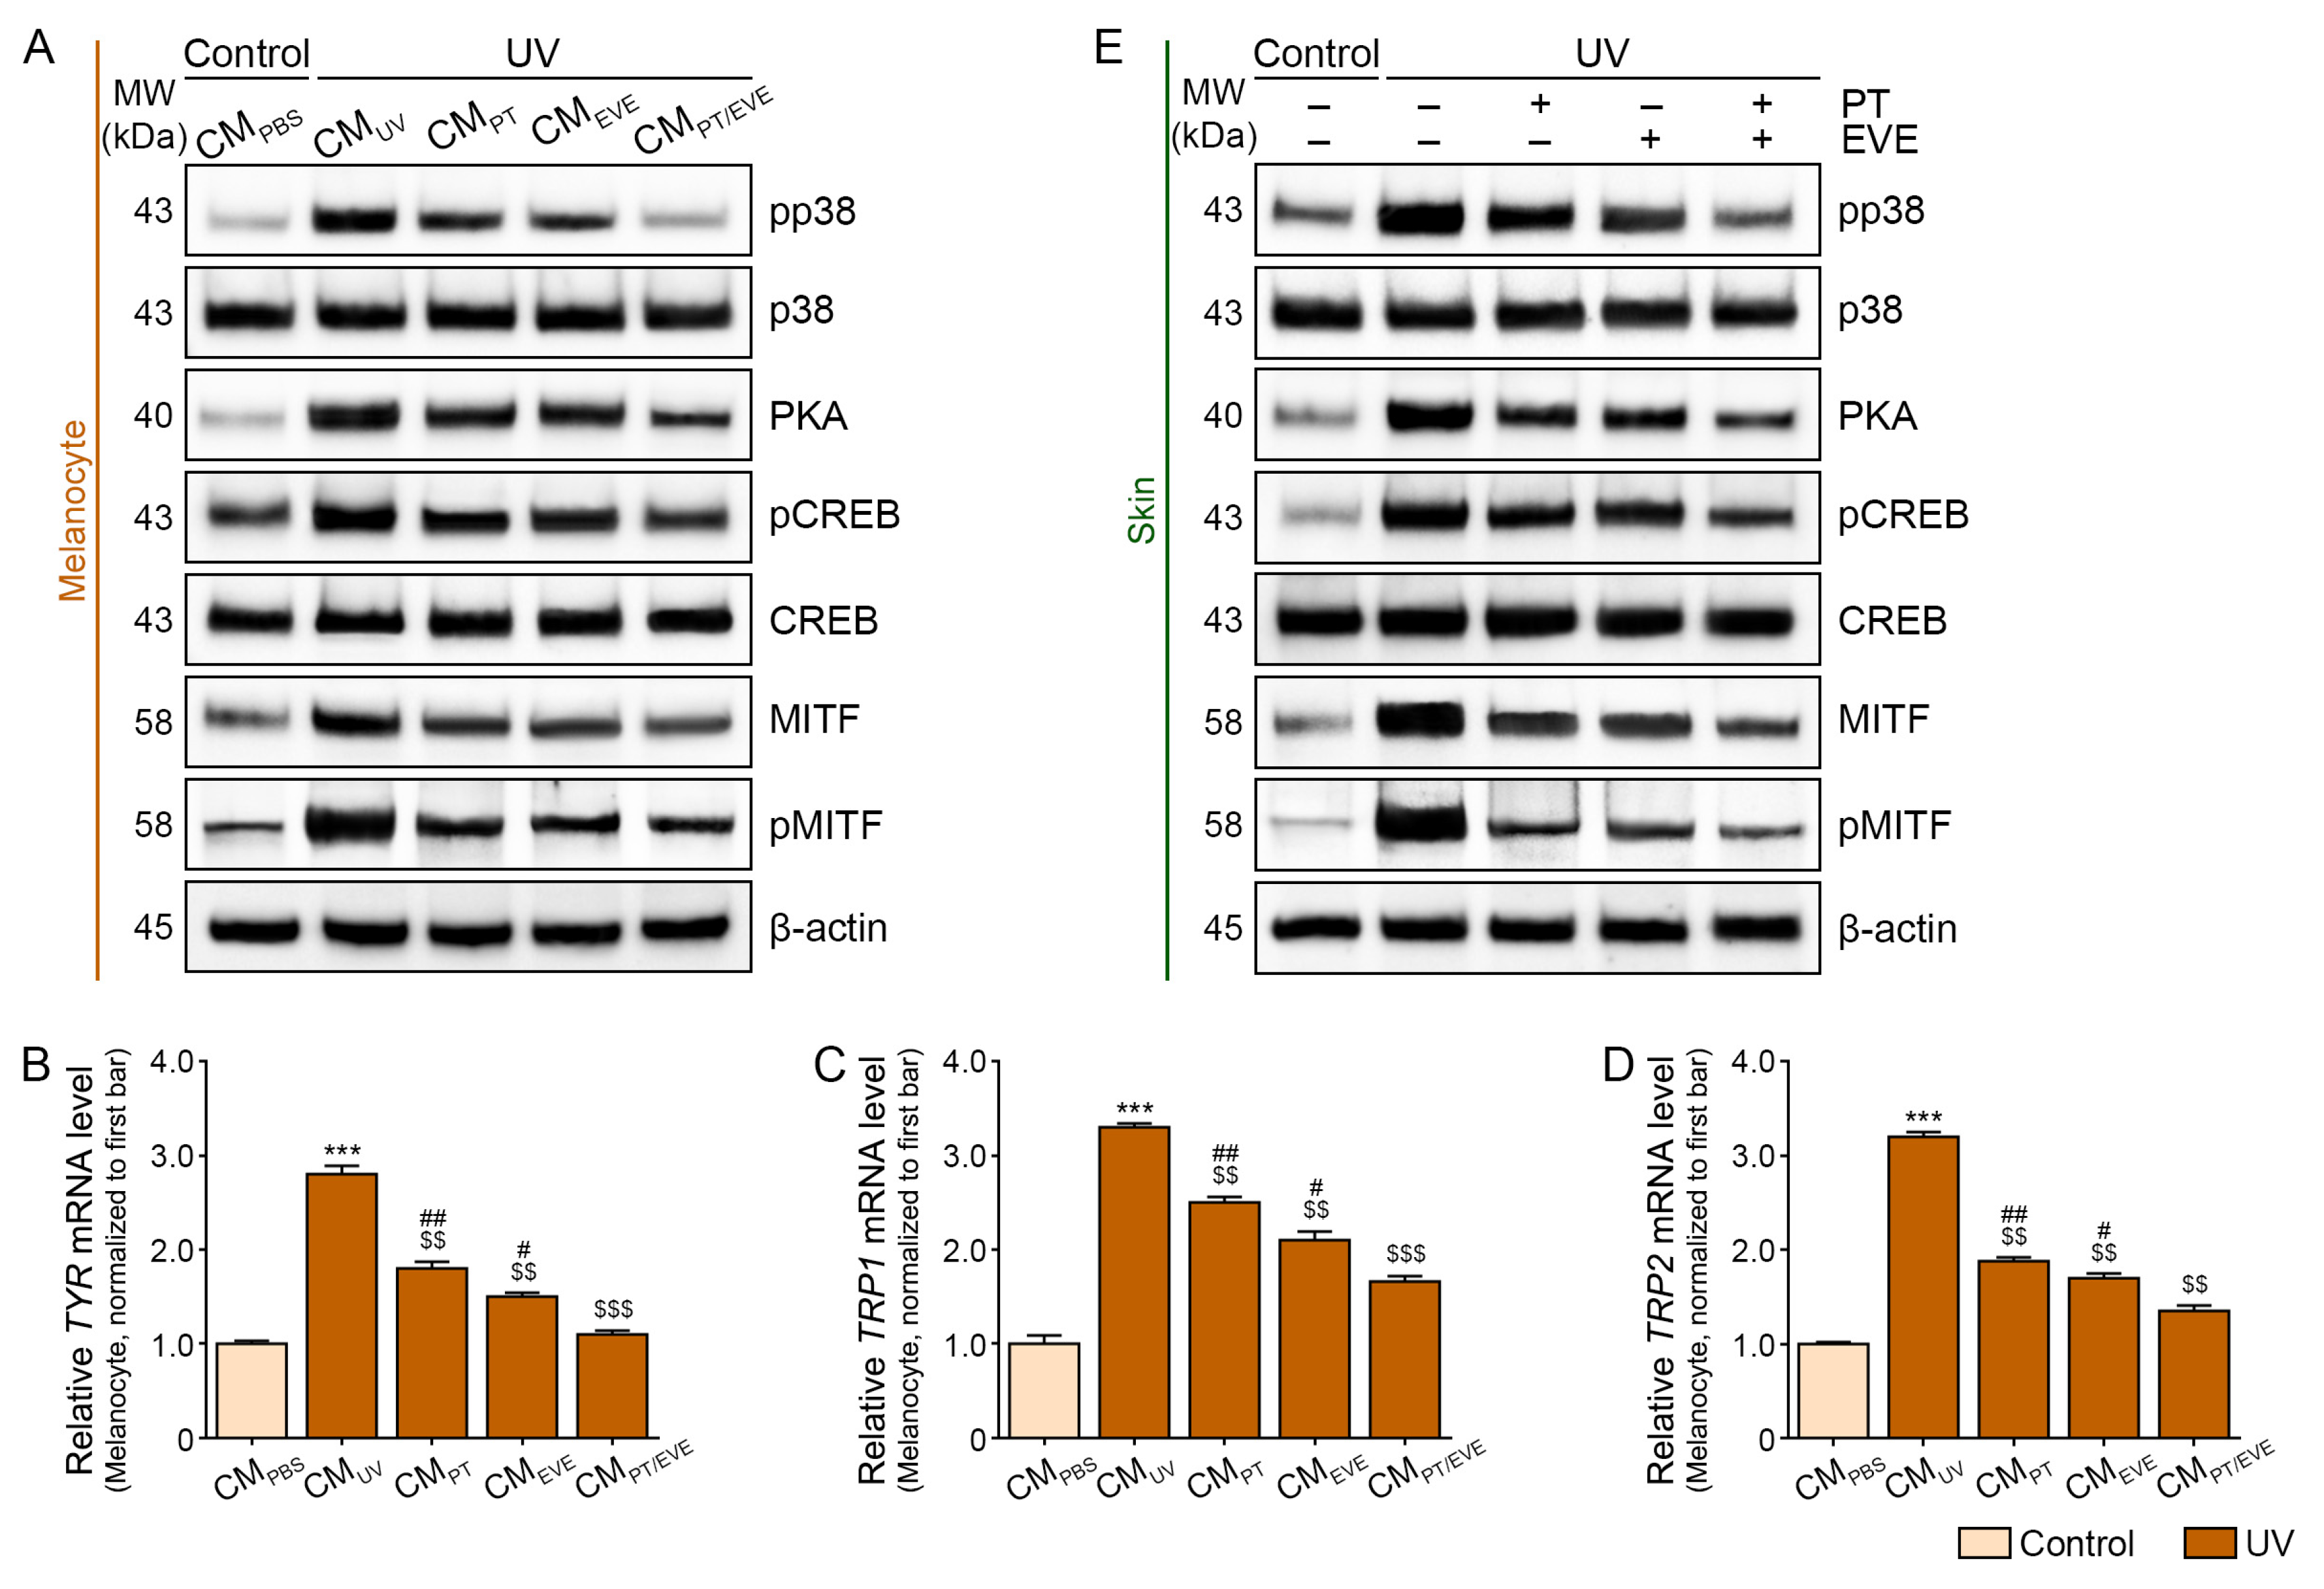
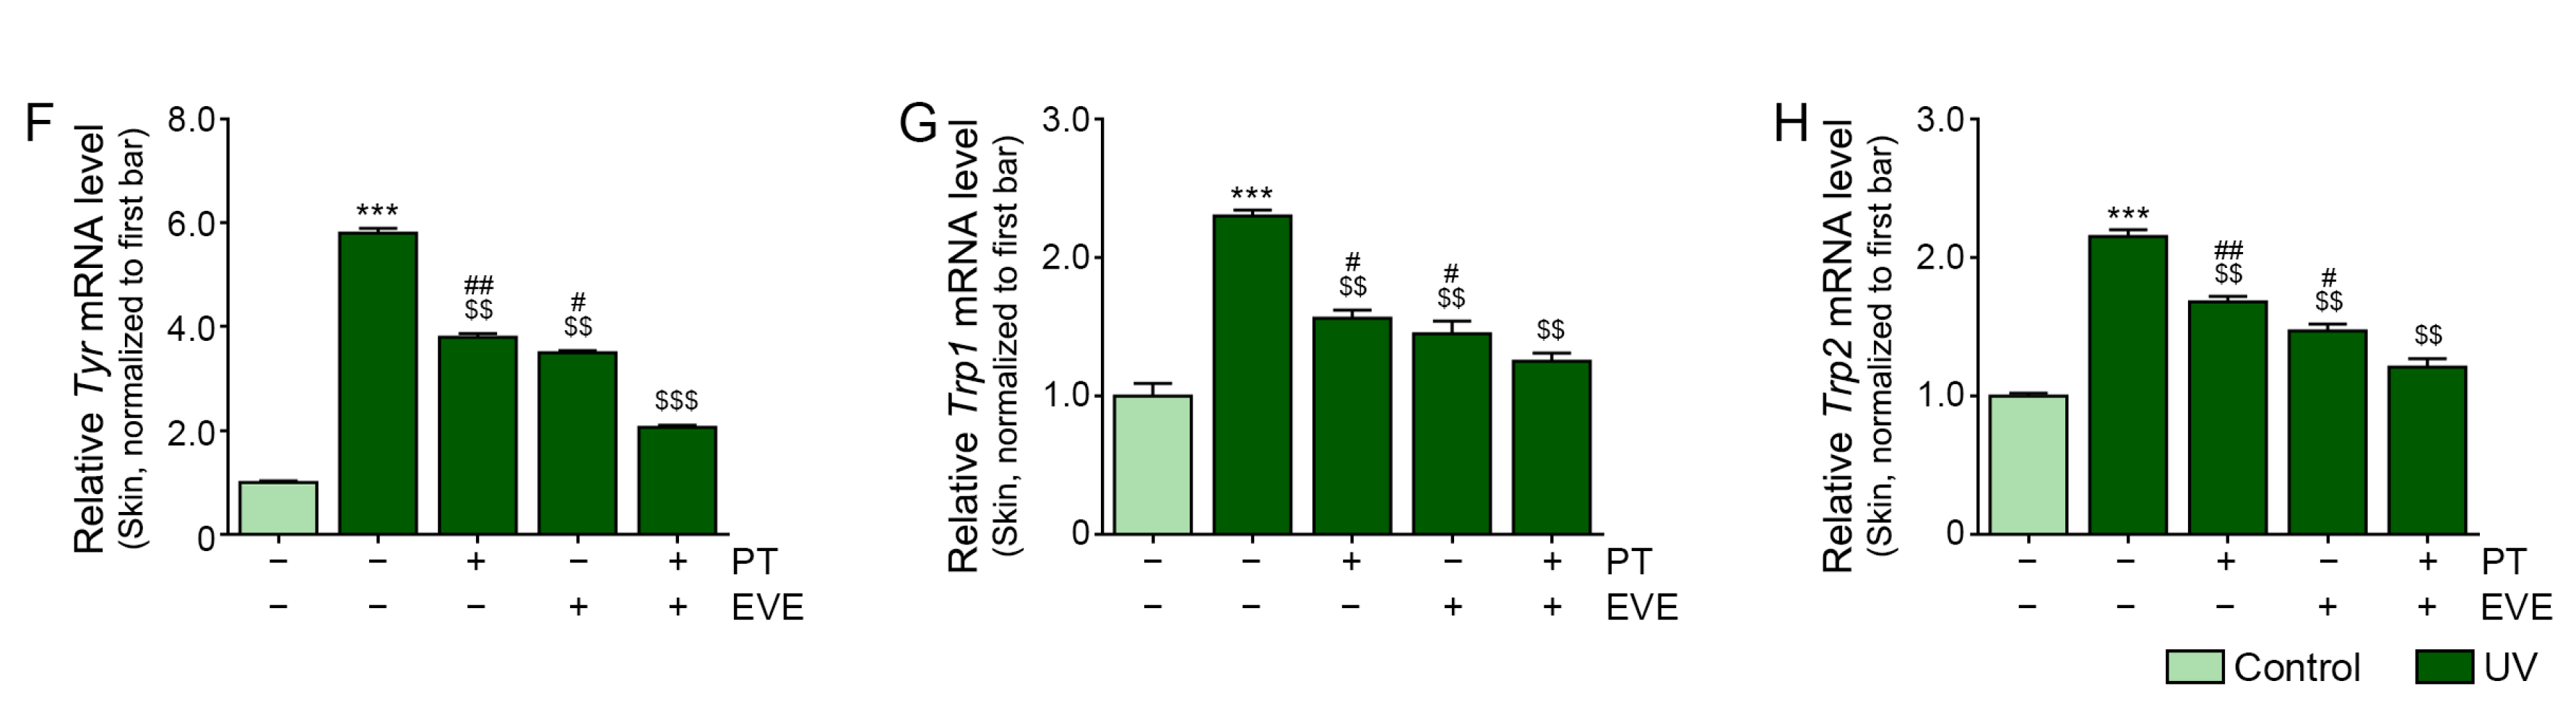
3.6. PT and EVE Reduced Melanogenesis Pathway Signals in Melanocytes and UV-Exposed Animal Skin
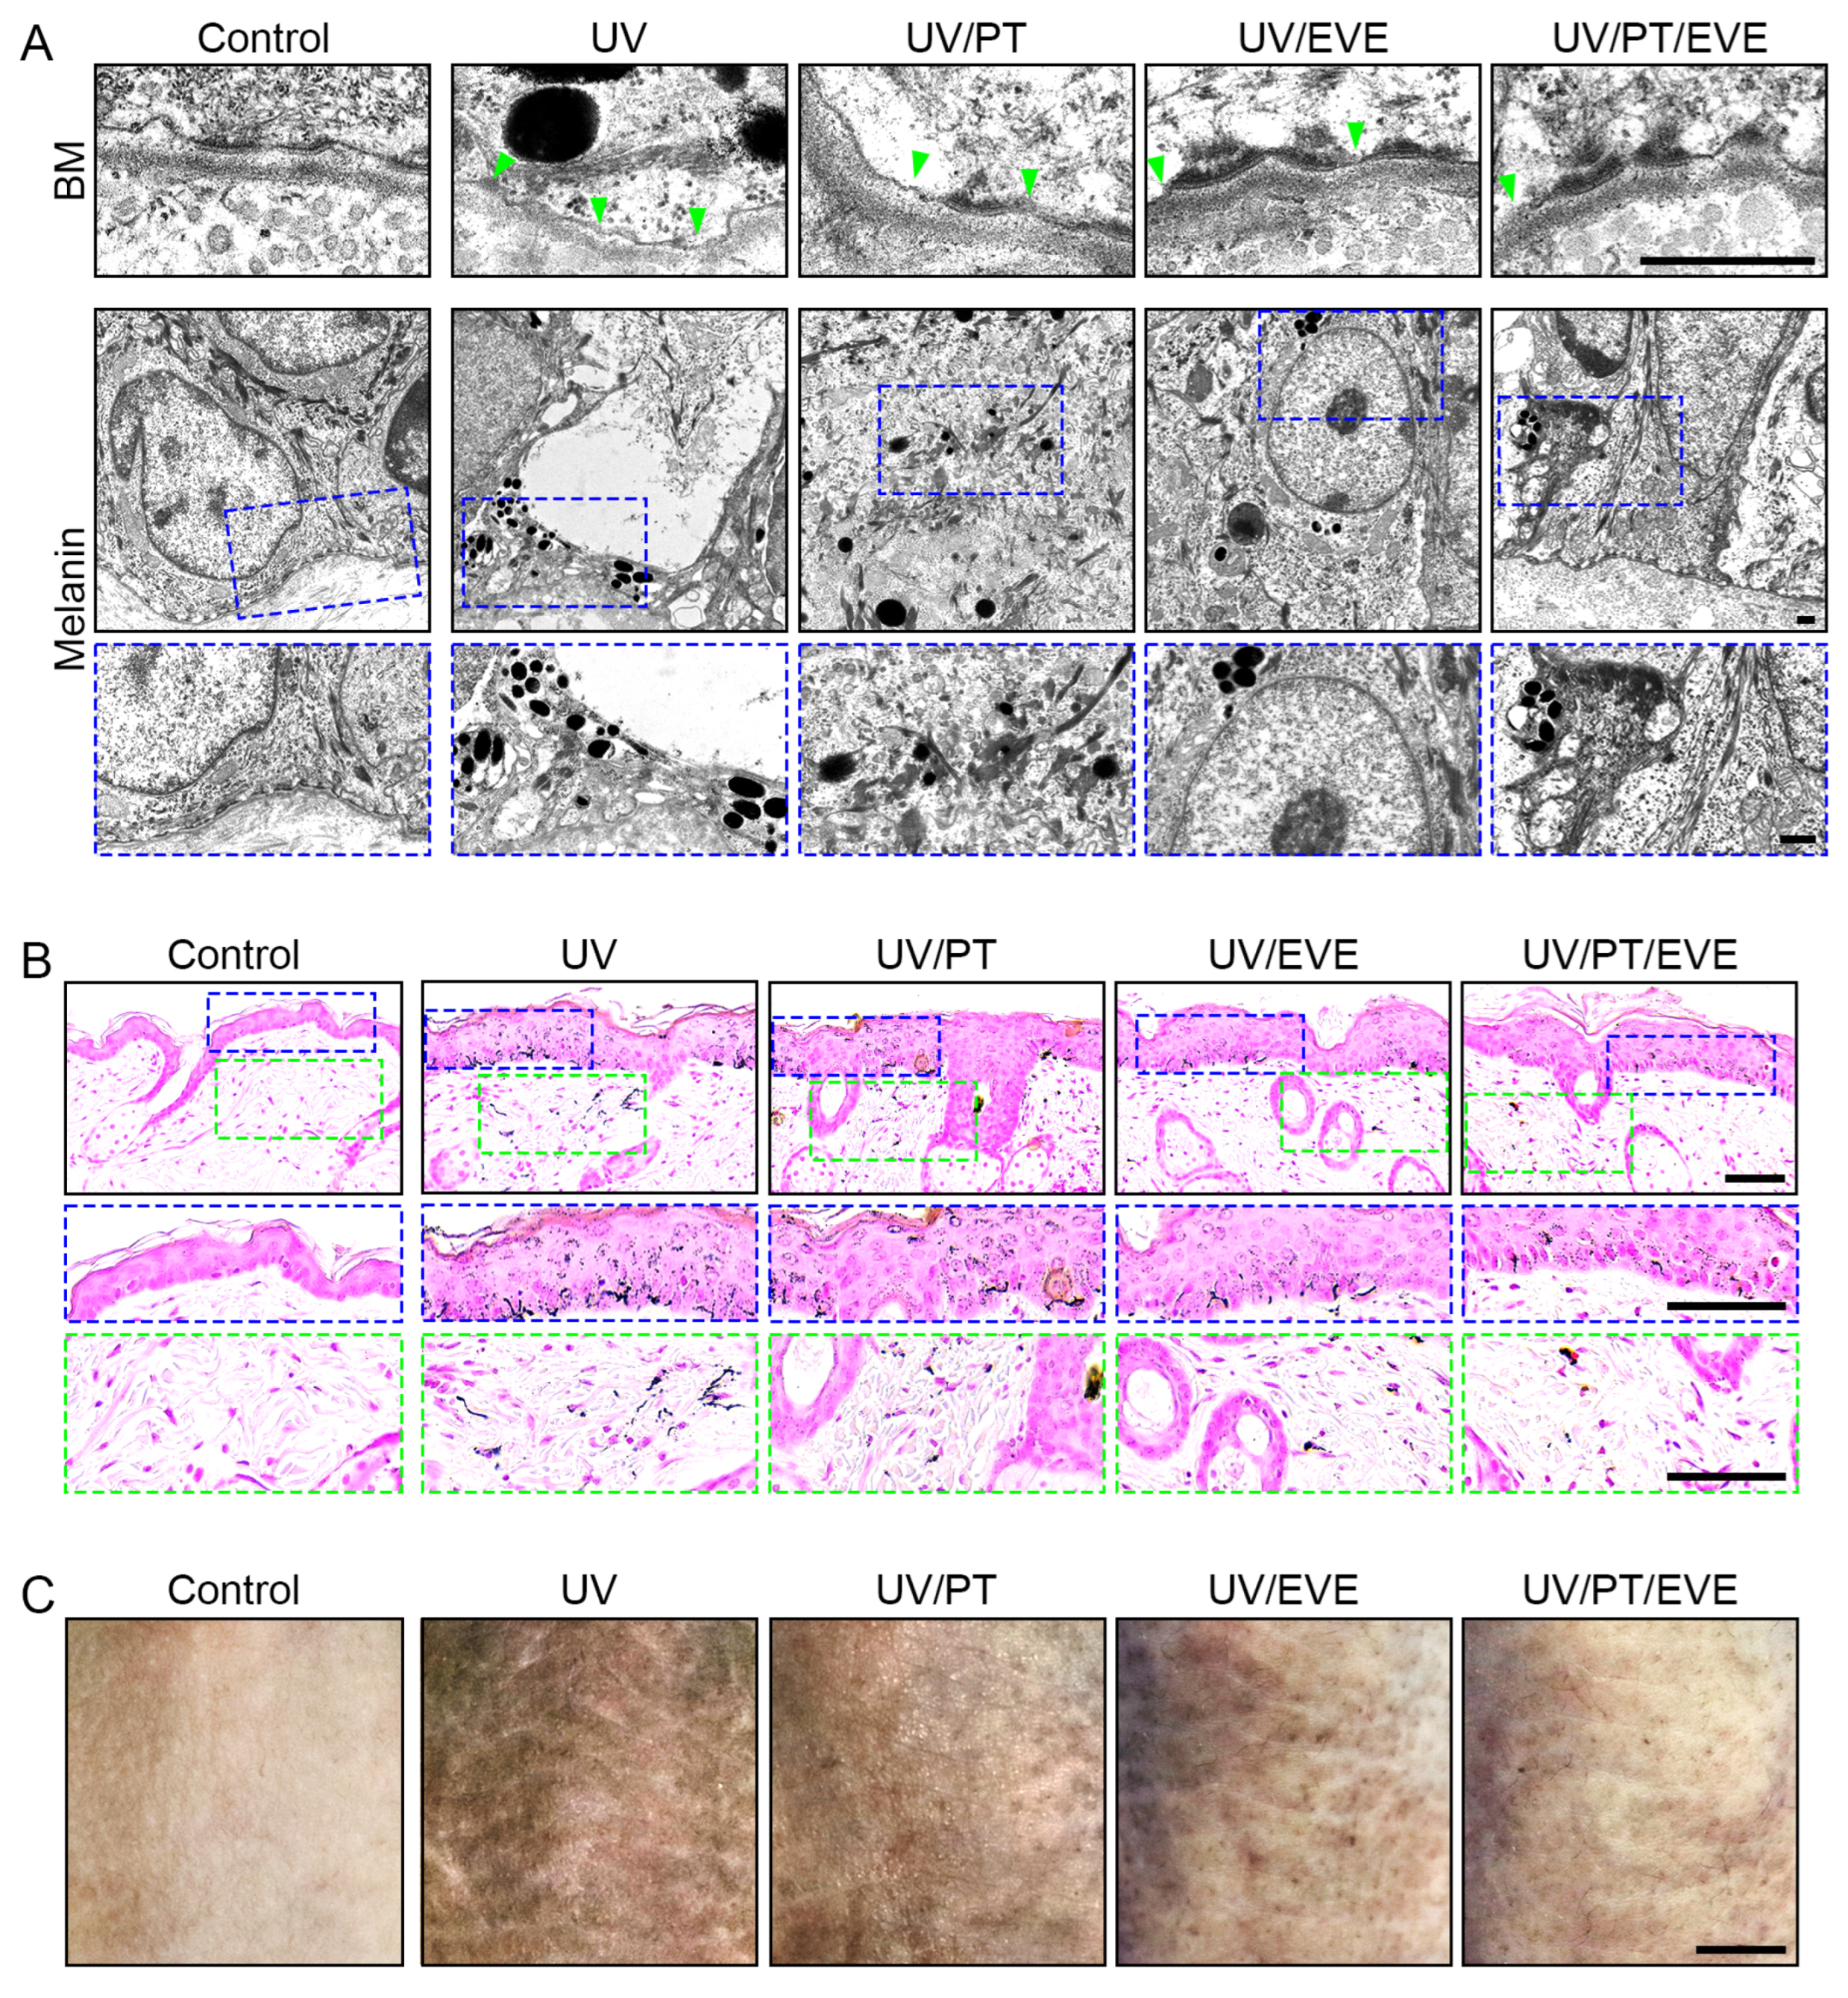
3.7. PT and EVE Reduced Melanin Accumulation in UV-Exposed Animal Skin
4. Discussion
5. Conclusions
Supplementary Materials
Author Contributions
Funding
Institutional Review Board Statement
Data Availability Statement
Acknowledgments
Conflicts of Interest
References
- Cabaço, L.C.; Tomás, A.; Pojo, M.; Barral, D.C. The Dark Side of Melanin Secretion in Cutaneous Melanoma Aggressiveness. Front. Oncol. 2022, 12, 887366. [Google Scholar] [CrossRef]
- Murase, D.; Hachiya, A.; Amano, Y.; Ohuchi, A.; Kitahara, T.; Takema, Y. The essential role of p53 in hyperpigmentation of the skin via regulation of paracrine melanogenic cytokine receptor signaling. J. Biol. Chem. 2009, 284, 4343–4353. [Google Scholar] [CrossRef]
- Costin, G.E.; Hearing, V.J. Human skin pigmentation: Melanocytes modulate skin color in response to stress. FASEB J. 2007, 21, 976–994. [Google Scholar] [CrossRef]
- Videira, I.F.; Moura, D.F.; Magina, S. Mechanisms regulating melanogenesis. An. Bras. Dermatol. 2013, 88, 76–83. [Google Scholar] [CrossRef]
- Yamaguchi, Y.; Brenner, M.; Hearing, V.J. The regulation of skin pigmentation. J. Biol. Chem. 2007, 282, 27557–27561. [Google Scholar] [CrossRef] [PubMed]
- Satomi, H.; Wang, B.; Fujisawa, H.; Otsuka, F. Interferon-beta from melanoma cells suppresses the proliferations of melanoma cells in an autocrine manner. Cytokine 2002, 18, 108–115. [Google Scholar] [CrossRef]
- Mattei, S.; Colombo, M.P.; Melani, C.; Silvani, A.; Parmiani, G.; Herlyn, M. Expression of cytokine/growth factors and their receptors in human melanoma and melanocytes. Int. J. Cancer 1994, 56, 853–857. [Google Scholar] [CrossRef] [PubMed]
- Zhou, J.; Shang, J.; Song, J.; Ping, F. Interleukin–18 augments growth ability of primary human melanocytes by PTEN inactivation through the AKT/NF-κB pathway. Int. J. Biochem. Cell Biol. 2013, 45, 308–316. [Google Scholar] [CrossRef] [PubMed]
- Yun, W.; Li, C. JNK pathway is required for TNCB-induced IL-18 expression in murine keratinocytes. Toxicol. In Vitro 2010, 24, 1064–1069. [Google Scholar] [CrossRef]
- Wittmann, M.; Macdonald, A.; Renne, J. IL-18 and skin inflammation. Autoimmun. Rev. 2009, 9, 45–48. [Google Scholar] [CrossRef]
- Zhou, J.; Ling, J.; Wang, Y.; Shang, J.; Ping, F. Cross–talk between interferon-gamma and interleukin-18 in melanogenesis. J. Photochem. Photobiol. B 2016, 163, 133–143. [Google Scholar] [CrossRef]
- Bitto, A.; Altavilla, D.; Pizzino, G.; Irrera, N.; Pallio, G.; Colonna, M.R.; Squadrito, F. Inhibition of inflammasome activation improves the impaired pattern of healing in genetically diabetic mice Br. J. Pharmacol. 2014, 171, 2300–2307. [Google Scholar]
- Schroder, K.; Zhou, R.; Tschopp, J. The NLRP3 inflammasome: A sensor for metabolic danger? Science 2010, 327, 296–300. [Google Scholar] [CrossRef]
- Feng, H.; Gu, J.; Gou, F.; Huang, W.; Gao, C.; Chen, G.; Long, Y.; Zhou, X.; Yang, M.; Liu, S.; et al. High Glucose and Lipopolysaccharide Prime NLRP3 Inflammasome via ROS/TXNIP Pathway in Mesangial Cells. J. Diabetes Res. 2016, 2016, 6973175. [Google Scholar] [CrossRef]
- Lee, M.S. Role of innate immunity in diabetes and metabolism: Recent progress in the study of inflammasomes. Immune Netw. 2011, 11, 95–99. [Google Scholar] [CrossRef]
- Gao, P.; He, F.F.; Tang, H.; Lei, C.T.; Chen, S.; Meng, X.F.; Su, H.; Zhang, C. NADPH oxidase-induced NALP3 inflammasome activation is driven by thioredoxin-interacting protein which contributes to podocyte injury in hyperglycemia. J. Diabetes Res. 2015, 2015, 504761. [Google Scholar] [CrossRef]
- Zhou, R.; Yazdi, A.S.; Menu, P.; Tschopp, J. A role for mitochondria in NLRP3 inflammasome activation. Nature 2011, 469, 221–225. [Google Scholar] [CrossRef]
- Yoshihara, E.; Masaki, S.; Matsuo, Y.; Chen, Z.; Tian, H.; Yodoi, J. Thioredoxin/Txnip: Redoxisome, as a redox switch for the pathogenesis of diseases. Front. Immunol. 2014, 4, 514. [Google Scholar] [CrossRef]
- Li, Y.; Yang, J.; Chen, M.H.; Wang, Q.; Qin, M.J.; Zhang, T.; Chen, X.Q.; Liu, B.L.; Wen, X.D. Ilexgenin A inhibits endoplasmic reticulum stress and ameliorates endothelial dysfunction via suppression of TXNIP/NLRP3 inflammasome activation in an AMPK dependent manner. Pharmacol. Res. 2015, 99, 101–115. [Google Scholar] [CrossRef]
- Saxena, G.; Chen, J.; Shalev, A. Intracellular shuttling and mitochondrial function of thioredoxin-interacting protein. J. Biol. Chem. 2010, 285, 3997–4005. [Google Scholar] [CrossRef]
- Patwari, P.; Lee, R.T. An expanded family of arrestins regulate metabolism. Trends Endocrinol. Metab. 2012, 23, 216–222. [Google Scholar] [CrossRef]
- Wang, Y.; De Keulenaer, G.W.; Lee, R.T. Vitamin D3-up-regulated protein-1 is a stress-responsive gene that regulates cardiomyocyte viability through interaction with thioredoxin. J. Biol. Chem. 2002, 277, 26496–26500. [Google Scholar] [CrossRef]
- Zhou, R.; Tardivel, A.; Thorens, B.; Choi, I.; Tschopp, J. Thioredoxin-interacting protein links oxidative stress to inflammasome activation. Nat. Immunol. 2010, 11, 136–140. [Google Scholar] [CrossRef]
- Abais, J.M.; Xia, M.; Li, G.; Chen, Y.; Conley, S.M.; Gehr, T.W.; Boini, K.M.; Li, P.L. Nod-like receptor protein 3 (NLRP3) inflammasome activation and podocyte injury via thioredoxin-interacting protein (TXNIP) during hyperhomocysteinemia. J. Biol. Chem. 2014, 289, 27159–27168. [Google Scholar] [CrossRef]
- Latella, G. Redox Imbalance in Intestinal Fibrosis: Beware of the TGFβ-1, ROS, and Nrf2 Connection. Dig. Dis. Sci. 2018, 63, 312–320. [Google Scholar] [CrossRef]
- Tonelli, C.; Chio, I.I.C.; Tuveson, D.A. Transcriptional Regulation by Nrf2. Antioxid. Redox Signal 2018, 29, 1727–1745. [Google Scholar] [CrossRef]
- Zhang, M.; Yu, X.; Li, D.; Ma, N.; Wei, Z.; Ci, X.; Zhang, S. Nrf2 Signaling Pathway Mediates the Protective Effects of Daphnetin Against D-Galactose Induced-Premature Ovarian Failure. Front. Pharmacol. 2022, 13, 810524. [Google Scholar] [CrossRef]
- Wang, Y.; Wang, H.; Qian, C.; Tang, J.; Zhou, W.; Liu, X.; You, Q.; Hu, R. 3-(2-Oxo-2-phenylethylidene)-2,3,6,7-tetrahydro-1H-pyrazino[2,1-a]isoquinolin-4(11bH)-one (compound 1), a novel potent Nrf2/ARE inducer, protects against DSS-induced colitis via inhibiting NLRP3 inflammasome. Biochem. Pharmacol. 2016, 101, 71–86. [Google Scholar] [CrossRef]
- Xu, L.L.; Wu, Y.F.; Yan, F.; Li, C.C.; Dai, Z.; You, Q.D.; Jiang, Z.Y.; Di, B. 5-(3,4-Difluorophenyl)-3-(6-methylpyridin-3-yl)-1,2,4-oxadiazole (DDO-7263), a novel Nrf2 activator targeting brain tissue, protects against MPTP-induced subacute Parkinson’s disease in mice by inhibiting the NLRP3 inflammasome and protects PC12 cells against oxidative stress. Free Radic. Biol. Med. 2019, 134, 288–303. [Google Scholar]
- Xu, X.; Zheng, Y.; Huang, Y.; Chen, J.; Gong, Z.; Li, Y.; Lu, C.; Lai, W.; Xu, Q. Cathepsin D contributes to the accumulation of advanced glycation end products during photoaging. J. Dermatol. Sci. 2018, 90, 263–275. [Google Scholar] [CrossRef]
- Fang, J.; Ouyang, M.; Qu, Y.; Wang, M.; Huang, X.; Lan, J.; Lai, W.; Xu, Q. Advanced Glycation End Products Promote Melanogenesis by Activating NLRP3 Inflammasome in Human Dermal Fibroblasts. J. Investig. Dermatol. 2022, 142, 2591–2602. [Google Scholar] [CrossRef]
- Hirooka, Y.; Nozaki, Y. Interleukin-18 in Inflammatory Kidney Disease. Front. Med. 2021, 8, 639103. [Google Scholar] [CrossRef]
- Nakanishi, K.; Yoshimoto, T.; Tsutsui, H.; Okamura, H. Interleukin-18 is a unique cytokine that stimulates both Th1 and Th2 responses depending on its cytokine milieu. Cytokine Growth Factor. Rev. 2001, 12, 53–72. [Google Scholar] [CrossRef]
- Murphy, J.E.; Robert, C.; Kupper, T.S. Interleukin-1 and cutaneous inflammation: A crucial link between innate and acquired immunity. J. Investig. Dermatol. 2000, 114, 602–608. [Google Scholar] [CrossRef]
- Robinson, D.; Shibuya, K.; Mui, A.; Zonin, F.; Murphy, E.; Sana, T.; Hartley, S.B.; Menon, S.; Kastelein, R.; Bazan, F.; et al. IGIF does not drive Th1 development but synergizes with IL-12 for interferon-γ production and activates IRAK and NFκB. Immunity 1997, 7, 571–581. [Google Scholar] [CrossRef]
- Puren, A.J.; Fantuzzi, G.; Gu, Y.; Su, M.S.; Dinarello, C.A. Interleukin-18 (IFNγ-inducing factor) induces IL-8 and IL-1beta via TNFalpha production from non-CD14+ human blood mononuclear cells. J. Clin. Investig. 1998, 101, 711–721. [Google Scholar] [CrossRef]
- Quan, T.; Qin, Z.; Xia, W.; Shao, Y.; Voorhees, J.J.; Fisher, G.J. Matrix-degrading metalloproteinases in photoaging. J. Investig. Dermatol. Symp. Proc. 2009, 14, 20–24. [Google Scholar] [CrossRef]
- Kim, J.; Lee, C.W.; Kim, E.K.; Lee, S.J.; Park, N.H.; Kim, H.S.; Kim, H.K.; Char, K.; Jang, Y.P.; Kim, J.W. Inhibition effect of Gynura procumbens extract on UV-B-induced matrix-metalloproteinase expression in human dermal fibroblasts. J. Ethnopharmacol. 2011, 137, 427–433. [Google Scholar] [CrossRef]
- Lee, Y.R.; Noh, E.M.; Han, J.H.; Kim, J.M.; Hwang, J.K.; Hwang, B.M.; Chung, E.Y.; Kim, B.S.; Lee, S.H.; Lee, S.J.; et al. Brazilin inhibits UVB-induced MMP-1/3 expressions and secretions by suppressing the NF-κB pathway in human dermal fibroblasts. Eur. J. Pharmacol. 2012, 674, 80–86. [Google Scholar] [CrossRef]
- Chuang, H.C.; Su, C.Y.; Huang, H.Y.; Huang, C.C.; Chien, C.Y.; Du, Y.Y.; Chuang, J.H. Active matrix metalloproteinase-7 is associated with invasion in buccal squamous cell carcinoma. Mod. Pathol. 2008, 21, 1444–1450. [Google Scholar] [CrossRef]
- Poswar, F.O.; Fraga, C.A.; Farias, L.C.; Feltenberger, J.D.; Cruz, V.P.; Santos, S.H.; Silveira, C.M.; de Paula, A.M.; Guimarães, A.L. Immunohistochemical analysis of TIMP-3 and MMP-9 in actinic keratosis, squamous cell carcinoma of the skin, and basal cell carcinoma. Pathol. Res. Pract. 2013, 209, 705–709. [Google Scholar] [CrossRef]
- Ciurea, M.E.; Cernea, D.; Georgescu, C.C.; Cotoi, O.S.; Patrascu, V.; Parvanescu, H.; Popa, D.; Parvanescu, V.; Ciurea, R.N.; Mercut, R. Expression of CXCR4, MMP-13 and β-catenin in different histological subtypes of facial basal cell carcinoma. Rom. J. Morphol. Embryol. 2013, 54, 939–951. [Google Scholar]
- Phansuk, K.; Vachiramon, V.; Jurairattanaporn, N.; Chanprapaph, K.; Rattananukrom, T. Dermal Pathology in Melasma: An Update Review. Clin. Cosmet. Investig. Dermatol. 2022, 15, 11–19. [Google Scholar] [CrossRef]
- Nieuweboer-Krobotova, L. Hyperpigmentation: Types, diagnostics and targeted treatment options. J. Eur. Acad. Dermatol. Venereol. 2013, 27, 2–4. [Google Scholar] [CrossRef]
- Naval, P.; Chandra, T.S. Characterization of membrane vesicles secreted by seaweed associated bacterium Alteromonas macleodii KS62. Biochem. Biophys. Res. Commun. 2019, 514, 422–427. [Google Scholar] [CrossRef]
- Dorronsoro, A.; Santiago, F.E.; Grassi, D.; Zhang, T.; Lai, R.C.; McGowan, S.J.; Angelini, L.; Lavasani, M.; Corbo, L.; Lu, A.; et al. Mesenchymal stem cell-derived extracellular vesicles reduce senescence and extend health span in mouse models of aging. Aging Cell 2021, 20, 13337. [Google Scholar] [CrossRef]
- Kocholata, M.; Maly, J.; Martinec, J.; Auer Malinska, H. Plant extracellular vesicles and their potential in human health research, the practical approach. Physiol. Res. 2022, 71, 327–339. [Google Scholar] [CrossRef]
- Chen, X.; Zhou, Y.; Yu, J. Exosome-like Nanoparticles from Ginger Rhizomes Inhibited NLRP3 Inflammasome Activation. Mol. Pharm. 2019, 16, 2690–2699. [Google Scholar] [CrossRef]
- Zhuang, X.; Deng, Z.B.; Mu, J.; Zhang, L.; Yan, J.; Miller, D.; Feng, W.; McClain, C.J.; Zhang, H.G. Ginger-derived nanoparticles protect against alcohol-induced liver damage. J. Extracell. Vesicles 2015, 4, 28713. [Google Scholar] [CrossRef]
- Zhang, M.; Viennois, E.; Prasad, M.; Zhang, Y.; Wang, L.; Zhang, Z.; Han, M.K.; Xiao, B.; Xu, C.; Srinivasan, S.; et al. Edible ginger-derived nanoparticles: A novel therapeutic approach for the prevention and treatment of inflammatory bowel disease and colitis-associated cancer. Biomaterials 2016, 101, 321–340. [Google Scholar] [CrossRef]
- Lee, R.; Ko, H.J.; Kim, K.; Sohn, Y.; Min, S.Y.; Kim, J.A.; Na, D.; Yeon, J.H. Anti-melanogenic effects of extracellular vesicles derived from plant leaves and stems in mouse melanoma cells and human healthy skin. J. Extracell. Vesicles 2019, 9, 1703480. [Google Scholar] [CrossRef]
- Cho, E.-G.; Choi, S.-Y.; Kim, H.; Choi, E.-J.; Lee, E.-J.; Park, P.-J.; Ko, J.; Kim, K.P.; Baek, H.S. Panax ginseng-Derived Extracellular Vesicles Facilitate Anti-Senescence Effects in Human Skin Cells: An Eco-Friendly and Sustainable Way to Use Ginseng Substances. Cells 2021, 10, 486. [Google Scholar] [CrossRef] [PubMed]
- Jang, B.; Chung, H.; Jung, H.; Song, H.K.; Park, E.; Choi, H.S.; Jung, K.; Choe, H.; Yang, S.; Oh, E.S. Extracellular Vesicles from Korean Codium fragile and Sargassum fusiforme Negatively Regulate Melanin Synthesis. Mol. Cells 2021, 44, 736–745. [Google Scholar] [CrossRef] [PubMed]
- Azam, M.S.; Choi, J.; Lee, M.S.; Kim, H.R. Hypopigmenting Effects of Brown Algae-Derived Phytochemicals: A Review on Molecular Mechanisms. Mar. Drugs 2017, 15, 297. [Google Scholar] [CrossRef] [PubMed]
- Heo, S.J.; Ko, S.C.; Cha, S.H.; Kang, D.H.; Park, H.S.; Choi, Y.U.; Kim, D.; Jung, W.K.; Jeon, Y.J. Effect of phlorotannins isolated from Ecklonia cava on melanogenesis and their protective effect against photo-oxidative stress induced by UV-B radiation. Toxicol. In Vitro 2009, 23, 1123–1130. [Google Scholar] [CrossRef] [PubMed]
- Kim, K.N.; Yang, H.M.; Kang, S.M.; Ahn, G.N.; Roh, S.W.; Lee, W.; Kim, D.K.; Jeon, Y.J. Whitening Effect of Octaphlorethol A Isolated from Ishige foliacea in an In Vivo Zebrafish Model. J. Microbiol. Biotechnol. 2015, 25, 448–451. [Google Scholar] [CrossRef] [PubMed]
- Kang, H.S.; Kim, H.R.; Byun, D.S.; Son, B.W.; Nam, T.J.; Choi, J.S. Tyrosinase inhibitors isolated from the edible brown alga Ecklonia stolonifera. Arch. Pharmacal Res. 2004, 27, 1226–1232. [Google Scholar] [CrossRef] [PubMed]
- Heo, S.J.; Ko, S.C.; Kang, S.M.; Cha, S.H.; Lee, S.H.; Kang, D.H.; Jung, W.K.; Affan, A.; Oh, C.; Jeon, Y.J. Inhibitory effect of diphlorethohydroxycarmalol on melanogenesis and its protective effect against UV-B radiation-induced cell damage. Food Chem. Toxicol. 2010, 48, 1355–1361. [Google Scholar] [CrossRef] [PubMed]
- Kim, K.N.; Yang, H.M.; Kang, S.M.; Kim, D.; Ahn, G.; Jeon, Y.J. Octaphlorethol A isolated from Ishige foliacea inhibits α-MSH-stimulated induced melanogenesis via ERK pathway in B16F10 melanoma cells. Food Chem. Toxicol. 2013, 59, 521–526. [Google Scholar] [CrossRef]
- Cha, S.H.; Ko, S.C.; Kim, D.; Jeon, Y.J. Screening of marine algae for potential tyrosinase inhibitor: Those inhibitors reduced tyrosinase activity and melanin synthesis in zebrafish. J. Dermatol. 2011, 38, 354–363. [Google Scholar] [CrossRef]
- Yoon, N.Y.; Eom, T.K.; Kim, M.M.; Kim, S.K. Inhibitory effect of phlorotannins isolated from Ecklonia cava on mushroom tyrosinase activity and melanin formation in mouse B16F10 melanoma cells. J. Agric. Food Chem. 2009, 57, 4124–4129. [Google Scholar] [CrossRef]
- Choi, Y.H. The cytoprotective effects of ethanol extract of Ecklonia cava against oxidative stress are associated with upregulation of Nrf2-mediated HO-1 and NQO-1 expression through activation of the MAPK pathway. Gen. Physiol. Biophys. 2016, 35, 45–53. [Google Scholar] [PubMed]
- Manandhar, B.; Wagle, A.; Seong, S.H.; Paudel, P.; Kim, H.R.; Jung, H.A.; Choi, J.S. Phlorotannins with Potential Anti-tyrosinase and Antioxidant Activity Isolated from the Marine Seaweed Ecklonia stolonifera. Antioxidants 2019, 8, 240. [Google Scholar] [CrossRef] [PubMed]
- Son, M.; Oh, S.; Choi, J.; Jang, J.T.; Choi, C.H.; Park, K.Y.; Son, K.H.; Byun, K. The Phlorotannin-Rich Fraction of Ecklonia cava Extract Attenuated the Expressions of the Markers Related with Inflammation and Leptin Resistance in Adipose Tissue. Int. J. Endocrinol. 2020, 2020, 9142134. [Google Scholar] [CrossRef] [PubMed]
- Oh, S.; Son, M.; Lee, H.S.; Kim, H.S.; Jeon, Y.J.; Byun, K. Protective Effect of Pyrogallol-Phloroglucinol-6,6-Bieckol from Ecklonia cava on Monocyte-Associated Vascular Dysfunction. Mar. Drugs 2018, 16, 441. [Google Scholar] [CrossRef] [PubMed]
- Chung, K.W.; Jeong, H.O.; Jang, E.J.; Choi, Y.J.; Kim, D.H.; Kim, S.R.; Lee, K.J.; Lee, H.J.; Chun, P.; Byun, Y.; et al. Characterization of a small molecule inhibitor of melanogenesis that inhibits tyrosinase activity and scavenges nitric oxide (NO). Biochim. Biophys. Acta (BBA) Gen. Subj. 2013, 1830, 4752–4761. [Google Scholar] [CrossRef] [PubMed]
- Lee, S.; Lee, J.; Cho, S.H.; Roh, G.; Park, H.J.; Lee, Y.J.; Jeon, H.E.; Lee, Y.S.; Bae, S.H.; Youn, S.B.; et al. Assessing the impact of mRNA vaccination in chronic inflammatory murine model. NPJ Vaccines 2024, 9, 34. [Google Scholar] [CrossRef] [PubMed]
- Kim, Y.M.; Kim, H.Y.; Jang, J.T.; Hong, S. Preventive Effect of Ecklonia cava Extract on DSS-Induced Colitis by Elevating Intestinal Barrier Function and Improving Pathogenic Inflammation. Molecules 2023, 28, 8099. [Google Scholar] [CrossRef] [PubMed]
- Kim, H.Y.; Kim, Y.M.; Hong, S. DNAJB9 suppresses the metastasis of triple-negative breast cancer by promoting FBXO45-mediated degradation of ZEB1. Cell Death Dis. 2021, 12, 461. [Google Scholar] [CrossRef] [PubMed]
- Umair, Z.; Baek, M.O.; Song, J.; An, S.; Chon, S.J.; Yoon, M.S. MicroRNA-4516 in Urinary Exosomes as a Biomarker of Premature Ovarian Insufficiency. Cells 2022, 11, 2797. [Google Scholar] [CrossRef]
- Rutter, B.D.; Innes, R.W. Extracellular Vesicles Isolated from the Leaf Apoplast Carry Stress-Response Proteins. Plant Physiol. 2017, 173, 728–741. [Google Scholar] [CrossRef]
- D’Mello, S.A.; Finlay, G.J.; Baguley, B.C.; Askarian-Amiri, M.E. Signaling Pathways in Melanogenesis. Int. J. Mol. Sci. 2016, 17, 1144. [Google Scholar] [CrossRef]
- Omari Shekaftik, S.; Nasirzadeh, N. 8-Hydroxy-2′-deoxyguanosine (8-OHdG) as a biomarker of oxidative DNA damage induced by occupational exposure to nanomaterials: A systematic review. Nanotoxicology 2021, 15, 850–864. [Google Scholar] [CrossRef] [PubMed]
- Cho, C.H.; Lee, C.J.; Kim, M.G.; Ryu, B.; Je, J.G.; Kim, Y.; Lee, S.H. Therapeutic Potential of Phlorotannin-Rich Ecklonia cava Extract on Methylglyoxal-Induced Diabetic Nephropathy in In Vitro Model. Mar. Drugs 2022, 20, 355. [Google Scholar] [CrossRef] [PubMed]
- Lee, J.M.; Johnson, J.A. An important role of Nrf2-ARE pathway in the cellular defense mechanism. J. Biochem. Mol. Biol. 2004, 37, 139–143. [Google Scholar] [CrossRef]
- de Oliveira, M.R.; Ferreira, G.C.; Schuck, P.F.; Dal Bosco, S.M. Role for the PI3K/Akt/Nrf2 signaling pathway in the protective effects of carnosic acid against methylglyoxal-induced neurotoxicity in SH-SY5Y neuroblastoma cells. Chem. Biol. Interact. 2015, 242, 396–406. [Google Scholar] [CrossRef]
- Hu, Y.; Huang, J.; Li, Y.; Jiang, L.; Ouyang, Y.; Li, Y.; Yang, L.; Zhao, X.; Huang, L.; Xiang, H.; et al. Cistanche deserticola polysaccharide induces melanogenesis in melanocytes and reduces oxidative stress via activating NRF2/HO-1 pathway. J. Cell. Mol. Med. 2020, 24, 4023–4035. [Google Scholar] [CrossRef] [PubMed]
- Li, X.; Xie, X.; Lian, W.; Shi, R.; Han, S.; Zhang, H.; Lu, L.; Li, M. Exosomes from adipose-derived stem cells overexpressing Nrf2 accelerate cutaneous wound healing by promoting vascularization in a diabetic foot ulcer rat model. Exp. Mol. Med. 2018, 50, 1–14. [Google Scholar] [CrossRef] [PubMed]
- Ünver, N.; Freyschmidt-Paul, P.; Hörster, S.; Wenck, H.; Stäb, F.; Blatt, T.; Elsässer, H.P. Alterations in the epidermal-dermal melanin axis and factor XIIIa melanophages in senile lentigo and ageing skin. Br. J. Dermatol. 2006, 155, 119–128. [Google Scholar] [CrossRef]
- Bacharach-Buhles, M.; Lubowietzki, M.; Altmeyer, P. Dose-dependent shift of apoptotic and unaltered melanocytes into the dermis after irradiation with UVA 1. Dermatology 1999, 198, 5–10. [Google Scholar] [CrossRef]
- Peng, J.L.; Xie, H.B.; Wang, Y.C.; Huang, H.; Zhu, Q.X. The role of ROS/TXNIP/NLRP3 pathway in the skin injury of trichloroethylene sensitized mice. Zhonghua Lao Dong Wei Sheng Zhi Ye Bing Za Zhi 2022, 20, 241–247. [Google Scholar]
- Sui, J.; Dai, F.; Shi, J.; Zhou, C. Ubiquitin-specific peptidase 25 exacerbated osteoarthritis progression through facilitating TXNIP ubiquitination and NLRP3 inflammasome activation. J. Orthop. Surg. Res. 2023, 18, 762. [Google Scholar] [CrossRef] [PubMed]
- Liu, F.; Zhang, Y.; Shi, Y.; Xiong, K.; Wang, F.; Yang, J. Ceramide induces pyroptosis through TXNIP/NLRP3/GSDMD pathway in HUVECs. BMC Mol. Cell Biol. 2022, 23, 54. [Google Scholar] [CrossRef] [PubMed]
- Jiang, J.; Shi, Y.; Cao, J.; Lu, Y.; Sun, G.; Yang, J. Role of ASM/Cer/TXNIP signaling module in the NLRP3 inflammasome activation. Lipids Health Dis. 2021, 20, 19. [Google Scholar] [CrossRef] [PubMed]
- Rodríguez-Luna, A.; Ávila-Román, J.; Oliveira, H.; Motilva, V.; Talero, E. Fucoxanthin and Rosmarinic Acid Combination Has Anti-Inflammatory Effects through Regulation of NLRP3 Inflammasome in UVB-Exposed HaCaT Keratinocytes. Mar. Drugs 2019, 17, 451. [Google Scholar] [CrossRef]
- Hwang, B.M.; Noh, E.M.; Kim, J.S.; et, al. Curcumin inhibits UVB-induced matrix metalloproteinase-1/3 expression by suppressing the MAPK-p38/JNK pathways in human dermal fibroblasts. Exp. Dermatol. 2013, 22, 371–374. [Google Scholar] [CrossRef] [PubMed]
- Natarajan, V.T.; Ganju, P.; Ramkumar, A.; Grover, R.; Gokhale, R.S. Multifaceted pathways protect human skin from UV radiation. Nat. Chem. Biol. 2014, 10, 542–551. [Google Scholar] [CrossRef] [PubMed]
- Kong, C.S.; Kim, J.A.; Yoon, N.Y.; Kim, S.K. Induction of apoptosis by phloroglucinol derivative from Ecklonia cava in MCF-7 human breast cancer cells. Food Chem. Toxicol. 2009, 47, 1653–1658. [Google Scholar] [CrossRef] [PubMed]
- Walko, G.; Castañón, M.J.; Wiche, G. Molecular architecture and function of the hemidesmosome. Cell Tissue Res. 2015, 360, 363–378. [Google Scholar] [CrossRef] [PubMed]
- Goletz, S.; Zillikens, D.; Schmidt, E. Structural proteins of the dermal-epidermal junction targeted by autoantibodies in pemphigoid diseases. Exp. Dermatol. 2017, 26, 1154–1162. [Google Scholar] [CrossRef]
- Ståhle-Bäckdahl, M.; Inoue, M.; Guidice, G.J.; Parks, W.C. 92-kD gelatinase is produced by eosinophils at the site of blister formation in bullous pemphigoid and cleaves the extracellular domain of recombinant 180-kD bullous pemphigoid autoantigen. J. Clin. Investig. 1994, 93, 2022–2030. [Google Scholar] [CrossRef]
- Zhang, C.; Li, Y.; Shi, X.; Kim, S.K. Inhibition of the expression on MMP-2, 9 and morphological changes via human fibrosarcoma cell line by 6,6′-bieckol from marine alga Ecklonia cava. BMB Rep. 2010, 43, 62–68. [Google Scholar] [CrossRef] [PubMed]
- Amano, S. Characterization and mechanisms of photoageing-related changes in skin. Damages of basement membrane and dermal structures. Exp. Dermatol. 2016, 25, 14–19. [Google Scholar] [CrossRef]
- Roig-Rosello, E.; Rousselle, P. The Human Epidermal Basement Membrane: A Shaped and Cell Instructive Platform That Aging Slowly Alters. Biomolecules 2020, 10, 1607. [Google Scholar] [CrossRef]
- Lavker, R.M. Structural alterations in exposed and unexposed aged skin. J. Investig. Dermatol. 1979, 73, 59–66. [Google Scholar] [CrossRef] [PubMed]
- Amano, S. Possible involvement of basement membrane damage in skin photoaging. J. Investig. Dermatol. Symp. Proc. 2009, 14, 2–7. [Google Scholar] [CrossRef] [PubMed]
- Iriyama, S.; Matsunaga, Y.; Takahashi, K.; Matsuzaki, K.; Kumagai, N.; Amano, S. Activation of heparanase by ultraviolet B irradiation leads to functional loss of basement membrane at the dermal-epidermal junction in human skin. Arch. Dermatol. Res. 2011, 303, 253–261. [Google Scholar] [CrossRef]
- Iriyama, S.; Matsuura-Hachiya, Y.; Tsunenaga, M. Influence of epidermal basement membrane integrity on cutaneous permeability barrier function. J. Dermatol. Sci. 2018, 91, 110–112. [Google Scholar] [CrossRef]
- Iriyama, S.; Yamanishi, H.; Kunizawa, N.; Hirao, T.; Amano, S. 1-(2-Hydroxyethyl)-2-imidazolidinone, a heparanase and matrix metalloproteinase inhibitor, improves epidermal basement membrane structure and epidermal barrier function. Exp. Dermatol. 2019, 28, 247–253. [Google Scholar] [CrossRef]
- Amano, S. Basement membrane damage, a sign of skin early aging, and laminin 5, a key player in basement membrane care. J. Soc. Cos. Chem. Jap. 2001, 35, 1–7. [Google Scholar]
- Amano, S.; Akutsu, N.; Matsunaga, Y.; Kadoya, K.; Nishiyama, T.; Champliaud, M.F.; Burgeson, R.E.; Adachi, E. Importance of balance between extracellular matrix synthesis and degradation in basement membrane formation. Exp. Cell Res. 2001, 271, 249–262. [Google Scholar] [CrossRef]
- Torres-Álvarez, B.; Mesa-Garza, I.G.; Castanedo-Cázares, J.P.; Fuentes-Ahumada, C.; Oros-Ovalle, C.; Navarrete-Solis, J.; Moncada, B. Histochemical and immunohistochemical study in melasma: Evidence of damage in the basal membrane. Am. J. Dermatopathol. 2011, 33, 291–295. [Google Scholar] [CrossRef] [PubMed]
- Lee, D.J.; Park, K.C.; Ortonne, J.P.; Kang, H.Y. Pendulous melanocytes: A characteristic feature of melasma and how it may occur. Br. J. Dermatol. 2012, 166, 684–686. [Google Scholar] [CrossRef] [PubMed]
- Ortonne, J.P.; Claudy, A.L.; Freycon, F. Café au lait spots in ataxia-telangiectasia (A.T.). Histochemical and ultrastructural study in one case. Arch. Dermatol. Res. 1980, 268, 91–99. [Google Scholar] [CrossRef]
- Kim, D.K.; Rhee, W.J. Antioxidative Effects of Carrot-Derived Nanovesicles in Cardiomyoblast and Neuroblastoma Cells. Pharmaceutics 2021, 13, 1203. [Google Scholar] [CrossRef]
- Urzì, O.; Cafora, M.; Ganji, N.R.; Tinnirello, V.; Gasparro, R.; Raccosta, S.; Manno, M.; Corsale, A.M.; Conigliaro, A.; Pistocchi, A.; et al. Lemon-derived nanovesicles achieve antioxidant and anti-inflammatory effects activating the AhR/Nrf2 signaling pathway. iScience 2023, 26, 107041. [Google Scholar] [CrossRef]
- Mahajan, V.K.; Patil, A.; Blicharz, L.; Kassir, M.; Konnikov, N.; Gold, M.H.; Goldman, M.P.; Galadari, H.; Goldust, M. Medical therapies for melasma. J. Cosmet. Dermatol. 2022, 21, 3707–3728. [Google Scholar] [CrossRef]
- Haddad, A.L.; Matos, L.F.; Brunstein, F.; Ferreira, L.M.; Silva, A.; Costa, D., Jr. A clinical, prospective, randomized, double-blind trial comparing skin whitening complex with hydroquinone vs. placebo in the treatment of melasma. Int. J. Dermatol. 2003, 42, 153–156. [Google Scholar] [CrossRef]
- Sarkar, R.; Chugh, S.; Garg, V.K. Newer and upcoming therapies for melasma. Indian. J. Dermatol. Venereol. Leprol. 2012, 78, 417–428. [Google Scholar] [CrossRef] [PubMed]
- Zhang, B.; Lai, R.C.; Sim, W.K.; Choo, A.B.H.; Lane, E.B.; Lim, S.K. Topical Application of Mesenchymal Stem Cell Exosomes Alleviates the Imiquimod Induced Psoriasis-Like Inflammation. Int. J. Mol. Sci. 2021, 22, 720. [Google Scholar] [CrossRef]
- Ennes, S.B.P.; Paschoalick, R.C.; Alchorne, M.M.D.A. A double-blind, comparative, placebo-controlled study of the efficacy and tolerability of 4% hydroquinone as a depigmenting agent in melasma. J. Dermatol. Treat. 2000, 11, 173–179. [Google Scholar] [CrossRef]
- Hao, Y.; Li, W.; Zhou, X.; Yang, F.; Qian, Z. Microneedles-Based Transdermal Drug Delivery Systems: A Review. J. Biomed. Nanotechnol. 2017, 13, 1581–1597. [Google Scholar] [CrossRef] [PubMed]


Disclaimer/Publisher’s Note: The statements, opinions and data contained in all publications are solely those of the individual author(s) and contributor(s) and not of MDPI and/or the editor(s). MDPI and/or the editor(s) disclaim responsibility for any injury to people or property resulting from any ideas, methods, instructions or products referred to in the content. |
© 2024 by the authors. Licensee MDPI, Basel, Switzerland. This article is an open access article distributed under the terms and conditions of the Creative Commons Attribution (CC BY) license (https://creativecommons.org/licenses/by/4.0/).
Share and Cite
Byun, K.-A.; Park, Y.; Oh, S.; Batsukh, S.; Son, K.H.; Byun, K. Co-Treatment with Phlorotannin and Extracellular Vesicles from Ecklonia cava Inhibits UV-Induced Melanogenesis. Antioxidants 2024, 13, 408. https://0-doi-org.brum.beds.ac.uk/10.3390/antiox13040408
Byun K-A, Park Y, Oh S, Batsukh S, Son KH, Byun K. Co-Treatment with Phlorotannin and Extracellular Vesicles from Ecklonia cava Inhibits UV-Induced Melanogenesis. Antioxidants. 2024; 13(4):408. https://0-doi-org.brum.beds.ac.uk/10.3390/antiox13040408
Chicago/Turabian StyleByun, Kyung-A, Youngjin Park, Seyeon Oh, Sosorburam Batsukh, Kuk Hui Son, and Kyunghee Byun. 2024. "Co-Treatment with Phlorotannin and Extracellular Vesicles from Ecklonia cava Inhibits UV-Induced Melanogenesis" Antioxidants 13, no. 4: 408. https://0-doi-org.brum.beds.ac.uk/10.3390/antiox13040408