Article

Effects of Grape Pomace on Growth Performance, Nitrogen Metabolism, Antioxidants, and Microbial Diversity in Angus Bulls

1
State Key Laboratory of Animal Nutrition and Feeding, College of Animal Science and Technology, China Agricultural University, Beijing 100193, China
2
School of Tropical Agriculture and Forestry, Hainan University, Haikou 570228, China
*
Author to whom correspondence should be addressed.
Submission received: 1 March 2024 / Revised: 21 March 2024 / Accepted: 27 March 2024 / Published: 28 March 2024

Abstract

:
Polyphenol-rich grape pomace (GP) represents a valuable processing by-product with considerable potential as sustainable livestock feed. This study aimed to investigate the effects of different levels of GP on the growth performance and nitrogen utilization efficiency, antioxidant activity, and rumen and rectum microbiota of Angus bulls. Thirty Angus bulls were allocated three dietary treatments according to a completely randomized design: 0% (G0), 10% (G10), and 20% (G20) corn silage dry matter replaced with dried GP dry matter. The results showed that the average daily gain (ADG) of the G0 group and G10 group was higher than that of the G20 group (p < 0.05); urinary nitrogen levels decreased linearly with the addition of GP (linear, p < 0.05). In terms of antioxidants, the levels of catalase (CAT) in the G10 group were higher than in the G0 and G20 groups (p < 0.05), and the total antioxidative capacity (T-AOC) was significantly higher than that in the G20 group (p < 0.05). In addition, in the analysis of a microbial network diagram, the G10 group had better microbial community complexity and stability. Overall, these findings offer valuable insights into the potential benefits of incorporating GP into the diet of ruminants.

1. Introduction

Grape pomace (GP) predominantly comprises grape seeds, skins, and stalks, containing high levels of carbohydrates and proteins [1]. Specifically, grape seeds are abundant in polyunsaturated fatty acids, contributing to animal health when consumed in moderation. Additionally, GP is a rich source of polyphenols, known for their potent antioxidant properties [2,3]. With the increasing demand for wine and concerns over the environmental impact of the traditional treatments, there is a pressing need to explore efficient resource utilization strategies for GP.
Grape pomace is rich in diverse polyphenolic compounds, including tannins, proanthocyanidins, anthocyanidins, flavonoids, and phenolic acids, attributable to the extraction conditions, efficiency, and chemical reactions inherent in the wine-making process [1,4,5]. Voicu et al. [6] showed that the growth performance and digestive metabolism of beef cattle are not adversely affected by many of these polyphenolic compounds. Notably, condensed tannins (CT) stand out as the foremost bioactive constituents, constituting 58.7% of the total phenolic compounds in GP [7]. Condensed tannins have more hydroxyl groups and a higher polymerization of polyphenols, making them stronger antioxidants than simple phenolics [8]. Increasing evidence suggests that polyphenolic compounds can be utilized as dietary additives in adult ruminant diets [9,10]. Furthermore, the structure–activity relationships and chemical environment of the polyphenol compounds in GP affect the antioxidant efficiency and balance [11]. Studies have shown that feeding 25 kg lambs with 10% GP and feed increased the total antioxidant capacity (T-AOC) and Glutathione Peroxidase 4 (GPX4) and superoxide dismutase (SOD) activity in the lambs [12].
Condensed tannins have the ability to bind and precipitate proteins. Due to their complex structure and large relative molecular mass, hydrolysis of CT can occur only under strong oxidation and acidic conditions. Therefore, CT have a strong antibacterial ability, which can destroy microbial membranes by inhibiting the substrate of enzymes and inactivating membrane-binding proteins [13]. In a previous experiment [14], it was found that GP can improve the anti-inflammatory effect of Caco-2 cells. In addition, the addition of GP can inhibit the growth of pathogenic bacteria such as Enterobacteriaceae and E. coli. in feces [15].
In the late fattening period of beef cattle, long-term feeding with a high-concentrate diet can stimulate the release of proinflammatory cytokines, which leads to oxidative stress in the body [16]. We can use feed rich in polyphenols, and GP is one of the best choices; however, dietary polyphenols can have toxic effects on animals’ bodies when fed in large doses. The evidence indicates that dietary polyphenols can have adverse effects on animals’ bodies through their antioxidant action [17]. A high dose of GP may over-protect proteins and hinder the digestion and absorption of nutrients by reducing the activity of rumen microorganisms [8]. Therefore, this evidence suggests that although wine grains can be used as an antioxidant diet for ruminants, we need to explore the appropriate replacement ratio to prevent a high concentration reducing the stability of ruminal and rectal microbial communities, which is detrimental to the health of beef cattle.
At present, the animal studies on GP mainly focus on growth performance [6,7] and nitrogen utilization efficiency (NUE) [18], and the effects of GP on the antioxidant activity and health of beef cattle are still unclear. Therefore, the purpose of this study was to investigate the effects of different proportions of GP on the growth performance, antioxidant activity, and rumen and rectal microbiota of beef cattle through feeding experiments. The purpose is to understand the use of GP and provide a theoretical basis for its application in diets.

2. Materials and Methods

2.1. Animals, Diets, and Management

This experiment was carried out with permission from the Animal Care Committee (approval number: AW82113202-1-1), China Agricultural University. The present trial was conducted from February to June 2021 at Benwang Farm (Ningxia, China).
The grape pomace, sourced from wineries in Yinchuan City, Ningxia Hui Autonomous Region, consisted of Cabernet Sauvignon grape varieties. The GP underwent a drying process to achieve a less than 14% moisture content. Subsequently, it was crushed and sieved through a 10-mesh sieve. The resulting dried grape pomace (DGP) was stored in a dry and cool environment.
This study used 30 16-month-old Angus bulls with an initial body weight of 580.57 ± 42.72 kg (mean ± SD) as the experimental animals. All the cattle were randomly allocated 1 of 3 dietary treatments. The bulls were provided with a basal total mixed ration (TMR, Table 1), while the bulls in the G10 and G20 groups had the corn silage in the G0 group substituted with either 100 or 200 g/kg of DGP meal, respectively. Although DGP was used as a fiber substitute for corn silage and wheat bran, its content of other nutrients also differed (Table 2). The nutrient content of the TMR was formulated to meet the growth needs of the animals, as required by the NASEM (2016) [19].The experiment was performed over 141 days, including 12 days of adaptation and a 129-day experimental period. The average DMI was 12.87 kg/d throughout the trial period. Restricted feeding was designed to exclude the differences brought about by different feed intakes. All the groups were fed two times at 7:00 and 17:00. Drinking water was offered ad libitum.

2.2. Sample Collection

Before the start of the experiment, the initial live weights of the fasting bulls were taken. On the morning of the 129th day, the final live weights of each bull (before feeding) were taking using a weighbridge, and the average value was measured twice. The average daily gain (ADG) was calculated as the body weight gain (BWG) divided by the number of experimental days, and the feed conversion ratio (FCR) was calculated as DMI/ADG. Feed samples were collected from the 21st to the 23rd day of each month. On the 130th day, in the morning (after feeding) and in the afternoon, the urine and feces of each bull were collected. The urine samples were collected using a self-made collector and then shaken with a glass rod to retain about 60 mL of urine, 10 mL of 0.5 mol/L dilute sulfuric acid was added to prevent the volatilization of nitrogen, and they were stored at −20 °C until analysis. Feces samples were collected from the bull rectums using sterile polyethylene gloves. The feces were filled separately into two 2 mL cryotubes and stored with dry ice after sampling to determine rectal microorganisms. A total of 150 g of feces was collected from each bull and stored in a plastic bag to determine their apparent digestibility. Then, on the 131st and 132nd day, another 150 g of feces from each bull was collected at 6:00, 12:00, 18:00, and 24:00 to determine their apparent digestibility, and feces from the same bull were mixed into one sample per individual. On the morning of the 133rd day, 2 tubes of 5 mL blood samples were collected and placed in a 4 °C refrigerator for 3 h. Then, the supernatant was centrifuged at 3000× g and stored in dry ice. After the blood collection, rumen fluid was collected and filtered with four layers of gauze. The pH was determined immediately, two 2 mL cryotubes were divided for microbial analysis, and the rest was packed into two 10 mL centrifugal tubes to determine its ammonia nitrogen content. All the samples (feces, blood, and rumen fluid) stored on dry ice were stored at −80 °C. The feed and fecal samples were dried at 65 °C and ground through a 2 mm sieve for subsequent analysis.

2.3. Chemical Analysis

2.3.1. Feed Analysis and Nutrient Digestibility

The neutral detergent fiber (NDF), acid detergent fiber (ADF), acid detergent lignin (ADL), and acid-insoluble ash (AIA) of the feed and rectum feces were determined using the method of Van Soest et al. [22], while the ether extract (EE), dry matter (DM), crude protein (CP), and ash in the feed and rectum feces were analyzed using the methods of AOAC [23]. Their apparent digestibility was determined using the AIA method [24]. The concentration of AIA was employed as an internal indicator to estimate the apparent total tract digestibility of various nutrients and quantify the fecal DM output. After thawing the urine samples (4 °C) and shaking them using a vortex oscillator, 5 mL of each sample was extracted and mixed, and the content of nitrogen in 1 mL of the urine was determined using the AOAC methods after the shaking [23]. A creatinine (Cr) assay kit (sarcosine oxidase; Nanjing Jiancheng Bioengineering Institute, Nanjing, China) was used to analyze the urine creatinine levels. Formula [25] calculates urine excretion by using urinary creatinine and body weight as an indicator. The total urinary nitrogen is the product of the total urine excretion and the nitrogen content in 1 mL of urine.

2.3.2. Blood Antioxidant Indicators

Catalase (CAT), T-AOC, SOD, and malondialdehyde (MDA) were examined in triplicate using commercial test kits (Nanjing Jiancheng Institute of Biological Technology, Nanjing, China), except for ROS, the test for which was produced by Shanghai Mlbio Institute of Biological Technology (Shanghai, China).

2.3.3. Rumen Fermentation Parameters and Feed Fatty Acids

The rumen fluid’s pH was measured using a portable pH meter (Testo AG, Schwarzwald, Germany). The concentrations of VFA in the rumen fluid and fatty acid in the diet were determined using a gas chromatograph (GC-2014, Shimadzu Corporation, Kyoto, Japan). A Tecan Sunrise microplate reader (Tecan, Mannedorf, Switzerland) was used to measure the NH3-N concentration in the rumen fluid.

2.3.4. Microbiota Analysis

Using a TGuide S96 Magnetic Soil/Stool DNA Kit (TIANGEN Biotech Co., Ltd., Beijing, China), DNA was extracted and determined using the Qubit dsDNA HS Assay Kit and the Qubit 4.0 Fluorometer (Invitrogen, Thermo Fisher Scientific, Dallas, OR, USA). The 338F: 5′-ACTCCTACGGGAGGCAGCA-3′ and 806R: 5′-GGACTACHVGGGTWTCTAAT-3′ universal primer set was used to amplify the V3–V4 region of the 16S rRNA gene from the genomic DNA extracted from each sample. The complete sequencing dataset was accessed through the National Center for Biotechnology Information (NCBI) (accession number PRJNA1063547). During that time, QIIME2 (2020.6) and R software (4.3.0) were used to calculate and display the Alpha diversity. To test for significant taxonomic differences among groups, we also used the Linear Discriminant Analysis (LDA) effect size (LEfSe [26]). Logarithmic LDA scores of 3.5 were used to determine discriminative features.

2.4. Statistical Analysis

One-way analysis of variance (ANOVA) was conducted using a general linear model in SPSS (version 25.0) to determine significant differences among the samples. Mean values were compared using Tukey’s test. The level of statistical significance was set to p < 0.05. Microbial co-occurrence networks were built using the CoNet module (Spearman’s correlation > |0.7| and p < 0.05) in Cytoscape 3.9.1 and were viewed in Gephi software 0.10.1. Spearman’s correlation coefficient was used to evaluate the effects of the heatmap using RStudio (2023.06.0+421).

3. Results

3.1. Growth Performance

The growth performance and feed intake data are presented in Table 3. The initial live weights were not different across diets (p > 0.05). The elevated amount of GP added to the TMR resulted in a notable decline in the final live weights, displaying a linear trend (p = 0.054), whereby the G0 group and G10 group exhibited a significantly greater ADG compared to the G20 group (p < 0.05). Additionally, the inclusion of 20% DGP led to significantly higher FCR values (p < 0.05) in contrast to the other groups.

3.2. Nutrients’ Apparent Digestibility and Nitrogen Metabolism

The nutrients’ apparent digestibility is presented in Table 4. The apparent digestibility of EE was lower in the bulls fed the 20% dried GP diet compared to those fed the 10% dried GP and control diets (p < 0.05). No effect was seen among treatment groups on the apparent digestibility of DM, CP, NDF, and ADF (p > 0.05). Being fed a diet containing DGP decreased linearly the urinary nitrogen levels compared to the control diet (p < 0.05).

3.3. Blood Antioxidants

In terms of the antioxidant indicators (Table 5), the concentration of CAT in the serum of G10 was higher than that in the other two groups, and the content of T-AOC in the G10 group was higher than that of the G20 group (p < 0.05). No effect was seen among the treatment groups on the blood antioxidant levels (p > 0.05).

3.4. Ruminal Fermentation Parameters

The results on the rumen fermentation parameters among the dietary treatments are shown in Table 6. In terms of the VFA, the acetate-to-propionate ratio was increased after the 20% DGP diet group compared to those fed the 10% DGP and control diets (p < 0.05). The rumen valerate value decreased linearly with an increase in DGP supplementation (p < 0.05). No effect was seen on the other indicators (p > 0.05).

3.5. Microbiota

The total number of reads across all samples was 4,797,906, with an average of 79,775 reads per sample. Figure 1A–D compare the richness and diversity of the rumen microbiota among the three groups. There was no difference between the richness and diversity of the rumen microbiota (p > 0.05). At the phylum level (Figure 1A,B), the G20 group had decreased values in the microbial diversity indexes of Chao1 and Shannon compared with G0 (p < 0.05) and G10 (p < 0.05) in its rectal microbiota.
A total of 14 phyla were observed, with the microbial top 10 shown in Figure 1E. The relative sum of Bacteroidota, Proteobacteria, and Firmicutes accounted for over 90% of the total abundance of the rumen and rectal microbiota. Increasing the level of GP linearly increased the relative abundance of the Firmicutes phylum (p = 0.001) and linearly decreased the relative abundances of Bacteroidota and Actinobacteriota (p < 0.05) in the rectum (Figure 2B; Supplementary Table S1). Additionally, the relative abundance of Desulfobacterota had a quadratic relationship with the level of GP (p < 0.05).
At the family level (Figure 1F; Supplementary Table S2), an increasing level of GP linearly increased the relative abundance of F082 (p < 0.05), while it linearly decreased the relative abundance of Acidaminococcaceae (p < 0.05) in the rumen (Figure 2A; Supplementary Table S2). In the rectum, the relative abundances of Christensenellaceae, Lachnospiraceae, and Oscillospiraceae linearly increased (p < 0.05), whereas the relative abundances of Acidaminococcaceae and Prevotellaceae linearly decreased (p < 0.05; Supplementary Table S2).
At the genus level (Figure 1G; Supplementary Table S3), the relative abundance of Succiniclasticum had a quadratic relationship with the level of GP (p < 0.05) in the rumen (Figure 2A; Supplementary Table S3). In the rectum, an increasing level of GP linearly increased the relative abundance of NK4A214_group (p < 0.05), while it linearly decreased the relative abundance of Prevotella (p < 0.05).
The interactions between the microorganisms in the rumen and rectum systems based on different proportions of GP rations are complex (Figure 3). The present study used a microbial network to identify keystone taxa that had a crucial impact on the microbial structure and to construct correlations among species. The node and edge numbers of the network were used as the topological parameters of the network to assess the bacterial network’s complexity. The higher the node and edge numbers, the more complex the network. The average path length and the average clustering coefficient represent the specificity of the network. Negative and positive correlation ratios (neg/pos) were used to assess the bacterial network’s stability, and the values were positively correlated with the network stability. Overall, the microbial communities in the rumen and rectum were more complex with the addition of GP, and both G10 and G20 had larger average clustering coefficients compared to G0; especially, G10 had a smaller average path length, suggesting the small-world characteristics of both treatment groups. Interestingly, the microbial community in G10 had a higher stability. Based on the network analysis, the dominant genera in the rumen NK4A214-group and Butyrivibrio in the G0 group, NK4A214-group and unclassified-Christensenellaceae in the G10 group, and Pantoea in the G20 group and the dominant genera in the rectum UCG-002 and UCG-009 in the G0 group, UCG-002 and UCG-009 in the G10 group, and Paeniclostridium in the G20 group were identified.
Spearman’s correlation analysis indicated correlations among several characteristics using different levels of DGP. Twenty-four indexes related to GP showed high positive or negative correlations, indicating that major bacteria were closely related to the apparent digestibility of nutrients, nitrogen metabolism, blood antioxidant indexes, and rumen fermentation parameters (Figure 4). In the rumen (Figure 4A), Succiniclasticum (class Negativicutes) was positively associated with ether extract digestibility (EED) (p < 0.01), dry matter digestibility (DMD) (p < 0.05), urinary nitrogen (p < 0.05), CAT (p < 0.01), and T-AOC (p < 0.05) and negatively correlated with acetate (p < 0.05), isobutyrate (p < 0.05), butyrate (p < 0.05), the acetate-to-propionate ratio (p < 0.01), and total VFA (p < 0.05). Fibrobacter (phylum Fibrobacterota) was negatively correlated with EED (p < 0.05).

4. Discussion

The condensed tannins and lignins in GP emerge as pivotal factors influencing digestive processes [27,28]. However, recent studies have demonstrated that CT from various sources and with distinct chemical structures exhibit clear dose effects but above a certain threshold can cause negative effects [29]. Total tannins can be beneficial bioactive compounds in ruminant diets when included at levels below 3% of dietary dry matter [30]. In this study, the total tannin content within the 20% dried grape pomace diet did not surpass 2 g/kg. Despite this, the observed ADG and apparent digestibility of the beef cattle were lower compared to those in the control group. These findings suggest that the limitations observed in the diet were attributed to more than just the tannin content in the GP. Lignin acts as a physical barrier against rumen microorganisms, inhibiting the degradation of cell walls. This hindrance in the digestive processes results in a decrease in the apparent digestibility of nutrients [31,32,33]. Abarghuei et al. [32] observed that even after eliminating the influence of CT, the apparent digestibility of nutrients remained significantly reduced. This finding underscores that lignin independently exerts a detrimental impact on the growth performance of beef cattle. In this study, the lignin content (ADL = 7.88% DM) observed in the G20 group may have negatively influenced the growth performance of the beef cattle. Consequently, it is imperative to consider both the tannin and lignin content when incorporating GP into the diet.
Upon entering the rumen, dietary lipids transform processes such as lipolysis and fatty acid biohydrogenation (BH). A portion is hydrolyzed by microbial lipases, yielding nutrients such as glycerol for bacterial utilization [34]. The remaining lipids proceed through the rumen and are digested and absorbed in the small intestine. The microbial results of this experiment showed that Butyrivibrio (Figure 3) was the dominant genus in group G0, which was shown to be involved in further steps of BH after lipolysis [10]. After the addition of GP, the dominant genera changed to unclassified-Christensenellaceae and Pantoea in the rumen. Additionally, research indicates that tannins can diminish the release of free fatty acids by inhibiting lipase activity, and they can impede lipid digestion by binding to bile salts [35]. In this experiment, the EED of the 20% group exhibited a decrease, aligning with the findings observed by Molosse [36]. This decline may be attributed to the inhibitory effects of the tannins in GP on lipid absorption.
Our observations revealed a linear decrease in urinary nitrogen with an increasing addition of GP, a phenomenon likely attributed to the concurrent rise in tannin content. This correlation suggests the direct impact of the tannin content in GP on ruminal protein metabolism. Relevant studies indicate that supplementing feed with the appropriate tannins can alter the nitrogen pathway, facilitating nitrogen transfer from the urine to the feces [37,38]. This, in turn, contributes to a reduction in the loss of highly volatile forms of nitrogen. On the one hand, tannins bind with a portion of the protein in the rumen, leading to decreased utilization of dietary protein within the rumen. On the other hand, tannins interact with proteins, causing a shift in the location of nitrogen metabolism and digestion. Additionally, this diminishes microbial enzyme activity, thereby slowing down the growth rate of hydrolytic bacteria and reducing the production of ruminal NH3-N. Rumen microorganisms absorb excess nitrogen into NH3-N and convert it into urea and then excrete it through the urine or circulate it in the intestine. Consequently, the interaction between tannins and proteins in the rumen can mitigate the conversion of nitrogen in the diet, reducing the urinary nitrogen content [39]. Therefore, the utilization of GP holds significant potential for promoting the green and low-carbon development of beef cattle. Previous studies have established a positive correlation between fecal nitrogen excretion and urinary nitrogen and nitrogen intake [40]. The nitrogen in feces predominantly exists as organic nitrogen, which exhibits lower volatility. Conversely, the nitrogen in urine primarily exists in the form of urea, which undergoes rapid oxidation into NO3 and nitrite (N2O) through soil nitrification [41]. This process generates N2O, an intermediate product recognized as a potent greenhouse gas. In contrast, the addition of GP allows for a reduction in the degradation and deamination rate of dietary protein in the rumen [37,42,43]. This alteration in the nitrogen pathways helps mitigate N2O emissions, thereby contributing to the goal of reducing greenhouse gas emissions during both production and manure treatment.
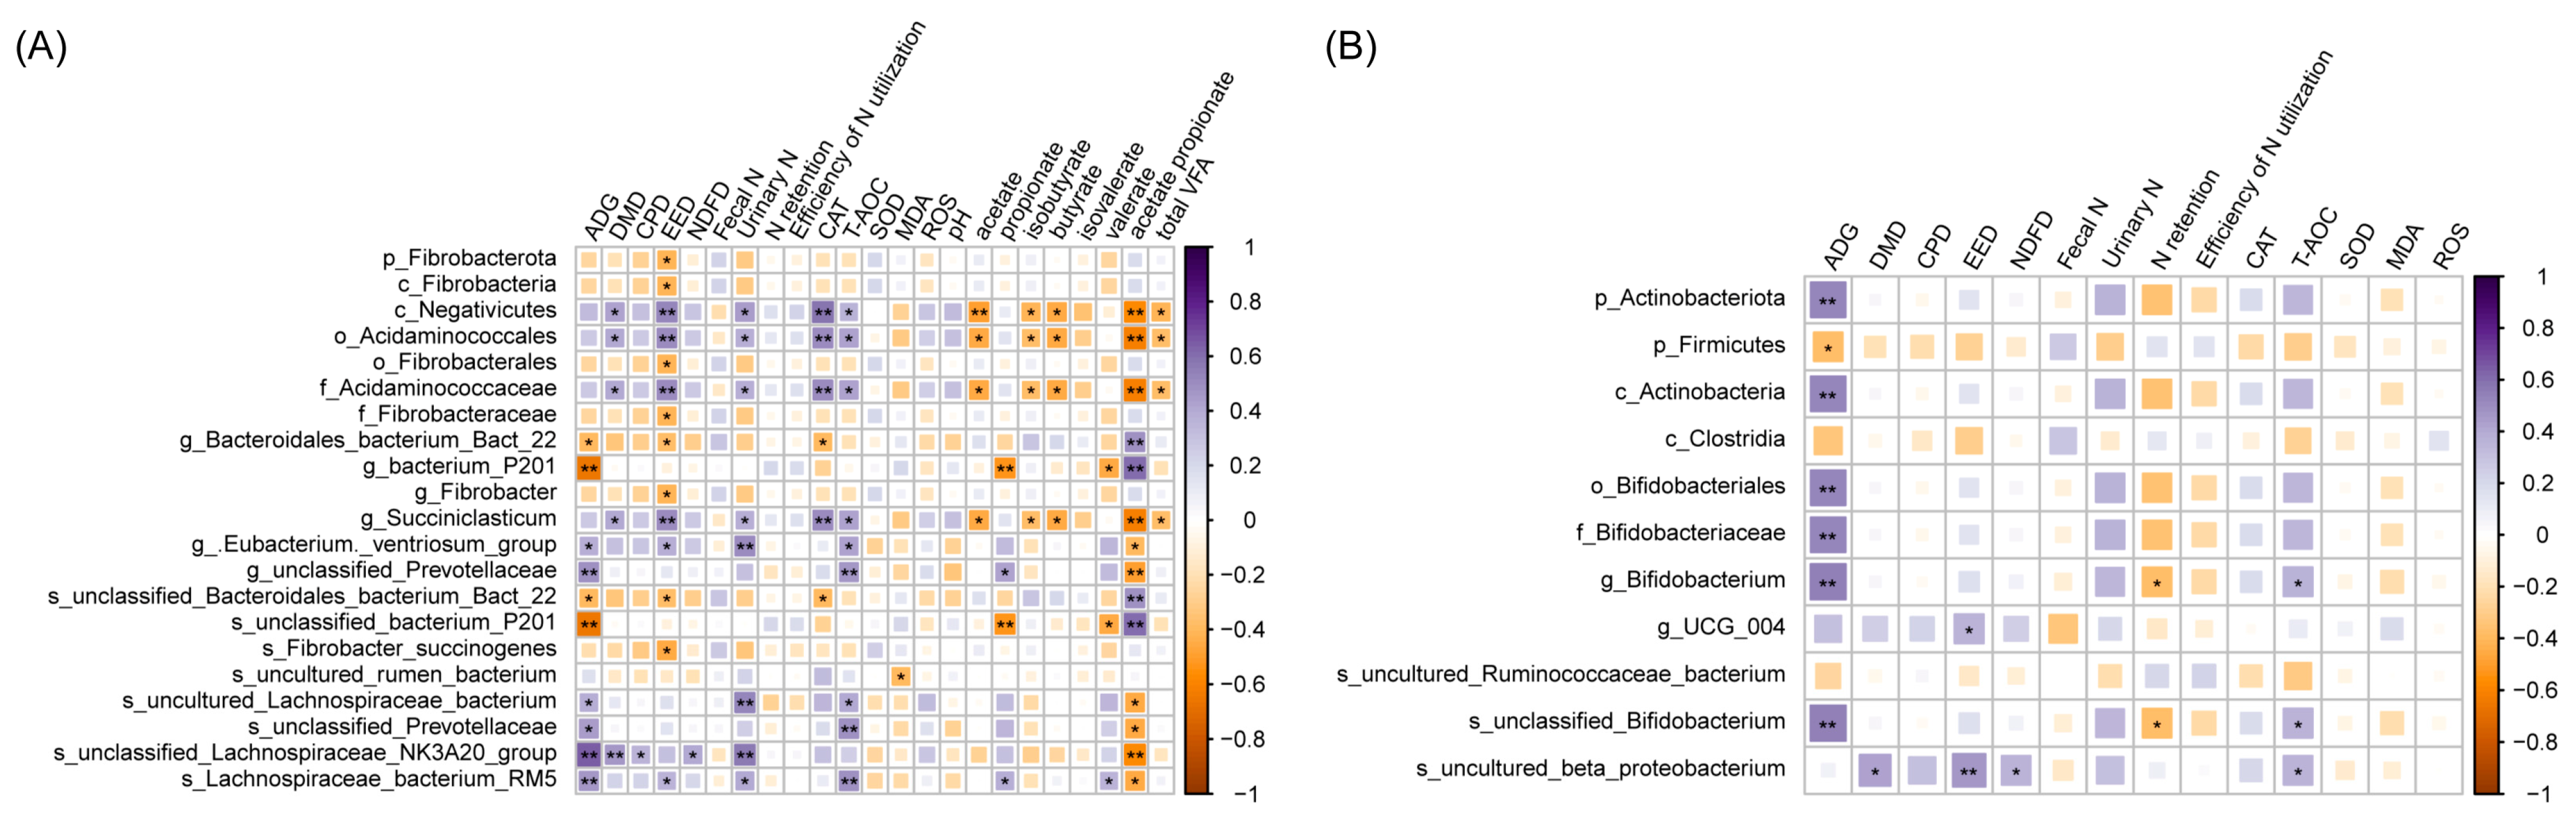
During times of oxidative stress, cells generate a significant amount of reactive oxygen species (ROS). This increase in ROS levels can lead to inflammation, prompting the body to rely on antioxidant enzymes and antioxidants for the purpose of counteracting the sudden rise in ROS. Examples include SOD and CAT, which act to safeguard cells against the damage caused by ROS [44,45]. High-concentrate diets promote oxidative stress in beef cattle, so we can promote increases in endogenous antioxidants (SOD and CAT) by supplementing exogenous antioxidant molecules to offset the ROS of beef cattle. SOD is the first line of defense, catalyzing superoxides to produce oxygen and hydrogen peroxide, while CAT neutralizes the decomposition of hydrogen peroxide into oxygen and water [46]. Veras [47] showed that tannic acid in feed promoted an increased CAT concentration in mice. Feed including 10% GP was found to increase the concentration of CAT, similar to the results of previous studies. However, a high proportion of GP in the diet did not improve the antioxidant levels in beef cattle. This could be due to the pro-oxidation effect of a high proportion of polyphenol compounds in beef cattle. Studies have shown that the polyphenols in bilberry extract lead to apoptosis in cancer cells by increasing intracellular ROS levels [48]. Combined with heatmap analysis, although the SOD concentration in the serum did not significantly change in the 20% group in this experiment, the abundance of Bifidobacterium decreased after they were fed 20% GP, and Bifidobacterium was negatively correlated with T-AOC. Therefore, we speculated that 20% added GP may be the counterbalance of antioxidant and pro-oxidation effects in the body, but further studies are needed to confirm this.
The digestion and utilization of feed in ruminants are primarily linked to the capacity of the rumen microbial community to convert potentially digestible feed into metabolizable nutrients [49]. Rumen microorganisms play a dual role, satisfying the majority of the nutritional requirements for ruminants and accounting for up to 90% of their metabolic needs [50,51]. The results of this experiment indicate that the diversity of rumen microorganisms in beef cattle remains unaltered. This suggests that including GP in the diet does not induce microbial disorders in the rumen of beef cattle during the fattening period. Generally, the rumen exhibits the highest proportion of Bacteroidetes, followed by Firmicutes [52,53,54]. It is worth noting that the body weight of beef cattle in the 20% group decreased in this trial, suggesting a potential association with alterations in rumen species distribution (Figure 1) and the characteristics of diet (Table 2). Bacteroidetes have exhibited precise mechanisms of orchestrating the expression of polysaccharide-degrading enzymes, thereby regulating carbohydrate digestion and absorption at the genetic level [55,56]. Firmicutes play a role in promoting the digestion and absorption of proteins within animal organisms. Additionally, they can produce free enzymes, cellulosomes, or multi-enzyme complexes during the process of fiber digestion [56]. This collaborative action facilitates the degradation of polysaccharides and the production of lactic acid and butyric acid, which can be utilized by the liver and muscle tissues [57]. Furthermore, an investigation into the gastrointestinal tract of humans and mice indicated a positive association between the Firmicutes/Bacteroidetes ratios and obesity. The study suggested that Firmicutes/Bacteroidetes influence fat storage by regulating the energy absorption efficiency [58,59]. This aligns with our observation that the relative abundance of Firmicutes in the G20 group was diminished, consequently impacting the energy absorption from the diet in the beef cattle and reducing the FCR.
Additionally, the proportion of added GP will impact the composition of the rumen microbiota. Interestingly, including 20% GP in the diet increased the abundance of Fibrobacterium in the rumen. This observation may signify a metabolic strategy beef cattle employ to adapt to higher-lignocellulose diets. F. succinogenes belongs to Fibrobacterota. The protein in the outer membrane that Succinogenes possesses has a distinctive ability to bind cellulose, which plays a crucial role in fiber degradation [56,60,61]. An elevated lignocellulose content promotes the growth of Fibrobacteria, facilitating their increased production of VFA, essential to the host animal’s maintenance, reproduction, and growth [62]. However, the proliferation of fibrolytic bacteria may increase the acetate/propionate ratio, potentially negatively affecting the efficiency of dietary energy utilization. In this study, adding 10% GP promoted the enrichment of Succiniclasticum. Succiniclasticum, classified within the Negativicutes class, is the primary bacterium engaged in the succinic acid pathway, producing propionic acid. The relative abundance of Succiniclasticum showed a positive correlation with propionic acid production [63]. Hence, the addition of 10% GP can partially facilitate an increase in the acetate-to-propionate ratio in beef cattle, thereby contributing to a balance in the impact of Succinogenes. The heatmap showed that the antioxidant index (CAT and T-AOC) had a significant positive correlation with Succiniclasticum, indicating that the addition of 10% GP is conducive to improving the genes of Succiniclasticum, thus improving the health of beef cattle.
Nevertheless, when the GP is increased to 20%, the stability of the microbial structure in the rumen diminishes. This could be attributed to the excessive addition of GP, disrupting the composition of the rumen microbial community and causing alterations in the keystone taxa of the rumen microorganisms. Keystone taxa significantly influence microbial communities and functions, irrespective of the abundance of microbiota across spatial and temporal dimensions [64]. Katharine et al. [65] argue that although positive interactions improve the overall metabolic efficiency, they reduce ecological stability. Thus, a higher neg/pos ratio indicates weaker microbial competition and a more stable network structure. In combination with other indicators, the network diagram became more complex with an increase in GP, but the microbial network diagram did not become more stable with an increase in GP. The stability of the microbial network and the antioxidant indexes both increased first and then decreased. These results suggested that the stability of the rumen microbiota may be affected by the antioxidant properties of GP after feeding, thus affecting the overall metabolic efficiency, which may also explain the decrease in body weight and the apparent digestibility of nutrients observed in G20.
In this study, rectum Firmicutes showed a relative abundance increase with an elevated GP intake, while Bacteroidetes linearly decreased. It is a pity that there is a paucity of studies on the rectal microbiota of ruminants. A study of human feces revealed a correlation between this trend and bacteria aiding the further breakdown of tannins into phenolic acids [66]. However, whether the breakdown products in beef cattle align with those in the human gastrointestinal tract remains to be explored.
We observed an increase in the relative abundance of Lachnospiraceae after feeding with 20% GP, potentially attributable to an elevation in polyphenols in the diet. Studies have demonstrated that polyphenols can modulate the relative abundance of Lachnospiraceae in the rectum, aligning with the findings of this study [67]. Moreover, Lachnospiraceae have been associated with maintaining healthy immune homeostasis and preventing human inflammatory diseases [68]. Including GP may play a role in modulating hindgut health in beef cattle. In this study, the relative abundance of UCG_004 decreased after adding 20% GP. UCG_004, a member of Erysipelatoclostridiaceae, is a potential pathogen associated with colon diseases [69]. Previous reports have indicated that polyphenols can enhance ruminants’ antioxidant activity by constraining pathogenic bacteria’s growth [15,70], and the results of this study suggest the potential that adding a certain proportion of GP may contribute to reducing inflammation in diseases.

5. Conclusions

In the current study, the optimal proportion of GP added to the feed of Angus bulls during the fattening period appeared to be 10%. At this ratio, there was no observed negative impact on the growth performance and apparent digestibility of the beef cattle, while the urinary nitrogen emissions showed a reduction, and the antioxidant activity was increased. The predominant rumen bacteria in G10 was Succiniclasticum, which was positively correlated with the antioxidant indexes of the beef cattle. Adding 10% GP resulted in more favorable microbial community complexity and stability. These findings offer valuable insights into the potential benefits of incorporating GP into the diet of ruminants.

Supplementary Materials

The following supporting information can be downloaded at https://0-www-mdpi-com.brum.beds.ac.uk/article/10.3390/antiox13040412/s1. Table S1. Effects of dried grape pomace at different levels on bacterial composition in rumen and rectum at the phylum level (relative abundance > 0.01%) of beef cattle. Table S2. Effects of dried grape pomace at different levels on bacterial composition in rumen and rectum at the family level (relative abundance > 0.1%) of beef cattle. Table S3. Effects of dried grape pomace at different levels on bacterial composition in rumen and rectum at the genus level (relative abundance > 0.5%) of beef cattle.

Author Contributions

Y.L. and H.S.: conceptualization; Y.L., H.S. and C.S.: methodology; Y.L., H.S. and J.D.: formal analysis; Y.L. and H.S.: writing—original draft preparation; Y.L. and H.S.: investigation; Y.L., H.S., X.Q. (Xinjun Qiu) and S.Z.: data curation; Y.L.: writing—review and editing; Y.L., H.W., X.Q. (Xiaoli Qin), Y.H. and B.C.: supervision; H.S.: funding acquisition, project administration. All authors have read and agreed to the published version of the manuscript.

Funding

This research was funded by the National Key R&D Program of China (2023YFD1300900), the Key Technology R&D Program of Ningxia (2017BY078), and the China Agriculture Research Systems of MOF and MARA (CARS-37).

Institutional Review Board Statement

All the experimental procedures were approved by the Ethics Committee of the College of Animal Science and Technology at China Agriculture University (approval number AW82113202-1-1, Beijing, China).

Informed Consent Statement

Not applicable.

Data Availability Statement

The original manuscript of this study is included in the article, and further information is available upon reasonable request to the corresponding author.

Acknowledgments

We gratefully acknowledge the help from all the staff at the Ben Wang beef cattle farm in Yinchuan City, Ningxia Province. We also want to thank BMKCloud (www.biocloud.net) for the characterization.

Conflicts of Interest

The authors declare that the research was conducted in the absence of any commercial or financial relationships that could be construed as potential conflicts of interest.

References

  1. Constantin, O.E.; Stoica, F.; Ratu, R.N.; Stanciuc, N.; Bahrim, G.E.; Rapeanu, G. Bioactive Components, Applications, Extractions, and Health Benefits of Winery By-Products from a Circular Bioeconomy Perspective: A Review. Antioxidants 2024, 13, 100. [Google Scholar] [CrossRef] [PubMed]
  2. Beres, C.; Costa, G.; Cabezudo, I.; Silva-James, N.; Teles, A.S.C.; Cruz, A.P.G.; Mellinger-Silva, C.; Tonon, R.V.; Cabral, L.M.C.; Freitas, S.P. Towards integral utilization of grape pomace from winemaking process: A review. Waste Manag. 2017, 68, 581–594. [Google Scholar] [CrossRef]
  3. Martins Flores, D.R.; Franco Da Fonseca, P.A.; Schmitt, J.; Tonetto, C.J.; Rosado Junior, A.G.; Hammerschmitt, R.K.; Facco, D.B.; Brunetto, G.; Nornberg, J.L. Lambs fed with increasing levels of grape pomace silage: Effects on productive performance, carcass characteristics, and blood parameters. Livest. Sci. 2020, 240, 104169. [Google Scholar] [CrossRef]
  4. Ilyas, T.; Chowdhary, P.; Chaurasia, D.; Gnansounou, E.; Pandey, A.; Chaturvedi, P. Sustainable green processing of grape pomace for the production of value-added products: An overview. Environ. Technol. Innov. 2021, 23, 101592. [Google Scholar] [CrossRef]
  5. Ianni, A.; Luca, A.D.; Martino, C.; Bennato, F.; Marone, E.; Grotta, L.; Cichelli, A.; Martino, G. Dietary Supplementation of Dried Grape Pomace Increases the Amount of Linoleic Acid in Beef, Reduces the Lipid Oxidation and Modifies the Volatile Profile. Animals 2019, 9, 578. [Google Scholar] [CrossRef]
  6. Voicu, D.; Habeanu, M.; Uta, R.A.; Voicu, I.; Gras, M.A. Effect of the dietary dry grape pomace on the performance and health state of fattening steers. Scientific Papers, Series D. Anim. Sci. 2014, 57, 118–124. [Google Scholar]
  7. Tayengwa, T.; Chikwanha, O.C.; Dugan, M.E.R.; Mutsvangwa, T.; Mapiye, C. Influence of feeding fruit by-products as alternative dietary fibre sources to wheat bran on beef production and quality of Angus steers. Meat Sci. 2020, 161, 107969. [Google Scholar] [CrossRef]
  8. Huang, Q.; Liu, X.; Zhao, G.; Hu, T.; Wang, Y. Potential and challenges of tannins as an alternative to in-feed antibiotics for farm animal production. Anim. Nutr. 2018, 4, 137–150. [Google Scholar] [CrossRef]
  9. Reddy, P.R.K.; Elghandour, M.M.M.Y.; Salem, A.Z.M.; Yasaswini, D.; Reddy, P.P.R.; Reddy, A.N.; Hyder, I. Plant secondary metabolites as feed additives in calves for antimicrobial stewardship. Anim. Feed. Sci. Technol. 2020, 264, 114469. [Google Scholar] [CrossRef]
  10. Vasta, V.; Daghio, M.; Cappucci, A.; Buccioni, A.; Serra, A.; Viti, C.; Mele, M. Invited review: Plant polyphenols and rumen microbiota responsible for fatty acid biohydrogenation, fiber digestion, and methane emission: Experimental evidence and methodological approaches. J. Dairy. Sci. 2019, 102, 3781–3804. [Google Scholar] [CrossRef]
  11. Ricci, A.; Olejar, K.J.; Parpinello, G.P.; Mattioli, A.U.; Teslic, N.; Kilmartin, P.A.; Versari, A. Antioxidant activity of commercial food grade tannins exemplified in a wine model. Food Addit. Contam. Part A Chem. Anal. Control Expo. Risk Assess. 2016, 33, 1761–1774. [Google Scholar] [CrossRef]
  12. Zhao, J.X.; Li, Q.; Zhang, R.X.; Liu, W.Z.; Ren, Y.S.; Zhang, C.X.; Zhang, J.X. Effect of dietary grape pomace on growth performance, meat quality and antioxidant activity in ram lambs. Anim. Feed. Sci. Technol. 2018, 236, 76–85. [Google Scholar] [CrossRef]
  13. Guil-Guerrero, J.L.; Ramos, L.; Moreno, C.; Zuniga-Paredes, J.C.; Carlosama-Yepez, M.; Ruales, P. Antimicrobial activity of plant-food by-products: A review focusing on the tropics. Livest. Sci. 2016, 189, 32–49. [Google Scholar] [CrossRef]
  14. Martins, I.M.; Macedo, G.A.; Macedo, J.A. Biotransformed grape pomace as a potential source of anti-inflammatory polyphenolics: Effects in Caco-2 cells. Food Biosci. 2020, 35, 100607. [Google Scholar] [CrossRef]
  15. Kafantaris, I.; Kotsampasi, B.; Christodoulou, V.; Kokka, E.; Kouka, P.; Terzopoulou, Z.; Gerasopoulos, K.; Stagos, D.; Mitsagga, C.; Giavasis, I.; et al. Grape pomace improves antioxidant capacity and faecal microflora of lambs. J. Anim. Physiol. Anim. Nutr. 2017, 101, e108–e121. [Google Scholar] [CrossRef]
  16. Sordillo, L.M. Nutritional strategies to optimize dairy cattle immunity. J. Dairy. Sci. 2016, 99, 4967–4982. [Google Scholar] [CrossRef]
  17. Martin, K.R.; Appel, C.L. Polyphenols as dietary supplements: A double-edged sword. Nutr. Diet. Suppl. 2010, 2, 1–12. [Google Scholar] [CrossRef]
  18. Vinyard, J.R.; Myers, C.A.; Murdoch, G.K.; Rezamand, P.; Chibisa, G.E. Optimum grape pomace proportion in feedlot cattle diets: Ruminal fermentation, total tract nutrient digestibility, nitrogen utilization, and blood metabolites. J. Anim. Sci. 2021, 99, skab044. [Google Scholar] [CrossRef]
  19. National Research Council (NRC). Nutrient Requirements of Beef Cattle, 8th ed.; National Academy Press: Washington, DC, USA, 2016. [Google Scholar]
  20. Li, Y.; Shi, C.; Deng, J.; Cui, Y.; Wang, L.; Zhang, S.; Jiang, W.; Wang, R.; Cao, B.; Su, H. Effects of grape pomace with different processing methods on growth performance, digestion and metabolism and economic benefit of beef cattle. Chin. J. Anim. Nutr. 2022, 34, 5891–5901. [Google Scholar]
  21. Wang, F. Establishment and Evaluation of Effective Energy Prediction Model in Feeds of Beef Cattle. Ph.D. Thesis, China Agriculture University, Beijing, China, 2016. [Google Scholar]
  22. Vansoest, P.J.; Robertson, J.B.; Lewis, B.A. Methods for Dietary Fiber, Neutral Detergent Fiber, and Nonstarch Polysaccharides in Relation to Animal Nutrition. J. Dairy. Sci. 1991, 74, 3583–3597. [Google Scholar] [CrossRef]
  23. Association, O.O.A.C.; Horwitz, W. Official Methods of Analysis; Association of Official Analytical Chemists: Washington, DC, USA, 1975. [Google Scholar]
  24. Zhong, R.Z.; Li, J.G.; Gao, Y.X.; Tan, Z.L.; Ren, G.P. Effects of substitution of different levels of steam-flaked corn for finely ground corn on lactation and digestion in early lactation dairy cows. J. Dairy. Sci. 2008, 91, 3931–3937. [Google Scholar] [CrossRef]
  25. Silva, L.; Filho, S.; Chizzotti, M.L.; Rotta, P.P.; Braga, J. Creatinine excretion and relationship with body weight of Nellore cattle. Rev. Bras. Zootec. 2013, 41, 807–810. [Google Scholar] [CrossRef]
  26. Segata, N.; Izard, J.; Waldron, L.; Gevers, D. Metagenomic biomarker discovery and explanation. Genome Biol. 2011, 12, R60. [Google Scholar] [CrossRef]
  27. Mirzaei-Aghsaghali, A.; Maheri-Sis, N.; Mansouri, H.; Razeghi, M.E.; Alipoor, K. Estimation of the nutritive value of grape pomace for ruminant using gas production technique. Afr. J. Biotechnol. 2011, 10, 6251–6256. [Google Scholar]
  28. Chikwanha, O.C.; Raffrenato, E.; Muchenje, V.; Musarurwa, H.T.; Mapiye, C. Varietal differences in nutrient, amino acid and mineral composition and in vitro rumen digestibility of grape (Vitis vinifera) pomace from the Cape Winelands vineyards in South Africa and impact of preservation techniques. Ind. Crops Prod. 2018, 118, 30–37. [Google Scholar] [CrossRef]
  29. Makmur, M.; Zain, M.; Sholikin, M.M.; Suharlina; Jayanegara, A. Modulatory effects of dietary tannins on polyunsaturated fatty acid biohydrogenation in the rumen: A meta-analysis. Heliyon 2022, 8, e09828. [Google Scholar] [CrossRef]
  30. Yanza, Y.R.; Fitri, A.; Suwignyo, B.; Elfahmi; Hidayatik, N.; Kumalasari, N.R.; Irawan, A.; Jayanegara, A. The Utilisation of Tannin Extract as a Dietary Additive in Ruminant Nutrition: A Meta-Analysis. Animals 2021, 11, 3317. [Google Scholar] [CrossRef]
  31. Winkler, A.; Weber, F.; Ringseis, R.; Eder, K.; Dusel, G. Determination of polyphenol and crude nutrient content and nutrient digestibility of dried and ensiled white and red grape pomace cultivars. Arch. Anim. Nutr. 2015, 69, 187–200. [Google Scholar] [CrossRef]
  32. Abarghuei, M.J.; Rouzbehan, Y.; Alipour, D. The influence of the grape pomace on the ruminal parameters of sheep. Livest. Sci. 2010, 132, 73–79. [Google Scholar] [CrossRef]
  33. Fahey, G.C.; Mertens, D.R. Regulation of Forage Intake. In Forage Quality, Evaluation, and Utilization; Wiley Press: Hoboken, NJ, USA, 1994. [Google Scholar]
  34. Kansagara, Y.K.; Savsani, H.H.; Chavda, M.R.; Chavda, J.A.; Belim, S.Y.; Makwana, K.R.; Kansagara, B.K. Rumen microbiota and nutrient metabolism: A review. Bhartiya Krishi Anusandhan Patrika 2022, 37, 320–327. [Google Scholar] [CrossRef]
  35. Li, X.; Jiao, W.; Zhang, W.; Xu, Y.; Cao, J.; Jiang, W. Characterizing the Interactions of Dietary Condensed Tannins with Bile Salts. J. Agric. Food Chem. 2019, 67, 9543–9550. [Google Scholar] [CrossRef]
  36. Molosse, V.L.; Deolindo, G.L.; Lago, R.V.P.; Cecere, B.G.O.; Zotti, C.A.; Vedovato, M.; Copetti, P.M.; Fracasso, M.; Morsch, V.M.; Xavier, A.C.H.; et al. The effects of the inclusion of ensiled and dehydrated grape pomace in beef cattle diet: Growth performance, health, and economic viability. Anim. Feed. Sci. Technol. 2023, 302, 115671. [Google Scholar] [CrossRef]
  37. Grainger, C.; McGinn, S.M.; Clarke, T.; Eckard, R.J.; Beauchemin, K.A.; Auldist, M.J.; Waghorn, G.C. Potential use of Acacia mearnsii condensed tannins to reduce methane emissions and nitrogen excretion from grazing dairy cows. Can. J. Anim. Sci. 2009, 89, 241–251. [Google Scholar] [CrossRef]
  38. De Klein, C.A.M.; Eckard, R.J. Targeted technologies for nitrous oxide abatement from animal agriculture. Aust. J. Exp. Agric. 2008, 48, 14–20. [Google Scholar] [CrossRef]
  39. Kebreab, E.; France, J.; Mills, J.; Allison, R.; Dijkstra, J. A dynamic model of N metabolism in the lactating dairy cow and an assessment of impact of N excretion on the environment. J. Anim. Sci. 2002, 80, 248–259. [Google Scholar] [CrossRef]
  40. Burke, F.; O’Donovan, M.A.; Murphy, J.J.; O’Mara, F.P.; Mulligan, F.J. Effect of pasture allowance and supplementation with maize silage and concentrates differing in crude protein concentration on milk production and nitrogen excretion by dairy cows. Livest. Sci. 2008, 114, 325–335. [Google Scholar] [CrossRef]
  41. Gao, J.; Zhao, G. Potentials of using dietary plant secondary metabolites to mitigate nitrous oxide emissions from excreta of cattle: Impacts, mechanisms and perspectives. Anim. Nutr. 2022, 9, 327–334. [Google Scholar] [CrossRef]
  42. Wischer, G.; Greiling, A.; Boguhn, J.; Steingass, H.; Schollenberger, M.; Hartung, K.; Rodehutscord, M. Effects of long-term supplementation of chestnut and valonea extracts on methane release, digestibility and nitrogen excretion in sheep. Animal 2014, 8, 938–948. [Google Scholar] [CrossRef]
  43. Chibisa, G.E.; Ream, C.; Stevens, A. Effects of feeding ensiled or dried grape pomace on measures of nitrogen utilization in backgrounding cattle. J. Anim. Sci. 2020, 984, 428. [Google Scholar] [CrossRef]
  44. Pizzino, G.; Irrera, N.; Cucinotta, M.; Pallio, G.; Mannino, F.; Arcoraci, V.; Squadrito, F.; Altavilla, D.; Bitto, A. Oxidative Stress: Harms and Benefits for Human Health. Oxid. Med. Cell Longev. 2017, 2017, 8416763. [Google Scholar] [CrossRef]
  45. Zhou, D.; Yang, Q.; Tian, T.; Chang, Y.; Li, Y.; Duan, L.; Li, H.; Wang, S. Gastroprotective effect of gallic acid against ethanol-induced gastric ulcer in rats: Involvement of the Nrf2/HO-1 signaling and anti-apoptosis role. Biomed. Pharmacother. 2020, 126, 110075. [Google Scholar] [CrossRef]
  46. He, L.; He, T.; Farrar, S.; Ji, L.; Liu, T.; Ma, X. Antioxidants Maintain Cellular Redox Homeostasis by Elimination of Reactive Oxygen Species. Cell. Physiol. Biochem. 2017, 44, 532–553. [Google Scholar] [CrossRef]
  47. de Veras, B.O.; Da Silva, M.V.; Cabral Ribeiro, P.P. Tannic acid is a gastroprotective that regulates inflammation and oxidative stress. Food Chem. Toxicol. 2021, 156, 112482. [Google Scholar] [CrossRef]
  48. Alhosin, M.; Leon-Gonzalez, A.J.; Dandache, I.; Lelay, A.; Rashid, S.K.; Kevers, C.; Pincemail, J.; Fornecker, L.; Mauvieux, L.; Herbrecht, R.; et al. Bilberry extract (Antho 50) selectively induces redox-sensitive caspase 3-related apoptosis in chronic lymphocytic leukemia cells by targeting the Bcl-2/Bad pathway. Sci. Rep. 2015, 5, 8996. [Google Scholar] [CrossRef]
  49. Lovendahl, P.; Difford, G.F.; Li, B.; Chagunda, M.G.G.; Huhtanen, P.; Lidauer, M.H.; Lassen, J.; Lund, P. Review: Selecting for improved feed efficiency and reduced methane emissions in dairy cattle. Animal 2018, 122, S336–S349. [Google Scholar] [CrossRef]
  50. Mizrahi, I.; Jami, E. Review: The compositional variation of the rumen microbiome and its effect on host performance and methane emission. Animal 2018, 122, S220–S232. [Google Scholar] [CrossRef]
  51. Lin, L.; Xie, F.; Sun, D.; Liu, J.; Zhu, W.; Mao, S. Ruminal microbiome-host crosstalk stimulates the development of the ruminal epithelium in a lamb model. Microbiome 2019, 7, 83. [Google Scholar] [CrossRef]
  52. Wang, T.; Jiao, J.; Wang, H.; Degen, A.A.; Gou, N.; Li, S.; Bai, Y.; Shang, Z. The effects of supplementing sweet sorghum with grapeseeds on dry matter intake, average daily gain, feed digestibility and rumen parameters and microbiota in lambs. Anim. Feed. Sci. Technol. 2021, 272, 114750. [Google Scholar] [CrossRef]
  53. Pitta, D.W.; Pinchak, W.E.; Indugu, N.; Vecchiarelli, B.; Sinha, R.; Fulford, J.D. Metagenomic Analysis of the Rumen Microbiome of Steers with Wheat-Induced Frothy Bloat. Front. Microbiol. 2016, 7, 689. [Google Scholar] [CrossRef]
  54. Effects of brewers’ spent grain protein hydrolysates on gas production, ruminal fermentation characteristics, microbial protein synthesis and microbial community in an artificial rumen fed a high grain diet. J. Anim. Sci. Biotechnol. 2021, 12, 314–327.
  55. Li, L.; Cheng, S.; Diao, Q.; Fu, T.; Bi, Y.; Wang, A.; Li, M.; Tu, Y. Effects of diets with different NFC/NDF levels on the rumen fermentation parameters and bacterial community in male calves. Acta Vet. Zootech. Sin. 2017, 48, 2347–2357. [Google Scholar]
  56. Gharechahi, J.; Vahidi, M.F.; Sharifi, G.; Ariaeenejad, S.; Ding, X.; Han, J.; Salekdeh, G.H. Lignocellulose degradation by rumen bacterial communities: New insights from metagenome analyses. Environ. Res. 2023, 229, 115925. [Google Scholar] [CrossRef]
  57. de Vos, W.M.; Tilg, H.; Van Hul, M.; Cani, P.D. Gut microbiome and health: Mechanistic insights. Gut 2022, 71, 1020–1032. [Google Scholar] [CrossRef]
  58. Ley, R.E.; Turnbaugh, P.J.; Klein, S.; Gordon, J.I. Microbial ecology—Human gut microbes associated with obesity. Nature 2006, 444, 1022–1023. [Google Scholar] [CrossRef]
  59. Sharma, V.; Smolin, J.; Nayak, J.; Ayala, J.E.; Scott, D.A.; Peterson, S.N.; Freeze, H.H. Mannose Alters Gut Microbiome, Prevents Diet-Induced Obesity, and Improves Host Metabolism. Cell Rep. 2018, 24, 3087–3098. [Google Scholar] [CrossRef]
  60. Ransom-Jones, E.; Jones, D.L.; McCarthy, A.J.; McDonald, J.E. The Fibrobacteres: An Important Phylum of Cellulose-Degrading Bacteria. Microb. Ecol. 2012, 63, 267–281. [Google Scholar] [CrossRef]
  61. Holman, D.B.; Gzyl, K.E. A meta-analysis of the bovine gastrointestinal tract microbiota. Fems Microbiol. Ecol. 2019, 95, fiz072. [Google Scholar] [CrossRef]
  62. Li, Q.S.; Wang, R.; Ma, Z.Y.; Zhang, X.M.; Jiao, J.Z.; Zhang, Z.G.; Ungerfeld, E.M.; Yi, K.L.; Zhang, B.Z.; Long, L.; et al. Dietary selection of metabolically distinct microorganisms drives hydrogen metabolism in ruminants. Isme J. 2022, 16, 2535–2546. [Google Scholar] [CrossRef]
  63. Liu, Z.; Wang, K.; Nan, X.; Cai, M.; Yang, L.; Xiong, B.; Zhao, Y. Synergistic Effects of 3-Nitrooxypropanol with Fumarate in the Regulation of Propionate Formation and Methanogenesis in Dairy Cows In Vitro. Appl. Environ. Microbiol. 2022, 88, e0190821. [Google Scholar] [CrossRef]
  64. Banerjee, S.; Schlaeppi, K.; van der Heijden, M.G.A. Keystone taxa as drivers of microbiome structure and functioning. Nat. Rev. Microbiol. 2018, 16, 567–576. [Google Scholar] [CrossRef] [PubMed]
  65. Coyte, K.Z.; Schluter, J.; Foster, K.R. The ecology of the microbiome: Networks, competition, and stability. Science 2015, 350, 663–666. [Google Scholar] [CrossRef] [PubMed]
  66. Li, Z.; Henning, S.M.; Lee, R.; Lu, Q.; Summanen, P.H.; Thames, G.; Corbett, K.; Downes, J.; Tseng, C.; Finegold, S.M.; et al. Pomegranate extract induces ellagitannin metabolite formation and changes stool microbiota in healthy volunteers. Food Funct. 2015, 6, 2487–2495. [Google Scholar] [CrossRef] [PubMed]
  67. Choy, Y.Y.; Quifer-Rada, P.; Holstege, D.M.; Frese, S.A.; Calvert, C.C.; Mills, D.A.; Lamuela-Raventos, R.M.; Waterhouse, A.L. Phenolic metabolites and substantial microbiome changes in pig feces by ingesting grape seed proanthocyanidins. Food Funct. 2014, 5, 2298–2308. [Google Scholar] [CrossRef] [PubMed]
  68. Leth, M.L.; Pichler, M.J.; Abou Hachem, M. Butyrate-producing colonic clostridia: Picky glycan utilization specialists. Essays Biochem. 2023, 67, 415–428. [Google Scholar] [PubMed]
  69. Yu, Z.; Li, D.; Sun, H. Herba Origani alleviated DSS-induced ulcerative colitis in mice through remolding gut microbiota to regulate bile acid and short-chain fatty acid metabolisms. Biomed. Pharmacother. 2023, 161, 114409. [Google Scholar] [CrossRef]
  70. Duenas, M.; Munoz-Gonzalez, I.; Cueva, C.; Jimenez-Giron, A.; Sanchez-Patan, F.; Santos-Buelga, C.; Moreno-Arribas, M.V.; Bartolome, B. A Survey of Modulation of Gut Microbiota by Dietary Polyphenols. Biomed. Res. Int. 2015, 2015, 850902. [Google Scholar] [CrossRef]
Figure 1. Microbial diversity and composition with dried grape pomace treatment at different levels in the rumen and rectum. Comparison of diversity metrics of microbial communities at the phylum (A,B) and genus (C,D) levels. Comparison of within-community richness (Chao1 estimates) (A,C) and diversity (Shannon’s index) of the microbiota of rumen and rectum among treatment groups (B,D). Box-whisker plots show average values of richness and diversity; boxes denote interquartile ranges with a line at the median; whiskers indicate minimal and maximal values; and error bars indicate the standard error for each treatment group. Different letters above bars indicate statistically significant differences between groups in (A,B) (p < 0.05). Microbial composition of different groups. Each bar represents the average relative abundance of each bacterial taxon within a group. (E) Taxa assignments at the phylum level. (F) Taxa assignments at the family level. (G) Taxa assignments at the genus level. G and FG indicate rumen and rectum. G0, the control group; G10, the 10% dried grape pomace treatment group; G20, the 20% dried grape pomace treatment group.
Antioxidants 13 00412 g001
Figure 2. LDA scores for the bacterial taxa differentially abundant among G0, G10, and G20 (LDA > 3.5). (A) is the result in the rumen; (B) is the result in the rectum. Red bars indicate taxa were enriched in G0; green bars indicate taxa were enriched in G10; and blue bars indicate taxa were enriched in G20. G0, the control group; G10, the 10% dried grape pomace treatment group; G20, the 20% dried grape pomace treatment group.
Antioxidants 13 00412 g002
Figure 3. Interaction networks of rumen and rectum microbiota based on dried grape pomace at different levels. The 16S-rRNA-gene-based correlation network of the microbiota is calculated from the bacteria with a relative abundance greater than 0.2%. (A) is G0 rumen; (B) is G10 rumen; (C) is G20 rumen; (D) is G0 rectum; (E) is G10 rectum; (F) is G20 rectum. Nodes represent individual genera; edges represent significant positive Spearman’s correlations (ρ > 0.7; p < 0.05). Node size is scaled based on the overall abundance of each taxon in the microbiota. Red edge indicates positive correlations, and green edge indicates negative corrections. The numbers of nodes and edges and average path lengths and average clustering coefficients of rumen and rectum bacteria co-occurrence patterns (GJ). Neg/pos (K); the ratio of negative correlation to positive correlation. Different letters above bars indicate statistically significant differences between groups in (GK) (p < 0.05). G0, the control group; G10, the 10% dried grape pomace treatment group; G20, the 20% dried grape pomace treatment group.
Antioxidants 13 00412 g003
Figure 4. Correlation between apparent digestibility of nutrients; rumen fermentation parameters (rectum results exclude this indicator); nitrogen metabolism; and bacteria abundance in the rumen (A) and rectum (B). Only significant correlations and bacteria abundances > 0.5% are shown. The colors denote whether the correlation is positive (closer to 1; purple) or negative (closer to −1; orange) between the bacteria and the efficiency parameters. Color intensity is proportional to Spearman’s rank correlation values. Spearman’s test, *; p < 0.05; **; p < 0.01.
Antioxidants 13 00412 g004
Table 1. Feed ingredient proportions of experimental diets. (DM basis, %).
ItemsG0G10G20
Ingredient composition
Corn silage26.0813.050.00
Rice straw11.6111.6111.60
DGP0.0010.4420.88
Ground corn39.9146.9353.69
Rapeseed meal7.226.696.49
Soybean meal2.162.172.14
Wheat bran7.823.910.00
NaHCO31.111.111.11
NaCl0.370.370.37
MgO0.440.440.44
Premix 13.283.283.28
Total100100100
1 One kilogram of premix contained the following: VA 120,000–200,000 IU; VE ≥ 550 IU; D-Biotin ≥ 0.3 mg; VD3 15,000–60,000 IU; VB3 ≥ 350 mg; Cu 0.16–0.5 g; Mn 0.6–2.4 g; Se 1.6–10 mg; Ca 100–200 g; Fe 0.8–8.4 g; Zn 1.5–3.0 g; I 4–20 mg; NaCl 100–200 g; TP ≥ 20 g. DGP, dried grape pomace.
Table 2. Chemical composition and fatty acid levels of basal diets (DM basis).
ItemsDCP 1G0G10G20
Chemical composition
CP; %11.6911.8911.4412.02
EE; %9.802.132.282.39
NDF; %42.7226.6927.8329.58
ADF; %40.6514.3816.4920.06
ADL; %21.242.433.887.88
Ash; %11.118.989.7910.92
TT; g/kg7.981.461.711.86
CT; g/kg2.491.551.741.84
TDN 2; %DM65.0874.8974.2073.12
DE 2; MJ/kg DM9.5512.5112.3011.98
Fatty acids (g/100 g of total fatty acid)
14:00.060.080.070.07
16:07.429.118.958.62
18:03.470.931.751.82
18:1n-910.9912.8912.9312.97
18:2n-655.9328.1634.3137.05
1 was adapted from Li et al. [20]. 2 TDN (total digestible nutrients) and DE (digestible energy) were calculated according to Wang (2016)’s [21] model. Note. G0, the control group; G10, the 10% dried grape pomace treatment group; G20, the 20% dried grape pomace treatment group; DGP, dried grape pomace; DM, dry matter; CP, crude protein; EE, ether extract; NDF, neutral detergent fiber; ADF, acid detergent fiber; ADL, acid detergent lignin; TT, total tannins; CT, condensed tannins.
Table 3. Effects of dried grape pomace at different levels on growth performance in Angus bulls.
ItemsG0G10G20SEMp-ValueLinearQuadratic
Initial live weights; kg580.40580.40580.907.8001.0000.9800.988
Final live weights; kg749.85746.75712.808.1410.1060.0540.376
ADG; kg1.47 a1.40 a1.14 b0.0520.0140.0060.354
FCR9.01 b9.37 b11.62 a0.4270.0150.0070.267
a,b Means within a row with different superscripts differ (p < 0.05). G0, the control group; G10, the 10% dried grape pomace treatment group; G20, the 20% dried grape pomace treatment group; SEM, standard error of the mean; ADG, average daily gain; FCR, feed conversion rate—the DMI/ADG ratio.
Table 4. Effects of dried grape pomace at different levels on nutrients’ apparent digestibility in Angus bulls.
ItemsG0G10G20SEMp-ValueLinearQuadratic
Apparent digestibility (%)
DM67.4865.8962.731.5260.4490.2180.810
CP67.0160.8059.931.7600.2060.1050.470
EE74.98 a73.81 a57.60 b2.6580.0070.0050.134
NDF50.4348.2344.712.0730.5410.2760.883
ADF43.6443.0439.012.1890.6590.4050.721
Nitrogen metabolism (g/d)
Nitrogen intake228.85233.85239.69----
Fecal nitrogen81.9489.4096.644.4340.4320.2000.991
Urinary nitrogen88.1574.7666.644.1080.1000.0340.751
Nitrogen retention66.1872.1083.366.1600.5400.2880.840
Nitrogen utilization (%)28.6831.9929.512.0790.8050.8800.523
a,b Means within a row with different superscripts differ (p < 0.05). G0, the control group; G10, the 10% dried grape pomace treatment group; G20, the 20% dried grape pomace treatment group; SEM, standard error of the mean; DM, dry matter; CP, crude protein; EE, ether extract; NDF, neutral detergent fiber; ADF, acid detergent fiber.
Table 5. Effects of dried grape pomace at different levels on blood antioxidant indexes of Angus bulls.
ItemsG0G10G20SEMp-ValueLinearQuadratic
CAT, U/mL13.22 b29.39 a7.25 b3.0190.0040.3500.002
T-AOC, Trolox Mm1.00 ab1.01 a0.96 b0.0080.0410.0570.082
SOD, U/mL13.7714.3414.060.2600.6810.6540.456
MDA, nmol/mL3.552.152.900.2870.1330.3430.080
ROS, IU/mL673.21869.22778.7537.7510.5790.5010.407
a,b Means within a row with different superscripts differ (p < 0.05). G0, the control group; G10, the 10% dried grape pomace treatment group; G20, the 20% dried grape pomace treatment group; SEM, standard error of the mean; CAT, catalase; T-AOC, total antioxidant capacity; SOD, superoxide dismutase; MDA, malondialdehyde; ROS, reactive oxygen species.
Table 6. Effects of dried grape pomace at different levels on rumen fermentation parameters in Angus bulls.
ItemsG0G10G20SEMp-ValueLinearQuadratic
pH6.366.576.420.0480.1810.5730.080
Ammonia-N; mg/dL5.094.634.040.2160.1770.0870.872
VFA; mmol/L
Acetate; mmol/L85.7882.4188.603.9210.8230.7770.581
Propionate; mmol/L26.6926.5221.551.2250.1510.0870.348
Isobutyrate; mmol/L0.940.961.110.0510.3320.1790.537
Butyrate; mmol/L16.6714.7315.690.9040.6980.6700.468
Isovalerate; mmol/L3.082.452.750.1580.2830.4010.178
Valerate; mmol/L1.581.361.260.0640.1210.0460.650
Acetate-to-propionate ratio3.27 b3.22 b4.27 a0.1750.0150.0140.102
Total VFA; mmol/L134.73128.43130.965.7200.9090.7960.728
a,b Means within a row with different superscripts differ (p < 0.05). G0, the control group; G10, the 10% dried grape pomace treatment group; G20, the 20% dried grape pomace treatment group. SEM, standard error of the mean.
Disclaimer/Publisher’s Note: The statements, opinions and data contained in all publications are solely those of the individual author(s) and contributor(s) and not of MDPI and/or the editor(s). MDPI and/or the editor(s) disclaim responsibility for any injury to people or property resulting from any ideas, methods, instructions or products referred to in the content.

