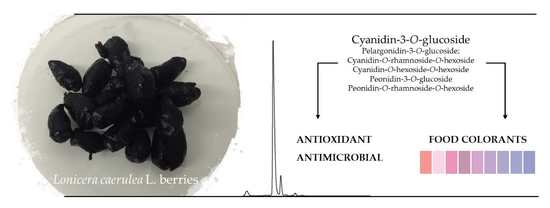
Promising Antioxidant and Antimicrobial Food Colourants from Lonicera caerulea L. var. Kamtschatica


 ,
,  ,
,  , , , and
Abstract
:
1. Introduction
2. Materials and Methods
2.1. Samples
2.2. Nutritional Value and Chemical Composition
2.2.1. Nutritional Value
2.2.2. Free Sugars
2.2.3. Organic Acids
2.2.4. Tocopherols
2.2.5. Fatty Acids
2.3. Extracts Preparation
2.3.1. Phenolic Compounds (Non-Anthocyanic) and Bioactive Properties Analysis
2.3.2. Anthocyanins Analysis
2.4. Phenolic Compounds
2.5. Bioactive Properties
2.5.1. Antioxidant Activity
2.5.2. Antimicrobial Activity
2.6. Juice Preparation
2.7. Pasteurization
2.8. Spay-Drying
2.9. Stability of the Colouring Formulations
2.9.1. Anthocyanins Concentration
2.9.2. Colour Parameters
2.9.3. Microbial Load
2.9.4. Cytotoxic Activity in Non-Tumour Cells
2.10. Statistical Analysis
3. Results and Discussion
3.1. Nutritional and Chemical Composition
3.1.1. Nutritional Composition
3.1.2. Free Sugars
3.1.3. Organic Acids
3.1.4. Tocopherols
3.1.5. Fatty Acids
3.2. Phenolic Composition
3.3. Bioactive Properties
3.3.1. Antioxidant Activity
3.3.2. Antimicrobial Activity
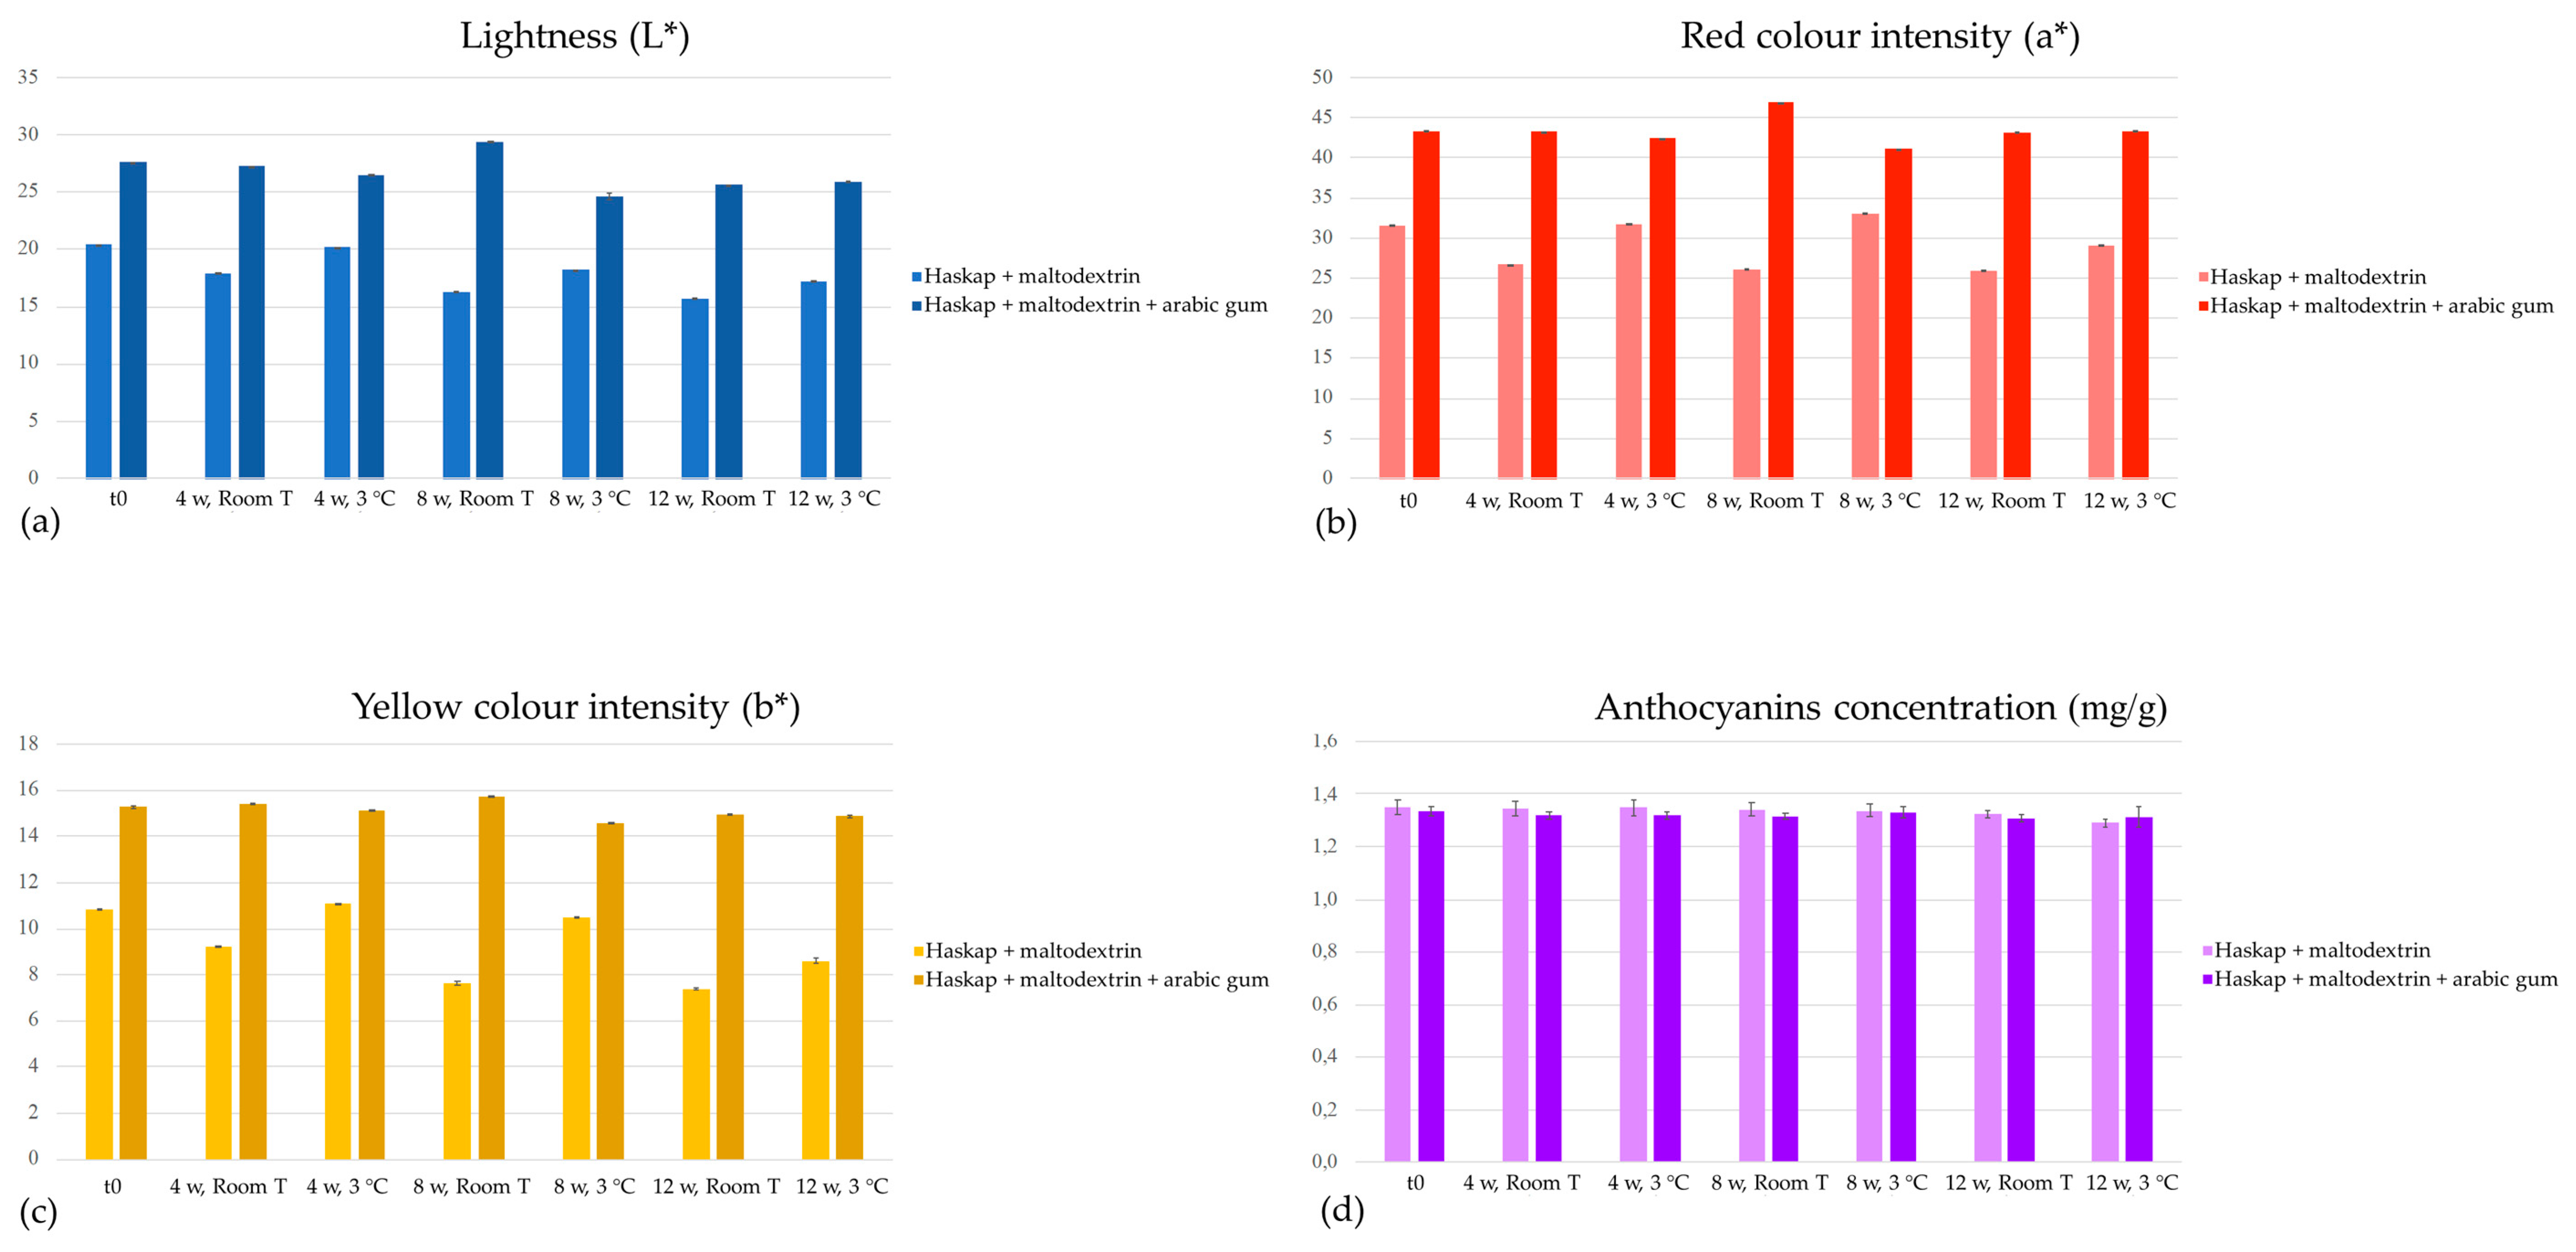
3.4. Anthocyanins Composition and Stability of the Colouring Formulations
4. Conclusions
Author Contributions
Funding
Acknowledgments
Conflicts of Interest
References
- Ochmian, I.; Skupień, K.; Grajkowski, J.; Smolik, M.; Ostrowska, K. Chemical composition and physical characteristics of fruits of two cultivars of blue honeysuckle (Lonicera caerulea L.) in relation to their degree of maturity and harvest date. Not. Bot. Horti Agrobot. Cluj Napoca 2012, 40, 155–162. [Google Scholar] [CrossRef]
- Svarcova, I.; Heinrich, J.; Valentova, K. Berry fruits as a source of biologically active compounds: The case of Lonicera caerulea. Biomed. Pap. Med. Fac. Palacky Univ. Olomouc 2007, 151, 163–174. [Google Scholar] [CrossRef]
- Celli, G.B.; Ghanem, A.; Brooks, M.S.L. Haskap berries (Lonicera caerulea L.)—A critical review of antioxidant capacity and health-related studies for potential value-added products. Food Bioprocess Technol. 2014, 7, 1541–1554. [Google Scholar] [CrossRef]
- Khattab, R.; Ghanem, A.; Brooks, M.S.-L. Stability of haskap berry (Lonicera caerulea L.) anthocyanins at different storage and processing conditions. J. Food Res. 2016, 5, 67–79. [Google Scholar] [CrossRef]
- Rupasinghe, H.P.V.; Arumuggam, N.; Amararathna, M.; De Silva, A.B.K.H. The potential health benefits of haskap (Lonicera caerulea L.): Role of cyanidin-3-O-glucoside. J. Funct. Foods 2018, 44, 24–39. [Google Scholar] [CrossRef]
- Caprioli, G.; Iannarelli, R.; Innocenti, M.; Bellumori, M.; Fiorini, D.; Sagratini, G.; Vittori, S.; Buccioni, M.; Santinelli, C.; Bramucci, M.; et al. Blue honeysuckle fruit (Lonicera caerulea L.) from eastern Russia: Phenolic composition, nutritional value and biological activities of its polar extracts. Food Funct. 2016, 7, 1892–1903. [Google Scholar] [CrossRef]
- Horwitz, W.; Latimer, G. (Eds.) AOAC Official Methods of Analysis of AOAC International; AOAC International: Gaithersburg, MD, USA, 2005; ISBN 9780935584752. [Google Scholar]
- Barros, L.; Pereira, E.; Calhelha, R.C.; Dueñas, M.; Carvalho, A.M.; Santos-Buelga, C.; Ferreira, I.C.F.R. Bioactivity and chemical characterization in hydrophilic and lipophilic compounds of Chenopodium ambrosioides L. J. Funct. Foods 2013, 5, 1732–1740. [Google Scholar] [CrossRef]
- Pereira, C.; Carvalho, A.M.; Barros, L.; Ferreira, I.C.F.R.F.R. Use of UFLC-PDA for the analysis of organic acids in thirty-five species of food and medicinal plants. Food Anal. Methods 2013, 6, 1337–1344. [Google Scholar] [CrossRef]
- Bessada, S.M.F.; Barreira, J.C.M.; Barros, L.; Ferreira, I.C.F.R.; Oliveira, M.B.P.P. Phenolic profile and antioxidant activity of Coleostephus myconis (L.) Rchb.f.: An underexploited and highly disseminated species. Ind. Crops Prod. 2016, 89, 45–51. [Google Scholar] [CrossRef]
- Gonçalves, G.A.; Soares, A.A.; Correa, R.C.G.; Barros, L.; Haminiuk, C.W.I.; Peralta, R.M.; Ferreira, I.C.F.R.; Bracht, A. Merlot grape pomace hydroalcoholic extract improves the oxidative and inflammatory states of rats with adjuvant-induced arthritis. J. Funct. Foods 2017, 33, 408–418. [Google Scholar] [CrossRef]
- Pereira, C.; Calhelha, R.C.; Barros, L.; Queiroz, M.J.R.P.; Ferreira, I.C.F.R. Synergisms in antioxidant and anti-hepatocellular carcinoma activities of artichoke, milk thistle and borututu syrups. Ind. Crops Prod. 2014, 52, 709–713. [Google Scholar] [CrossRef] [Green Version]
- Lockowandt, L.; Pinela, J.; Roriz, C.L.; Pereira, C.; Abreu, R.M.V.; Calhelha, R.C.; Alves, M.J.; Barros, L.; Bredol, M.; Ferreira, I.C.F.R. Chemical features and bioactivities of cornflower (Centaurea cyanus L.) capitula: The blue flowers and the unexplored non-edible part. Ind. Crops Prod. 2019, 128, 496–503. [Google Scholar] [CrossRef]
- Soković, M.; Glamočlija, J.; Marin, P.D.; Brkić, D.; Griensven, L.J.L.D. Van Antibacterial effects of the essential oils of commonly consumed medicinal herbs using an in vitro model. Molecules 2010, 15, 7532–7546. [Google Scholar] [CrossRef] [PubMed]
- Soković, M.; Van Griensven, L.J.L.D. Antimicrobial activity of essential oils and their components against the three major pathogens of the cultivated button mushroom, Agaricus bisporus. Eur. J. Plant Pathol. 2006, 116, 211–224. [Google Scholar] [CrossRef]
- Moser, P.; De Souza, R.T.; Nicoletti Telis, V.R. Spray drying of grape juice from hybrid CV. BRS Violeta: Microencapsulation of anthocyanins using protein/maltodextrin blends as drying aids. J. Food Process. Preserv. 2017, 41, e12852. [Google Scholar] [CrossRef]
- Pereira, E.; Antonio, A.L.; Barreira, J.C.M.; Barros, L.; Bento, A.; Ferreira, I.C.F.R. Gamma irradiation as a practical alternative to preserve the chemical and bioactive wholesomeness of widely used aromatic plants. Food Res. Int. 2015, 67, 338–348. [Google Scholar] [CrossRef] [Green Version]
- Corrêa, R.C.G.; de Souza, A.H.P.; Calhelha, R.C.; Barros, L.; Glamoclija, J.; Sokovic, M.; Peralta, R.M.; Bracht, A.; Ferreira, I.C.F.R. Bioactive formulations prepared from fruiting bodies and submerged culture mycelia of the Brazilian edible mushroom Pleurotus ostreatoroseus Singer. Food Funct. 2015, 6, 2155–2164. [Google Scholar] [CrossRef] [PubMed]
- Palíková, I.; Valentová, K.; Šimánek, V.; Ulrichová, J.; Heinrich, J.; Bednář, P.; Marhol, P.; Křen, V.; Cvak, L.; Růžička, F.; et al. Constituents and antimicrobial properties of blue honeysuckle: A novel source for phenolic antioxidants. J. Agric. Food Chem. 2008, 56, 11883–11889. [Google Scholar] [CrossRef]
- Rupasinghe, H.P.V.; Yu, L.J.; Bhullar, K.S.; Bors, B. Short Communication: Haskap (Lonicera caerulea): A new berry crop with high antioxidant capacity. Can. J. Plant Sci. 2012, 92, 1311–1317. [Google Scholar] [CrossRef]
- Wojdyło, A.; Jáuregui, P.N.N.; Carbonell-Barrachina, A.A.; Oszmiański, J.; Golis, T. Variability of phytochemical properties and content of bioactive compounds in Lonicera caerulea L. var. kamtschatica berries. J. Agric. Food Chem. 2013, 61, 12072–12084. [Google Scholar] [CrossRef]
- Yamamoto, Y.; Hoshino, Y.; Masago, H.; Kawano, T. Attempt for postharvest ripening of immature fruits of Haskap (Lonicera caerulea L. var. emphyllocalyx Nakai), an emerging fruit in Northern Japan. Adv. Hortic. Sci. 2014, 28, 244–249. [Google Scholar]
- Oszmiański, J.; Wojdyło, A.; Lachowicz, S. Effect of dried powder preparation process on polyphenolic content and antioxidant activity of blue honeysuckle berries (Lonicera caerulea L. var. kamtschatica). LWT Food Sci. Technol. 2016, 67, 214–222. [Google Scholar] [CrossRef]
- Miura, K.; Stamler, J.; Nakagawa, H.; Elliott, P.; Ueshima, H.; Chan, Q.; Brown, I.J.; Tzoulaki, I.; Saitoh, S.; Dyer, A.R.; et al. Relationship of dietary linoleic acid to blood pressure: The international study of macro-micronutrients and blood pressure study. Hypertension 2008, 52, 408–414. [Google Scholar] [CrossRef] [PubMed]
- Khattab, R.; Celli, G.B.; Ghanem, A.; Brooks, M.S.L. Effect of frozen storage on polyphenol content and antioxidant activity of haskap berries (Lonicera caerulea L.). J. Berry Res. 2015, 5, 231–242. [Google Scholar] [CrossRef]
- Skupien, K.; Oszmianski, J.; Ochmian, I.; Grajkowski, J. Characterization of selected physico-chemical features of blue honeysuckle fruit cultivar Zielona. Polish J. Nat. Sci. Suppl. 2007, 4, 101–107. [Google Scholar]
- Ochmian, I.; Grajkowski, J.; Skupień, K. Yield and chemical composition of blue honeysuckle fruit depending on ripening time. Bull. Univ. Agric. Sci. Vet. Med. Cluj Napoca Hortic. 2010, 67, 138–147. [Google Scholar]
- Bakowska-Barczak, A.M.; Marianchuk, M.; Kolodziejczyk, P. Survey of bioactive components in Western Canadian berries. Can. J. Physiol. Pharmacol. 2007, 85, 1139–1152. [Google Scholar] [CrossRef]
- Radovanović, B.C.; Andelković, A.S.M.; Radovanović, A.B.; Andelković, M.Z. Antioxidant and antimicrobial activity of polyphenol extracts from wild berry fruits grown in Southeast Serbia. Trop. J. Pharm. Res. 2013, 12, 813–819. [Google Scholar] [CrossRef]
- Raudsepp, P.; Anton, D.; Roasto, M.; Meremäe, K.; Pedastsaar, P.; Mäesaar, M.; Raal, A.; Laikoja, K.; Püssa, T. The antioxidative and antimicrobial properties of the blue honeysuckle (Lonicera caerulea L.), Siberian rhubarb (Rheum rhaponticum L.) and some other plants, compared to ascorbic acid and sodium nitrite. Food Control 2013, 31, 129–135. [Google Scholar] [CrossRef]


| Nutritional value | |
| Moisture (g/100 g fw) | 82.9 ± 0.1 |
| Fat (g/100 g fw) | 0.38 ± 0.02 |
| Protein (g/100 g fw) | 0.87 ± 0.04 |
| Ash (g/100 g fw) | 0.00127 ± 0.00008 |
| Carbohydrates (g/100 g fw) | 15.87 ± 0.06 |
| Energy (kcal/100 g fw) | 70.37 ± 0.09 |
| Free sugars | |
| Fructose (g/100 g fw) | 4.021 ± 0.006 |
| Glucose (g/100 g fw) | 3.86 ± 0.05 |
| Sucrose (g/100 g fw) | 0.027 ± 0.002 |
| Unknown (g/100 g fw) | 0.181 ± 0.007 |
| Total (g/100 g fw) | 7.91 ± 0.06 |
| Organic acids | |
| Oxalic acid (g/100 g fw) | 0.041 ± 0.002 |
| Quinic acid (g/100 g fw) | 0.37 ± 0.01 |
| Malic acid (g/100 g fw) | 0.77 ± 0.01 |
| Ascorbic acid (g/100 g fw) | 0.0248 ± 0.0003 |
| Citric acid (g/100 g fw) | 2.76 ± 0.01 |
| Total (g/100 g fw) | 3.93 ± 0.01 |
| Tocopherols | |
| α-Tocopherol (mg/100 g fw) | 0.77 ± 0.03 |
| γ-Tocopherol (mg/100 g fw) | 0.162 ± 0.003 |
| Total (mg/100 g fw) | 0.93 ± 0.03 |
| Fatty Acid | Relative % |
|---|---|
| Caproic acid (C6:0) | 0.078 ± 0.001 |
| Caprolic acid (C8:0) | 0.067 ± 0.001 |
| Capric acid (C10:0) | 0.012 ± 0.001 |
| Lauric acid (C12:0) | 0.366 ± 0.003 |
| Myristic acid (C14:0) | 0.304 ± 0.008 |
| Myristoleic acid (C14:1) | 0.067 ± 0.001 |
| Pentadecylic acid (C15:0) | 0.092 ± 0.002 |
| Palmitic acid (C16:0) | 5.39 ± 0.01 |
| Palmitoleic acid (C16:1) | 0.098 ± 0.001 |
| Margaric acid (C17:0) | 0.082 ± 0.001 |
| Stearic acid (C18:0) | 0.986 ± 0.001 |
| Oleic acid (C18:1n9) | 14.153 ± 0.006 |
| Linoleic acid (C18:2n6) | 71.79 ± 0.08 |
| γ-Linoleic acid (C18:3n6) | 1.4 ± 0.1 |
| Linolenic acid (C18:3n3) | 4.24 ± 0.01 |
| Arachidic acid (C20:0) | 0.158 ± 0.001 |
| Eicosenoic acid (C20:1) | 0.086 ± 0.001 |
| Eicosadienoic acid (C20:2) | 0.227 ± 0.002 |
| Behenic acid (C22:0) | 0.306 ± 0.001 |
| Lignoceric acid (C24:0) | 0.069 ± 0.004 |
| SFA | 7.91 ± 0.02 |
| MUFA | 14.403 ± 0.006 |
| PUFA | 77.69 ± 0.03 |
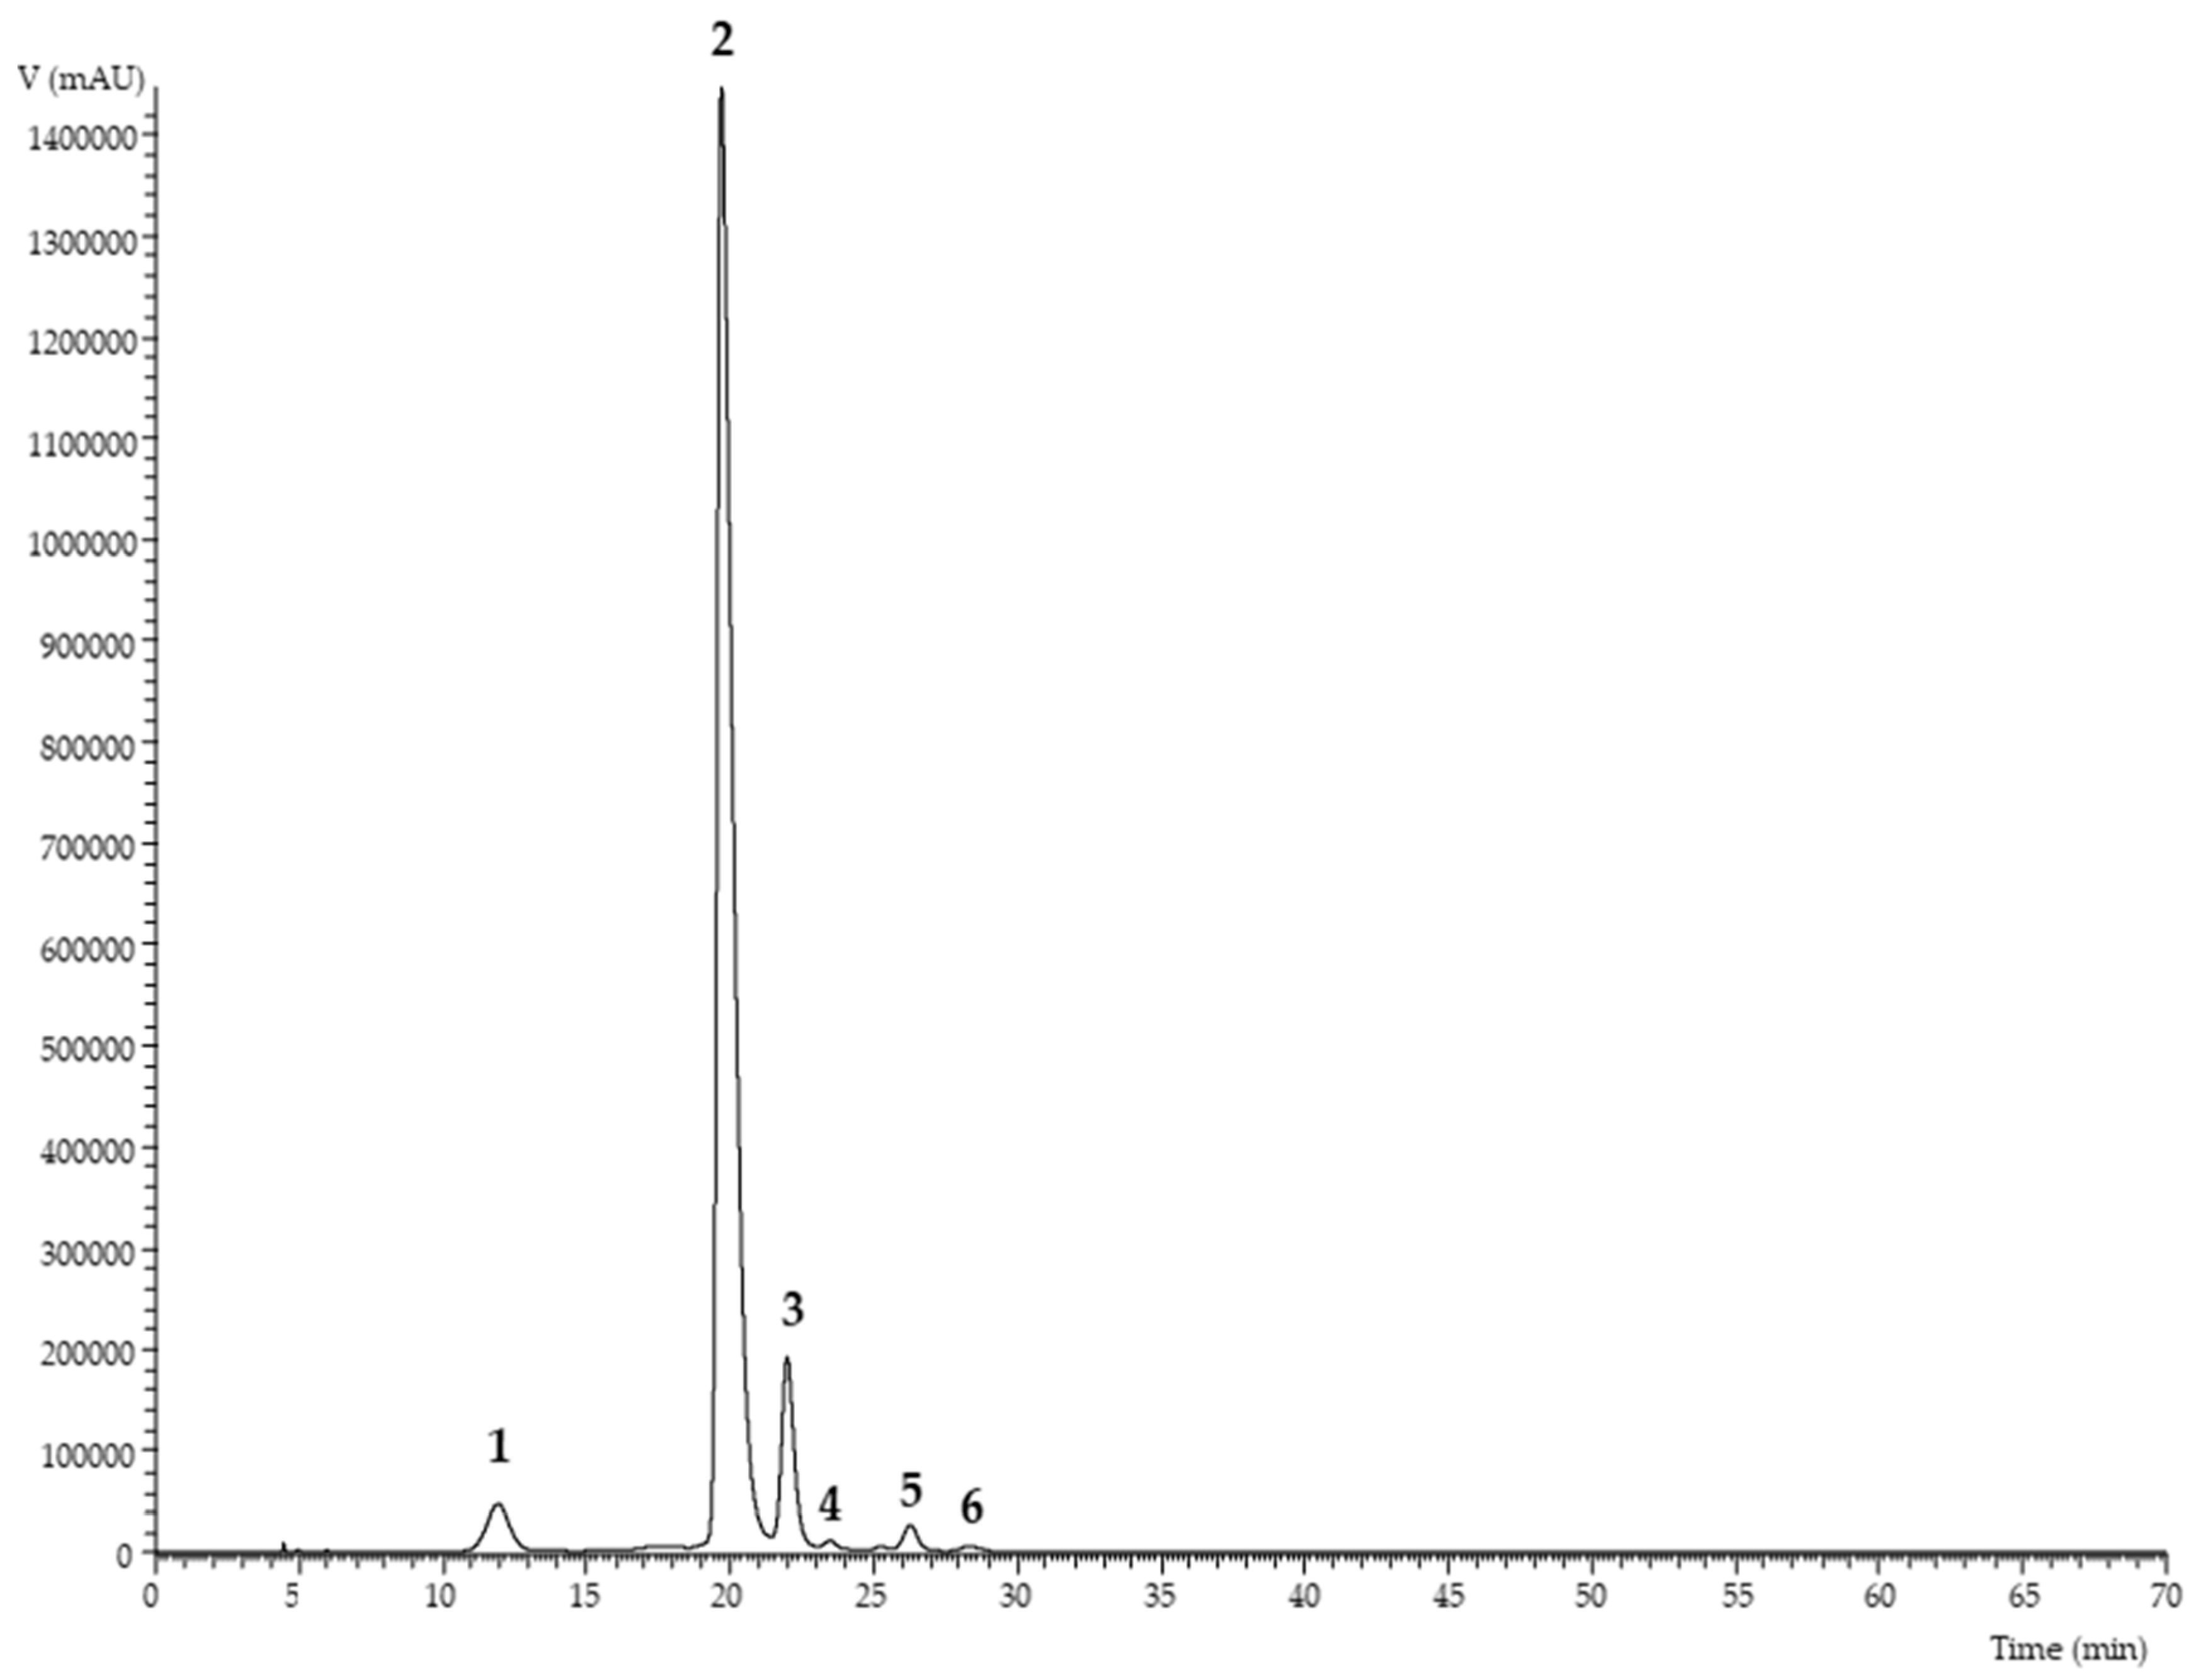
| Peak | Rt (min) | λmax (nm) | [M-H]−/[M]+ m/z | MS2 | Tentative Identification | Concentration (mg/g ext) |
|---|---|---|---|---|---|---|
| Non-anthocyanic compounds | ||||||
| 1’ | 7.2 | 326 | 353/ - | 191(100),179(6),161(5),135(5) | 5-O-Caffeoylquinic acid 1 | 0.589 ± 0.002 |
| Anthocyanins | ||||||
| 1 | 11.94 | 512 | - /611 | 449(100), 287(28) | Cyanidin-O-hexoside-O-hexoside 2 | 6.75 ± 0.01 |
| 2 | 19.72 | 515 | - /449 | 287(100) | Cyanidin-3-O-glucoside 2 | 61.7 ± 0.1 |
| 3 | 22.00 | 517 | - /595 | 449(31), 287(100) | Cyanidin-O-rhamnoside-O-hexoside 2 | 10.1 ± 0.2 |
| 4 | 23.49 | 508 | - /433 | 271(100) | Pelargonidin-3-O-glucoside 3 | 10.30 ± 0.04 |
| 5 | 26.29 | 515 | - /463 | 301(100) | Peonidin-3-O-glucoside 4 | 4.872 ± 0.002 |
| 6 | 28.33 | 520 | - /609 | 463(32), 301(100) | Peonidin-O-rhamnoside-O-hexoside 4 | 4.142 ± 0.002 |
| Total | 97.9 ± 0.2 | |||||
| Antioxidant Activity (IC50 values, µg/mL) | ||||||
| Haskap extract | Haskap + M | Haskap + M + AG | Trolox 1 | |||
| TBARS assay | 29.9 ± 0.3 a | 1773 ± 106 d | 1033 ± 85 c | 139 ± 5 b | ||
| OxHLIA assay | 60 min | 145 ± 5 b | 298 ± 13 c | 394 ± 13 d | 85 ± 2 a | |
| 120 min | 938 ± 49 c | 737 ± 16 b | 976 ± 9 c | 183 ± 4 a | ||
| Antibacterial Activity (MIC and MBC values, mg/mL) | ||||||
| Haskap extract | Haskap + M | Haskap + M + AG | Streptomycin 1 | Ampicillin 1 | ||
| Bacillus cereus | MIC/MBC | 6.81/6.81 | 5.03/10.06 | 5.07/10.14 | 0.10/0.20 | 0.25/0.40 |
| Staphylococcus aureus | MIC/MBC | 6.81/6.81 | 5.03/10.06 | 10.14/20.28 | 0.17/0.25 | 0.34/0.37 |
| Listeria monocytogenes | MIC/MBC | 3.41/3.41 | 5.03/10.06 | 7.605/10.14 | 0.20/0.30 | 0.40/0.50 |
| Escherichia coli | MIC/MBC | 3.41/3.41 | 2.515/5.03 | 1.26/2.535 | 0.20/0.30 | 0.40/0.50 |
| Enterobacter cloacae | MIC/MBC | 3.41/3.41 | 7.54/10.06 | 7.60/10.14 | 0.043/0.25 | 0.086/0.37 |
| Salmonella typhimurium | MIC/MBC | 3.41/3.41 | 7.54/10.06 | 7.60/10.14 | 0.20/0.30 | 0.75/1.20 |
| Antifungal Activity (MIC and MFC values, mg/mL) | ||||||
| Haskap extract | Haskap + M | Haskap + M + AG | Ketoconazole 1 | Bifonazole 1 | ||
| Aspergillus fumigatus | MIC/MFC | 13.63/27.27 | 5.03/10.06 | 20.28/>20.28 | 0.38/0.95 | 0.48/0.64 |
| Aspergillus versicolor | MIC/MFC | 6.81/13.63 | 5.03/10.06 | 20.28/>20.28 | 0.20/0.50 | 0.10/0.20 |
| Aspergillus niger | MIC/MFC | 27.27/27.27 | 20.12/>20.12 | 20.28/>20.28 | 0.20/0.50 | 0.15/0.20 |
| Penicillium funiculosum | MIC/MFC | 13.63/27.27 | 5.03/10.06 | >20.28/>20.28 | 0.20/0.50 | 0.20/0.25 |
| Penicillium ochrochloron | MIC/MFC | 27.27/>27.27 | 2.52/5.03 | 20.28/>20.28 | 3.8/0.48 | 3.8/0.64 |
| Trichoderma viride | MIC/MFC | 2.13/13.63 | 1.26/2.52 | 2.54/5.07 | 4.75/0.64 | 5.70/0.80 |
© 2019 by the authors. Licensee MDPI, Basel, Switzerland. This article is an open access article distributed under the terms and conditions of the Creative Commons Attribution (CC BY) license (http://creativecommons.org/licenses/by/4.0/).
Share and Cite
Molina, A.K.; Vega, E.N.; Pereira, C.; Dias, M.I.; Heleno, S.A.; Rodrigues, P.; Fernandes, I.P.; Barreiro, M.F.; Kostić, M.; Soković, M.; et al. Promising Antioxidant and Antimicrobial Food Colourants from Lonicera caerulea L. var. Kamtschatica. Antioxidants 2019, 8, 394. https://0-doi-org.brum.beds.ac.uk/10.3390/antiox8090394
Molina AK, Vega EN, Pereira C, Dias MI, Heleno SA, Rodrigues P, Fernandes IP, Barreiro MF, Kostić M, Soković M, et al. Promising Antioxidant and Antimicrobial Food Colourants from Lonicera caerulea L. var. Kamtschatica. Antioxidants. 2019; 8(9):394. https://0-doi-org.brum.beds.ac.uk/10.3390/antiox8090394
Chicago/Turabian StyleMolina, Adriana K., Erika N. Vega, Carla Pereira, Maria Inês Dias, Sandrina A. Heleno, Paula Rodrigues, Isabel P. Fernandes, Maria Filomena Barreiro, Marina Kostić, Marina Soković, and et al. 2019. "Promising Antioxidant and Antimicrobial Food Colourants from Lonicera caerulea L. var. Kamtschatica" Antioxidants 8, no. 9: 394. https://0-doi-org.brum.beds.ac.uk/10.3390/antiox8090394