
A Data-Driven Approach to Construct a Molecular Map of Trypanosoma cruzi to Identify Drugs and Vaccine Targets

 , , , , and
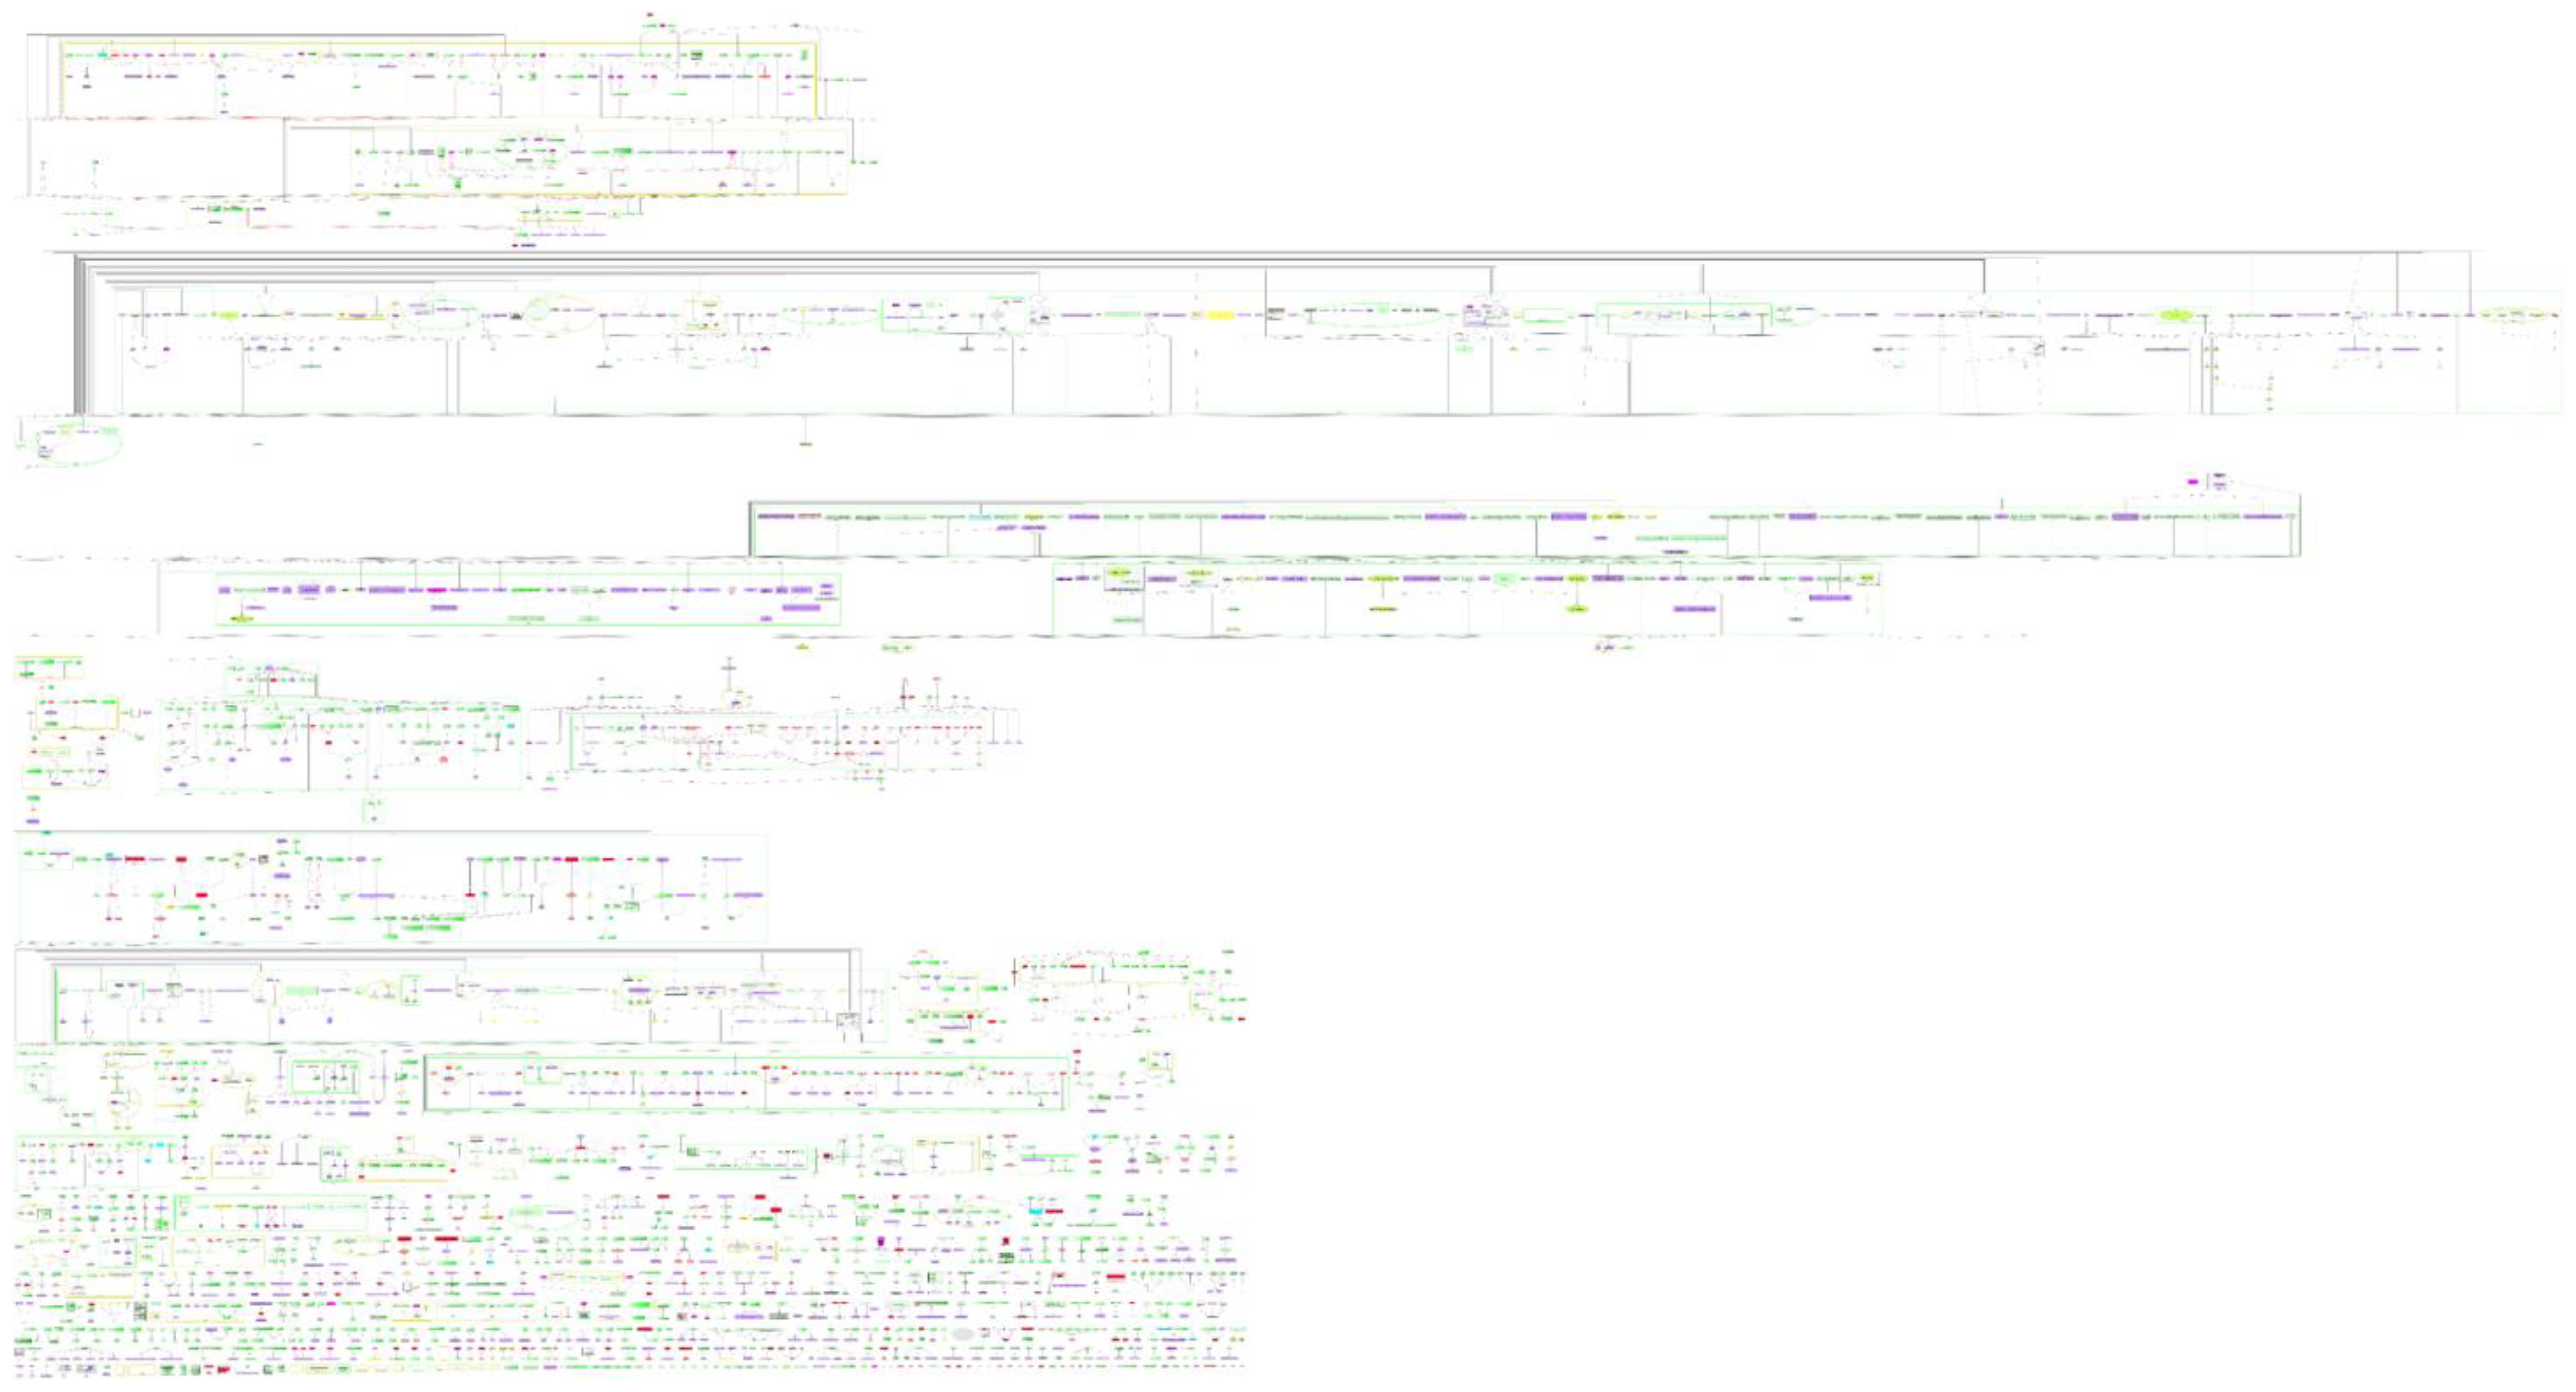
Abstract
:1. Background
2. Methods
2.1. Extraction of the Literature Information Related to the T. cruzi Pathways
2.2. Retrieval of the T. cruzi Molecules and Their Function
2.3. Retrieval of the T. cruzi Drugs
2.3.1. Networks Analysis
2.3.2. Gene Ontology (GO) Analysis
2.3.3. Homology Modelling of the T. cruzi Proteins
2.3.4. Molecular Docking
3. Results
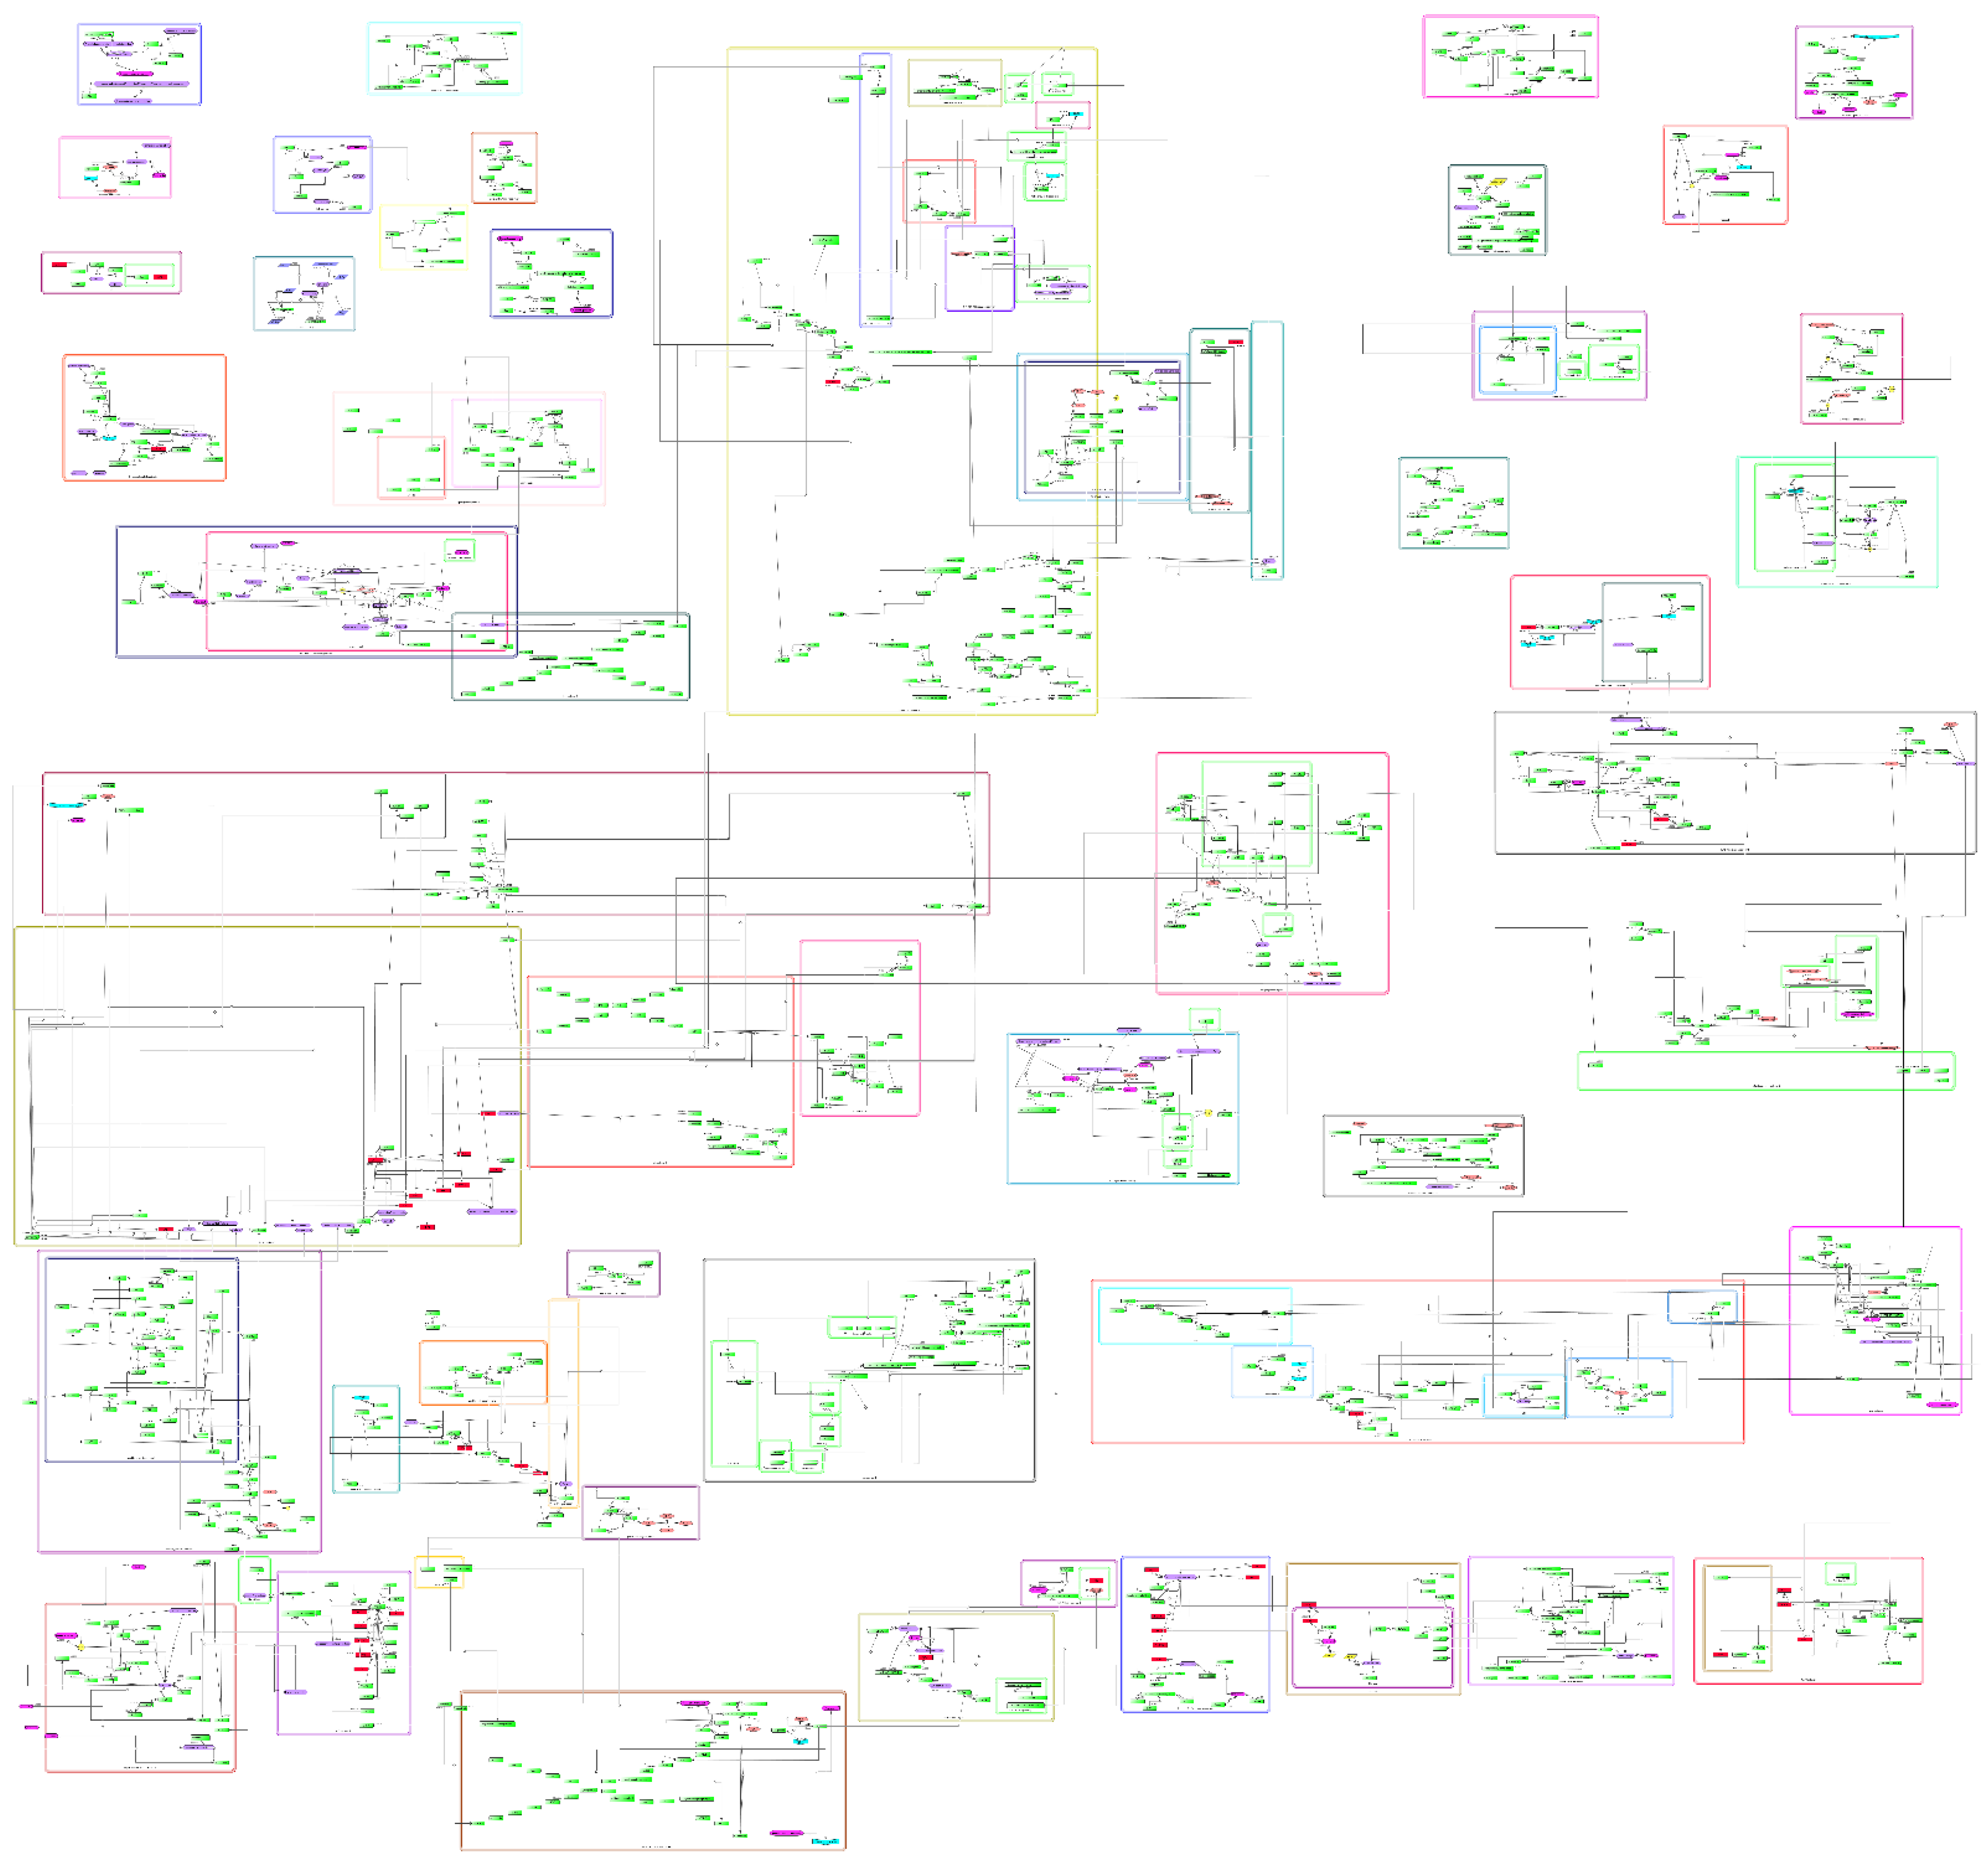
3.1. General Features of the Comprehensive Molecular Map of T. cruzi
3.2. Features of the Comprehensive Map
3.3. Pathways of T. cruzi
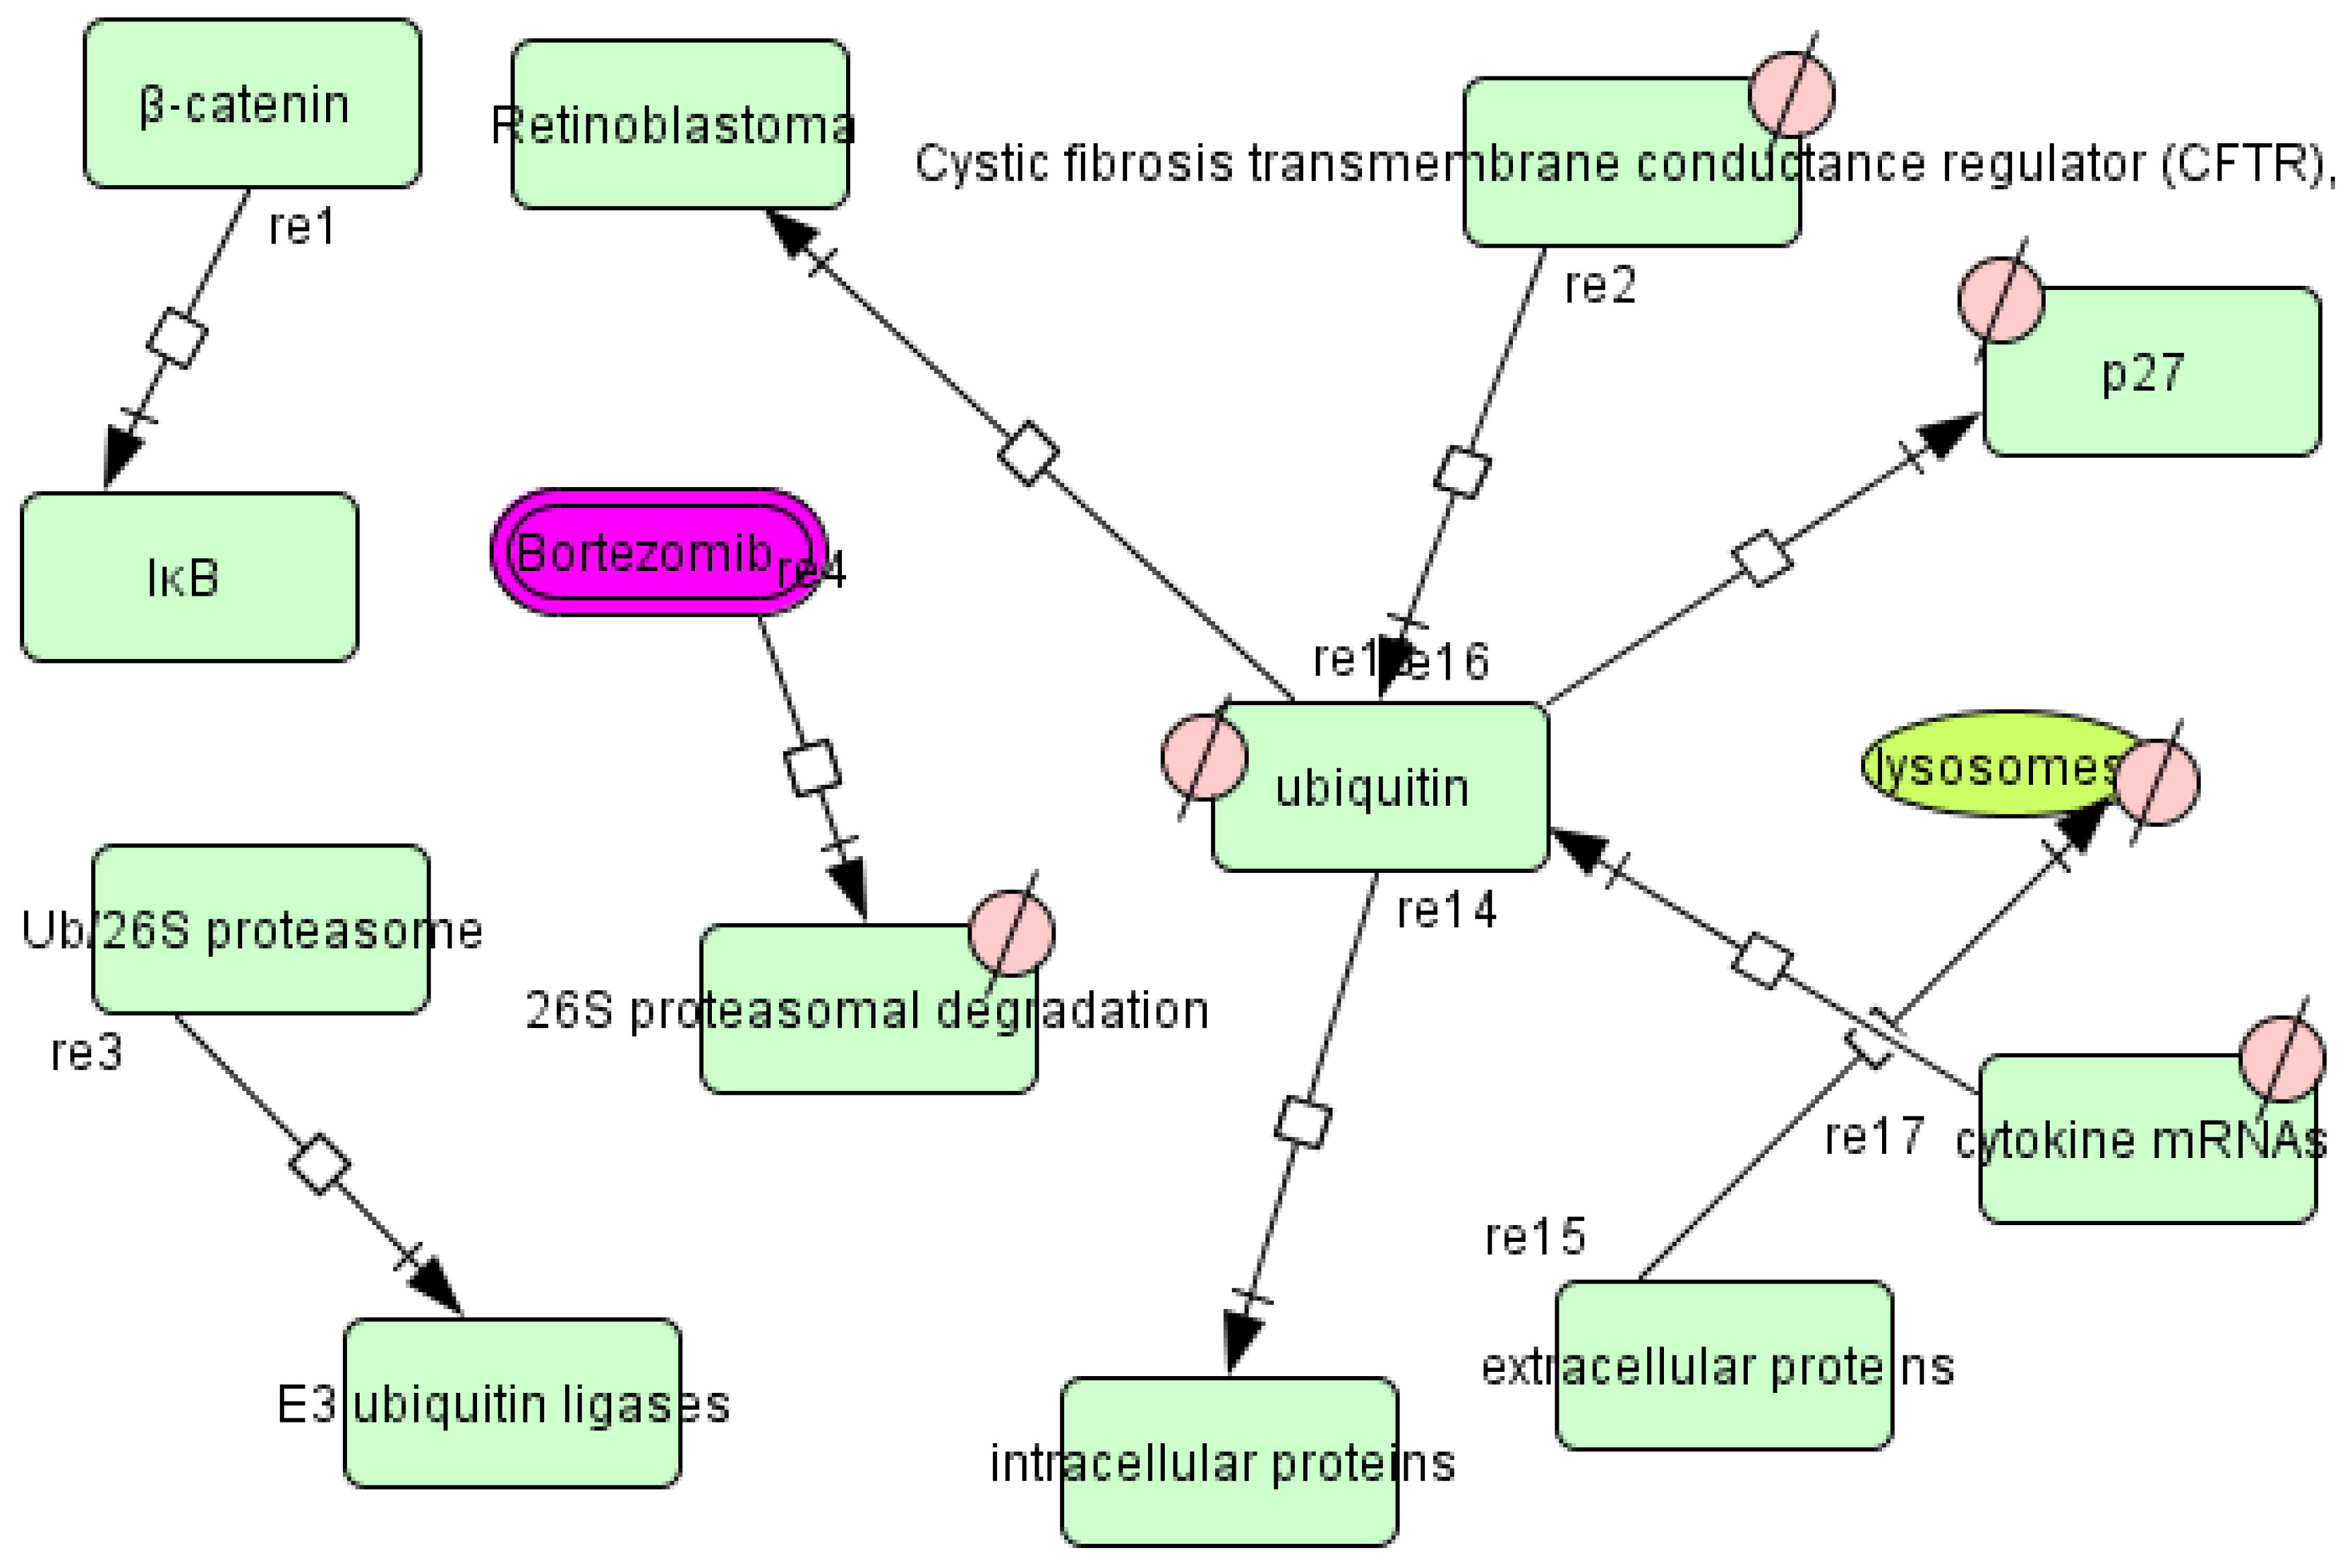
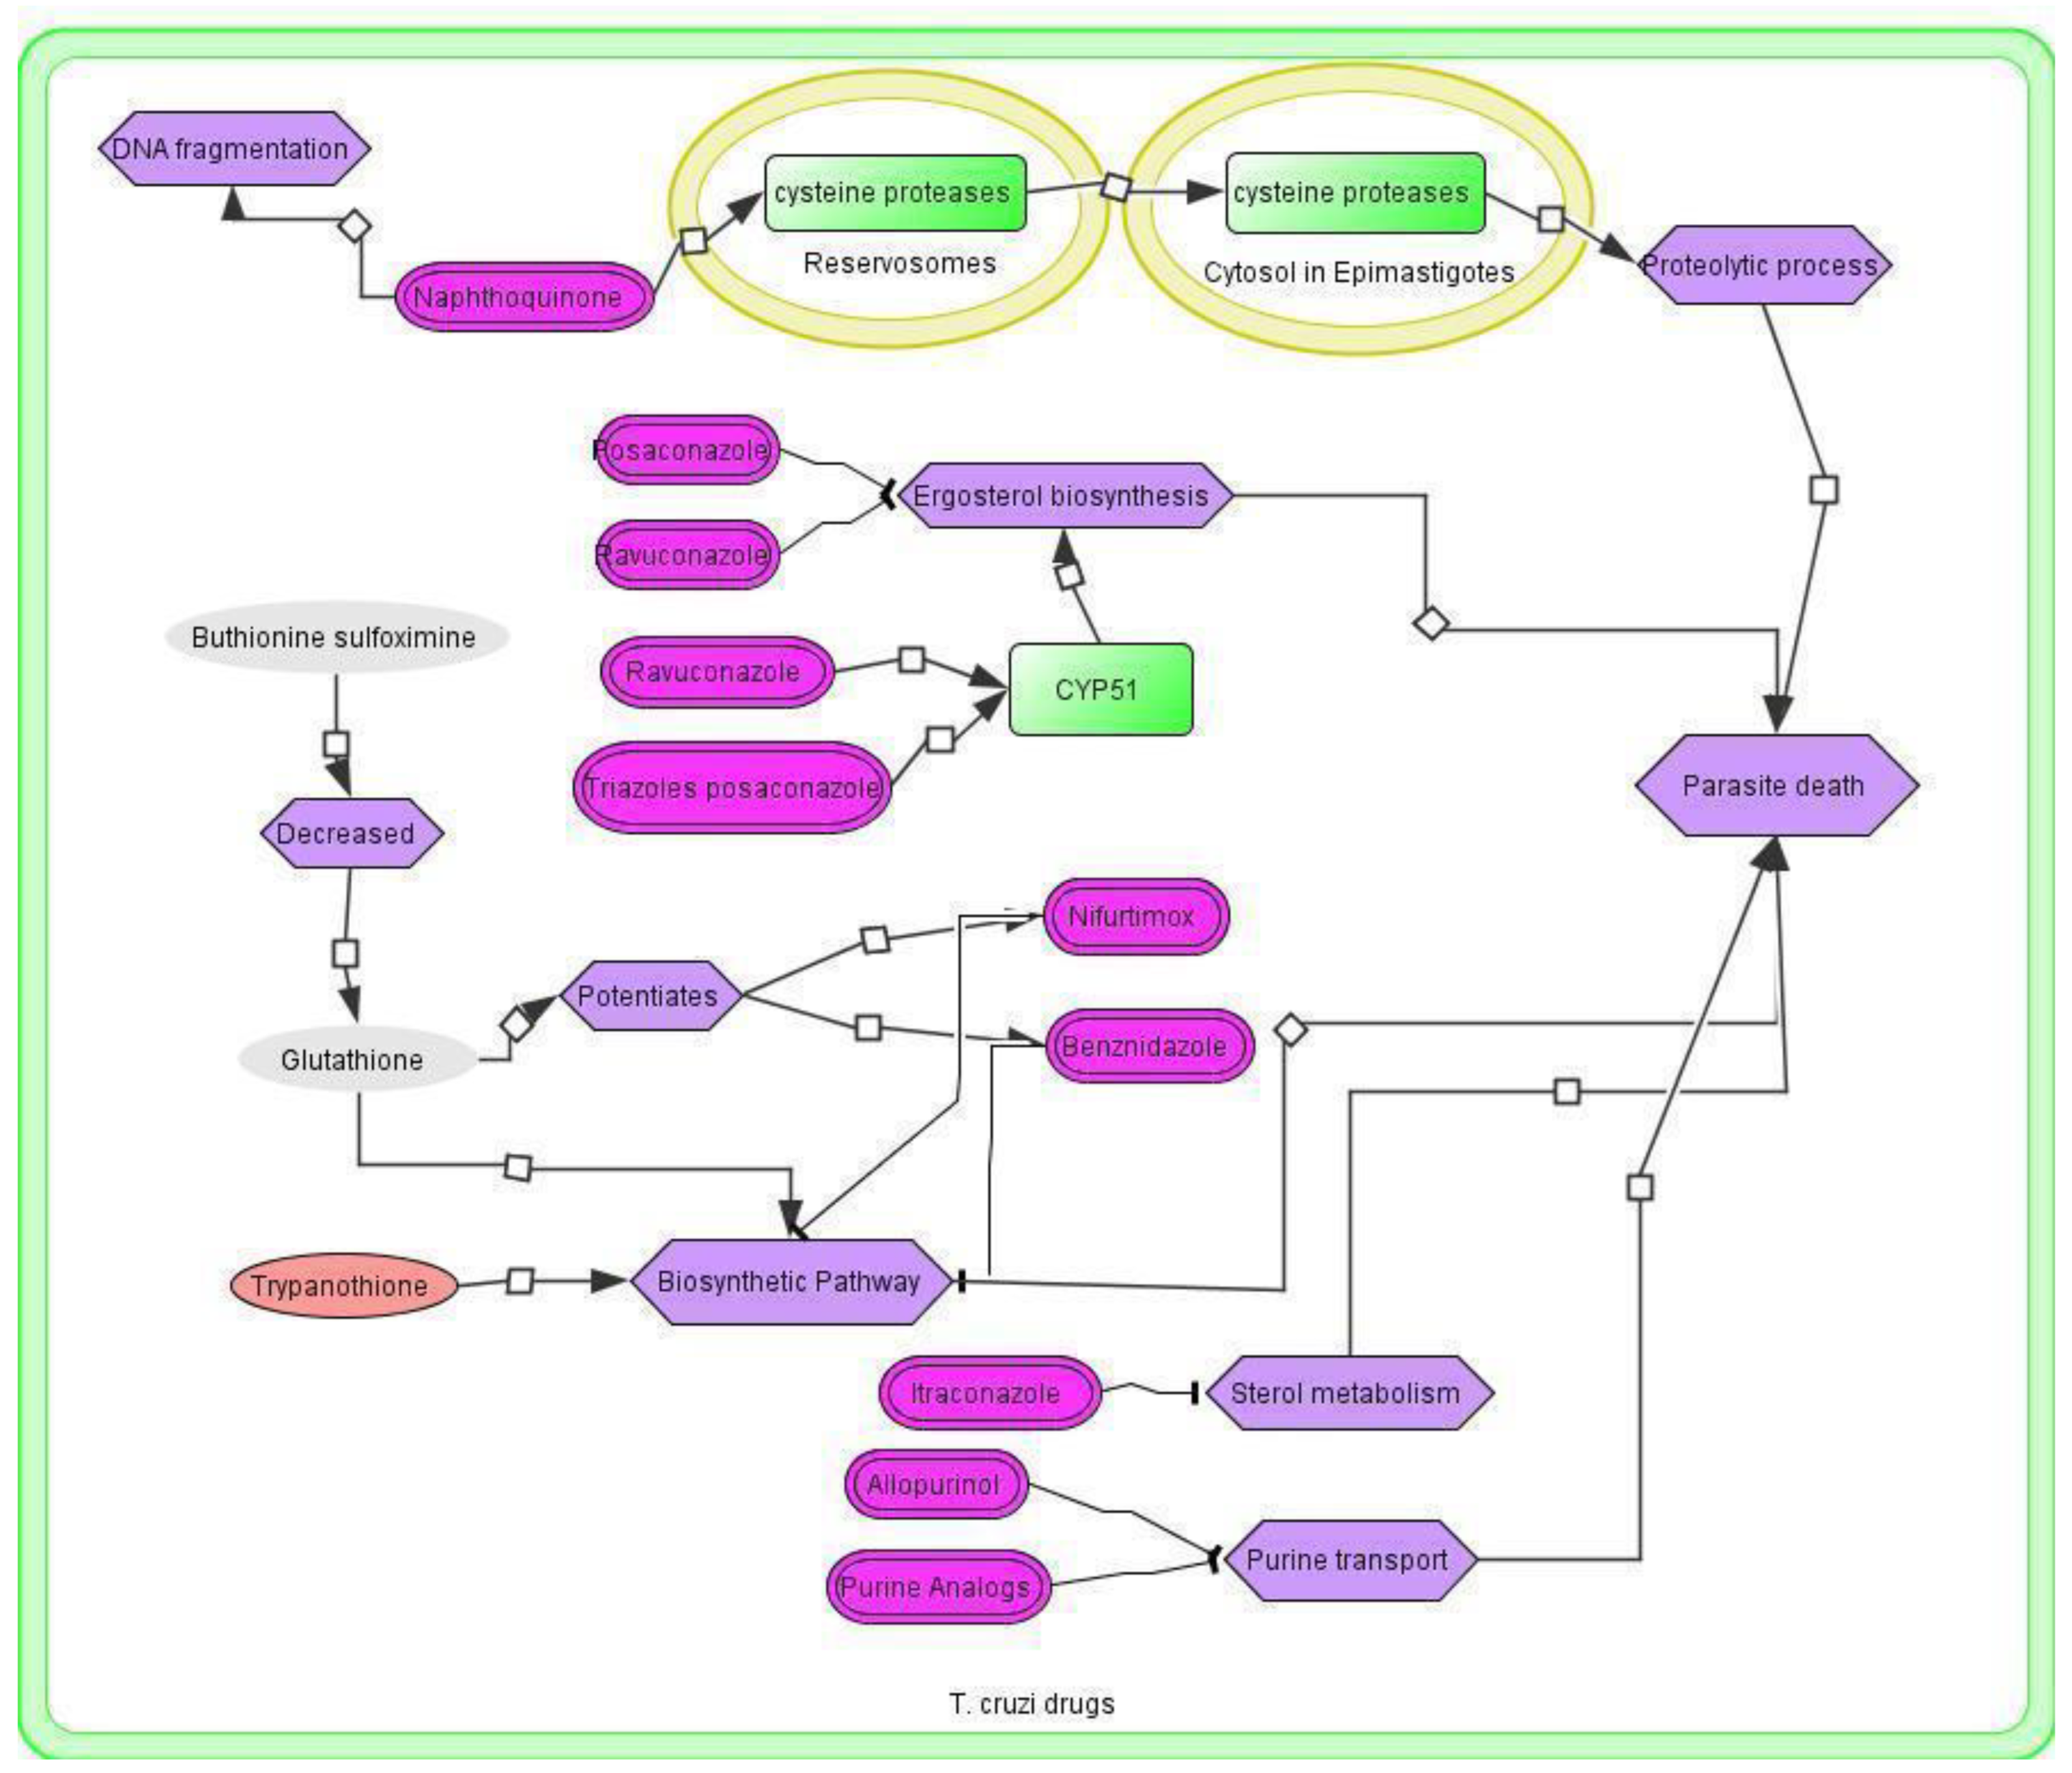
3.4. T. cruzi Drugs and Network
3.5. Application of the T. cruzi Drug Network
3.6. Therapeutic Implications of the T. cruzi Network
3.7. Quantitative Analysis of the Networks
3.8. Gene Ontology Analysis of the T. cruzi Genes
4. Discussion
5. Conclusions
Supplementary Materials
Author Contributions
Funding
Institutional Review Board Statement
Informed Consent Statement
Data Availability Statement
Acknowledgments
Conflicts of Interest
References
- De Pablos, L.M.; Osuna, A. Multigene families in Trypanosoma cruzi and their role in infectivity. Infect. Immun. 2012, 80, 2258–2264. [Google Scholar] [CrossRef] [PubMed] [Green Version]
- El-Sayed, N.M.; Myler, P.J.; Bartholomeu, D.C.; Nilsson, D.; Aggarwal, G.; Tran, A.-N.; Ghedin, E.; Worthey, E.A.; Delcher, A.L.; Blandin, G.; et al. The genome sequence of Trypanosoma cruzi, etiologic agent of Chagas disease. Science 2005, 309, 409–415. [Google Scholar] [CrossRef] [Green Version]
- Weston, D.; Patel, B.; Van Voorhis, W.C. Virulence in Trypanosoma cruzi infection correlates with the expression of a distinct family of sialidase superfamily genes. Mol. Biochem. Parasitol. 1999, 98, 105–116. [Google Scholar] [CrossRef] [PubMed]
- Nde, P.N.; Johnson, C.A.; Pratap, S.; Cardenas, T.C.; Kleshchenko, Y.Y.; Furtak, V.A.; Simmons, K.J.; Lima, M.F.; Villalta, F. Gene Network Analysis during Early Infection of Human Coronary Artery Smooth Muscle Cells by Trypanosoma cruzi and Its gp83 Ligand. Chem. Biodivers. 2010, 7, 1051–1064. [Google Scholar] [CrossRef] [Green Version]
- Roberts, S.B.; Robichaux, J.L.; Chavali, A.K.; Manque, P.A.; Lee, V.; Lara, A.M.; Papin, J.A.; Buck, G.A. Proteomic and network analysis characterize stage-specific metabolism in Trypanosoma cruzi. BMC Syst. Biol. 2009, 3, 52. [Google Scholar] [CrossRef] [Green Version]
- Shiratsubaki, I.S.; Fang, X.; Souza, R.O.O.; Palsson, B.O.; Silber, A.M.; Siqueira-Neto, J.L. Genome-scale metabolic models highlight stage-specific differences in essential metabolic pathways in Trypanosoma cruzi. PLoS Negl. Trop. Dis. 2020, 14, e0008728. [Google Scholar] [CrossRef]
- Goh, K.-I.; Cusick, M.E.; Valle, D.; Childs, B.; Vidal, M.; Barabási, A.-L. The human disease network. Proc. Natl. Acad. Sci. USA 2007, 104, 8685–8690. [Google Scholar] [CrossRef] [Green Version]
- Janjić, V.; Pržulj, N. The Core Diseasome. Mol. Biosyst. 2012, 8, 2614–2625. [Google Scholar] [CrossRef]
- Lusis, A.J.; Weiss, J.N. Cardiovascular networks: Systems-based approaches to cardiovascular disease. Circulation 2010, 121, 157–170. [Google Scholar] [CrossRef] [PubMed] [Green Version]
- Jagannadham, J.; Jaiswal, H.K.; Agrawal, S.; Rawal, K. Comprehensive Map of Molecules Implicated in Obesity. PLoS ONE 2016, 11, e0146759. [Google Scholar] [CrossRef]
- Ferraz, M.L.; Gazzinelli, R.T.; Alves, R.O.; Urbina, J.A.; Romanha, A.J. The Anti-Trypanosoma cruzi Activity of Posaconazole in a Murine Model of Acute Chagas’ Disease Is Less Dependent on Gamma Interferon than That of Benznidazole. Antimicrob. Agents Chemother. 2007, 51, 1359–1364. [Google Scholar] [CrossRef] [PubMed] [Green Version]
- Assíria Fontes Martins, T.; de Figueiredo Diniz, L.; Mazzeti, A.L.; da Silva do Nascimento, Á.F.; Caldas, S.; Caldas, I.S.; de Andrade, I.M.; Ribeiro, I.; Bahia, M.T. Benznidazole/Itraconazole Combination Treatment Enhances Anti-Trypanosoma cruzi Activity in Experimental Chagas Disease. PLoS ONE 2015, 10, e0128707. [Google Scholar] [CrossRef] [PubMed] [Green Version]
- Molina, I.; Perin, L.; Aviles, A.S.; de Abreu Vieira, P.M.; da Silva Fonseca, K.; Cunha, L.M.; Carneiro, C.M. The effect of benznidazole dose among the efficacy outcome in the murine animal model. A quantitative integration of the literature. Acta Trop. 2020, 201, 105218. [Google Scholar] [CrossRef] [PubMed]
- Brodsky, I.E.; Medzhitov, R. Targeting of immune signalling networks by bacterial pathogens. Nat. Cell Biol. 2009, 11, 521–526. [Google Scholar] [CrossRef] [PubMed]
- Chanumolu, S.K.; Rout, C.; Chauhan, R.S. UniDrug-Target: A Computational Tool to Identify Unique Drug Targets in Pathogenic Bacteria. PLoS ONE 2012, 7, e32833. [Google Scholar] [CrossRef] [PubMed]
- Luo, M.; Jiao, J.; Wang, R. Screening drug target combinations in disease-related molecular networks. BMC Bioinform. 2019, 20, 198. [Google Scholar] [CrossRef] [PubMed]
- Dai, Y.-F.; Zhao, X.-M. A Survey on the Computational Approaches to Identify Drug Targets in the Postgenomic Era. BioMed Res. Int. 2015, 2015, 1–9. [Google Scholar] [CrossRef] [Green Version]
- Rawal, K.; Sinha, R.; Abbasi, B.A.; Chaudhary, A.; Nath, S.K.; Kumari, P.; Preeti, P.; Saraf, D.; Singh, S.; Mishra, K.; et al. Identification of vaccine targets in pathogens and design of a vaccine using computational approaches. Sci. Rep. 2021, 11, 17626. [Google Scholar] [CrossRef]
- Rawal, K.; Sinha, R.; Nath, S.K.; Preeti, P.; Kumari, P.; Gupta, S.; Sharma, T.; Strych, U.; Hotez, P.; Bottazzi, M.E. Vaxi-DL: A web-based deep learning server to identify potential vaccine candidates. Comput. Biol. Med. 2022, 145, 105401. [Google Scholar] [CrossRef]
- Abbasi, B.A.; Saraf, D.; Sharma, T.; Sinha, R.; Singh, S.; Sood, S.; Gupta, P.; Gupta, A.; Mishra, K.; Kumari, P.; et al. Identification of vaccine targets & design of vaccine against SARS-CoV-2 coronavirus using computational and deep learning-based approaches. PeerJ 2022, 10, e13380. [Google Scholar] [CrossRef]
- Qin, G.; Zhao, X.-M. A survey on computational approaches to identifying disease biomarkers based on molecular networks. J. Theor. Biol. 2014, 362, 9–16. [Google Scholar] [CrossRef] [PubMed]
- Agwa, S.H.A.; Elghazaly, H.; Meteini, M.S.E.; Shawky, S.M.; Ali, M.; Abd Elsamee, A.M.; Sayed, S.M.; Sherif, N.; Sharaf, H.M.; Alhadidy, M.A.; et al. In Silico Identification and Clinical Validation of a Novel Long Non-Coding RNA/mRNA/miRNA Molecular Network for Potential Biomarkers for Discriminating SARS CoV-2 Infection Severity. Cells 2021, 10, 3098. [Google Scholar] [CrossRef]
- Gao, Y.; Xu, T.; Zhao, Y.-X.; Ling-Hu, T.; Liu, S.-B.; Tian, J.-S.; Qin, X.-M. A Novel Network Pharmacology Strategy to Decode Metabolic Biomarkers and Targets Interactions for Depression. Front. Psychiatry 2020, 11, 667. [Google Scholar] [CrossRef] [PubMed]
- CellDesigner. Available online: https://www.celldesigner.org/ (accessed on 18 February 2022).
- Funahashi, A.; Morohashi, M.; Kitano, H.; Tanimura, N. CellDesigner: A process diagram editor for gene-regulatory and biochemical networks. Biosilico 2003, 5, 159–162. [Google Scholar] [CrossRef]
- Funahashi, A.; Matsuoka, Y.; Jouraku, A.; Morohashi, M.; Kikuchi, N.; Kitano, H. CellDesigner 3.5: A versatile modeling tool for biochemical networks. Proc. IEEE 2008, 96, 1254–1265. [Google Scholar] [CrossRef]
- Trypanosoma cruzi CL Brener-Gene-NCBI. Available online: https://0-www-ncbi-nlm-nih-gov.brum.beds.ac.uk/gene/?term=Trypanosoma+cruzi+CL+brener (accessed on 6 January 2022).
- Trypanosoma cruzi cl Brener in UniProtKB Search (19656)|UniProt. Available online: https://www.uniprot.org/uniprotkb/?query=trypanosoma+cruzi+cl+brener&sort=score (accessed on 10 January 2022).
- Shannon, P.; Markiel, A.; Ozier, O.; Baliga, N.S.; Wang, J.T.; Ramage, D.; Amin, N.; Schwikowski, B.; Ideker, T. Cytoscape: A software environment for integrated models of biomolecular interaction networks. Genome Res. 2003, 13, 2498–2504. [Google Scholar] [CrossRef]
- Harris, M.A.; Clark, J.; Ireland, A.; Lomax, J.; Ashburner, M.; Foulger, R.; Eilbeck, K.; Lewis, S.; Marshall, B.; Mungall, C.; et al. The Gene Ontology (GO) database and informatics resource. Nucleic Acids Res. 2004, 32, D258–D261. [Google Scholar] [CrossRef] [Green Version]
- Kanehisa, M.; Goto, S. KEGG: Kyoto encyclopedia of genes and genomes. Nucleic Acids Res. 2000, 28, 27–30. [Google Scholar] [CrossRef]
- Karp, P.D.; Riley, M.; Paley, S.M.; Pellegrini-Toole, A. The MetaCyc Database. Nucleic Acids Res. 2002, 30, 59–61. [Google Scholar] [CrossRef] [Green Version]
- Aslett, M.; Aurrecoechea, C.; Berriman, M.; Brestelli, J.; Brunk, B.P.; Carrington, M.; Depledge, D.P.; Fischer, S.; Gajria, B.; Gao, X.; et al. TriTrypDB: A functional genomic resource for the Trypanosomatidae. Nucleic Acids Res. 2010, 38, D457–D462. [Google Scholar] [CrossRef]
- TriTrypDB. Available online: https://tritrypdb.org/tritrypdb/app (accessed on 13 April 2022).
- Supek, F.; Bošnjak, M.; Škunca, N.; Šmuc, T. REVIGO summarizes and visualizes long lists of gene ontology terms. PLoS ONE 2011, 6, e21800. [Google Scholar] [CrossRef] [PubMed] [Green Version]
- Webb, B.; Sali, A. Comparative Protein Structure Modeling Using MODELLER. Curr. Protoc. Bioinform. 2016, 54, 5–6. [Google Scholar] [CrossRef] [PubMed] [Green Version]
- Pearson, W.R. An Introduction to Sequence Similarity (“Homology”) Searching. Curr. Protoc. Bioinform. 2013, 42, 3.1.1–3.1.8. [Google Scholar] [CrossRef] [PubMed] [Green Version]
- Trott, O.; Olson, A.J. AutoDock Vina: Improving the speed and accuracy of docking with a new scoring function, efficient optimization and multithreading. J. Comput. Chem. 2010, 31, 455–461. [Google Scholar] [CrossRef] [Green Version]
- Sali, A.; Blundell, T.L. Comparative protein modelling by satisfaction of spatial restraints. J. Mol. Biol. 1993, 234, 779–815. [Google Scholar] [CrossRef]
- Knox, C.; Law, V.; Jewison, T.; Liu, P.; Ly, S.; Frolkis, A.; Pon, A.; Banco, K.; Mak, C.; Neveu, V.; et al. DrugBank 3.0: A comprehensive resource for “omics” research on drugs. Nucleic Acids Res. 2011, 39, D1035–D1041. [Google Scholar] [CrossRef] [Green Version]
- Krivák, R.; Hoksza, D. P2Rank: Machine learning based tool for rapid and accurate prediction of ligand binding sites from protein structure. J. Cheminformatics 2018, 10, 39. [Google Scholar] [CrossRef]
- O’Boyle, N.M.; Banck, M.; James, C.A.; Morley, C.; Vandermeersch, T.; Hutchison, G.R. Open Babel: An open chemical toolbox. J. Cheminformatics 2011, 3, 33. [Google Scholar] [CrossRef] [Green Version]
- Lecker, S.H.; Goldberg, A.L.; Mitch, W.E. Protein degradation by the ubiquitin-proteasome pathway in normal and disease states. J. Am. Soc. Nephrol. JASN 2006, 17, 1807–1819. [Google Scholar] [CrossRef]
- Gupta, I.; Aggarwal, S.; Singh, K.; Yadav, A.; Khan, S. Ubiquitin Proteasome pathway proteins as potential drug targets in parasite Trypanosoma cruzi. Sci. Rep. 2018, 8, 8399. [Google Scholar] [CrossRef]
- Bijlmakers, M.-J. Ubiquitination and the Proteasome as Drug Targets in Trypanosomatid Diseases. Front. Chem. 2020, 8, 630888. [Google Scholar] [CrossRef]
- de Diego, J.L.; Katz, J.M.; Marshall, P.; Gutiérrez, B.; Manning, J.E.; Nussenzweig, V.; González, J. The ubiquitin-proteasome pathway plays an essential role in proteolysis during Trypanosoma cruzi remodeling. Biochemistry 2001, 40, 1053–1062. [Google Scholar] [CrossRef]
- Rassi, A.; Luquetti, A.O.; Rassi, A.; Rassi, G.G.; Rassi, S.G.; DA Silva, I.G.; Rassi, A.G. Specific treatment for Trypanosoma cruzi: Lack of efficacy of allopurinol in the human chronic phase of Chagas disease. Am. J. Trop. Med. Hyg. 2007, 76, 58–61. [Google Scholar] [CrossRef] [Green Version]
- Lo Presti, M.S.; Bazán, P.C.; Strauss, M.; Báez, A.L.; Rivarola, H.W.; Paglini-Oliva, P.A. Trypanothione reductase inhibitors: Overview of the action of thioridazine in different stages of Chagas disease. Acta Trop. 2015, 145, 79–87. [Google Scholar] [CrossRef]
- D’Avila, H.; Toledo, D.A.M.; Melo, R.C.N. Lipid Bodies: Inflammatory Organelles Implicated in Host-Trypanosoma cruzi Interplay during Innate Immune Responses. Mediat. Inflamm. 2012, 2012, 1–11. [Google Scholar] [CrossRef] [Green Version]
- Buckner, F.S.; Bahia, M.T.; Suryadevara, P.K.; White, K.L.; Shackleford, D.M.; Chennamaneni, N.K.; Hulverson, M.A.; Laydbak, J.U.; Chatelain, E.; Scandale, I.; et al. Pharmacological Characterization, Structural Studies, and In Vivo Activities of Anti-Chagas Disease Lead Compounds Derived from Tipifarnib. Antimicrob. Agents Chemother. 2012, 56, 4914–4921. [Google Scholar] [CrossRef] [Green Version]
- Molina, I.; Gómez i Prat, J.; Salvador, F.; Treviño, B.; Sulleiro, E.; Serre, N.; Pou, D.; Roure, S.; Cabezos, J.; Valerio, L.; et al. Randomized Trial of Posaconazole and Benznidazole for Chronic Chagas’ Disease. N. Engl. J. Med. 2014, 370, 1899–1908. [Google Scholar] [CrossRef]
- Jackson, Y.; Alirol, E.; Getaz, L.; Wolff, H.; Combescure, C.; Chappuis, F. Tolerance and Safety of Nifurtimox in Patients with Chronic Chagas Disease. Clin. Infect. Dis. 2010, 51, e69–e75. [Google Scholar] [CrossRef] [PubMed] [Green Version]
- Pinazo, M.-J.; Muñoz, J.; Posada, E.; López-Chejade, P.; Gállego, M.; Ayala, E.; del Cacho, E.; Soy, D.; Gascon, J. Tolerance of Benznidazole in Treatment of Chagas’ Disease in Adults. Antimicrob. Agents Chemother. 2010, 54, 4896–4899. [Google Scholar] [CrossRef] [Green Version]
- Apt, W.; Arribada, A.; Zulantay, I.; Rodriguez, J.; Saavedra, M.; Munoz, A. Treatment of Chagas’ disease with itraconazole: Electrocardiographic and parasitological conditions after 20 years of follow-up. J. Antimicrob. Chemother. 2013, 68, 2164–2169. [Google Scholar] [CrossRef]
- Coura, J.R.; Borges-Pereira, J. Chagas disease. What is known and what should be improved: A systemic review. Rev. Soc. Bras. Med. Trop. 2012, 45, 286–296. [Google Scholar] [CrossRef]
- Moraes, C.B.; Giardini, M.A.; Kim, H.; Franco, C.H.; Araujo-Junior, A.M.; Schenkman, S.; Chatelain, E.; Freitas-Junior, L.H. Nitroheterocyclic compounds are more efficacious than CYP51 inhibitors against Trypanosoma cruzi: Implications for Chagas disease drug discovery and development. Sci. Rep. 2014, 4, 4703. [Google Scholar] [CrossRef] [PubMed] [Green Version]
- Pinto, A.V.; de Castro, S.L. The trypanocidal activity of naphthoquinones: A review. Mol. Basel Switz. 2009, 14, 4570–4590. [Google Scholar] [CrossRef]
- da Silva Santos-Júnior, P.F.; Schmitt, M.; de Araújo-Júnior, J.X.; da Silva-Júnior, E.F. Sterol 14α-Demethylase from Trypanosomatidae Parasites as a Promising Target for Designing New Antiparasitic Agents. Curr. Top. Med. Chem. 2021, 21, 1900–1921. [Google Scholar] [CrossRef]
- Cotuá, J.; LLinás, H.; Cotes, S. Virtual Screening Based on QSAR and Molecular Docking of Possible Inhibitors Targeting Chagas CYP51. J. Chem. 2021, 2021, e6640624. [Google Scholar] [CrossRef]
- AlphaFold Protein Structure Database. Available online: https://alphafold.ebi.ac.uk/ (accessed on 16 September 2022).
- León-Del-Río, A. Biotin in metabolism, gene expression, and human disease. J. Inherit. Metab. Dis. 2019, 42, 647–654. [Google Scholar] [CrossRef]
- Pendini, N.R.; Bailey, L.M.; Booker, G.W.; Wilce, M.C.J.; Wallace, J.C.; Polyak, S.W. Biotin protein ligase from Candida albicans: Expression, purification and development of a novel assay. Arch. Biochem. Biophys. 2008, 479, 163–169. [Google Scholar] [CrossRef]
- Häberle, J.; Görg, B.; Rutsch, F.; Schmidt, E.; Toutain, A.; Benoist, J.-F.; Gelot, A.; Suc, A.-L.; Höhne, W.; Schliess, F.; et al. Congenital glutamine deficiency with glutamine synthetase mutations. N. Engl. J. Med. 2005, 353, 1926–1933. [Google Scholar] [CrossRef] [Green Version]
- Morris, C.R.; Hamilton-Reeves, J.; Martindale, R.G.; Sarav, M.; Ochoa Gautier, J.B. Acquired Amino Acid Deficiencies: A Focus on Arginine and Glutamine. Nutr. Clin. Pract. Off. Publ. Am. Soc. Parenter. Enter. Nutr. 2017, 32, 30S–47S. [Google Scholar] [CrossRef] [Green Version]
- Viotti, R.; Vigliano, C.; Lococo, B.; Alvarez, M.G.; Petti, M.; Bertocchi, G.; Armenti, A. Side effects of benznidazole as treatment in chronic Chagas disease: Fears and realities. Expert Rev. Anti Infect. Ther. 2009, 7, 157–163. [Google Scholar] [CrossRef]
- Desai, C. Meyler’s side effects of drugs: The international encyclopedia of adverse drug reactions and interactions. Indian J. Pharmacol. 2016, 48, 224. [Google Scholar]
- Álvarez, M.G.; Vigliano, C.; Lococo, B.; Bertocchi, G.; Viotti, R. Prevention of congenital Chagas disease by Benznidazole treatment in reproductive-age women. An observational study. Acta Trop. 2017, 174, 149–152. [Google Scholar] [CrossRef] [PubMed]
- Komoto, J.; Yamada, T.; Watanabe, K.; Takusagawa, F. Crystal structure of human prostaglandin F synthase (AKR1C3). Biochemistry 2004, 43, 2188–2198. [Google Scholar] [CrossRef] [PubMed]
- Qin, K.N.; New, M.I.; Cheng, K.C. Molecular cloning of multiple cDNAs encoding human enzymes structurally related to 3 alpha-hydroxysteroid dehydrogenase. J. Steroid Biochem. Mol. Biol. 1993, 46, 673–679. [Google Scholar] [CrossRef]
- Bresson, E.; Boucher-Kovalik, S.; Chapdelaine, P.; Madore, E.; Harvey, N.; Laberge, P.Y.; Leboeuf, M.; Fortier, M.A. The human aldose reductase AKR1B1 qualifies as the primary prostaglandin F synthase in the endometrium. J. Clin. Endocrinol. Metab. 2011, 96, 210–219. [Google Scholar] [CrossRef] [Green Version]
- Kubata, B.K.; Kabututu, Z.; Nozaki, T.; Munday, C.J.; Fukuzumi, S.; Ohkubo, K.; Lazarus, M.; Maruyama, T.; Martin, S.K.; Duszenko, M.; et al. A key role for old yellow enzyme in the metabolism of drugs by Trypanosoma cruzi. J. Exp. Med. 2002, 196, 1241–1251. [Google Scholar] [CrossRef] [Green Version]
- Andrade, H.M.; Murta, S.M.F.; Chapeaurouge, A.; Perales, J.; Nirdé, P.; Romanha, A.J. Proteomic analysis of Trypanosoma cruzi resistance to Benznidazole. J. Proteome Res. 2008, 7, 2357–2367. [Google Scholar] [CrossRef]
- Murta, S.M.F.; Krieger, M.A.; Montenegro, L.R.; Campos, F.F.M.; Probst, C.M.; Avila, A.R.; Muto, N.H.; de Oliveira, R.C.; Nunes, L.R.; Nirdé, P.; et al. Deletion of copies of the gene encoding old yellow enzyme (TcOYE), a NAD(P)H flavin oxidoreductase, associates with in vitro-induced benznidazole resistance in Trypanosoma cruzi. Mol. Biochem. Parasitol. 2006, 146, 151–162. [Google Scholar] [CrossRef]
- Arnal, A.; Villanueva-Lizama, L.; Teh-Poot, C.; Herrera, C.; Dumonteil, E. Extent of polymorphism and selection pressure on the Trypanosoma cruzi vaccine candidate antigen Tc24. Evol. Appl. 2020, 13, 2663–2672. [Google Scholar] [CrossRef]
- Varadi, M.; Anyango, S.; Deshpande, M.; Nair, S.; Natassia, C.; Yordanova, G.; Yuan, D.; Stroe, O.; Wood, G.; Laydon, A.; et al. AlphaFold Protein Structure Database: Massively expanding the structural coverage of protein-sequence space with high-accuracy models. Nucleic Acids Res. 2022, 50, D439–D444. [Google Scholar] [CrossRef]
- Irwin, J.J.; Shoichet, B.K. ZINC—A Free Database of Commercially Available Compounds for Virtual Screening. J. Chem. Inf. Model. 2005, 45, 177–182. [Google Scholar] [CrossRef]
- Watts, D.J.; Strogatz, S.H. Collective dynamics of “small-world” networks. Nature 1998, 393, 440–442. [Google Scholar] [CrossRef] [PubMed]
- de Silva, E.; Stumpf, M.P.H. Complex networks and simple models in biology. J. R. Soc. Interface 2005, 2, 419–430. [Google Scholar] [CrossRef] [PubMed] [Green Version]
- Ravasz, E.; Somera, A.L.; Mongru, D.A.; Oltvai, Z.N.; Barabási, A.-L. Hierarchical Organization of Modularity in Metabolic Networks. Science 2002, 297, 1551–1555. [Google Scholar] [CrossRef] [PubMed] [Green Version]
- Barrat, A.; Barthélemy, M.; Pastor-Satorras, R.; Vespignani, A. The architecture of complex weighted networks. Proc. Natl. Acad. Sci. USA 2004, 101, 3747–3752. [Google Scholar] [CrossRef] [Green Version]
- Assenov, Y.; Ramírez, F.; Schelhorn, S.-E.; Lengauer, T.; Albrecht, M. Computing topological parameters of biological networks. Bioinform. Oxf. Engl. 2008, 24, 282–284. [Google Scholar] [CrossRef] [PubMed] [Green Version]
- Gao, Z.; Li, H.; Zhang, H.; Liu, X.; Kang, L.; Luo, X.; Zhu, W.; Chen, K.; Wang, X.; Jiang, H. PDTD: A web-accessible protein database for drug target identification. BMC Bioinform. 2008, 9, 104. [Google Scholar] [CrossRef] [PubMed] [Green Version]
- Hui-fang, L.; Qing, S.; Jian, Z.; Wei, F. Evaluation of various inverse docking schemes in multiple targets identification. J. Mol. Graph. Model. 2010, 29, 326–330. [Google Scholar] [CrossRef]
- Lee, M.; Kim, D. Large-scale reverse docking profiles and their applications. BMC Bioinform. 2012, 13, S6. [Google Scholar] [CrossRef] [Green Version]
- Hopkins, A.L. Network pharmacology: The next paradigm in drug discovery. Nat. Chem. Biol. 2008, 4, 682–690. [Google Scholar] [CrossRef]
- Rawal, K.; Singh, P.; Sinha, R.; Ridhima; Preeti, P.; Nath, S.K.; Kumari, P.; Sahai, S.; Garg, N.; Sharma, T.; et al. COV-DOCK server: A web server for COVID-19 ligand-target docking. OSF Preprints 2021. [Google Scholar] [CrossRef]
- Voss, M.; Lorenz, N.I.; Luger, A.-L.; Steinbach, J.P.; Rieger, J.; Ronellenfitsch, M.W. Rescue of 2-Deoxyglucose Side Effects by Ketogenic Diet. Int. J. Mol. Sci. 2018, 19, 2462. [Google Scholar] [CrossRef] [PubMed] [Green Version]
- Gandara, D.R.; Perez, E.A.; Weibe, V.; De Gregorio, M.W. Cisplatin chemoprotection and rescue: Pharmacologic modulation of toxicity. Semin Oncol 1991, 18, 49–55. [Google Scholar]
- Díaz-Chiguer, D.L.; Márquez-Navarro, A.; Nogueda-Torres, B.; de la Luz León-Ávila, G.; Pérez-Villanueva, J.; Hernández-Campos, A.; Castillo, R.; Ambrosio, J.R.; Nieto-Meneses, R.; Yépez-Mulia, L.; et al. In vitro and in vivo trypanocidal activity of some benzimidazole derivatives against two strains of Trypanosoma cruzi. Acta Trop. 2012, 122, 108–112. [Google Scholar] [CrossRef] [PubMed]
- Woolley, D.W. Some Biological Effects Produced By Benzimidazole And Their Reversal By Purines. J. Biol. Chem. 1944, 152, 225–232. [Google Scholar] [CrossRef]
- de VC Sinatti, V.; Baptista, L.P.R.; Alves-Ferreira, M.; Dardenne, L.; da Silva, J.H.M.; Guimarães, A.C. In silico identification of inhibitors of ribose 5-phosphate isomerase from Trypanosoma cruzi using ligand and structure based approaches. J. Mol. Graph. Model. 2017, 77, 168–180. [Google Scholar] [CrossRef] [PubMed]
- Loureiro, I.; Faria, J.; Clayton, C.; Macedo-Ribeiro, S.; Santarém, N.; Roy, N.; Cordeiro-da-Siva, A.; Tavares, J. Ribose 5-Phosphate Isomerase B Knockdown Compromises Trypanosoma brucei Bloodstream Form Infectivity. PLoS Negl. Trop. Dis. 2015, 9, e3430. [Google Scholar] [CrossRef] [PubMed] [Green Version]
- Larkin, M.A.; Blackshields, G.; Brown, N.P.; Chenna, R.; McGettigan, P.A.; McWilliam, H.; Valentin, F.; Wallace, I.M.; Wilm, A.; Lopez, R.; et al. Clustal W and Clustal X version 2.0. Bioinformatics 2007, 23, 2947–2948. [Google Scholar] [CrossRef] [PubMed] [Green Version]
- Faria, J.; Loureiro, I.; Santarém, N.; Cecílio, P.; Macedo-Ribeiro, S.; Tavares, J.; Cordeiro-da-Silva, A. Disclosing the essentiality of ribose-5-phosphate isomerase B in Trypanosomatids. Sci. Rep. 2016, 6, 26937. [Google Scholar] [CrossRef] [Green Version]
- Bethony, J.M.; Cole, R.N.; Guo, X.; Kamhawi, S.; Lightowlers, M.W.; Loukas, A.; Petri, W.; Reed, S.; Valenzuela, J.G.; Hotez, P.J. Vaccines to combat the neglected tropical diseases. Immunol. Rev. 2011, 239, 237–270. [Google Scholar] [CrossRef] [Green Version]
- Querec, T.D.; Akondy, R.S.; Lee, E.K.; Cao, W.; Nakaya, H.I.; Teuwen, D.; Pirani, A.; Gernert, K.; Deng, J.; Marzolf, B.; et al. Systems biology approach predicts immunogenicity of the yellow fever vaccine in humans. Nat. Immunol. 2009, 10, 116–125. [Google Scholar] [CrossRef] [PubMed] [Green Version]
- Nakaya, H.I.; Wrammert, J.; Lee, E.K.; Racioppi, L.; Marie-Kunze, S.; Haining, W.N.; Means, A.R.; Kasturi, S.P.; Khan, N.; Li, G.-M.; et al. Systems biology of vaccination for seasonal influenza in humans. Nat. Immunol. 2011, 12, 786–795. [Google Scholar] [CrossRef] [PubMed]
- Li, S.; Rouphael, N.; Duraisingham, S.; Romero-Steiner, S.; Presnell, S.; Davis, C.; Schmidt, D.S.; Johnson, S.E.; Milton, A.; Rajam, G.; et al. Molecular signatures of antibody responses derived from a systems biology study of five human vaccines. Nat. Immunol. 2014, 15, 195–204. [Google Scholar] [CrossRef] [PubMed] [Green Version]
- Xu, X.; Olson, C.L.; Engman, D.M.; Ames, J.B. NMR structure of the calflagin Tb24 flagellar calcium binding protein of Trypanosoma brucei: NMR Structure of Calflagin Tb24. Protein Sci. 2012, 21, 1942–1947. [Google Scholar] [CrossRef] [PubMed] [Green Version]
- Versteeg, L.; Adhikari, R.; Poveda, C.; Villar-Mondragon, M.J.; Jones, K.M.; Hotez, P.J.; Bottazzi, M.E.; Tijhaar, E.; Pollet, J. Location and expression kinetics of Tc24 in different life stages of Trypanosoma cruzi. PLoS Negl. Trop. Dis. 2021, 15, e0009689. [Google Scholar] [CrossRef]
- Díaz-Viraqué, F.; Chiribao, M.L.; Trochine, A.; González-Herrera, F.; Castillo, C.; Liempi, A.; Kemmerling, U.; Maya, J.D.; Robello, C. Old Yellow Enzyme from Trypanosoma cruzi Exhibits In Vivo Prostaglandin F2α Synthase Activity and Has a Key Role in Parasite Infection and Drug Susceptibility. Front. Immunol. 2018, 9, 456. [Google Scholar] [CrossRef]


Disclaimer/Publisher’s Note: The statements, opinions and data contained in all publications are solely those of the individual author(s) and contributor(s) and not of MDPI and/or the editor(s). MDPI and/or the editor(s) disclaim responsibility for any injury to people or property resulting from any ideas, methods, instructions or products referred to in the content. |
© 2023 by the authors. Licensee MDPI, Basel, Switzerland. This article is an open access article distributed under the terms and conditions of the Creative Commons Attribution (CC BY) license (https://creativecommons.org/licenses/by/4.0/).
Share and Cite
Nath, S.K.; Pankajakshan, P.; Sharma, T.; Kumari, P.; Shinde, S.; Garg, N.; Mathur, K.; Arambam, N.; Harjani, D.; Raj, M.; et al. A Data-Driven Approach to Construct a Molecular Map of Trypanosoma cruzi to Identify Drugs and Vaccine Targets. Vaccines 2023, 11, 267. https://0-doi-org.brum.beds.ac.uk/10.3390/vaccines11020267
Nath SK, Pankajakshan P, Sharma T, Kumari P, Shinde S, Garg N, Mathur K, Arambam N, Harjani D, Raj M, et al. A Data-Driven Approach to Construct a Molecular Map of Trypanosoma cruzi to Identify Drugs and Vaccine Targets. Vaccines. 2023; 11(2):267. https://0-doi-org.brum.beds.ac.uk/10.3390/vaccines11020267
Chicago/Turabian StyleNath, Swarsat Kaushik, Preeti Pankajakshan, Trapti Sharma, Priya Kumari, Sweety Shinde, Nikita Garg, Kartavya Mathur, Nevidita Arambam, Divyank Harjani, Manpriya Raj, and et al. 2023. "A Data-Driven Approach to Construct a Molecular Map of Trypanosoma cruzi to Identify Drugs and Vaccine Targets" Vaccines 11, no. 2: 267. https://0-doi-org.brum.beds.ac.uk/10.3390/vaccines11020267